
Physik Invest’s Daily Brief is read by thousands of subscribers. You, too, can join this community to learn about the fundamental and technical drivers of markets.
Administrative
Hey team, hope you had a great week! Please consider reading our letters for January 3 and 4. In those letters, we discussed the potential drivers of long-lasting inflation that may not be good for traditional portfolio constructions like 60/40.
In today’s letter, we talk about some positioning contexts, leaning into this letter writer’s interview with The Ambrus Group’s Kris Sidial for a Benzinga article to be published either this weekend or next week.
This letter will serve as a primer. Next week, we will go into further depth. Have a great weekend!
Positioning
In a conversation with your letter writer prior to 2022, and on YouTube, Sidial and some other Ambrus members said markets were increasingly fragile and traditional portfolio constructions such as 60/40 (i.e., 60% of holdings held in stocks and 40% of the holdings held in bonds) would not perform as well as history would imply.
Instead, options (colloquially referred to as volatility) may “potentially outperform the market” and limit losses.
Pursuant to Ambrus’ warnings, 60/40 logged one of its worst stretches as inflation and interest rates rose. On the other hand, Ambrus, which is a volatility arbitrage fund, managed to end the year unscathed.
“That does not mean all volatility funds ended the same way,” Sidial said in a nod to his team’s unique approach to leveraging options’ multi-dimensionality in reducing the cost of protection they own for investors.
Here’s more on Ambrus’ approach from a previous conversation your letter writer had with Sidial for a Benzinga article.
This approach is limiting, though, Sidial notes. Increasing assets under management can eat into the firm’s own alpha.
Anyways, Sidial went on to discuss the performance of volatility in 2022 and its potential to outperform in 2023 and beyond.
“It caught everybody by surprise that long volatility underperformed,” he said in reference to a high spot-vol beta (i.e., volatility’s sensitivity to underlying prices) in 2021 suggesting volatility was likely to come to life in 2022, and “there would be more follow-through.”
However, there was no follow-through, and Sidial believes this was the result of allocations to commodity trading advisors or CTAs, and the “consensus trade,” or the sales of volatility on expectations markets would grind and chop lower for the entirety of 2022.
As this letter has put forth in the past, traders proactively hedged heading into 2022. The unwind or supply of some of these hedges, coupled with investors’ expectation markets would continue to grind far lower, prompted more volatility sales (a pressure on options prices), masked by the persistently high, albeit tame Cboe Volatility Index (INDEX: VIX) and metrics like the put-to-call ratio appearing inflated, potentially the result of stock loan desks replacing short stock with in-the-money puts given high-interest rates.
Though the price of volatility could move toward the extremes (i.e., clustering/mean-reverting), trends may be near exhaustion.
Naive measures like the VVIX, which is the volatility of the VIX (i.e., the volatility of the S&P 500 volatility), are printing at levels last seen in 2017. This suggests “we can get cheap exposure to convexity while a lot of people are worried.”
Therefore, “even if inflation continues, the rate at which inflation rises won’t be the same. Due to this, CTA exposures likely will not perform as well as they did in 2022, and that’s why you may see more opportunities in the volatility space.”
Moving on, though not catalysts or reasons for Ambrus to initiate trades per se, risks Sidial said could result in volatility performing well include the concentration of market makers and private markets’ sourcing of liquidity (or raising cash) through sales of public equity markets.
“During moments of market stress, the market makers are unable to keep up with the demands of frenetic investors. If you think of GameStop Corp (NYSE: GME), which we talked about before, there was this reflexive dynamic that happened when investors rushed into the stock one way.”
“That same dynamic can happen on the way down”; market makers mark up volatility during stress which can pressure markets. As the price of volatility rises, option deltas rise and this prompts bearish vanna hedging flows, as they are called.
Your letter writer will pause the commentary at this point while he further unpacks his discussion with Sidial, but at least you got a sneak peek ahead of next week’s article release. Take care!
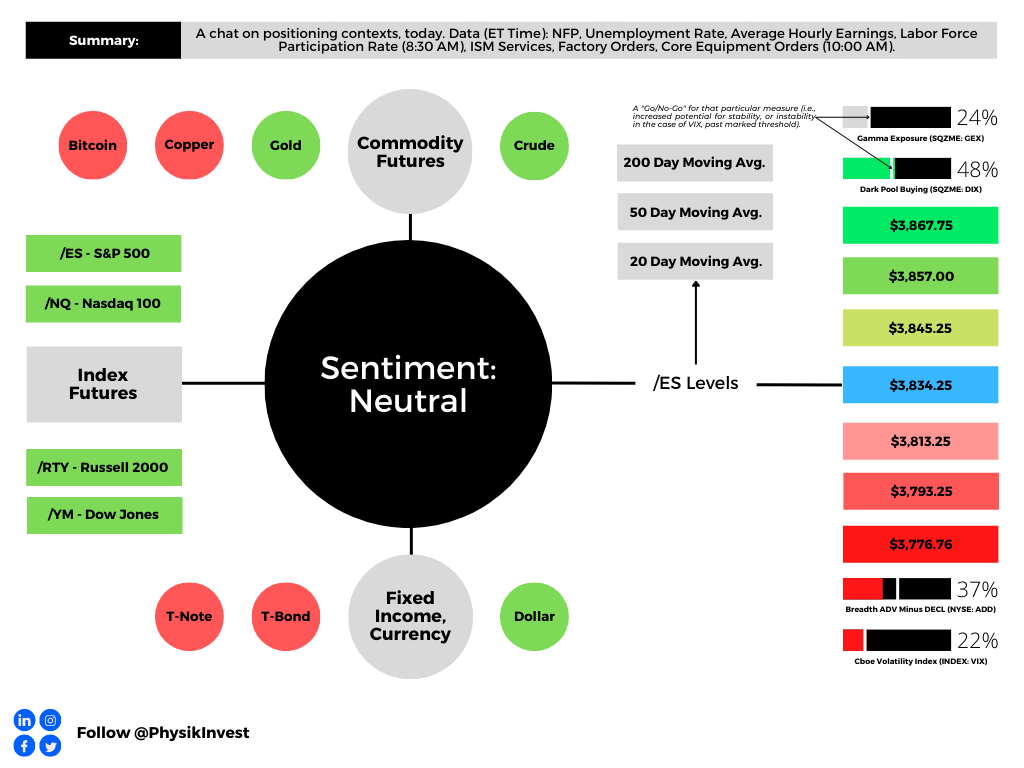
Technical
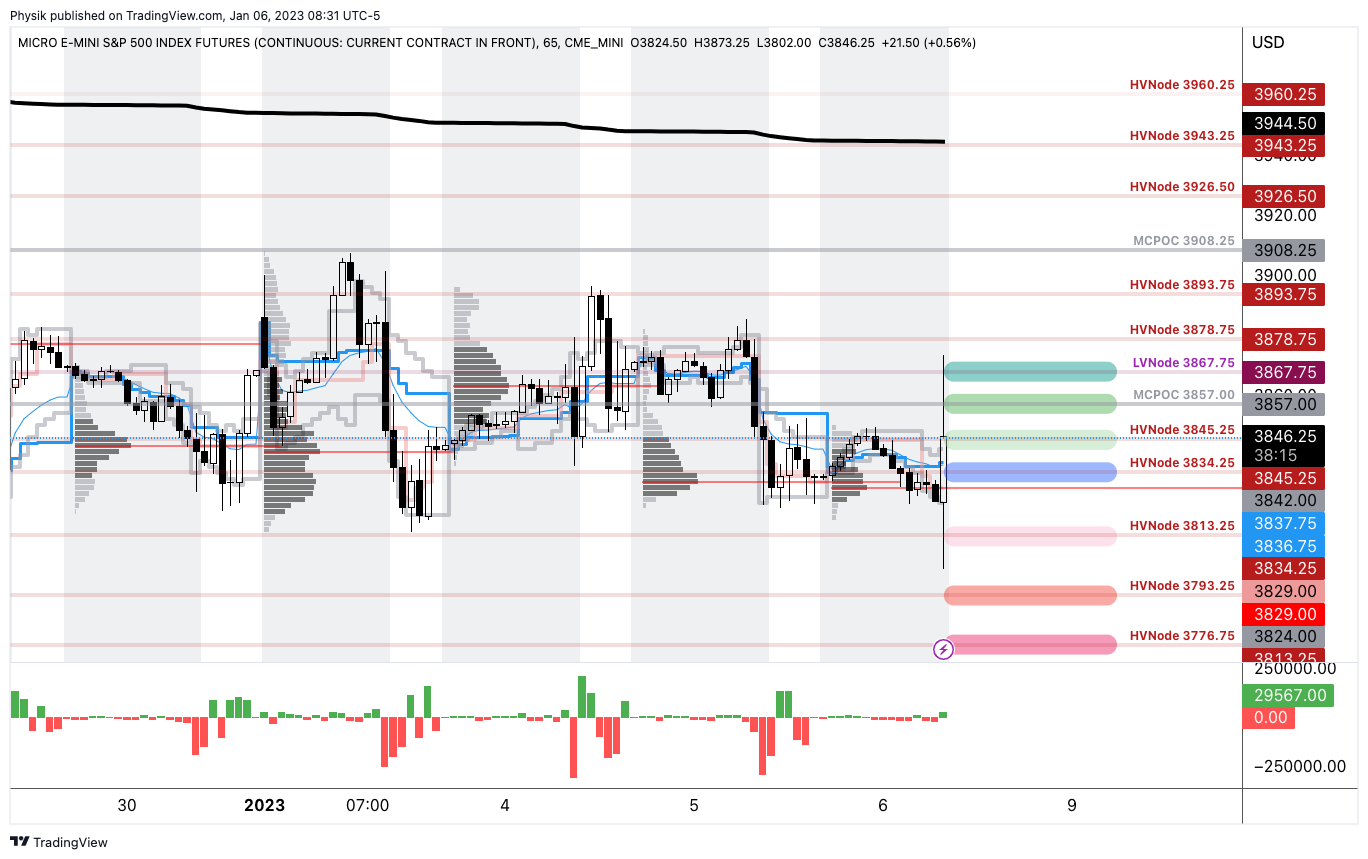
As of 8:30 AM ET, Friday’s regular session (9:30 AM – 4:00 PM ET), in the S&P 500, is likely to open in the middle part of a balanced overnight inventory, inside of prior-range and -value, suggesting a limited potential for immediate directional opportunity.
Our S&P 500 pivot for today is $3,834.25.
Key levels to the upside include $3,845.25, $3,857.00, and $3,867.75.
Key levels to the downside include $3,813.25, $3,793.25, and $3,776.75.
Click here to load today’s key levels into the web-based TradingView platform. All levels are derived using the 65-minute timeframe. New links are produced, daily.
Note that early morning news may result in quoted levels not performing well. Please make sure to use the link to view the real-time chart for more levels that may be in play.
Definitions
Volume Areas: Markets will build on areas of high-volume (HVNodes). Should the market trend for long periods of time, it will be identified by low-volume areas (LVNodes). LVNodes denote directional conviction and ought to offer support on any test.
If participants auction and find acceptance in an area of a prior LVNode, then future discovery ought to be volatile and quick as participants look to HVNodes for favorable entry or exit.
MCPOCs: Denote areas where two-sided trade was most prevalent over numerous sessions. Participants will respond to future tests of value as they offer favorable entry and exit.
About
In short, an economics graduate working in finance and journalism.
Capelj spends most of his time as the founder of Physik Invest through which he invests and publishes daily analyses to subscribers, some of whom represent well-known institutions.
Separately, Capelj is an equity options analyst at SpotGamma and an accredited journalist interviewing global leaders in business, government, and finance.
Past works include conversations with investor Kevin O’Leary, ARK Invest’s Catherine Wood, FTX’s Sam Bankman-Fried, Lithuania’s Minister of Economy and Innovation Aušrinė Armonaitė, former Cisco chairman and CEO John Chambers, and persons at the Clinton Global Initiative.
Contact
Direct queries to renato@physikinvest.com or Renato Capelj#8625 on Discord.
Calendar
You may view this letter’s content calendar at this link.
Disclaimer
Do not construe this newsletter as advice. All content is for informational purposes.


