Physik Invest’s Daily Brief is read by thousands of subscribers. You, too, can join this community to learn about the fundamental and technical drivers of markets.
Administrative
A bit late as your letter writer is getting ready to travel. Sorry and have a great Friday!
Fundamental
Thursday’s inflation update was as expected.
The Consumer Price Index (CPI) saw a 6.5% rise year-over-year (YoY) and a 0.1% fall month-over-month (MoM). Core CPI was +5.7% YoY and +0.3% MoM.
In his post-CPI analysis, Andreas Steno Larsen said inflation has mostly disappeared, and, if we cut shelter costs, which are outdated, “deflation on a quarterly and monthly basis is here.”
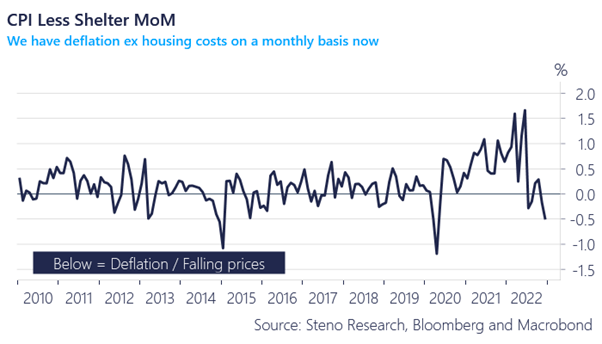
The Federal Reserve’s (Fed) “favored statistical measures for underlying inflationary pressure all confirm a decline,” added Bloomberg’s John Authers.
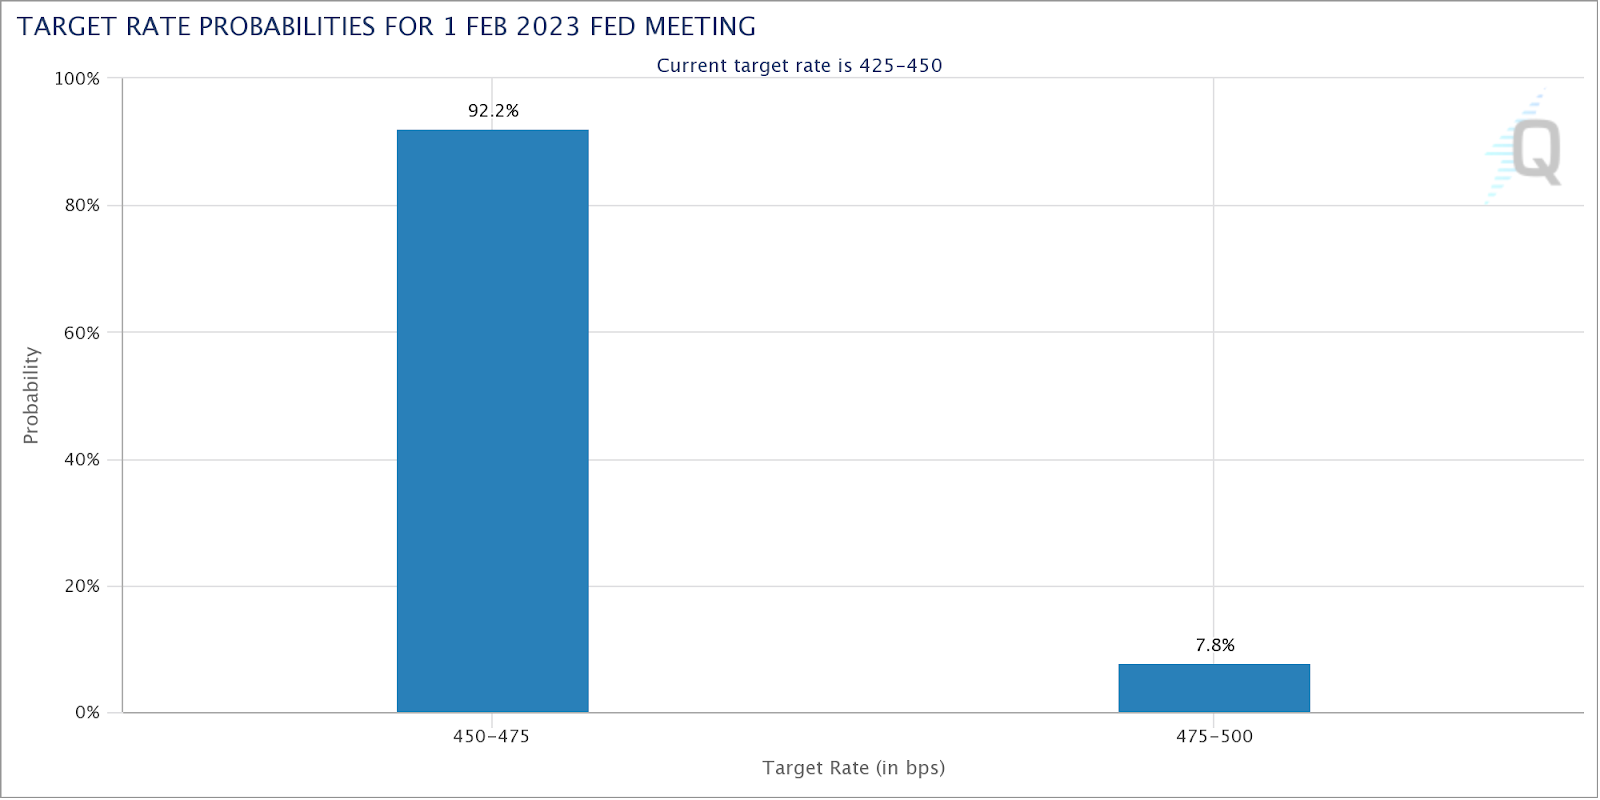
“Prices are beginning to behave more as central bankers would wish,” paving the way to a downshift in tightening, as is priced by the markets. Using the CME Group Inc’s (NASDAQ: CME) FedWatch Tool, traders were split, and the odds of a 25 or 50 basis point hike were more even prior to CPI.
The odds are now skewed toward a 25 basis point hike.
Despite the odds of a less aggressive hike – yields falling and swaps suggesting the Fed could skip a hike in March – and the impact that has on valuing businesses (e.g., firm profits worth less at higher interest rates hence the de-rate of 2022), the data suggests that “inflation spikes have never been vanquished until the federal funds rate exceeds the inflation rate,” and, with the return in deflation, Steno Larsen said, the outlook for stocks remains poor.
“Remember that the PPI (and the CPI for that matter) is a leading indicator for EPS.” Consequently, “we are in for negative EPS.”
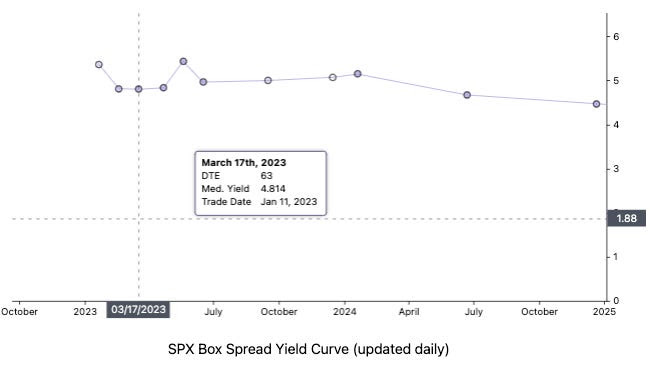
If you’re not an active trader and unable to participate in both the up- and down-side of markets, then you may capitalize on higher interest rates with Treasury bills or Box Spreads, which allow you to create loan structures similar to a Treasury bill. Upon the spread’s maturity, it settles and earns a competitive interest rate.
If you’re an active trader, as I said to one subscriber privately, “the more depressed technology names to the upside for debits [were] attractive” (i.e., buying call option structures in the likes of Tesla and Amazon).
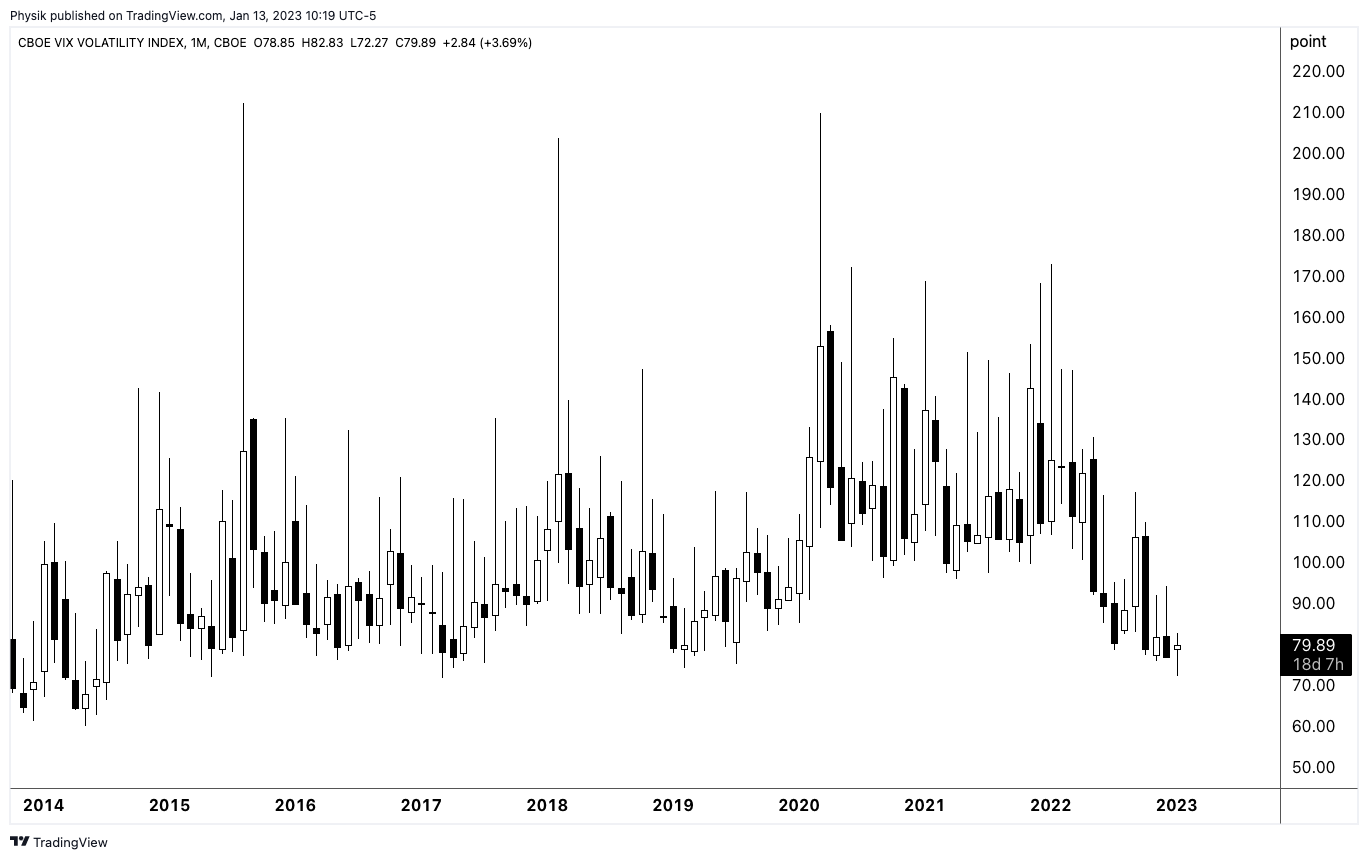
This is while put structures you may monetize in case of a large repricing in volatility have kept their values well amid what appears to be a shift higher in the skew; in the past days, we talked about measures including the Cboe VIX Volatility (INDEX: VVIX) printing at historic levels.
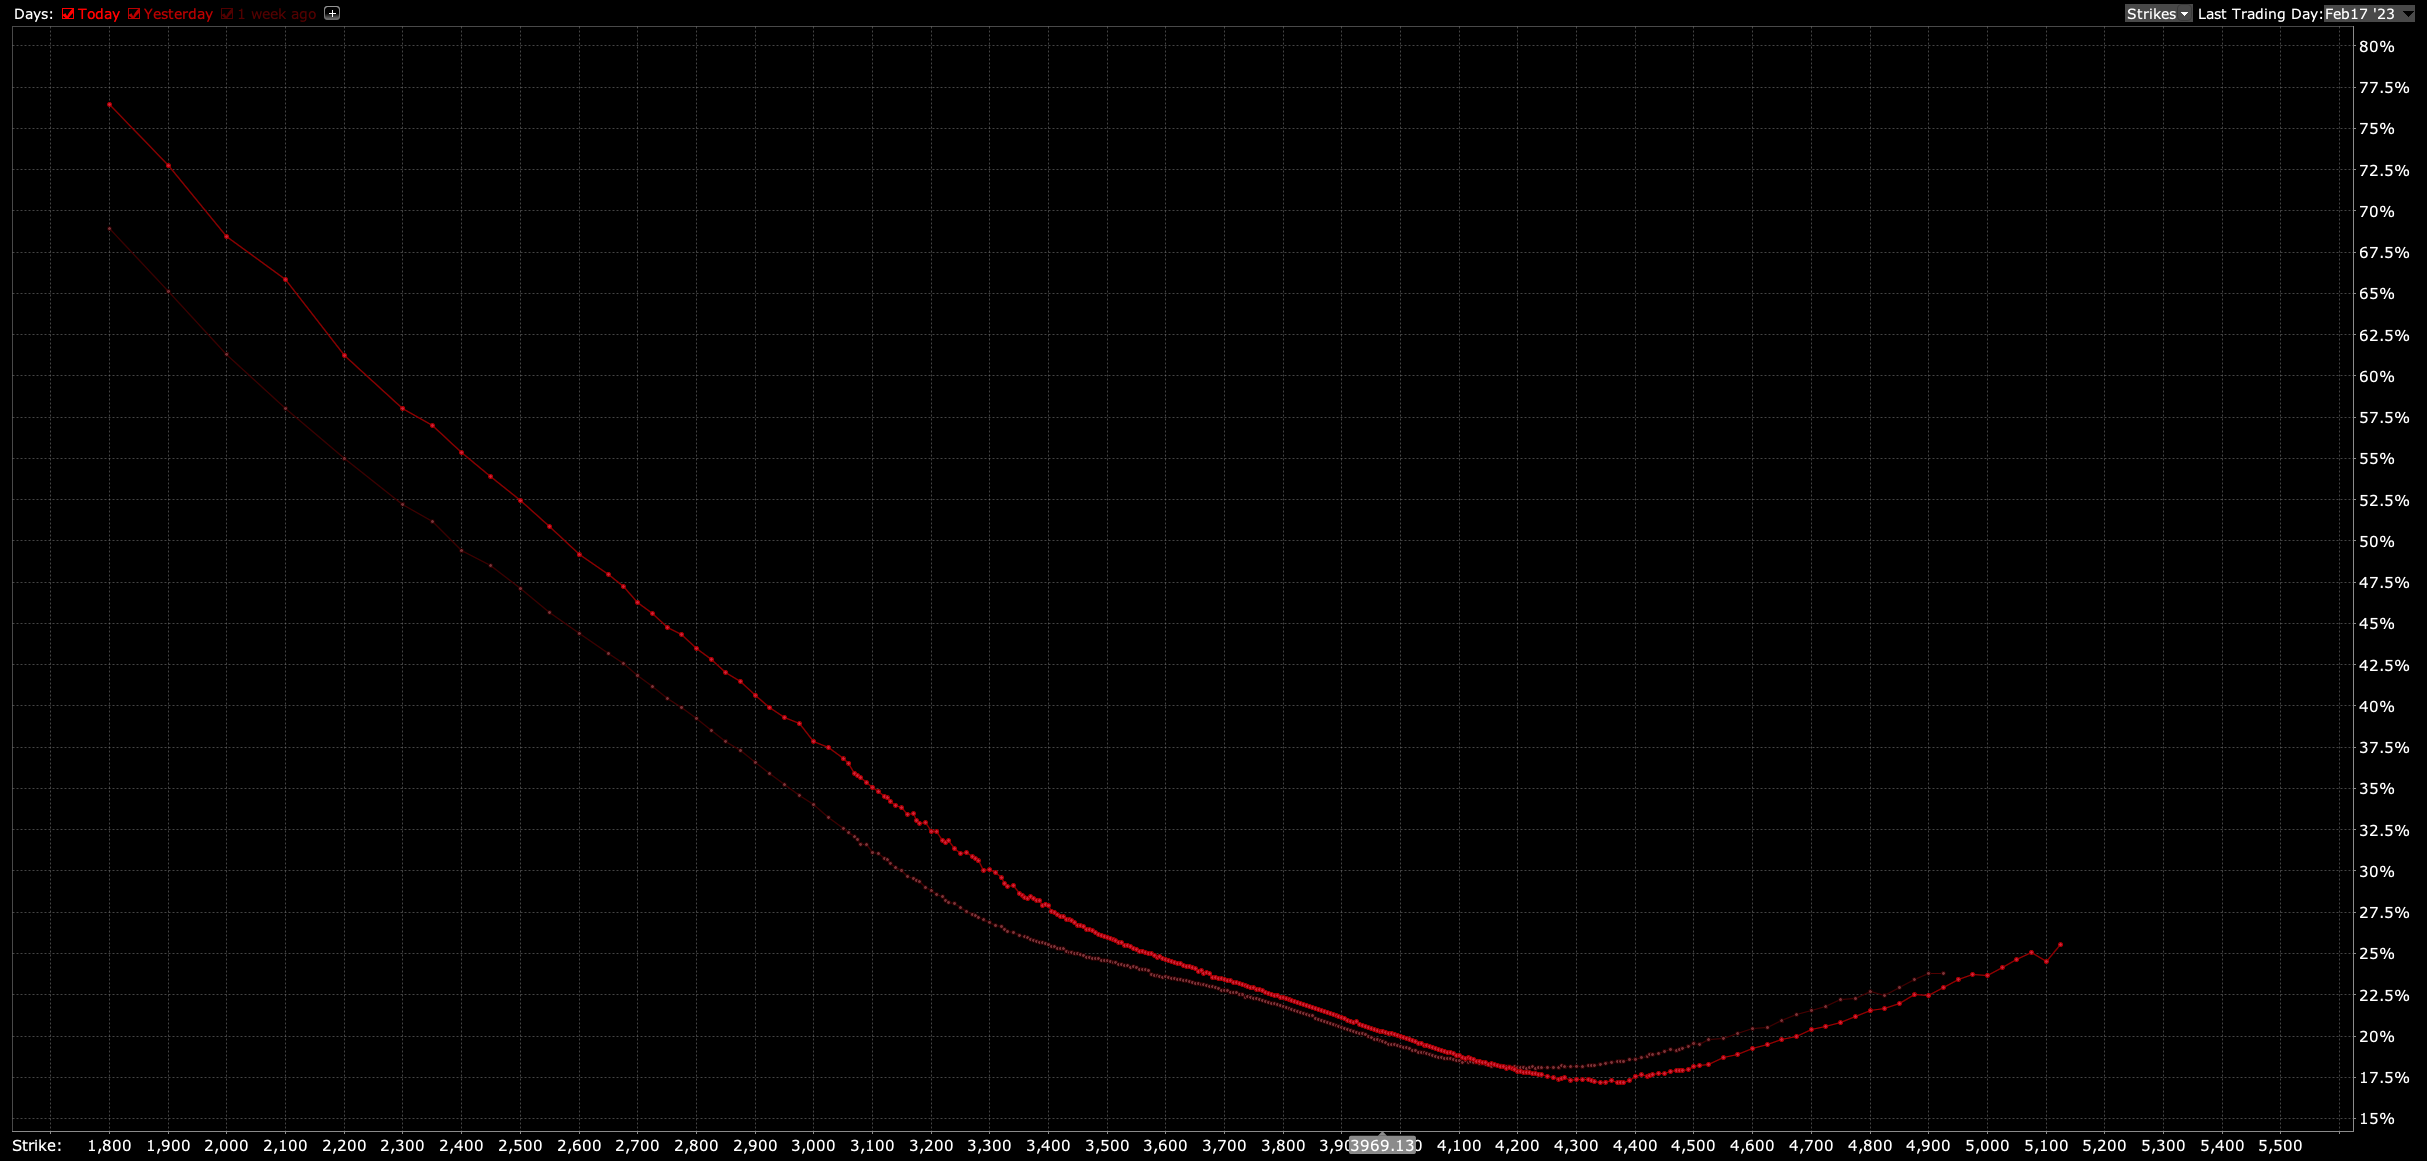
Measures like the VVIX suggests “we can get cheap exposure to convexity while a lot of people are worried,” as The Ambrus Group’s Kris Sidial said in one article. Though volatility can be bimodal (i.e., stay low for longer for lack of better phrasing), from a “risk-to-reward perspective, … it’s a better bet to be on the long volatility side,” given “that there are so many things that … keep popping up” from a macro perspective.

Technical
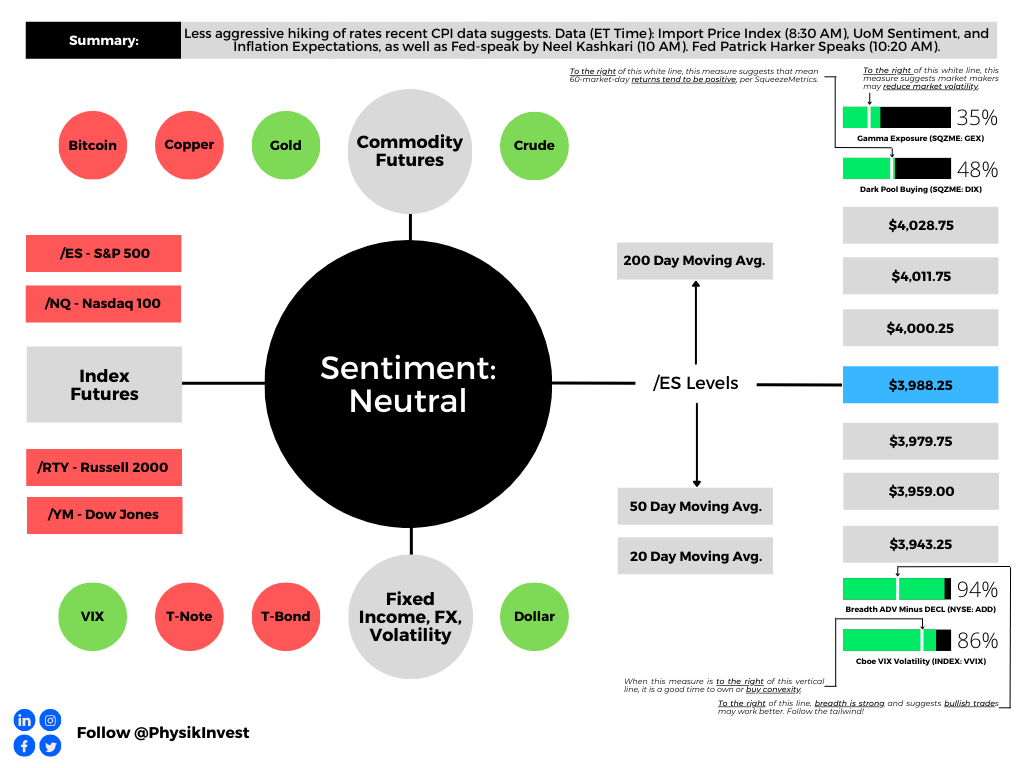
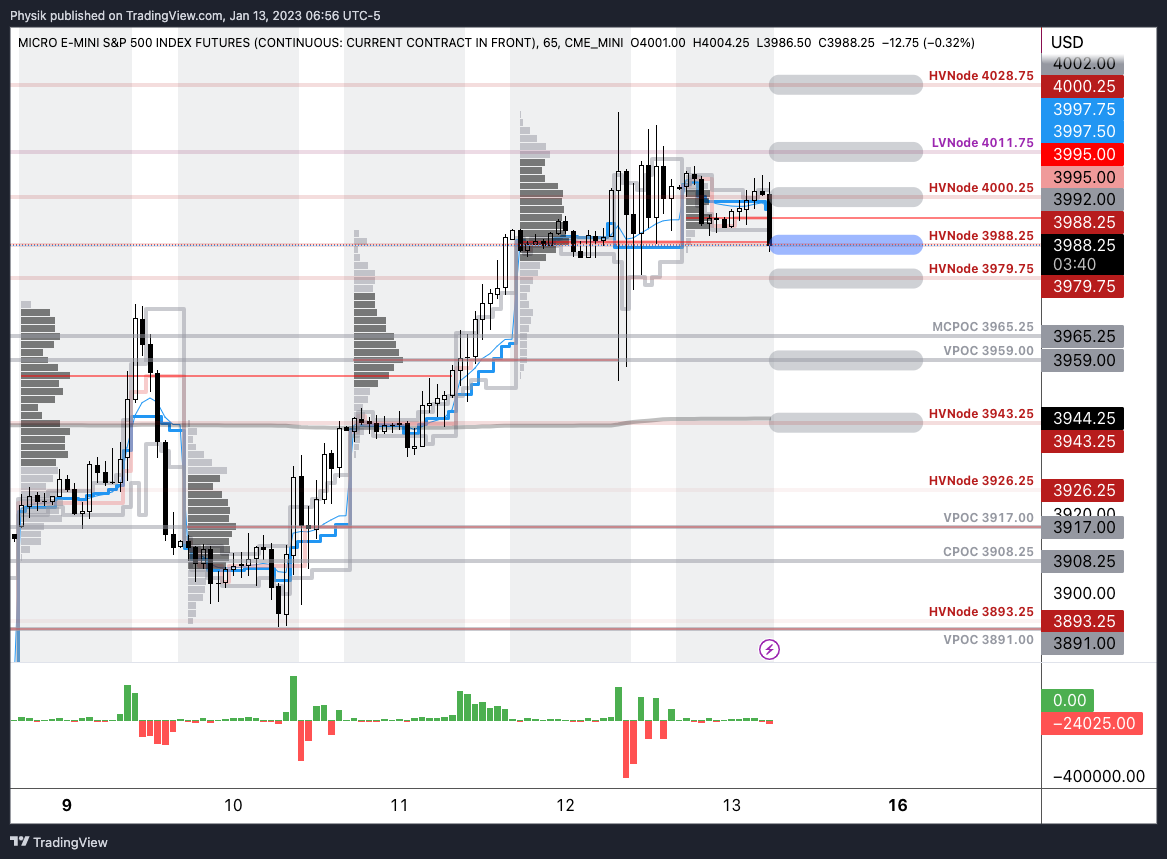
As of 7:00 AM ET, Friday’s regular session (9:30 AM – 4:00 PM ET), in the S&P 500, is likely to open in the lower part of a negatively skewed overnight inventory, inside of prior-range and -value, suggesting a limited potential for immediate directional opportunity.
Our S&P 500 pivot for today is $3,988.25 HVNode.
Key levels to the upside include $4,000.25, $4,011.75, and $4,028.75.
Key levels to the downside include $3,979.75, $3,959.00, and $3,943.25.
Click here to load today’s key levels into the web-based TradingView platform. All levels are derived using the 65-minute timeframe. New links are produced, daily.
As a disclaimer, the S&P 500 could trade beyond the levels quoted in the letter. Therefore, you should load the above link on your browser for more relevant levels.
Definitions
Volume Areas: Markets will build on areas of high-volume (HVNodes). Should the market trend for long periods of time, it will be identified by low-volume areas (LVNodes). LVNodes denote directional conviction and ought to offer support on any test.
If participants auction and find acceptance in an area of a prior LVNode, then future discovery ought to be volatile and quick as participants look to HVNodes for favorable entry or exit.
POCs: Denote areas where two-sided trade was most prevalent in a prior day session. Participants will respond to future tests of value as they offer favorable entry and exit.
MCPOCs: Denote areas where two-sided trade was most prevalent over numerous sessions. Participants will respond to future tests of value as they offer favorable entry and exit.
About
In short, an economics graduate working in finance and journalism.
Capelj spends most of his time as the founder of Physik Invest through which he invests and publishes daily analyses to subscribers, some of whom represent well-known institutions.
Separately, Capelj is an equity options analyst at SpotGamma and an accredited journalist interviewing global leaders in business, government, and finance.
Past works include conversations with investor Kevin O’Leary, ARK Invest’s Catherine Wood, FTX’s Sam Bankman-Fried, Lithuania’s Minister of Economy and Innovation Aušrinė Armonaitė, former Cisco chairman and CEO John Chambers, and persons at the Clinton Global Initiative.
Contact
Direct queries to renato@physikinvest.com or Renato Capelj#8625 on Discord.
Calendar
You may view this letter’s content calendar at this link.
Disclaimer
Do not construe this newsletter as advice. All content is for informational purposes.


