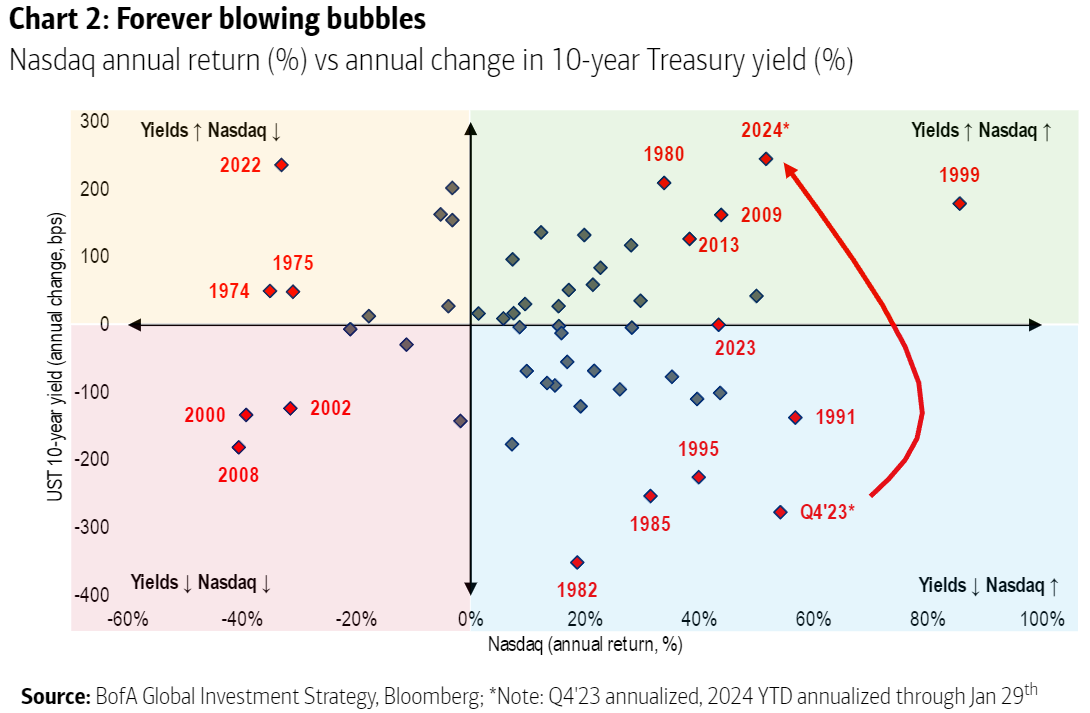
“The U.S. is doing pretty well,” Yardeni Research founder Ed Yardeni remarks, noting a shift from speculation about interest rates allows the market to focus on fundamentals. “Right now, the fundamentals are good for the economy. And, there’s plenty of hype around about.”
Multiple rate cuts totaling nearly 125 basis points in the next year remain expected. This seems extreme unless there’s a market crash, says Harley Bassman, inventor of the MOVE Index measuring bond market volatility. Bassman believes current pricing reflects a bimodal scenario, with an 85% chance rates remain stable and a 15% chance they drop to 1%. Combining these probabilities, the market arrives at the anticipated cuts by year-end.
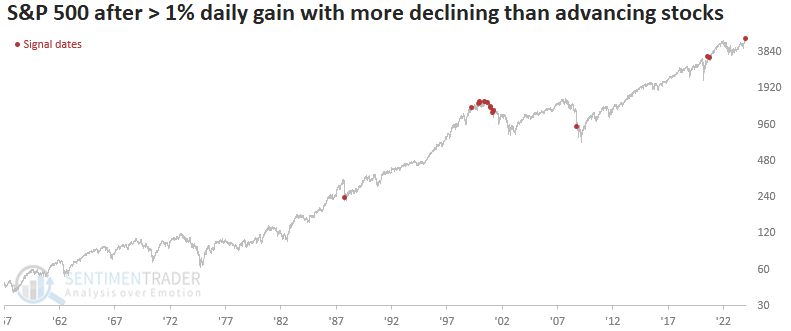
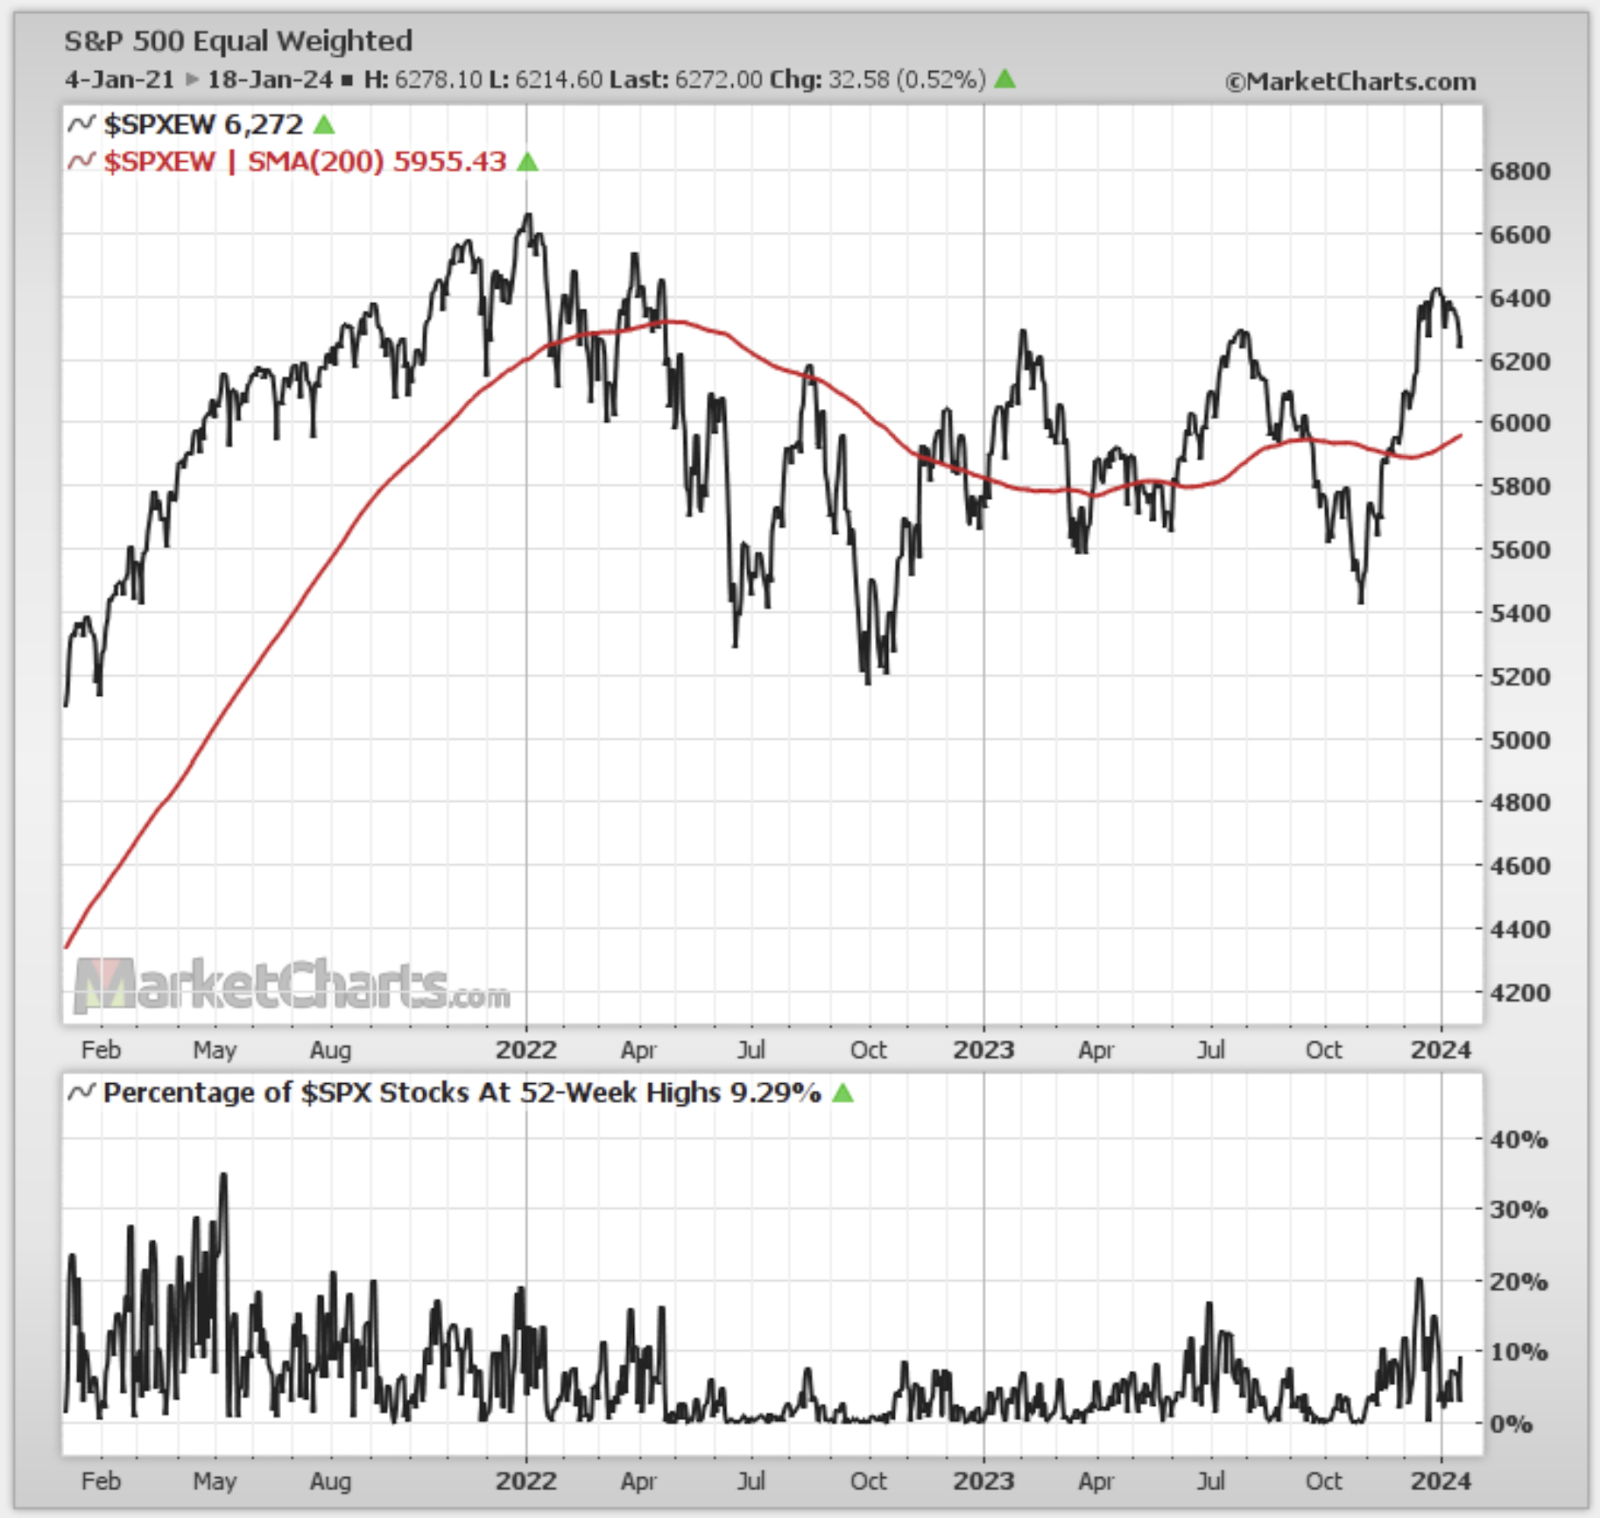
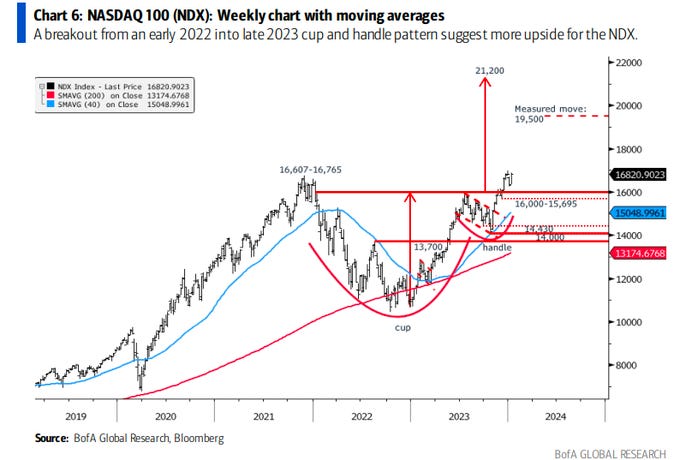
Naturally, markets are cyclical, moving from one extreme to another. Despite the fundamentals being in order, a lack of broad participation is evident in the more significant number of declining stocks than advancing ones. This situation, resembling patterns seen during the late ‘90s infotech-and-telecom boom, is frequently an indicator of less resilient future returns.
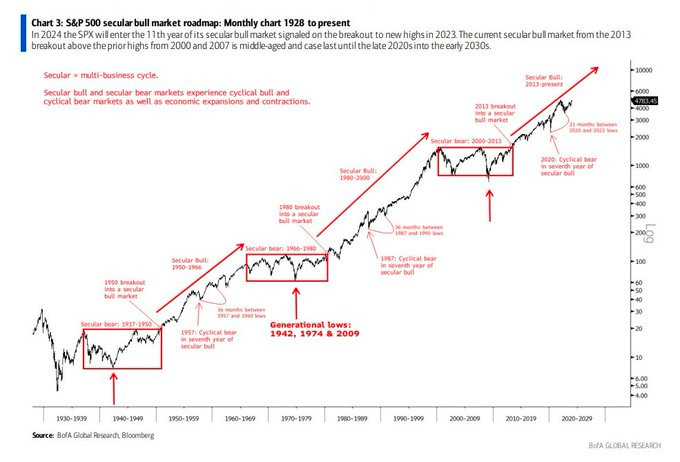
Graphic: Retrieved from Bank of America Global Research.
Ryan Detrick of Carson Group notes that February typically experiences less momentum than January, often due to reinvestment and bonus inflows. Data shows that when the S&P 500 recorded a 20% gain for the year, February tended to underperform, especially in the latter half of the month, which typically marked the weakest two-week period of the year.
Graphic: Retrieved from SentimenTrader via Jason Goepfert.
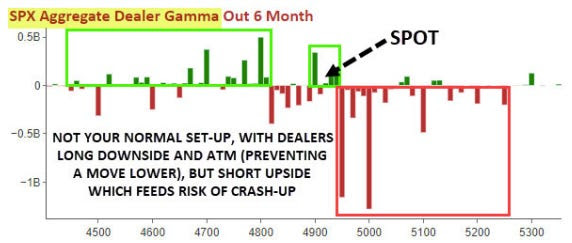
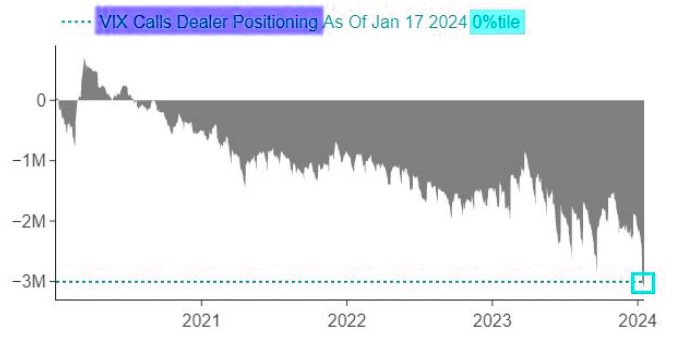
While the same volatility-suppressing trades detailed in last week’s letter continue to support markets where they are ceteris paribus (where customers sell volatility, and dealers hedge by buying stock/futures during declines and selling during strength), there has been “SPX/SPY downside buying (put flys) and ongoing VIX call buying,” Nomura Americas Cross-Asset Macro Strategist Charlie McElligott writes. This steepens implied volatility skew, benefitting the underappreciated hedge opportunities shared in Physik Invest’s Market Intelligence letters.
Graphic: Retrieved from SpotGamma on February 5, 2024.
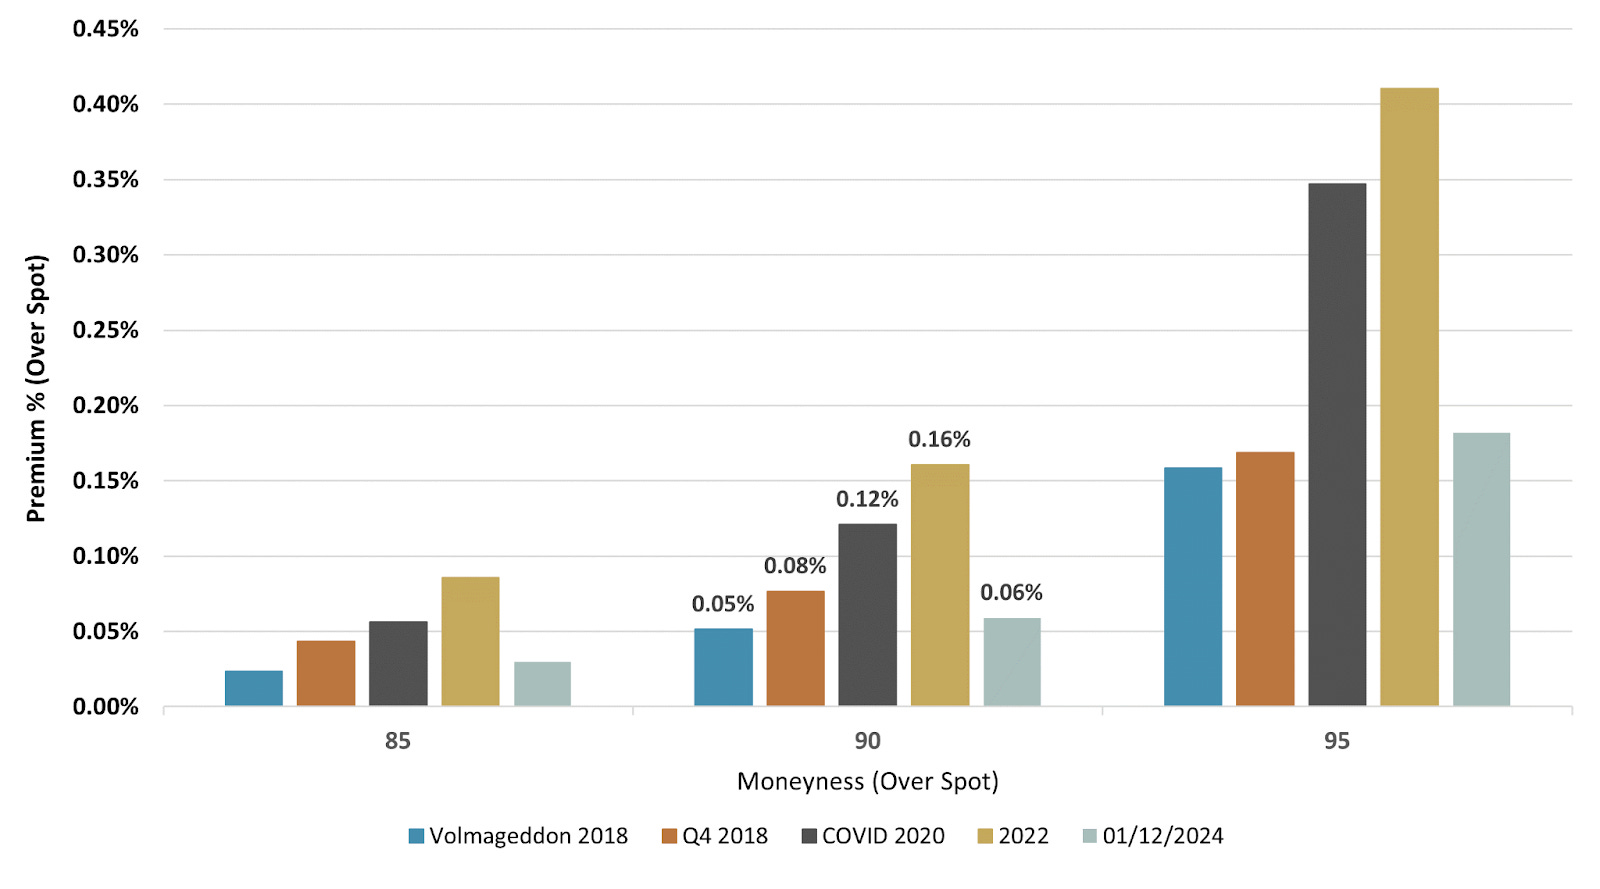
The recent repricing has allowed unbalanced, out-of-the-money options spreads to retain their value better amid ongoing market gains. The focus has shifted from worries about missed opportunities to safeguarding against potential downturns. This shift may be attributed to concerns beyond poor market breadth and the possibility of localized issues in places like China impacting global markets. These include geopolitical tensions, turbulence in specific capital market segments, lingering effects of extensive government spending, and looming debt crises.
Graphic: Retrieved from SpotGamma on February 1, 2024.
With the popularity of yield-enhancing trades like selling options, there’s concern that if significant market movements materialize, a greater share of end users will shift to buying options, indirectly exacerbating market volatility and downside.
To explain this phenomenon, we start with the options delta, which measures how much an option’s price will change for every $1 change in the underlying asset’s price. When end users sell put options, market makers buy them, assuming a negative delta stance, thus prompting them to acquire the underlying asset to hedge (which has a positive delta). Conversely, when end users buy put options, dealers sell them, taking on a positive delta. Consequently, they need to sell the underlying asset (which has a negative delta) to hedge. In sharp and volatile market declines, options sellers may opt to cover their positions by purchasing options, thereby diminishing stability as counterparties hedge in line with the market movement.
Graphic: Retrieved from Nomura.
Kris Sidial from The Ambrus Group emphasizes second-order effects are further amplified due to the large scale of options selling, adding concentration among market makers as another risk to watch. Scott Rubner, a tactical specialist at Goldman Sachs Group, concurscurrent market problems, and the unwind of stretched positioning may lead to a weak February.
In their Daily Observation, dated January 4, 2000, Bridgewater Associates argued each decade was inclined to be more dissimilar to the preceding one.
“Most people who experienced consistent reinforcement for ten years were inclined to believe that this would continue indefinitely,” the authors Ray Dalio et al. said, pointing to the situation that preceded stock investors’ disappointment in the 1970s, akin to present perceptions. Investors took untimely risks that proved costly. By the late 1970s, influenced by the trauma of inflation, they shifted towards hedge assets.
The report underscored a significant point: “Thirty years of prosperity and peace created a faith that our problems will be resolved.” Does this sound familiar? Dalio speculates we will soon test the resilience of the existing order and the containment, or lack thereof, of international conflicts.
Let’s take a step back. What has transpired?
Over many decades, policymakers orchestrated a “growth engine,” nurturing innovation and globalization, inadvertently widening the wealth gap. The urgency to fix disparities, heightened by a pandemic, suggests the next decade will unfold differently, marked by rolling crises.
Inflation & protectionism & conflict, oh my!
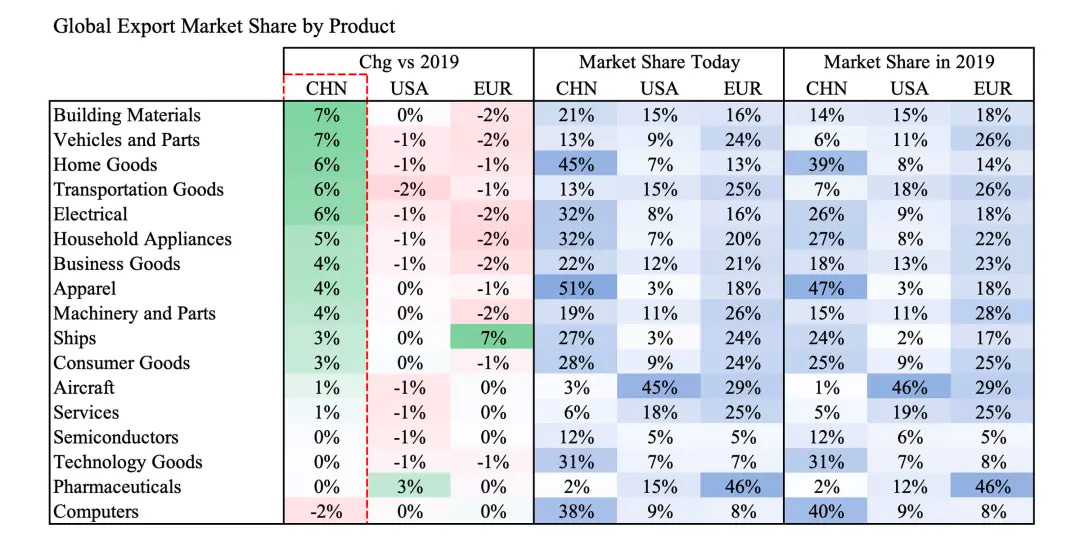
Graphic: Retrieved from TIME. China’s emergence as a global competitor is visualized.
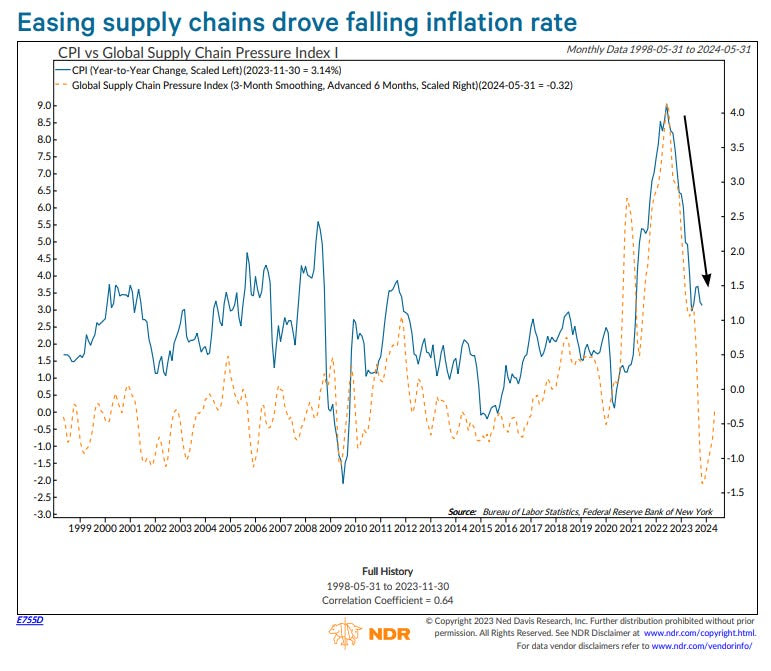
This secular narrative is meticulously explored in our “Climbing A Wall Of Worry” letter. Resolving supply-chain disruptions and commodity deflation helped alleviate overall inflation concerns in the short term. Fiscal boosts, low unemployment, and wage inflation bolstered economic resilience. Pundits are now invoking terms like “soft-landing” and “Goldilocks,” capturing the current sentiment.
Graphic: Retrieved from Bank of America Global Research.
“The picture that market prices are now painting is for inflation to fall to central banks’ targets, for real growth to be moderate, and for central banks to lower interest rates fairly quickly—so the markets are now reflecting a Goldilocks economy,” Dalio says himself.
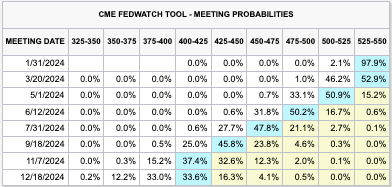
The economic outlook for 2024 seems less impressive despite lingering market support from previous stimulations. Market prices indicate five cuts, reducing the target rate range from 525-550 to 400-425 basis points. Federal Reserve Governor Christopher Waller, who generally holds hawkish views, concurs that “the FOMC will be able to lower the target range for the federal funds rate this year.” However, he cautions against anticipating as many cuts, asserting that, despite noisy data, current policy is appropriate and should persist in exerting downward pressure on demand.
Graphic: Retrieved from CME Group on January 21, 2024.
In a different scenario, where higher real interest rates persist, it would negatively affect the economy. A hard landing would be risked, Fabian Wintersberger believes, leading to a fall in GDP and escalating debt ratios. Regardless of the path, the private sector will likely reduce investment and continue deleveraging for as long as feasible.
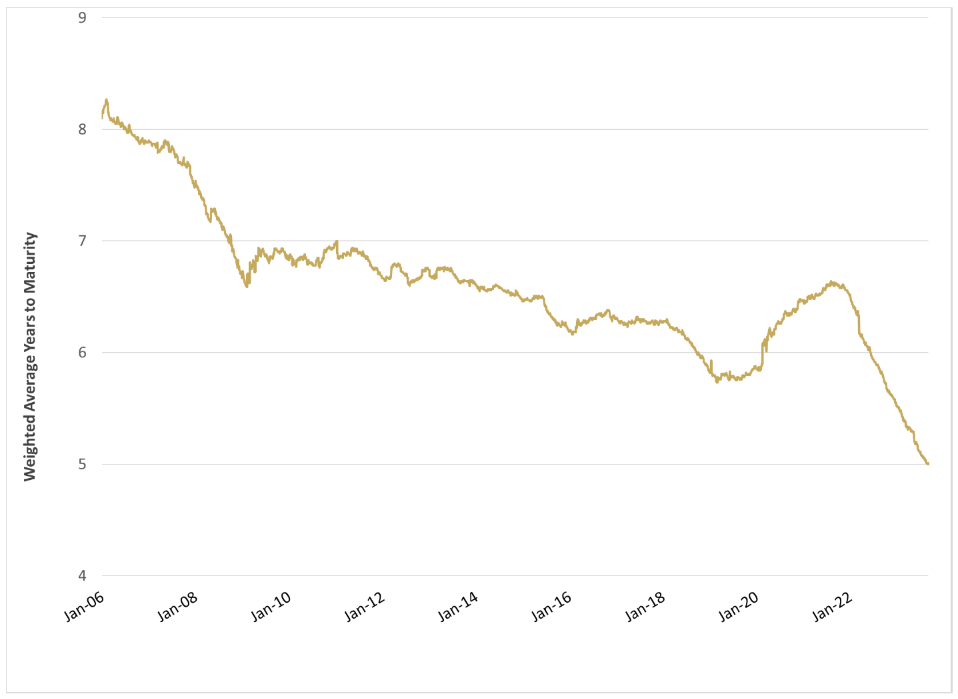
Graphic: Retrieved from Simplify Asset Management. High Yield Index Years to Maturity suggests organizations find refinancing or reissuing debt difficult, primarily due to the high costs associated with the risk-free component. This situation is reminiscent of the Global Financial Crisis (GFC), where uncertainty in credit markets hindered entities from refinancing.
What does all this mean for the stock market? Investors across all time frames are ultra-enthusiastic, bidding products like the S&P 500 to new highs. However, breadth could be more exciting, judging by the Russell 2000 and equal-weighted indexes.
So, what’s the story? Bloomberg says, “This isn’t your father’s S&P 500. Don’t worry about valuations.”
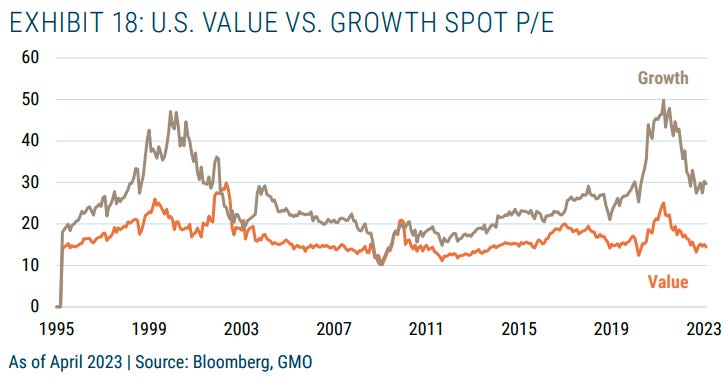
Typically, these statements raise promote caution. However, investors seem to see no alternative at the moment. The market is fueled by enthusiastic buying of a handful of stocks “accumulating greater and greater weighting.” While the forward P/E of the equal-weight S&P 500 aligns with pre-pandemic averages, the so-called Magnificent 7, steering the well-known S&P 500 (i.e., the SPX), boasts a higher value at 28.
Accordingly, over the shorter term, there are risks, including the market pausing here to “demand some deliverables” and the passage of options expiries last week.
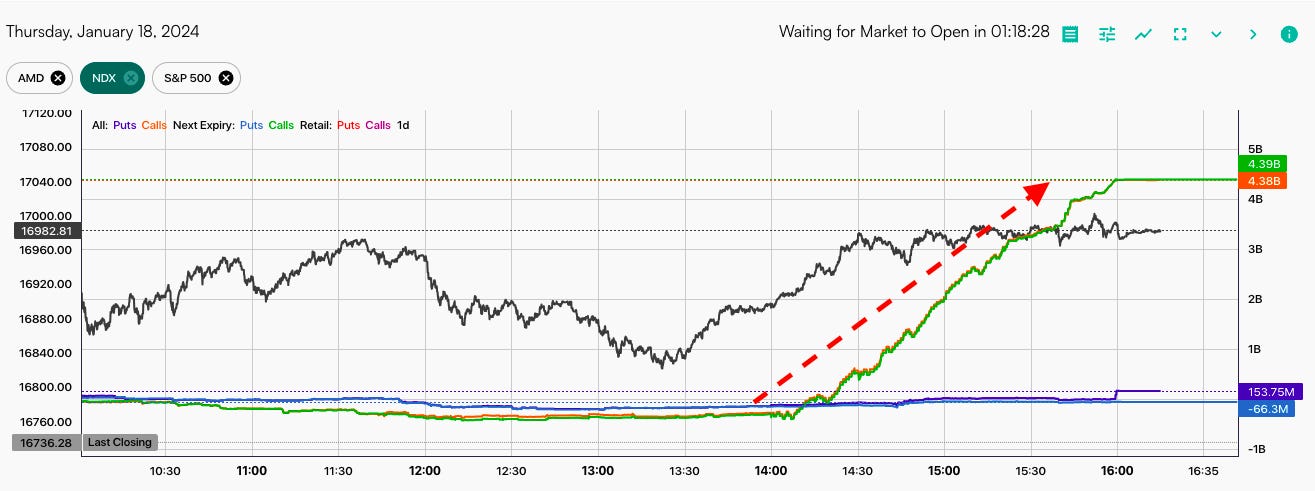
“The reflexive nature of the market tells us that what we are witnessing here is much more mechanical than anything and probably has nothing to do with what is happening in the real world,” Mott Capital Management’s Michael Kramer discusses.
Graphic: Retrieved from SpotGamma.
SpotGamma explains there was “rhythmic buying” of options “related to the QYLD Nasdaq BuyWrite ETF, which rolls the Thursday before monthly OPEX.”
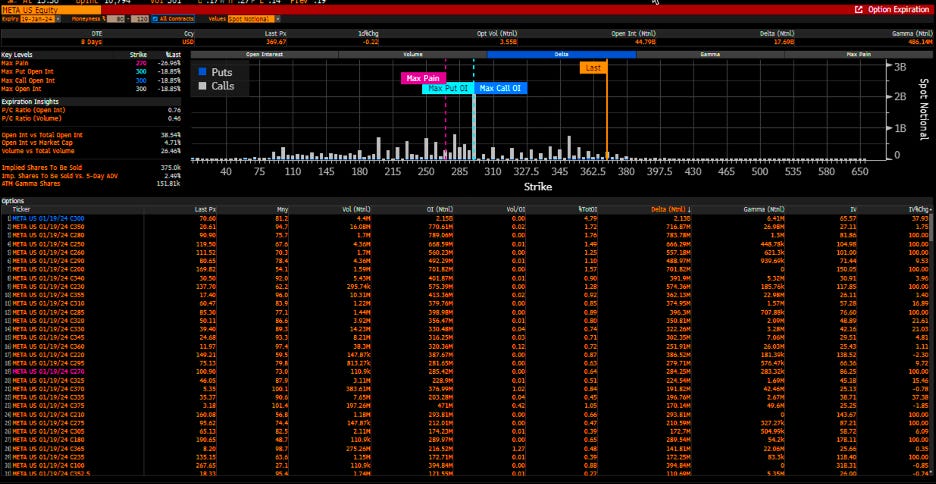
Graphic: Retrieved from Bloomberg via Michael Kramer. Notice the amount of call open interest.
Kramer, aligning with views expressed by individuals such as Cem Karsan from Kai Volatility, anticipates a potential reversal. The premise is based on the assumption that investors owned a substantial share of call options. With a reduction in their quantity and a decrease in the risk they pose to counterparts engaged in hedging through long stocks and futures, there is expected to be diminished “mechanical” support in the subsequent weeks. SpotGamma emphasizes that Monday is the final day for any options expiration effect.
“The structural supply and demand imbalance should end on Friday,” Karsan states. “I would be careful chasing this tech up here, in particular, if we see some weakness going forward like we’ve been talking about.”
The crucial factor is the amount of “vol supply” emerging from this event, which could counteract “vol demand” (recall that investors often seek protection through options or volatility, the all-encompassing term). This counteraction may postpone weakness, setting the stage for a more significant decline later in Q1, as highlighted by Karsan.
It’s important to note that a substantial market position involves hedging equity with short-call options and long-put options. Options prices may decrease with increased volatility supply, leading to the counterpart’s re-hedging of this position by buying back underlying stock and futures hedges (i.e., if a counterpart is short futures against an SPX long-call and short-put position, they will buy futures to rebalance their delta as implied volatility falls).
Graphic: Retrieved from Nomura Securities International.
“Can that counter the lack of positive flows, the vol buying, and some of the macro liquidity issues,” Karsan asks, acknowledging the pressures linked to asset runoff, Treasury issuances, the diminishing reverse repo, and external events such as the Red Sea attacks, which are perceived as potentially more impactful on supply chains than the global pandemic. In any case, there are increasing prospects of a “February 14 Valentine’s Day Massacre.”
What’s the course of action? According to Simplify Asset Management, considering that far out-of-the-money puts are now priced at half of what they were at the onset of the global pandemic four years ago, hedging at this point is a prudent move.
Butterflies in the Nasdaq 100 and S&P 500 present an appealing opportunity. Take, for instance, the 15000/13500/12000 NDX butterfly expiring in the next month or two. It costs between $500 and $1,500 to open. If it’s the shorter-dated one that is in the money today, closing it could yield about a $90,000 credit, excluding changes in implied volatility and the passage of time. The maximum value is $150,000, and the risk is confined to the amount paid at open. Talk about the convexity!
We’ve analyzed this specific trade for you, although in the S&P 500 and without the distant protective put. Given the distinct environment, there is an elevated risk of a volatility increase warranting the acquisition of far-away protection, represented in this instance by the 12000 put.
Graphic: Retrieved from Simplify Asset Management.
Though owning volatility safeguards against a substantial decline, consider the expenses of maintaining that position and the inevitable decline in its value during calm or rising periods. It is “the investment equivalent of death by a thousand cuts.”
“Vol is cheap enough when you go out two or three months, particularly on the call side,” Karsan ends. “Into a rally particularly that should continue to be relatively bid. That doesn’t mean go own one-month vol because that is more uncertain here, right? You will experience a lot of decay if the decline doesn’t happen till February. Right? There is still theta to be had.”
Graphic: Retrieved from Bank of America Global Research.
Photo: By Alan Stoddard. Taken on January 11,2018.
Hey, all! I hope you had a great weekend. Today, we dive into what’s driving markets and what the near future may look like. On Monday, we will do deeper dives like this. Friday, we’ll try for recaps. Trade ideas are coming soon via monthly research, which will look similar to this linked document.
Market momentum slowed with bumps in economic and inflation data last week, yet the trend of economic resilience and declining inflation persists. Anticipation looms over a potential shift in the Federal Reserve’s approach, with traders awaiting Tuesday for insights from Governor Christopher Waller regarding the possibility of a decrease in interest rates.
CrossBorder Capital remarks the economy may avoid recession, attributing this to economic measures adjusted for distortion—an increase in adjusted yields points to a mild recovery in business activity later in the year.
Graphic: Retrieved from CrossBorder Capital. Based on the mortgage curve, they calculate a 10-year Treasury yield 110 basis points higher. A steeper curve implies easier monetary conditions.
Former open markets trader Joseph Wang maintains cautious optimism, foreseeing cuts, albeit less aggressive than the market prices. However, Cem Karsan from Kai Volatility suggests that if anticipated stock struggles and declines reach 10% or more, more decisive, politically motivated actions may be taken ahead of the election.
Graphic: Retrieved from Bloomberg via Joseph Wang. The SOFR term structure provides insights into the market’s expectations for short-term interest rates over various time horizons.
In any case, injecting money into a healthy economy is bullish. That being so, Goldman Sachs foresees the S&P 500 reaching 4,950 to 5,050 by 2025. Wang, emphasizing the potential benefits of both monetary and fiscal stimulus, notes deficit spending ultimately triggers an increase in both yields and risk assets like stocks.
Cryptocurrencies may also benefit, with some anticipating the approval of a bitcoin exchange-traded fund to invigorate a bullish trend akin to the impact of State Street’s Gold Trust on the gold market. However, not all share this optimism, including Tom McClellan, who parallels a situation in 1974 when investors bid up gold prices in anticipation of Americans regaining the right to own gold, only to witness a decline of 41% in prices by August 1976.
Whether higher rates persist or not, specific forces are at play that are unlikely to destabilize the market markedly. Elevated rates give rise to an increased demand for what is termed “one-sided and risky positioning,” elongating the market cycle and reducing short-term volatility through mechanical interventions. This artificial stability sends misleading signals, fostering even more interest in this type of trading. Karsan aptly dubs it the “sumomarket,” echoing Amy Wu Silverman of RBC Capital Markets’ insight that such strategies aren’t indefinite and may sour.
We hedge when we can, not when we must! Traditional reliance on bonds falls short in a landscape where correlations have transformed. During the subdued realized and implied volatility, traders protect against pullbacks, particularly during or after the earnings season, by buying Cboe VIX call options.
In the realm of alternatives, the choice depends on your timeframe and view on price trajectories. We gave explanations last year, revealing options like allocating principal to less risky assets such as box spreads utilized as collateral for margin-intensive trades. For those eyeing the short-term downside, ultra-wide butterflies—equidistant or slightly broken—emerge as a consideration. Contrastingly, if it were 2022, cheaper ratio spreads would be preferred due to the subdued tendencies of implied volatility. However, with “over-positioning into short volatility,” that may no longer be the case.
Photo: By Glenn Halog. Taken on September 17, 2012.
Hey, all! I hope you had a great weekend. We’re sticking to our promise, as shared on Substack. Today, we dive into what’s driving markets and what the near future may look like. Generally speaking, on Monday, we will do deeper dives like this. Friday, we will do recaps. Trade ideas are coming soon via monthly research, which will look similar to this linked document.
That’s a take hot enough to grab your attention, isn’t it? We digress. It’s been a couple of years since central banks began tightening. With it being this late in the economic cycle, the effects of contractionary monetary policy should be felt, right? Well, not as you imagined heading into last year. The economy is strong, and inflation was better managed than anticipated.
Is it that the economy is less sensitive to monetary policy? Citadel’s Kenneth Griffin states that monetary tightening struggles to offset fiscal stimulus. Jerome Powell, Chair of the Federal Reserve, has had his mission to engineer a soft landing complicated. “Whether it is the Inflation Reduction Act or other programs that have increased spending, we keep stimulating the economy out of DC.”
Graphic: Retrieved from Global Financial Data via Meb Faber Research.
That’s the outlook envisioned by some, including Cem Karsan of Kai Volatility. In his analysis, this policy divergence traces back to the era of easy money spanning decades—instances like the Federal Reserve buying long-term bonds, reducing their yields, and steering investors towards riskier assets. A “growth engine” resulted, as Karsan describes it, driving innovation and globalization, accompanied by low inflation and occasional deflation.
The bulk of the stimulus predominantly benefiting the top echelons—corporations focused on profit generation through cost-cutting and expanding market share—contributed to a widening gap between the privileged and the less privileged (i.e., the wealth effect and labor competing globally with other labor and technology). If the current emphasis is on populist fiscal measures (such as increasing the velocity of money by directly injecting funds into the hands of the public and, consequently, into the economy) to address inequality and enhance the average person’s spending capacity, this could be the catalyst for sparking inflation and the potential for elevated yields for years to come.
Photo: By Glenn Halog. Taken on September 17, 2012. View on Flickr here.
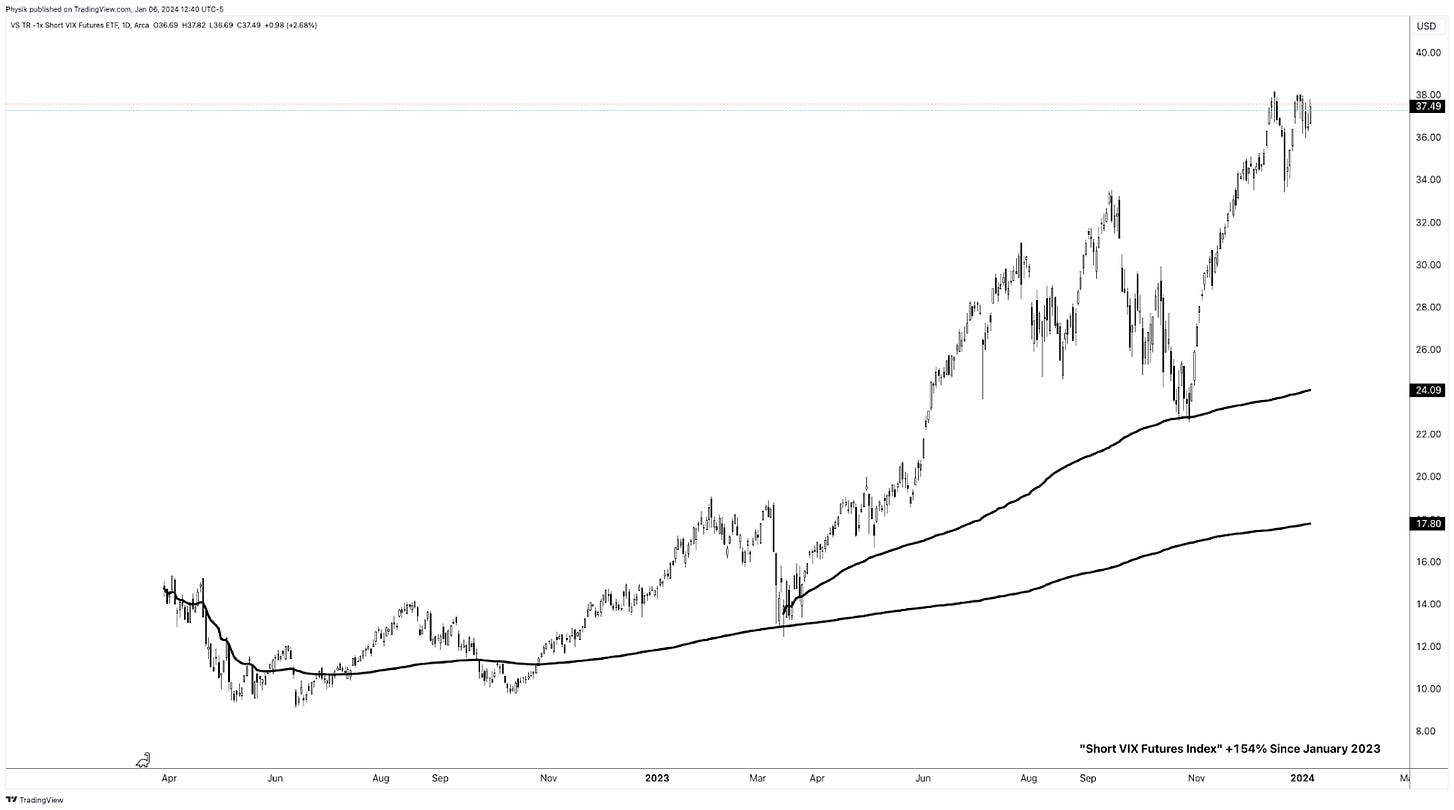
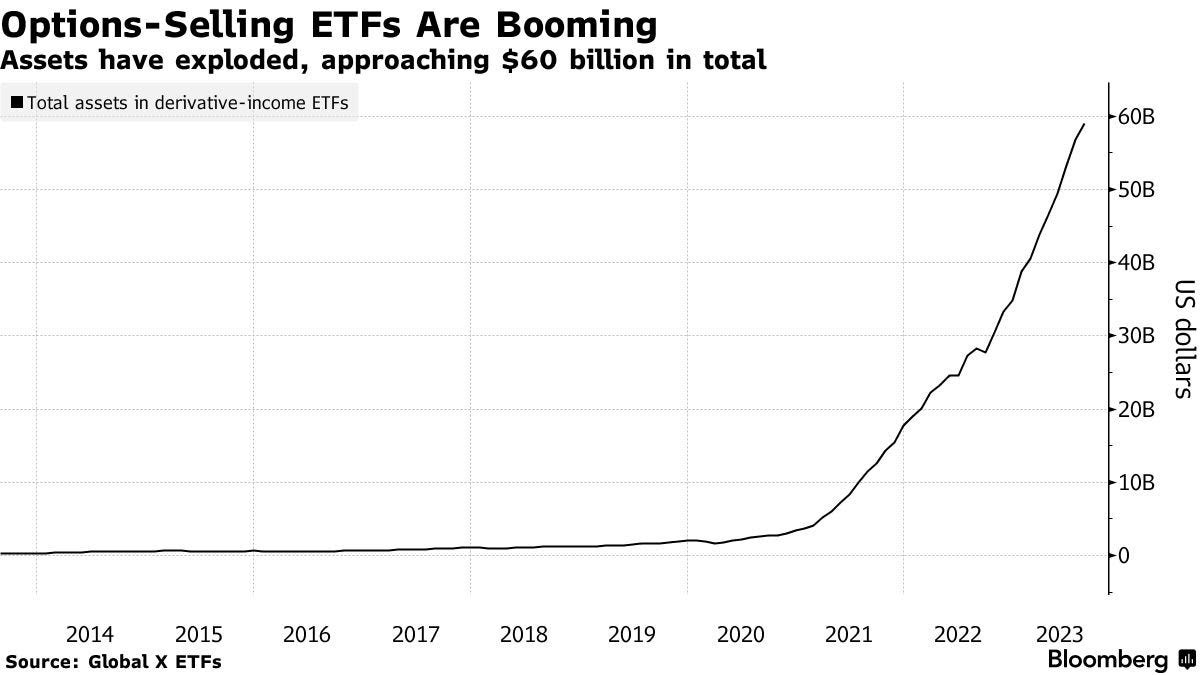
It’s a new era, and as Karsan points out, the tail is getting thicker, indicating a shift towards one-sided and risky positioning. Why is that so? Individuals are hedging the above realities, turning to Treasuries (used as collateral) and short equity options or volatility (the all-encompassing term) to enhance returns.
Graphic: Retrieved from TradingView. Pictured is the short VIX Futures ETF.
“If you remember 2017, right before we got into Volmageddon in February 2018, the volatility environment smelled similar to right now,” Amy Wu Silverman, head of derivatives strategy at RBC Capital Markets, shared with Bloomberg. “It works until it doesn’t.”
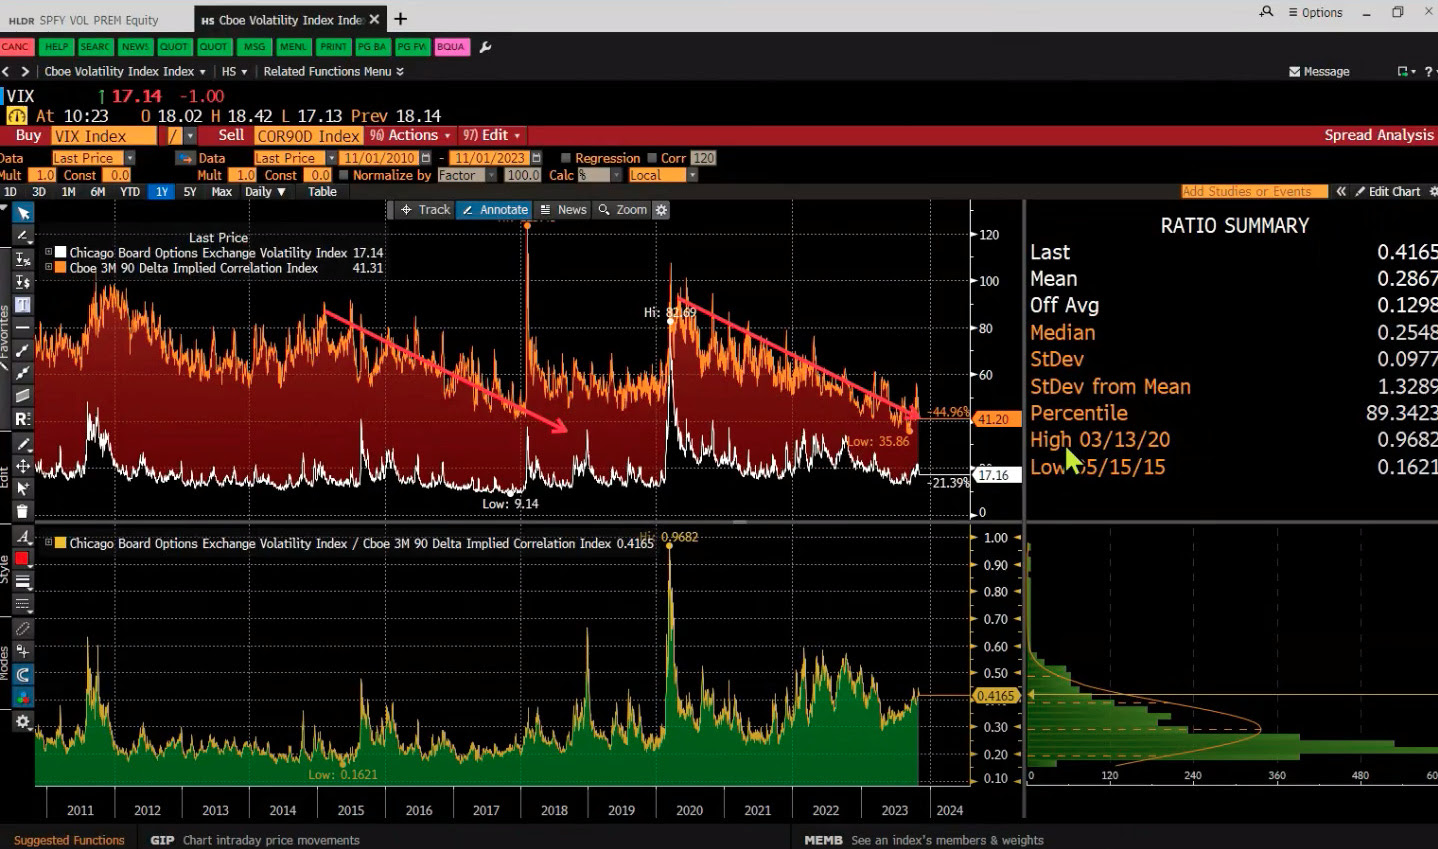
Graphic: Retrieved from Bloomberg via Simplify Asset Management’s Michael Green. Implied correlation for a 90 Delta call or 10 Delta put. Given the current volatility level, the implied correlation is lower than expected, indicating potential market vulnerability or “deeply unhealthy” conditions.
Kris Sidial from The Ambrus Group explains highly responsive spot-vol beta results. For example, we see quick fluctuations in volatility measures like the Cboe’s Volatility Index or VIX. He adds it’s a crowding of the dispersion trade, where participants shift from underperforming longer-dated options to shorter-dated ones for purposes like hedging, directional trading, and yield enhancement. This activity supports and stabilizes the indexes while the individual components underneath occasionally fluctuate pretty drastically. The only way to reconcile these fluctuations is through a decrease in correlation.
This environment is reminiscent of the 1999 to 2000 period, mentioned by Michael Green from Simplify Asset Management during a pre-event call for a Benzinga appearance. Despite the costliness of growth stocks in the late nineties, they still managed to double and triple.
In this scenario, the go-to trade of stocks and bonds (e.g., 60/40) may be less effective. Instead, at least over the short term, one could own long-term call options while selling stocks. Why? Karsan says that volatility “pinning leads to a momentum factor” that sustains itself. As yields rise, more liquidity flows into alternatives like structured products. With index volatility subdued and at a lower limit, positive flows persist until more significant market trends take over.
Graphic: Retrieved from Danny Kirsch of Piper Sandler. On December 18, the S&P 500’s price and SPX’s $4,800 strike option volatility were up.
Looking ahead to 2024, Fabian Wintersberger predicts a higher stock market, dismissing concerns of a second wave of inflation in 2024. The changes in the money supply typically impact the broader economy with an 18-month lag, implying projected rate cuts in 2024 may not affect inflation until 2025 or 2026.
“It seems that the Fed’s and the ECB’s projections are too high, and inflation might turn into deflation in the second half of 2024.” Otherwise, we’re likely in the seventh or eighth inning because higher real yields are starting to come through the economy, Griffin states, noting the Federal Reserve will likely make it clear they will get near a 2% rate in time, stabilizing as best they can employment and prices.
Graphic: Retrieved from Bloomberg. A recent quarterly refunding announcement spurred a rally in bonds and equities. Generally, a weak dollar and lower rates ease financial conditions. That’s good for stocks.
“[Jerome Powell] had a horrible hand to play. We’ve had the pandemic supply chain shocks and massive fiscal stimulus. And he’s supposed to try to achieve price stability. That’s a no-win scenario.”
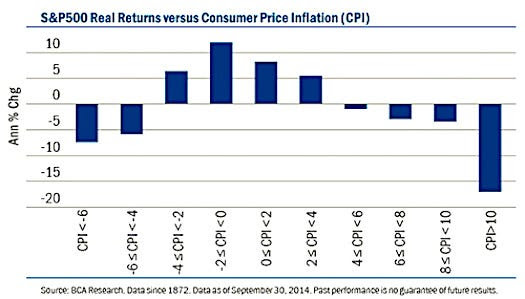
Graphic: Retrieved from BCA Research.
As interest rates decline, the discussed structured product trades and dispersion flows might slow or reverse. The question arises: will the diminishing volatility supply compound challenges arising from weakened macro liquidity, potentially outweighing the anticipated benefits of interest rate cuts and stimulative fiscal measures? We’re working on unraveling this.
While euphoria seems scarce and fragility is not prominently signaled, as Sidial points out, the telltale signs will come as an “explosion” of convexity in the 3-, 5-, and 7-day terms of the volatility structure, as noted by Karsan. Until these signs emerge, former open markets desk trader Joseph Wang suggests cautious optimism, advocating for bullishness amid digestion in terms of time or price.
Graphic: “The market averages three 5% corrections a year,” explains Jay Woods of Freedom Capital Markets, who foresees a touch of ~$4,600 in the S&P 500 ($460 SPY) as a likely scenario. “It isn’t abnormal.”
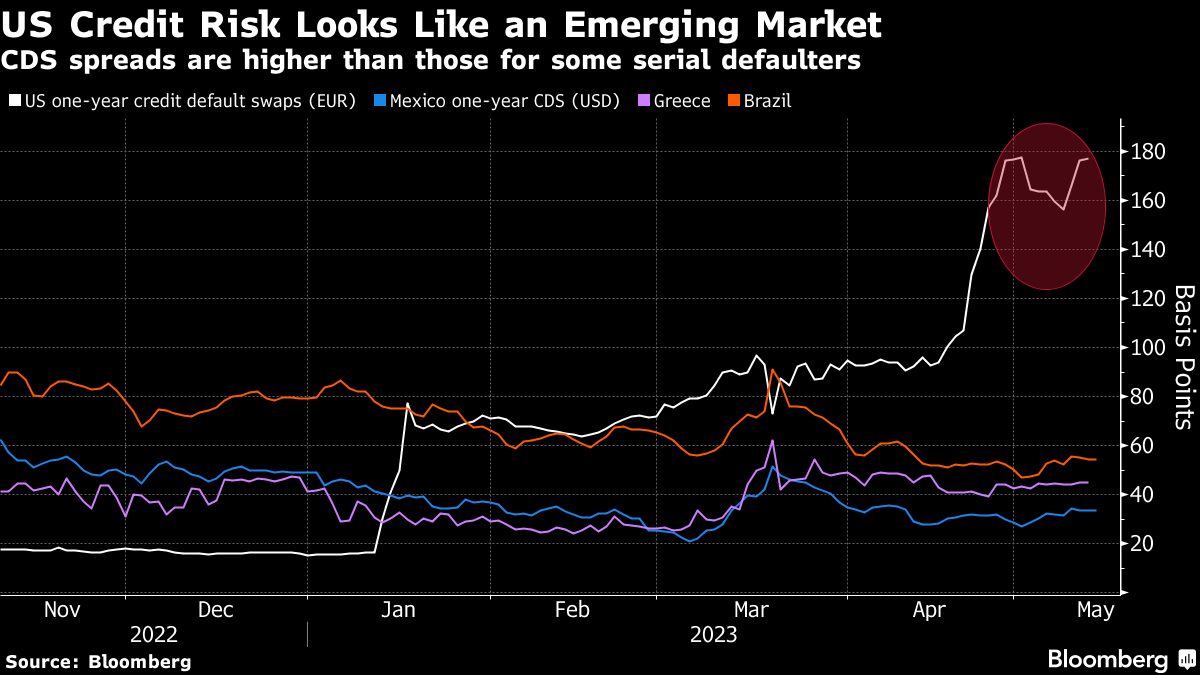
Bloomberg reports that if the US defaults on its debt, which could happen as soon as June 1 if President Biden and House Speaker McCarthy fail to reach a deal on raising the ceiling, homebuyer borrowing costs may surge to 8.40%. As a consequence, the typical home’s monthly payment would increase by 22.00% and cool property sales; the monthly payment on a $500,000.00 mortgage may rise to $3,800.00, compared to about $3,095.00 at the current rate of 6.30%.
In prior letters, we concluded that past monetary action made stocks less sensitive to interest rates, quoting JPMorgan Chase & Co (NYSE: JPM) strategists that the market would likely continue to “artificially suppress perceptions of fundamental macro risks,” barring surprises like a debt limit breach.
With a debt limit breach a potential reality, Moody’s Corporation (NYSE: MCO) says a breach may compound recessionary pressures; expect a drop in equities, a volatility spike, and a disruption of funding markets.
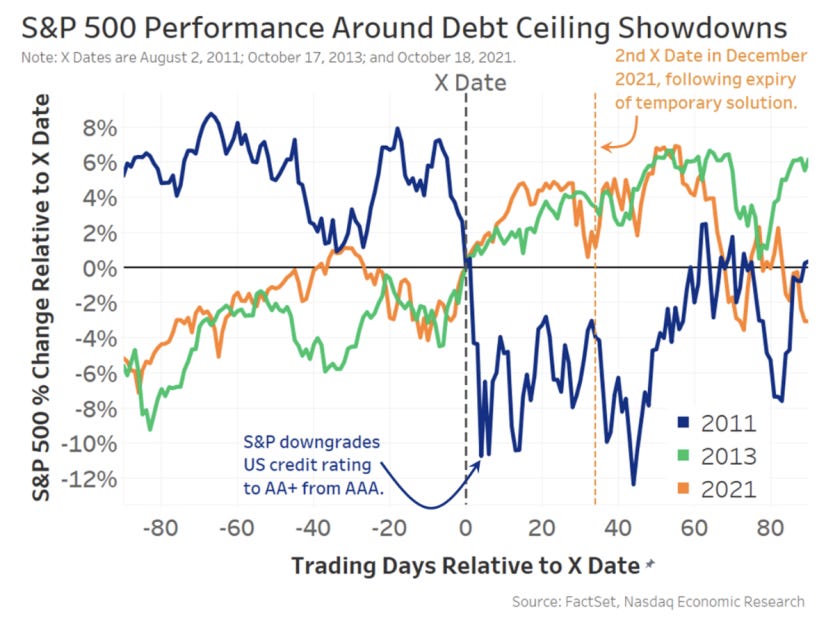
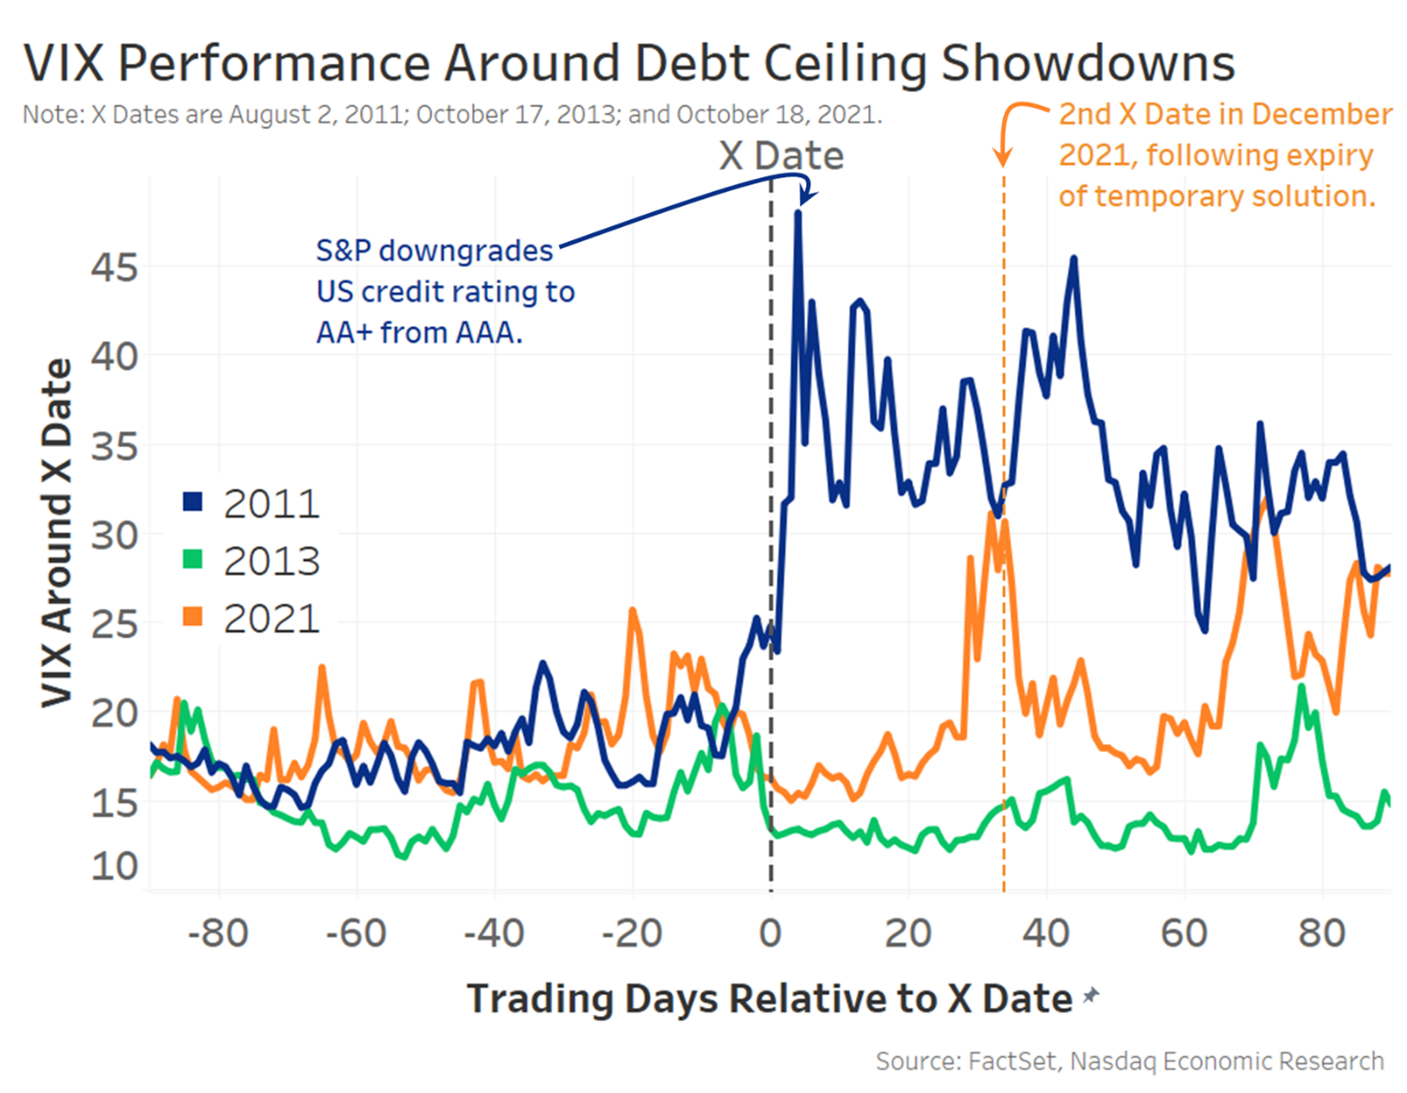
Graphic: Retrieved from Nasdaq Inc (NASDAQ: NDAQ).
“Data show that short-term bonds have the most predictable reaction – with interest rates and default insurance costs rising significantly – before quickly returning to normal after the uncertainty has passed,” Nasdaq’s Phil Mackintosh writes. “In reality, a crisis was averted in all [prior] cases, with the government able to increase or suspend the debt limit before the X Date.”
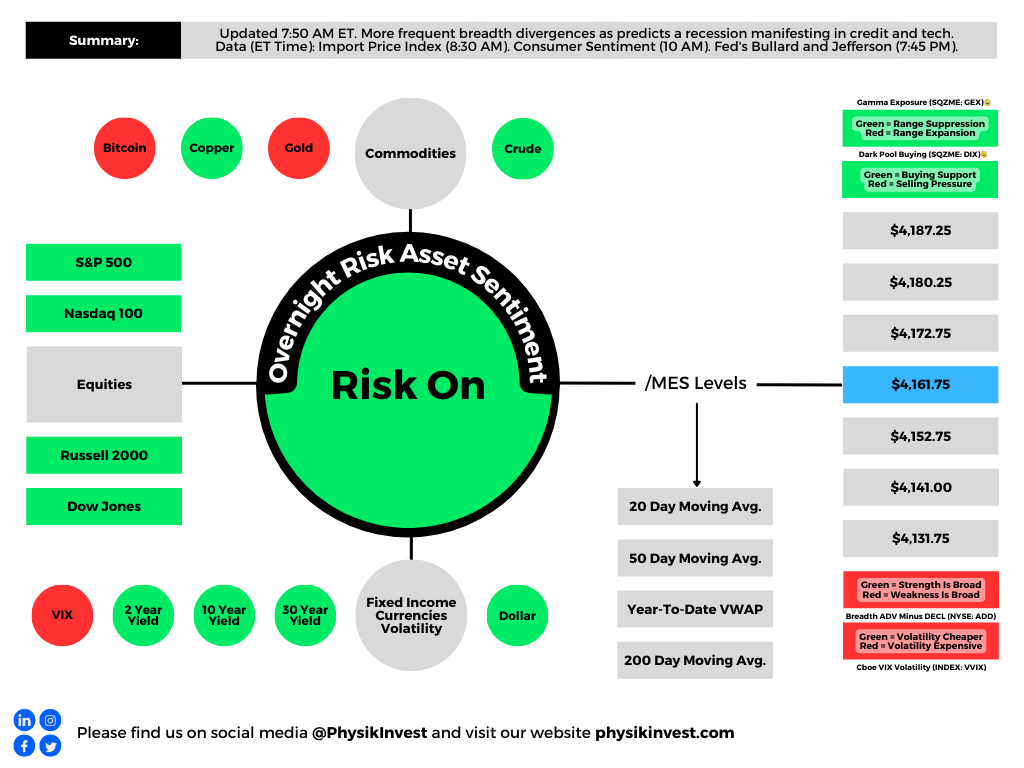
Notwithstanding the short-term uncertainty regarding the debt limit, Bank of America Corporation (NYSE: BAC) is adamant there will be a recession that manifests cracks in “credit and tech,” similar to the situation in 2008. BAC sees the bubble in technology, media, and telecommunication stocks soon deflating as they face higher-for-longer interest rates and a tempered earnings outlook.
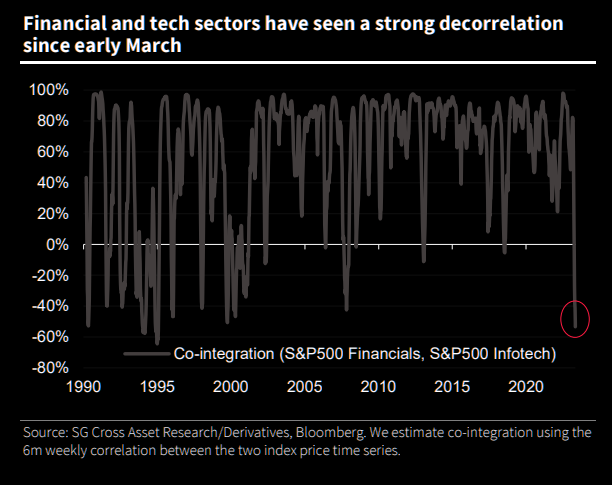
Graphic: Retrieved from Societe Generale SA (OTC: SCGLY) via The Market Ear.While investors poured $3.8 billion into technology stocks in the week through May 10, $2.1 billion was pulled from financial equities, the most significant redemption since May 2022.
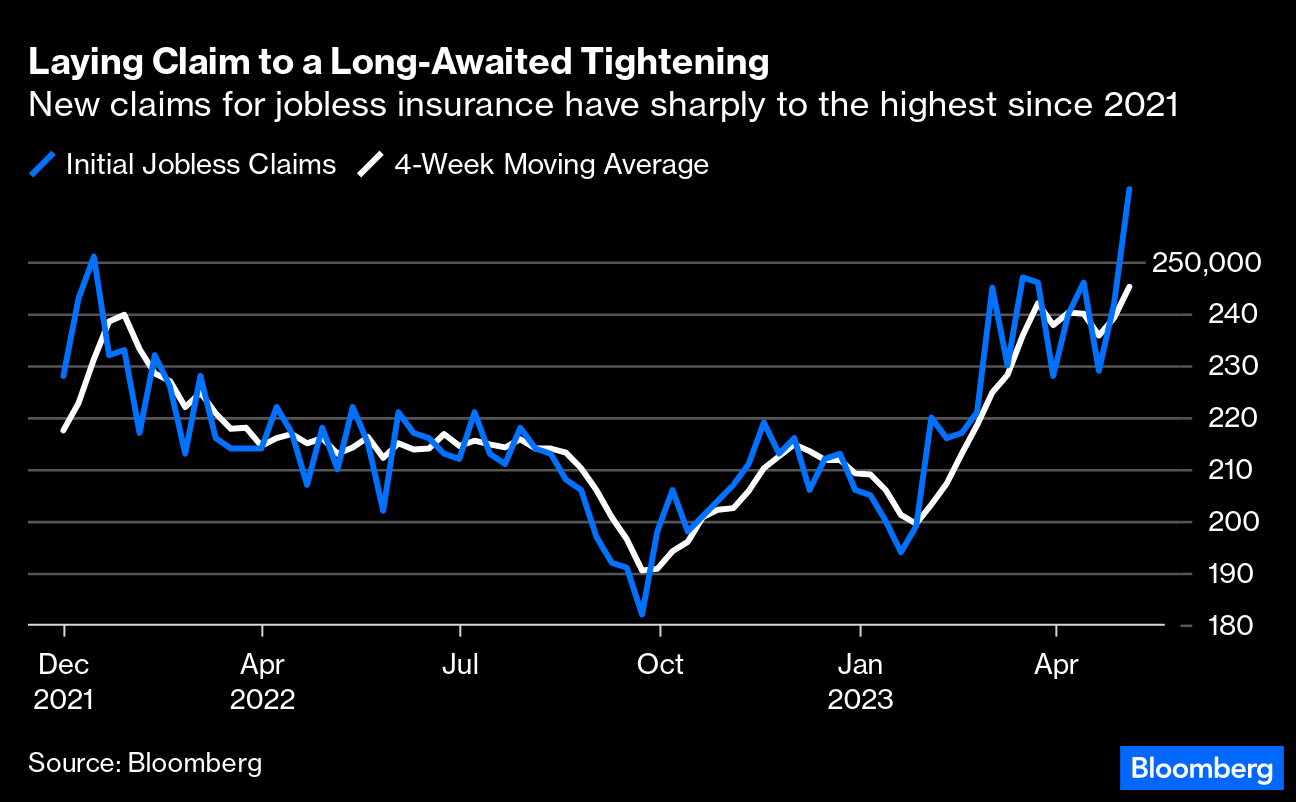
Compounding the recessionary pressures BAC sees, EPB Research adds, are banks’ funding costs, which have increased too much relative to prevailing asset yields. If the spread drops too low, bank lending tightens, and a recession occurs. Also, other data suggests tightening is finally starting to have an impact. Bloomberg reports that initial claims for unemployment insurance are on the rise. There has been a drop in overall wage growth to 5.1% last month, too, the biggest fall in the rate of increase since the series began.
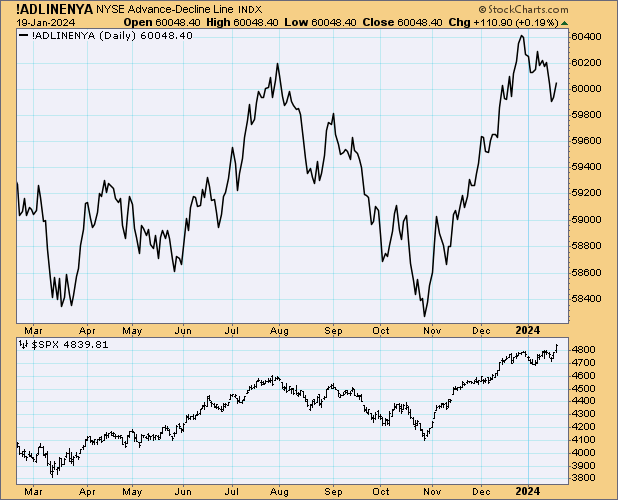
Separately, breadth divergences are becoming more frequent, with the Daily Advance-Decline (A-D) Line for the NYSE showing lower highs while DJIA and S&P 500 show slightly higher highs, McClellan Financial Publications writes. The bond CEF A-D Line is also showing a bearish divergence, indicating a shift in liquidity that could weigh on other stocks, including the big-cap stocks holding up the SP500 and the Nasdaq 100.
Graphic: Retrieved from McClellan Financial Publications.
McClellan adds that the A-D Line originated from data collected by Leonard Ayres and James Hughes in the 1920s. It was made famous in 1962.
Graphic: Retrieved from McClellan Financial Publications.
That’s when Joe Granville and Richard Russell commented on it in their newsletters, noting how it had shown a big bearish divergence ahead of the 1962 bear market.
Graphic: Retrieved from McClellan Financial Publications.
To end, the economic calendar next week is focused on manufacturing and housing. The housing market is showing some downside risk for existing-home sales for April due to a weak reading on pending sales, MCO says, adding that housing permits and starts are expected to move sideways as builders remain cautious amid high-interest rates and economic uncertainty. Regional Fed surveys in New York and Philadelphia will provide the first read on factory activity for May, with little hope for a significant rebound in manufacturing. Jobless claims will be critical, as continuing the recent trend would likely signal a rapid deceleration in monthly job gains. Other critical data to be released include retail sales, industrial production, and business inventories.
Should readers wish to hedge the debt ceiling debacle, June call options on the Cboe Volatility Index appear attractive, some suggest. But, with RVOL as low as it is, owning optionality is not generally warranted. The risk is lower lows in volatility.
Welcome to the Daily Brief by Physik Invest, a soon-to-launch research, consulting, trading, and asset management solutions provider. Learn about our origin story here, and consider subscribing for daily updates on the critical contexts that could lend to future market movement.
Separately, please don’t use this free letter as advice; all content is for informational purposes, and derivatives carry a substantial risk of loss. At this time, Capelj and Physik Invest, non-professional advisors, will never solicit others for capital or collect fees and disbursements. Separately, you may view this letter’s content calendar at this link.
US consumer prices rose by 4.9% in the 12 months to April, down from the previous month’s 5%. Wednesday’s figures suggest inflation is moderating and emboldens the case for a pause to interest rate increases.
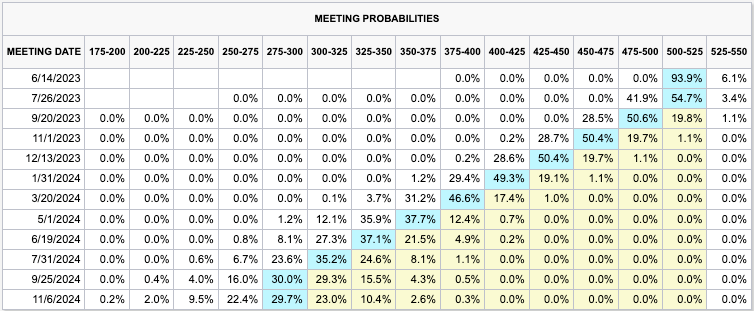
Graphic: Retrieved from CME Group Inc’s (NASDAQ: CME) FedWatch Tool.
“The Fed will want to see declines in these statistical measures for a few more months before it could feel comfortable about cutting rates,” John Authers writes.
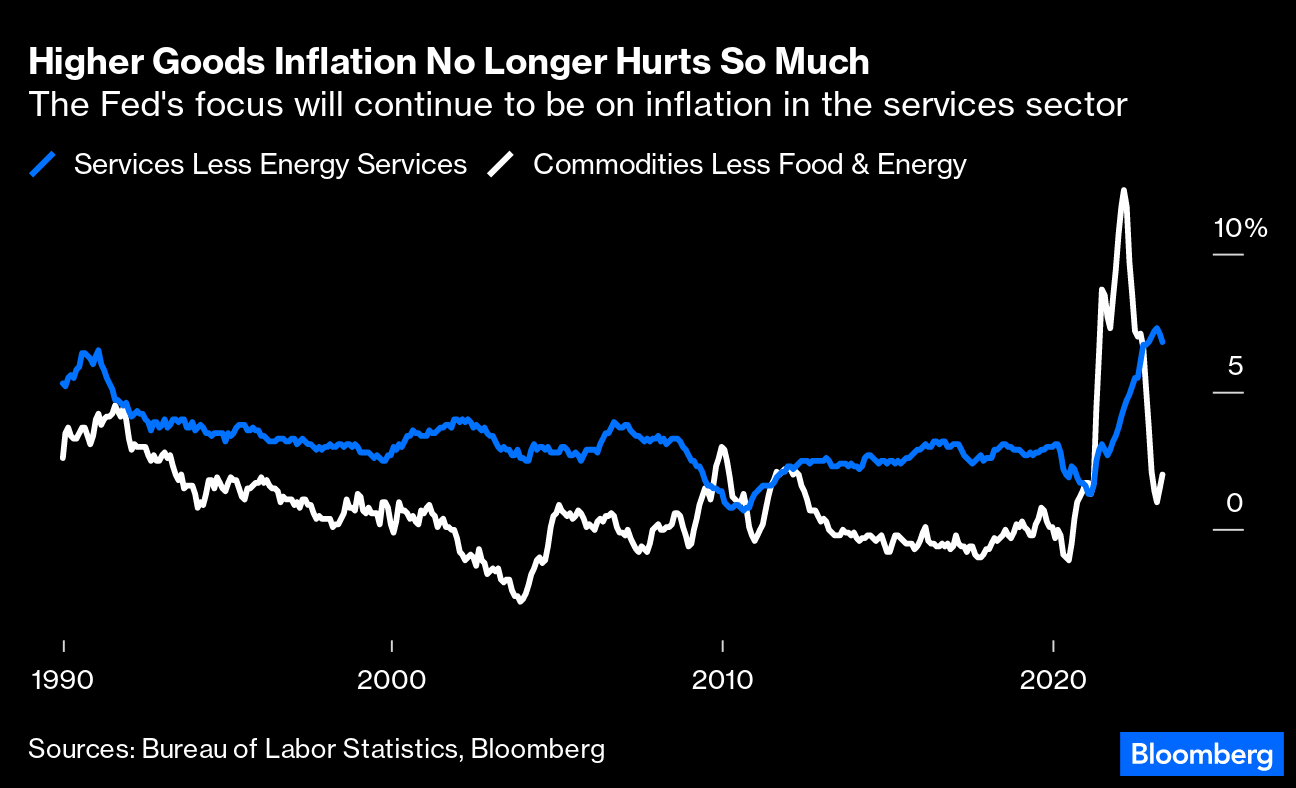
Notwithstanding “sticky price inflation” falling (only “if shelter prices are excluded,” the most challenging “front in the battle on inflation”), applications to purchase and refinance homes rose with yields falling, and that’s exactly what the Fed doesn’t want.
Many maintain the Fed is looking to walk-up long-end yields, and that’s problematic for assets; higher interest rates portend lesser allocations toward risky assets.
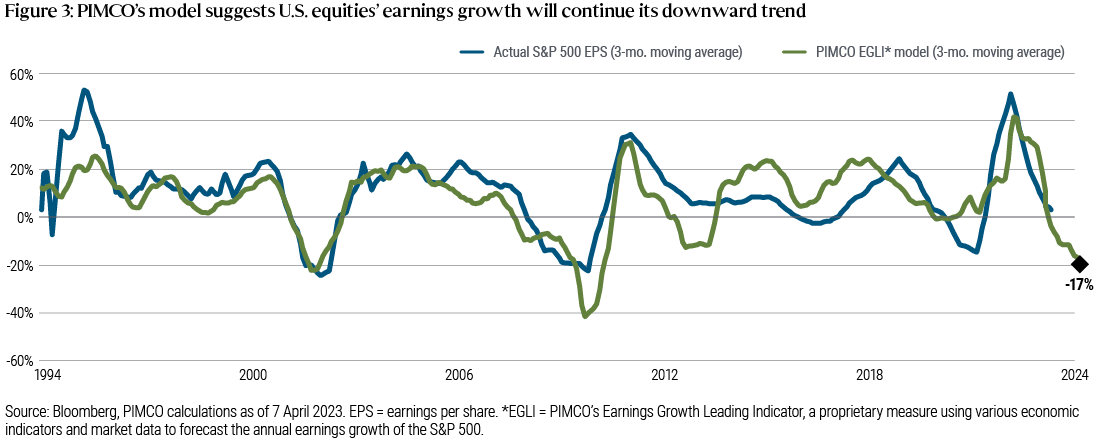
Pimco’s Erin Browne and Emmanuel Sharef add that “12-month returns following the final rate hike could be flat for 10-year U.S. Treasuries, while the S&P 500 could sell off sharply.”
Accordingly, bonds look attractive “for their diversification, capital preservation, and upside opportunities,” while “earnings expectations appear too high, and valuations too rich,” warranting “underweight” equities positioning.
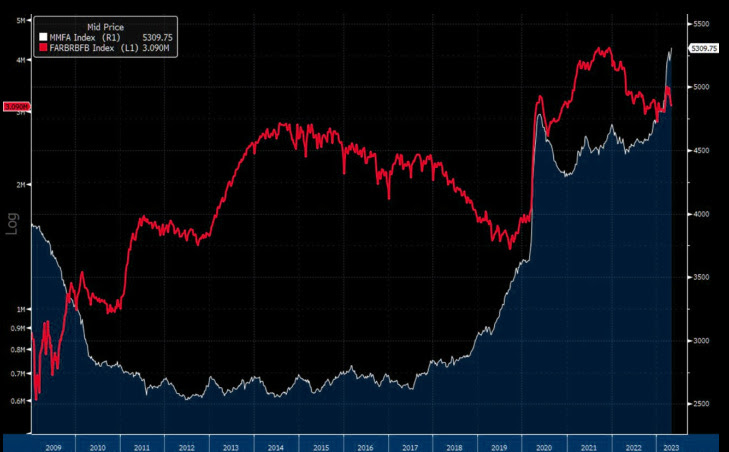
Compounding the risks are flows “that eventually will constrain lending and nominal growth on a 6- to 12-month horizon,” writes Goldman Sachs Group Inc (NYSE: GS).
Graphic: Retrieved from Bloomberg via The Market Ear. “The bull in money market funds refuses to cool down.”
In other news was worry over a US debt default.
The US government has been using accounting measures to provide cash after reaching a borrowing limit. Treasury Secretary Janet Yellen informed Congress that these measures might be exhausted by June, resulting in payment disruptions; a default would cause an economic disaster and “global downturn,” threatening “US global economic leadership” and “national security,” Yellen says. A solution (e.g., to raise the debt ceiling) could manifest issuance of “a substantial amount of bills in 2H23 … that would drain liquidity,” Morgan Stanley (NYSE: MS) writes.
Despite the worry, markets are contained in part due to positioning contexts. Decline in realized volatility (RVOL), coupled with implied volatility (IVOL) premium, makes it difficult for the market to resolve directionally.
In fact, Nomura Holdings Inc (NYSE: NMR) said it sees “significant further potential for additional equities re-allocation buying from the vol control space over the next month if this ongoing rVol smash / tight daily ranges phenomenon holds—i.e., +$37.8B of US Equities to buy on theoretical 50bps daily SPX change).”
Options are sold systematically as traders aim to extract the premium; the Ambrus Group’s Kris Sidial says there is a puking off options exposures and short-bias activity (i.e., selling options) used as yield enhancement as traders call bluff on authorities not being there to prevent crises.
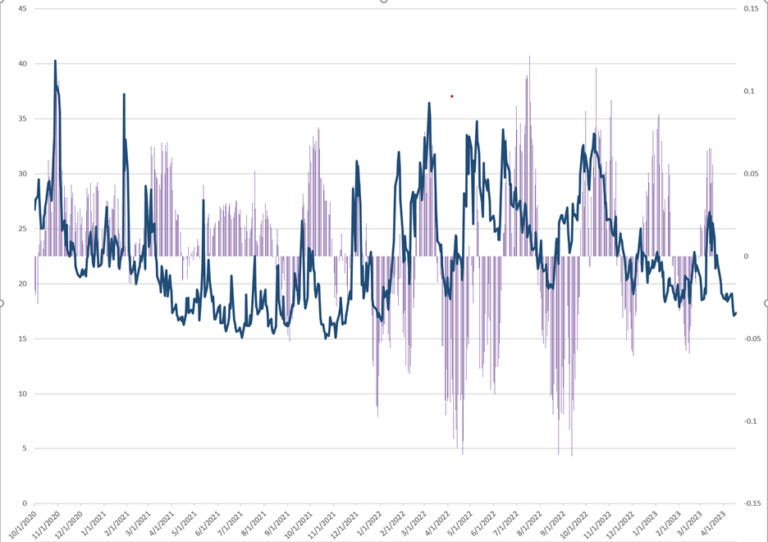
Graphic: Retrieved from Sergei Perfiliev. “This is a 1-month vol – it’s 30 calendar days for implied and I’m using 20 trading days for realized – both of which represent a month.” Note that “juicy VRP = big difference between options’ implied vol (what you pay) and realized vol (what you got). Options are cheap historically, but expensive relative to realized vol.”
Should readers wish to hedge the debt ceiling debacle, June call options on the Cboe Volatility Index appear attractive, some suggest. But, with RVOL as low as it is, owning optionality is not generally warranted. The risk is lower volatility, not higher.
About
Welcome to the Daily Brief by Physik Invest, a soon-to-launch research, consulting, trading, and asset management solutions provider. Learn about our origin story here, and consider subscribing for daily updates on the critical contexts that could lend to future market movement.
Separately, please don’t use this free letter as advice; all content is for informational purposes, and derivatives carry a substantial risk of loss. At this time, Capelj and Physik Invest, non-professional advisors, will never solicit others for capital or collect fees and disbursements. Separately, you may view this letter’s content calendar at this link.
Although banks’ earnings were better than anticipated, sone figures indicate that the broader economy is declining, as retail sales and manufacturing output fell more than projected. Despite the challenges, most believe the Federal Reserve will raise interest rates next month.
Loretta Mester of the Federal Reserve, explained there should be another rate hike as the monetary policy will need to be more restrictive this year, with the fed funds rate rising above 5% and the real fed funds rate remaining positive for an extended period.
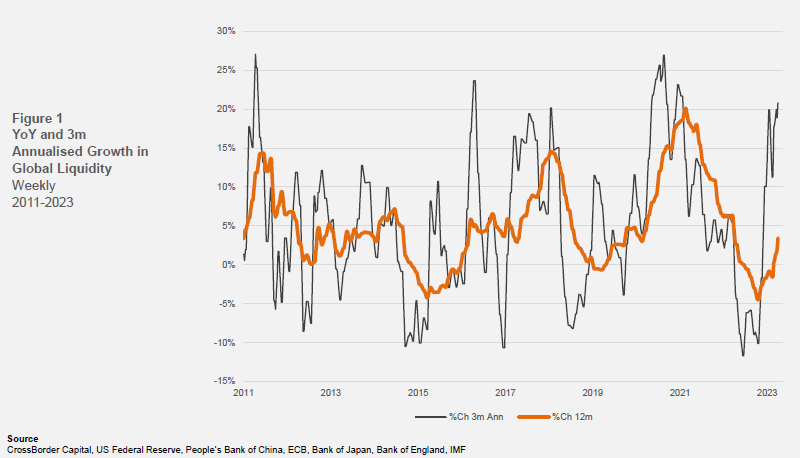
Thus far, monetary policymakers’ efforts to work liquidity out of the system have been complicated, particularly with rates at the back end falling, said Kai Volatility’s Cem Karsan in a conversation with TD Ameritrade Network. CrossBorder Capital confirms. Liquidity has been on an upward trend since October, partly due to China’s efforts to recover from Covid-19 restrictions and the collapse of the UK gilts markets.
Graphic: Retrieved from CrossBorder Capital via Bloomberg.
“Our original conjecture that Central Banks have effectively split their policy tools to use quantitative or balance sheet policies (QE) to ensure financial stability, whilst targeting inflation with interest rate policy is becoming more widely discussed in the media,” CrossBorder Capital’s Mike Howell said. “This splitting of roles can explain why interest rates have risen at the same time that Global Liquidity is turning higher.”
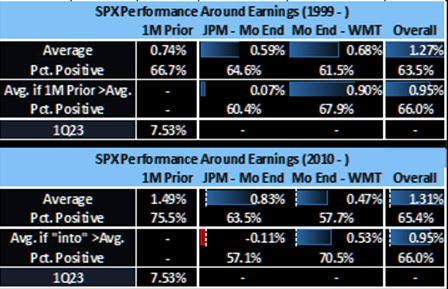
Accordingly, with the recent response to the bank issues cutting down tail risks for the S&P 500 (INDEX: SPX), markets are positioned to stay contained with falling implied volatility (IVOL) and correlations, as well as the passage of time, positioning-wise, key market boosters, Karsan added.
It’s appears the SPX may strengthen before it weakens with risk indicators, including IVOL measures, rising with the SPX. Physik Invest agrees: buy call structures on any weakness and monetize them into strength to finance long dated put structures.
It is better for traders to limit their expectations and stay the course, despite the big gap between IVOL measures like the Cboe Volatility Index and Merrill Lynch Option Volatility Estimate or MOVE, and big bets on market movement in the VIX complex, potentially to hedge against the breach of the US debt limit as soon as June.
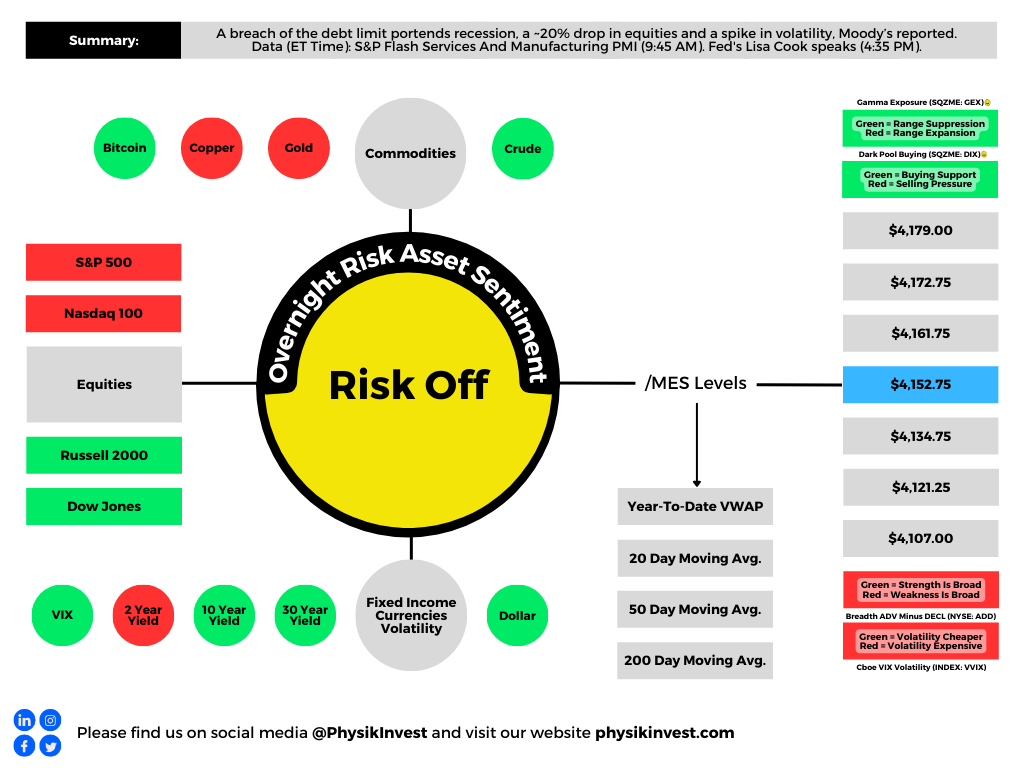
As an aside, recent VIX hedging makes sense given that a breach of the debt limit likely results in recession, a ~20% drop in equities, and a volatility spike, Moody’s said.
Graphic: Retrieved from Nasdaq Inc (NASDAQ: NDAQ).
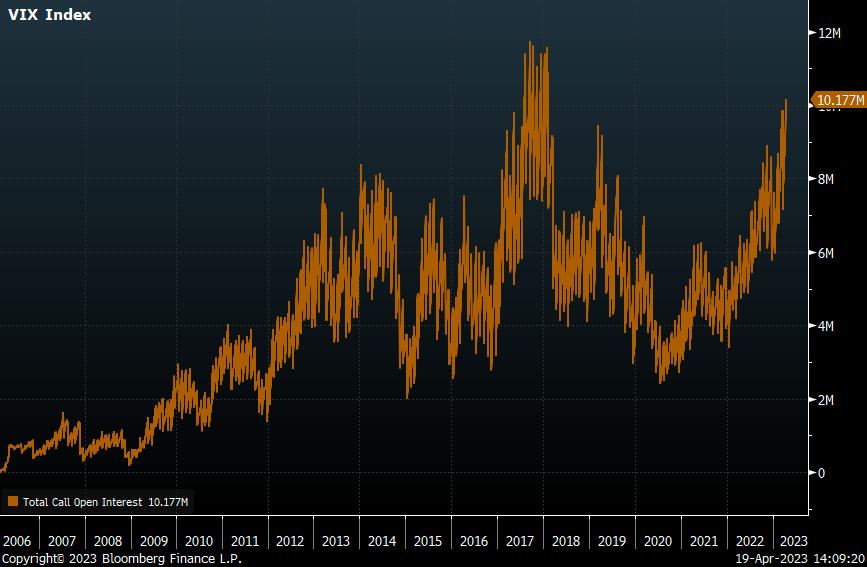
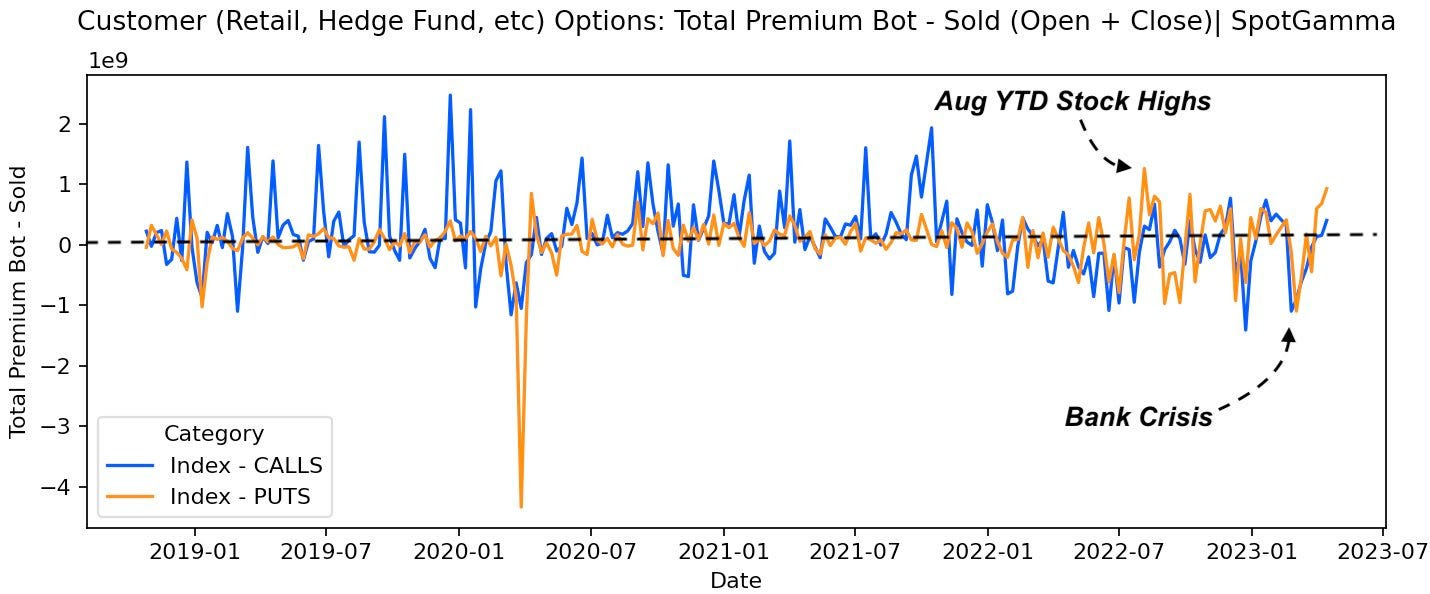
Quoting The Ambrus Group’s Kris Sidial, “When volatility starts to move, it moves at a higher rate than S&P volatility which is something that’s really important for the call option buyers,” which are stepping in aggressively as we’ve shown in the past letters.
Graphic: Retrieved from Piper Sandler Companies’ (NYSE: PIPR) Danny Kirsch. “With $VIX sitting at lowest level since early 2022, VIX call open interest approaching all-time highs reached in 2017/2018.”
About
Welcome to the Daily Brief by Physik Invest, a soon-to-launch research, consulting, trading, and asset management solutions provider. Learn about our origin story here, and consider subscribing for daily updates on the critical contexts that could lend to future market movement.
Separately, please don’t use this free letter as advice; all content is for informational purposes, and derivatives carry a substantial risk of loss. At this time, Capelj and Physik Invest, non-professional advisors, will never solicit others for capital or collect fees and disbursements. Separately, you may view this letter’s content calendar at this link.
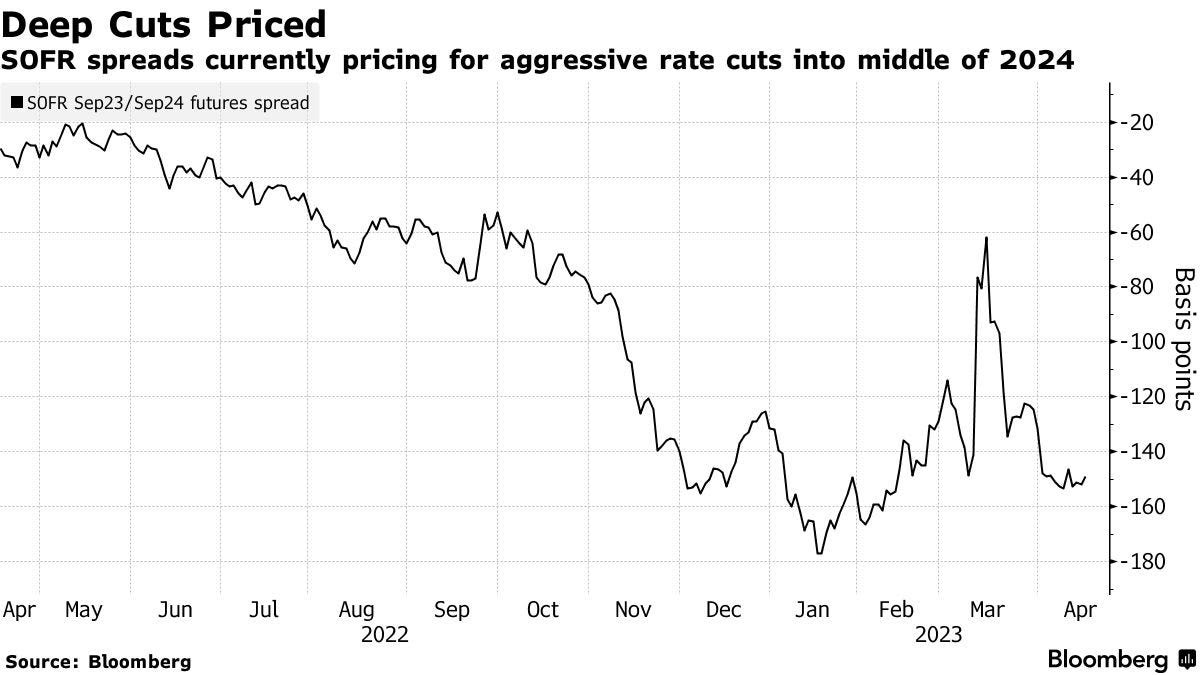
TD Securities said traders are not pricing in a large enough pivot.
Graphic: Retrieved from Bloomberg. The Secured Overnight Financing Rate future tracks “expectations for the Fed’s policy path.”
“We look for cut pricing to increase even further,” strategists led by Priya Misra said, noting they expect cuts totaling 2.75% from December 2023 to September 2024.
This opposes Goldman Sachs’ view that investors have priced too much easing and will reverse their position in response to improving data and high inflation readings.
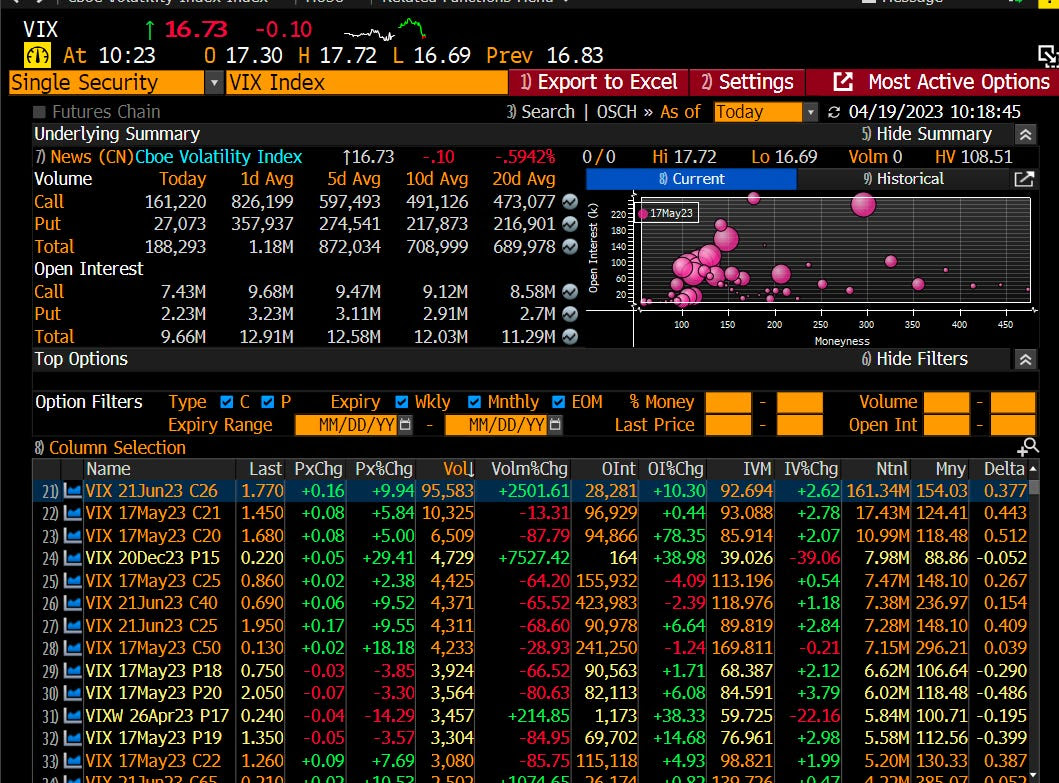
Regardless, a consensus is that rates will fall in the future and the economy will slow. Some traders are betting big on volatility, accordingly. The Ambrus Group’s Kris Sidial appeared on CNBC and elaborated.
Before the last time the Cboe Volatility Index or VIX spiked to 30 from similarly low levels, very large VIX call buying was observed. Recently, a large buyer of June 26 calls at $1.71 on 94,000 contracts, worth about $16 million in premium, was seen.
Graphic: Retrieved from Bloomberg via The Ambrus Group’s Kris Sidial.
“This is a pretty big bet in the VIX complex,” Sidial explained, adding that the VIX is a measure of variance. “When volatility starts to move, it moves at a higher rate than S&P volatility which is something that’s really important for the call option buyers.”
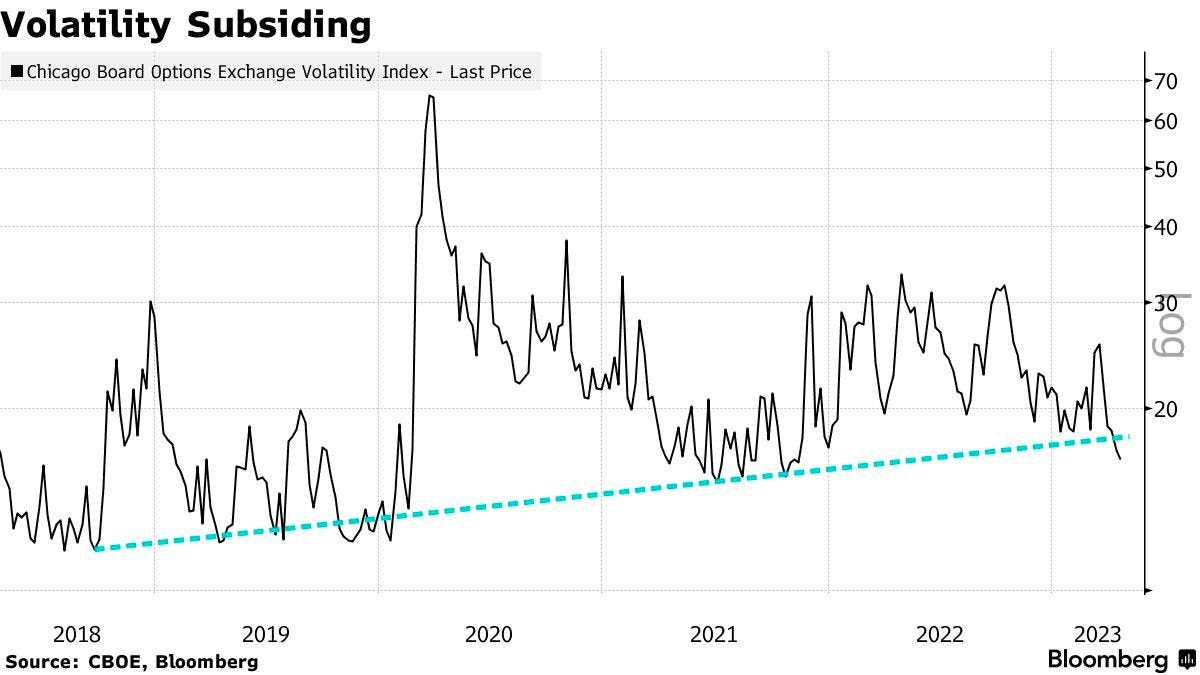
Bloomberg’s John Authers adds that the market’s hope of easing in the second half of the year is a reason for the low VIX. However, history suggests that rate cuts tend only to occur when the VIX exceeds its long-run average of 20.
Graphic: Retrieved from DataTrek Research via Bloomberg.
Authers explains that the widening gap between the implied volatility (IVOL) metrics of Treasury and equity markets, which have historically had a high correlation, is also a concern. This is partly what may have inspired the purchase of the VIX protection Sidial elaborated on; such gaps could portend more equity volatility.
Graphic: Retrieved from Bloomberg.
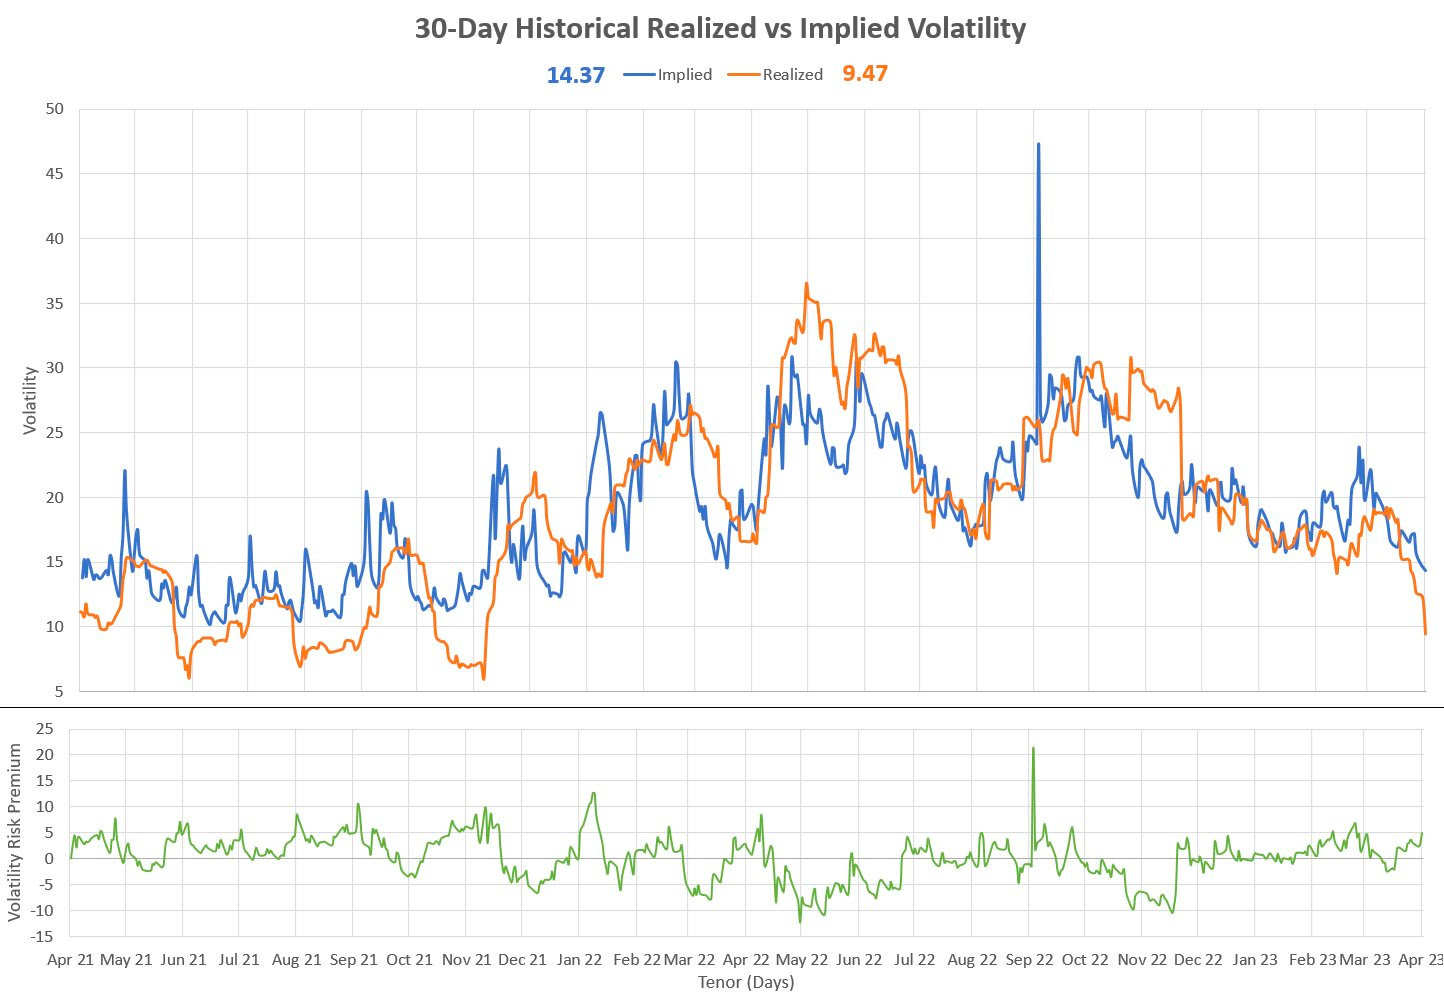
Notwithstanding, with the VIX near its average and trading at some premium to one-month realized volatility (RVOL), we may “see more systematic vol sellers make a comeback amid VIX contango, juicy VRP, and vol underperformance,” says Sergei Perfiliev. In such a case, markets may remain contained and bets on big market movements (e.g., the VIX trade detailed by Sidial) may not work that well.
It may be better for traders to limit their expectations and stay the course: buy call structures on weakness and monetize them into strength to finance put structures. Alternatively, define risk and enhance yield with short volatility bets, skewing them based on directional opinion (e.g., skewed iron condor), or get into risk-free and interest bearing assets (e.g., money market funds or box spreads). We covered this and more much better in a detailed research-type note soon to be released for public viewing. Stay tuned and watch your risk. PS: Sorry for the delay and rushed note!
Graphic: Retrieved from Sergei Perfiliev. “This is a 1-month vol – it’s 30 calendar days for implied and I’m using 20 trading days for realized – both of which represent a month.” Note that “juicy VRP = big difference between options’ implied vol (what you pay) and realized vol (what you got). Options are cheap historically, but expensive relative to realized vol.”
About
Welcome to the Daily Brief by Physik Invest, a soon-to-launch research, consulting, trading, and asset management solutions provider. Learn about our origin story here, and consider subscribing for daily updates on the critical contexts that could lend to future market movement.
Separately, please don’t use this free letter as advice; all content is for informational purposes, and derivatives carry a substantial risk of loss. At this time, Capelj and Physik Invest, non-professional advisors, will never solicit others for capital or collect fees and disbursements. Separately, you may view this letter’s content calendar at this link.
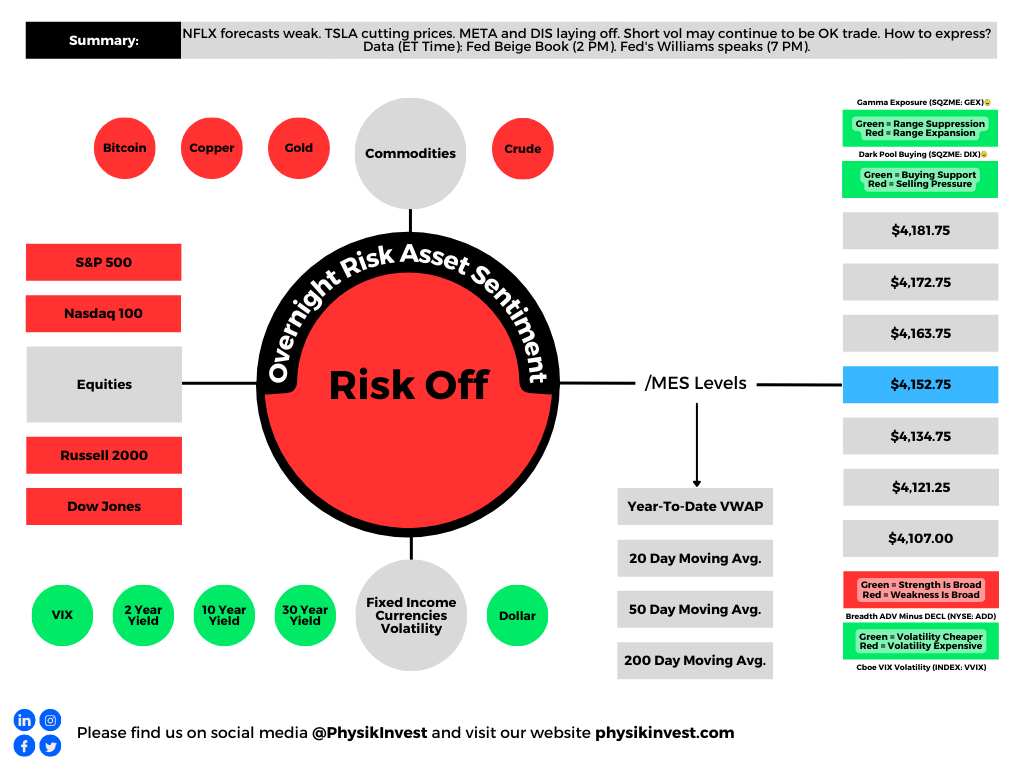
Big news includes Netflix Inc (NASDAQ: NFLX) beating earnings estimates but having a weaker-than-expected forecast, Tesla Inc (NASDAQ: TSLA) cutting prices the sixth time this year, Meta Platforms Inc (NASDAQ: META) and Walt Disney Co (NYSE: DIS) commencing layoffs, and mortgage rates edging higher to ~6.4%.
Graphic: Retrieved from Bloomberg. “US mortgage rates increased last week by the most in two months to 6.43%, denting already sluggish demand.”
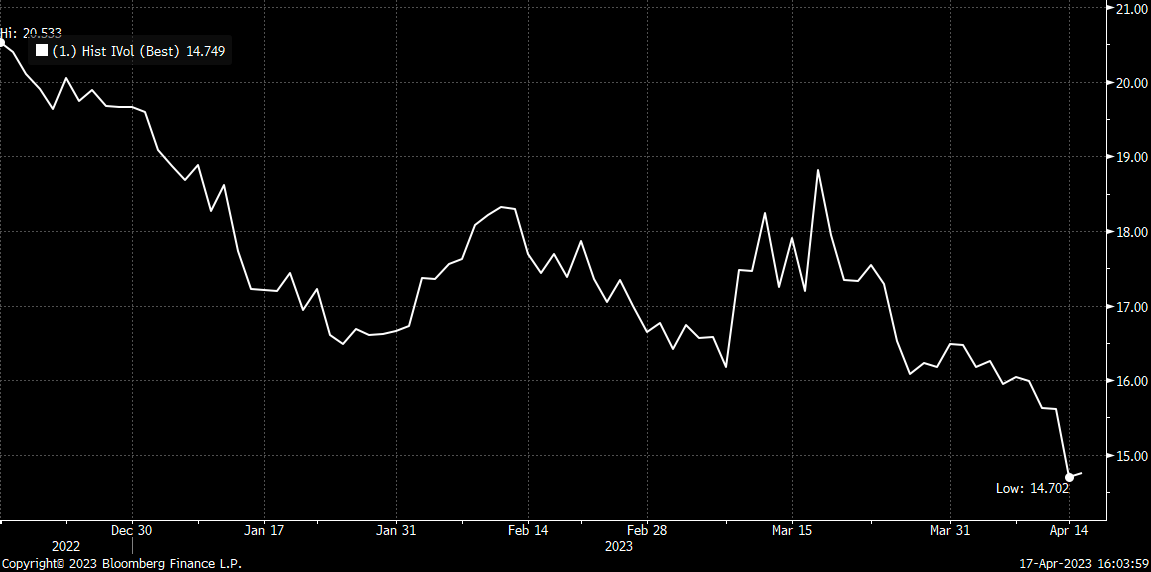
Equity markets are down, and equity implied volatility (IVOL) measures, including the Cboe Volatility Index or VIX, are climbing. Notwithstanding, the trend lower in IVOL is intact, and that’s good for traders biased short volatility.
Graphic: Retrieved from Bloomberg via Danny Kirsch of Piper Sandler Companies (NYSE: PIPR). Call option volatility for the $4,150.00 strike. May monthly expiration.
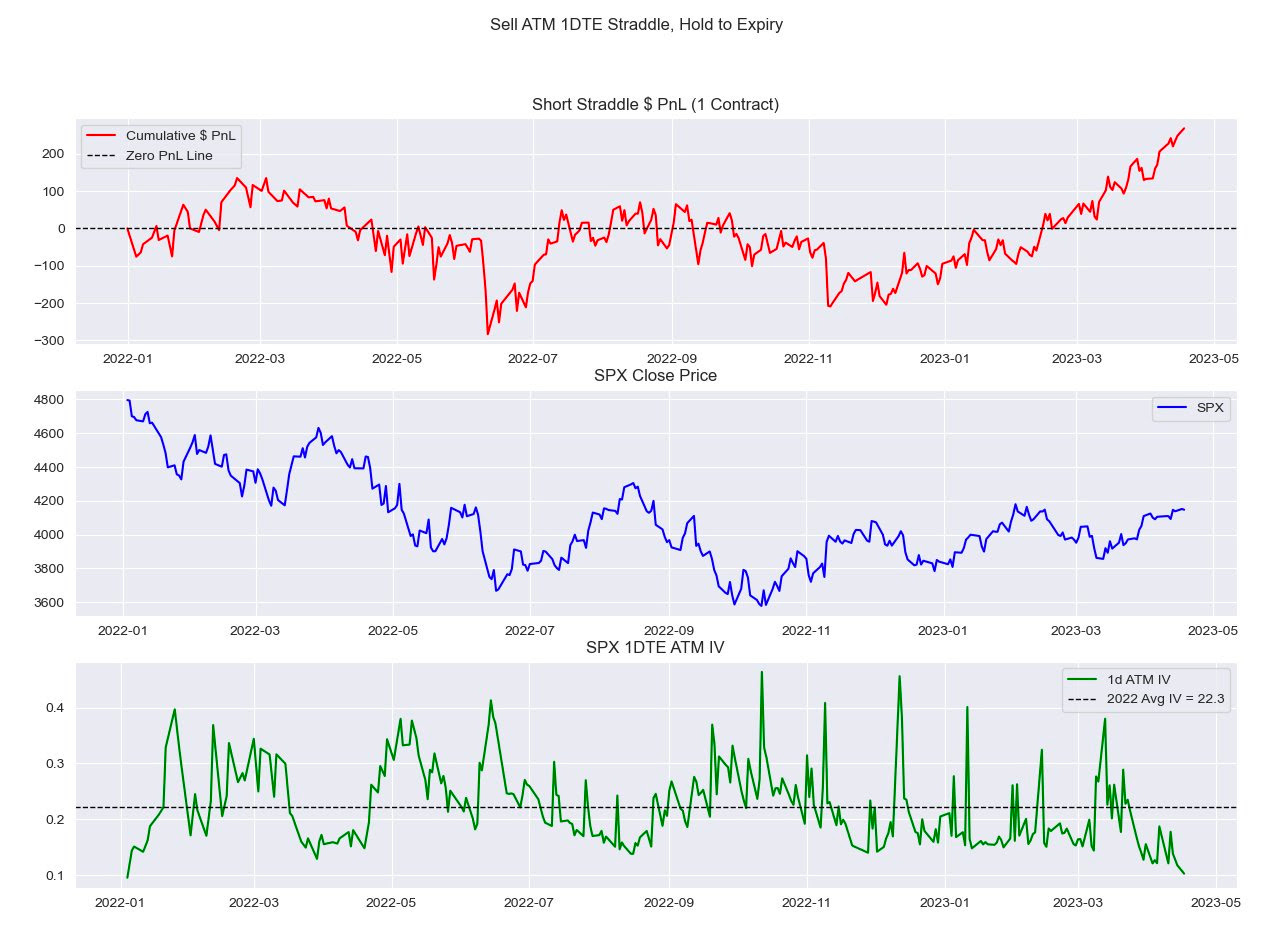
“With all the focus [on S&P 500 (INDEX: SPX)] 0 DTE lately, I look at how expensive these have been since 2022,” IPS Strategic Capital’s Pat Hennessy says, referencing a backtest he conducted selling a 1 DTE straddle and holding till maturity.
“Performance since the November CPI has been stellar, with a 63% win rate and an average gain of $20.00.”
Graphic: Retrieved from IPS Strategic Capital’s Pat Hennessy.
Volatility trader Darrin John agrees, noting volatility remains expensive, a detriment to those who may be biased long volatility.
“The VRP is so wide across all of the tenors I track,” John elaborates. “It’s going to be hard for gamma buyers to cover daily theta bills.”
Clouds are appearing on the horizon, however, and the trend higher (lower) in stocks (volatility) may not last. Bloomberg forecasts the largest fall in SPX earnings since the start of 2020. Notwithstanding, strength can continue for longer …
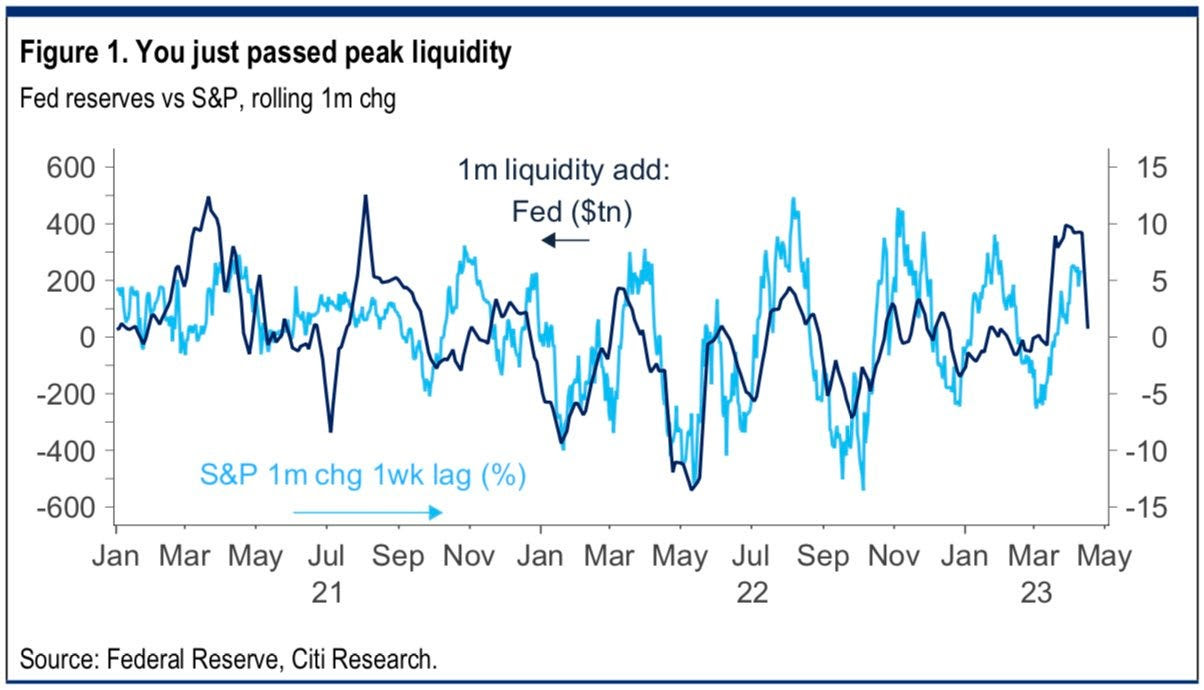
Graphic: Retrieved from Citigroup Inc Research (NYSE: C) via @tr8derz. “YTD rally stems from $1tn in CB liquidity. High-frequency indicators suggest this is already stalling, and coming weeks seem increasingly likely to bring a sharp reversal. Higher TGA and RRP, ECB QT and reduced China easing could easily see a net drain of some $6-800bn.”
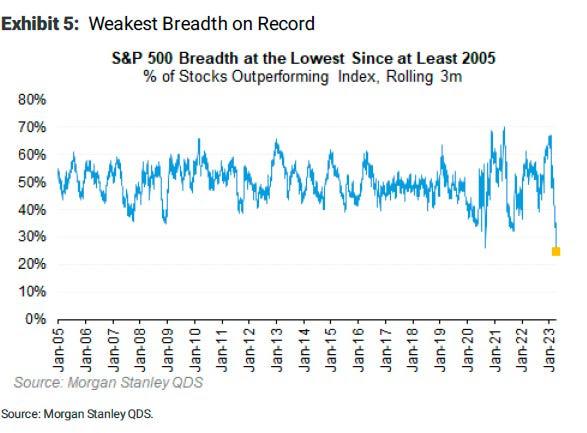
… even with the SPX breadth reading poor. The SPX has rallied with multiples rising; strength came with positive earnings surprises, bond demand, and other things.
Graphic: Retrieved from Morgan Stanley (NYSE: MS) via Bloomberg.
Hence, at the risk of sounding like a broken record, the low-cost call structures we’ve talked about in the past remain attractive.
If markets move higher, you can monetize and roll profits into put spreads (i.e., buy put and sell another at a lower strike). This may work well if JPMorgan Chase & Co’s (NYSE: JPM) call that “even a mild recession would warrant retesting the previous lows” is realized.
Such structures work well as “a big pop in the market can result in a decent drop in the VIX…and vice versa, a market sell-off will result in a greater increase in the VIX now than it did in 2022,” says Alpha Exchange.
Alternatively, lean neutral and buy into cash or bonds yielding 4-5%. Some long box spreads yield 5.4% as of yesterday’s close.
In other news, Physik Invest’s first in-depth note is nearing completion and will be available for public viewing in short order. Take care and watch your risk!
About
Welcome to the Daily Brief by Physik Invest, a soon-to-launch research, consulting, trading, and asset management solutions provider. Learn about our origin story here, and consider subscribing for daily updates on the critical contexts that could lend to future market movement.
Separately, please don’t use this free letter as advice; all content is for informational purposes, and derivatives carry a substantial risk of loss. At this time, Capelj and Physik Invest, non-professional advisors, will never solicit others for capital or collect fees and disbursements. Separately, you may view this letter’s content calendar at this link.
Bank of America Corporation (NYSE: BAC) sees allocations to equities versus bonds falling. That’s amid recession fears. Per EPB, “the cyclical economy has just started to shed jobs today, and leading indicators signal the recession is likely underway.”
“To get advanced warning of recessions, you must look at the construction and manufacturing sectors, even though these two sectors are only 13% of the labor market,” EPB adds, noting traditional indicators’ weakening predictability is not so great to ignore the insight. “It’s clear that the composition of traditional leading indicators remains appropriate, and thus, the current resounding recessionary signal should not be ignored.”
BAC strategist Michael Hartnett said, though, that this “consensus lust for recession” must soon be satisfied. Otherwise, the “pain trade” would be even higher yields and stocks; the S&P 500 (INDEX: SPX) is enjoying an accelerated rally which Jefferies Financial Group (NYSE: JEF) strategists think portends a period of flatness, now, over the coming weeks …
Graphic: Retrieved from Jefferies Financial Group (NYSE: JEF) via The Market Ear.
… and through options expiration (OpEx), typically a poor performance period for the SPX.
Beyond the uninspiring fundamentals, the positioning contexts are supportive. Recall our letters published earlier this year. If the market consolidated and failed to break substantially, then falling implied volatility (IVOL) and time passing would bolster markets and, potentially, help build a platform for a rally into mid-year. A check of fixed-strike and top-line measures of IVOL like the Cboe Volatility Index or VIX confirms options activities are keeping markets intact.
Graphic: Retrieved from Danny Kirsch of Piper Sandler (NYSE: PIPR). “SPX May $4,150.00 call volatility, the lack of realized volatility weighing on the market. Volatility low, not cheap.”
Beyond the rotation into shorter-dated options, just one of the factors exacerbating the decimation of longer-dated volatility, traders’ consensus is that markets won’t move a lot and/or they don’t need to hedge over longer time horizons; traders want punchier exposure to realized volatility (RVOL), and that they can get through shorter-dated options that have more gamma (i.e., exposure to changes in movement), not vega (i.e., exposure to changes in implied volatility).
Graphic: Retrieved from Goldman Sachs Group Inc (NYSE: GS) via Bloomberg.
Consequently, counterparties may be less dangerous to accelerating movement in either direction; hence, the growing likelihood of a period of flatness.
“Despite the collapse in the 1-month realized volatility, we suspect most vol control funds have scaled into using their longer-term realized vols, which by design, lead to less aggressive rebalancing flows,” Tier1Alpha says. “For example, the 3-month rVol, which is currently driving our model, was essentially unchanged yesterday, which means volatility targets were maintained, and very little additional rebalancing had to occur. So even with the decline in the 1-month vol, overall risk exposure remained the same.”
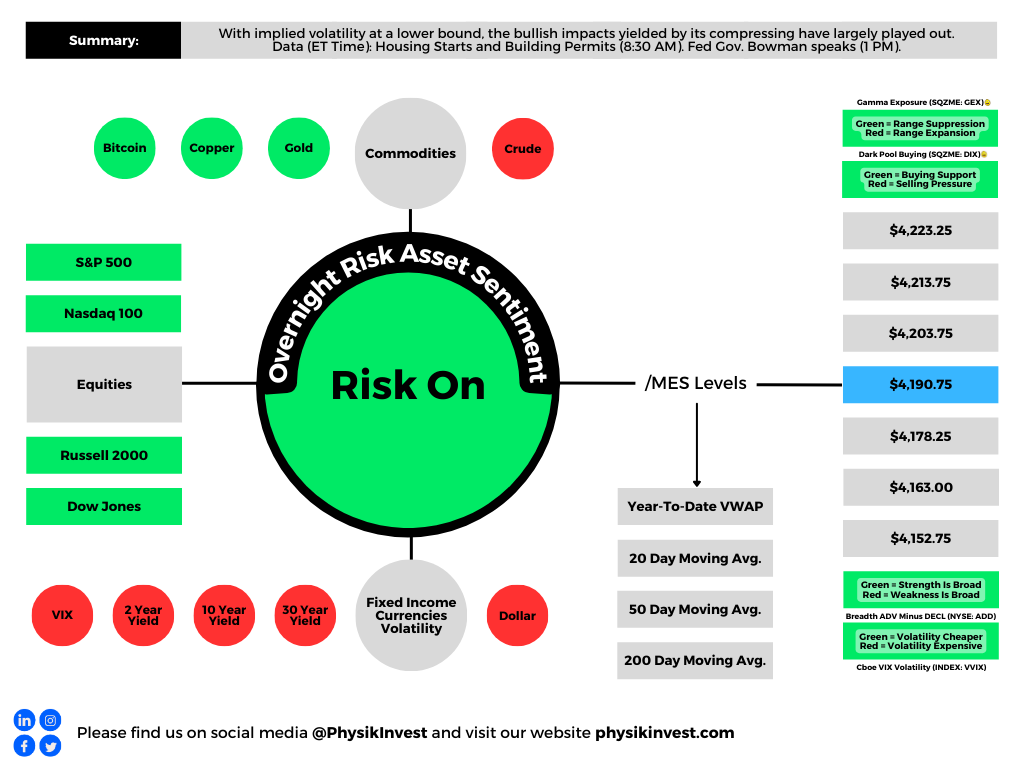
With IVOL at a lower bound, the bullish impacts yielded by its compressing have largely played out. There may be more to be gained by movements higher in IVOL, in addition to the expiry of many call options this OpEx. By owning protection, particularly far from current prices, you are positioned to monetize on the market downside and non-linear repricings of volatility, as this letter has discussed in recent history. The caveat is that volatility can cluster and revert for longer; hence, your structure matters.
“I am concerned that VIX is underpricing the series of events that we know to expect over the coming weeks,” says Interactive Brokers Group Inc’s (NASDAQ: IBKR) Steve Sosnick. “While there is now an 88% implied likelihood of a 25 basis point hike, the likely path of any potential future hikes and assumed cuts should be more clarified at the meeting and in its aftermath. And oh, has anyone ever heard the expression “sell in May and go away?”
Graphic: Retrieved from Interactive Brokers Group Inc (NASDAQ: IBKR).
With call skews far up meaningfully steep in some products, still-present low- and zero-cost call structures this letter has talked about in the past remain attractive. If the market falls apart, your costs are low, and losses are minimal. If markets move higher into a “more combustible” position, wherein “volatility is sticky into a rally,” you may monetize your call structures and roll some of those profits into bear put spreads (i.e., buy put and sell another at a lower strike). An alternative option is neutral. Own something such as a T-bill or box spread (i.e., buy call and sell put at one strike and sell call and buy put at another higher strike). Some boxes are yielding upwards of 5.4% as of yesterday’s close.
To end, though the short-dated options activity may prompt cascading events in market downturns, the main issue is the reduced use of longer-dated options; a supply and demand imbalance likely resolves itself with an implied volatility repricing of a great size where longer-dated options outperform those that are shorter-dated.
Our locking in of rates or using the profits of call structures to position for a potential IVOL repricing, particularly in the back half of the year when dealer positioning is less clear, buybacks are to fall off of a cliff, rates may fall, and the boost from short-covering has played its course, is an attractive proposition given the context.
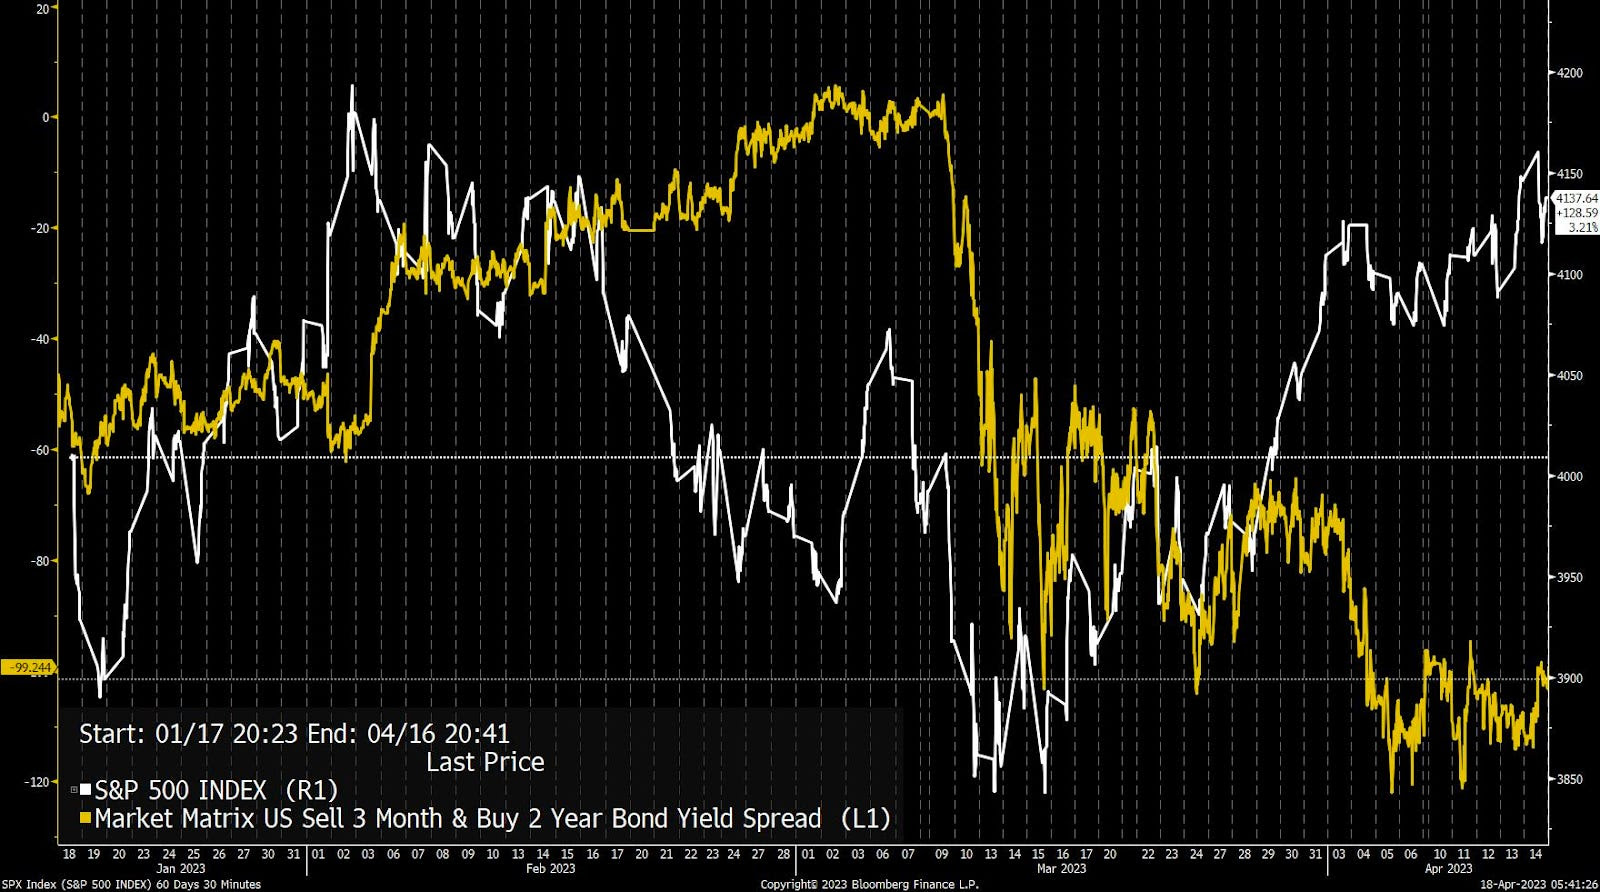
Graphic: Retrieved from Bloomberg. “The S&P 500 (white line) is well above its levels from early March, while the yield on the 3m-2y spread remains in a deep inversion, signifying meaningful expectations of cuts in the months ahead.”
About
Welcome to the Daily Brief by Physik Invest, a soon-to-launch research, consulting, trading, and asset management solutions provider. Learn about our origin story here, and consider subscribing for daily updates on the critical contexts that could lend to future market movement.
Separately, please don’t use this free letter as advice; all content is for informational purposes, and derivatives carry a substantial risk of loss. At this time, Capelj and Physik Invest, non-professional advisors, will never solicit others for capital or collect fees and disbursements. Separately, you may view this letter’s content calendar at this link.