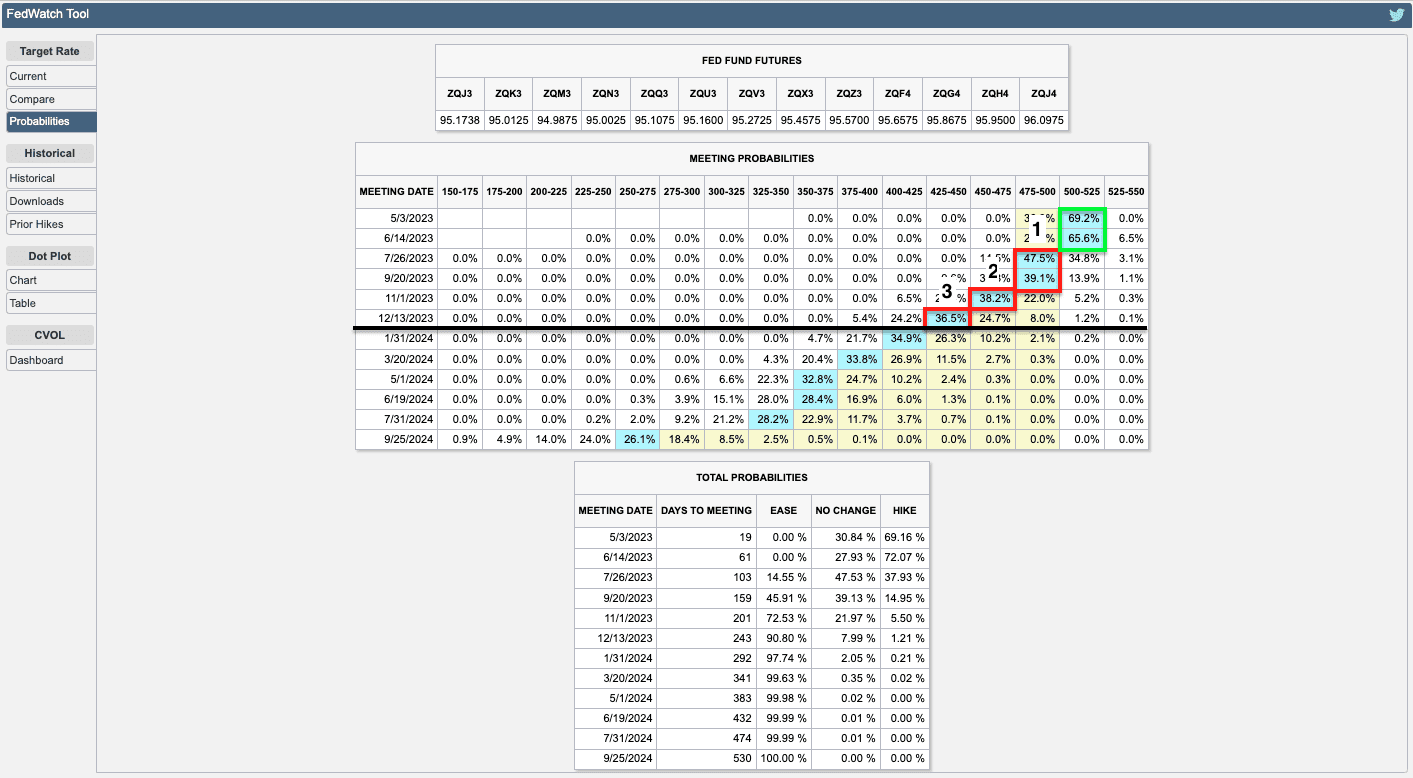
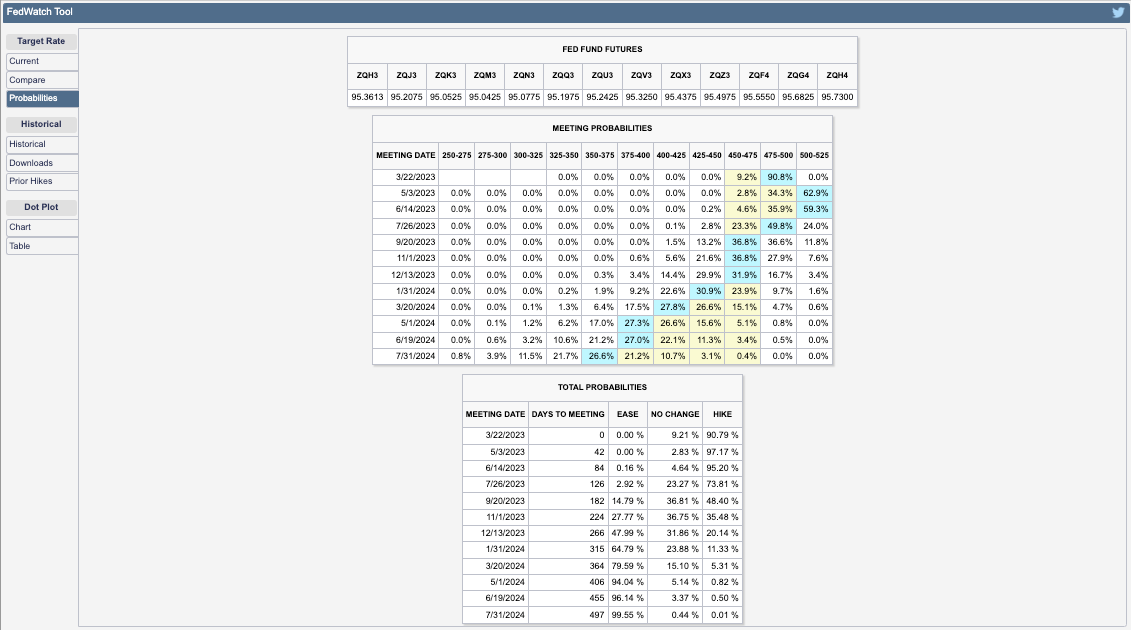
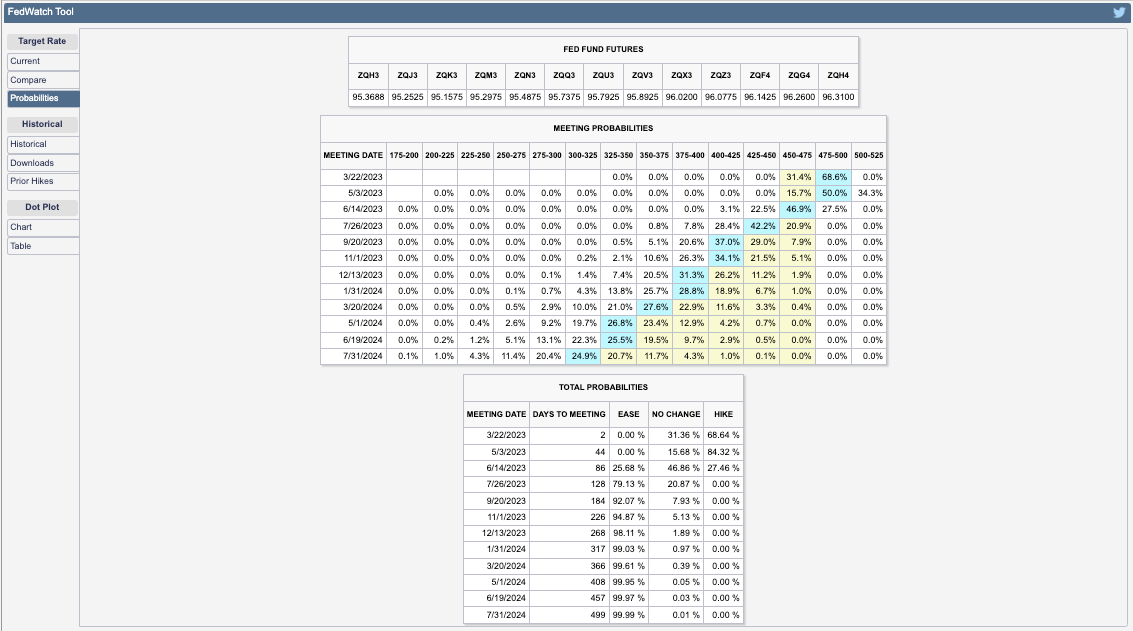
Consensus is a tightening cycle that climaxes on May3 with one final 25 basis point hike. Most traders price three cuts after—one in July, November, and December.
Note: After the release of strong bank earnings today, this analysis remains intact.
Graphic: Retrieved from CME Group Inc (NASDAQ: CME).
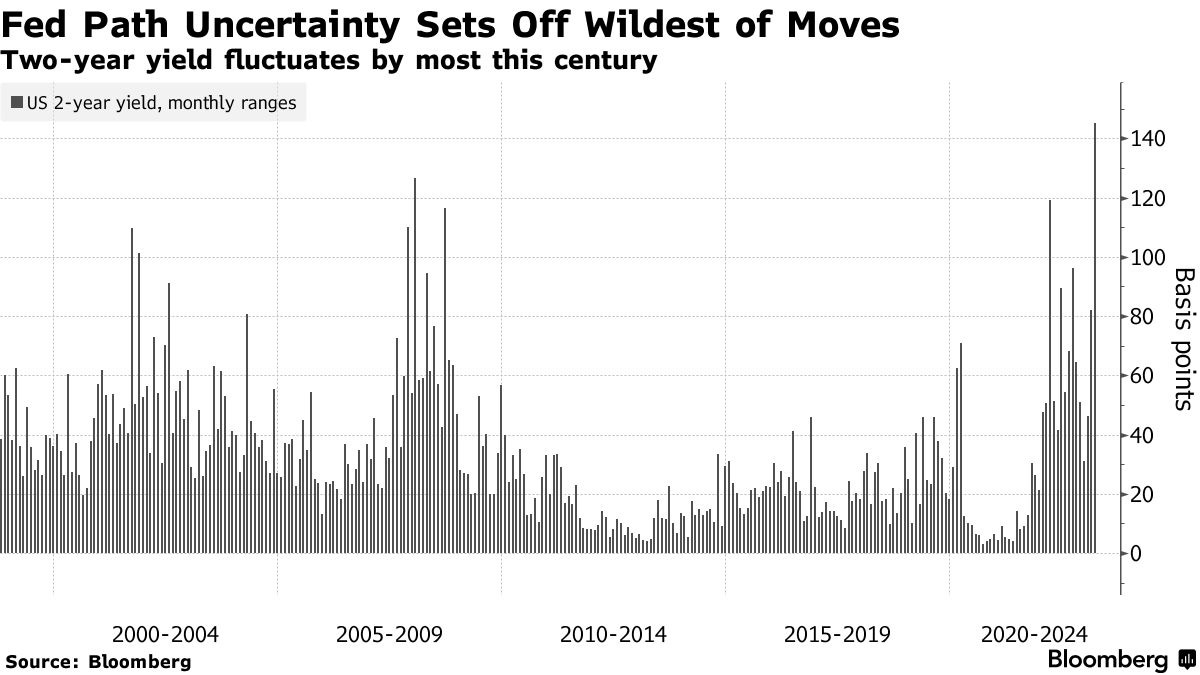
Though policymakers are successful in walking up traders’ interest rate expectations, the long end of the yield curve hasn’t budged much; despite the response to banking turmoil helping “calm conditions, … and lessen the near-term risks,” many believe the Fed will have to pivot, soon.
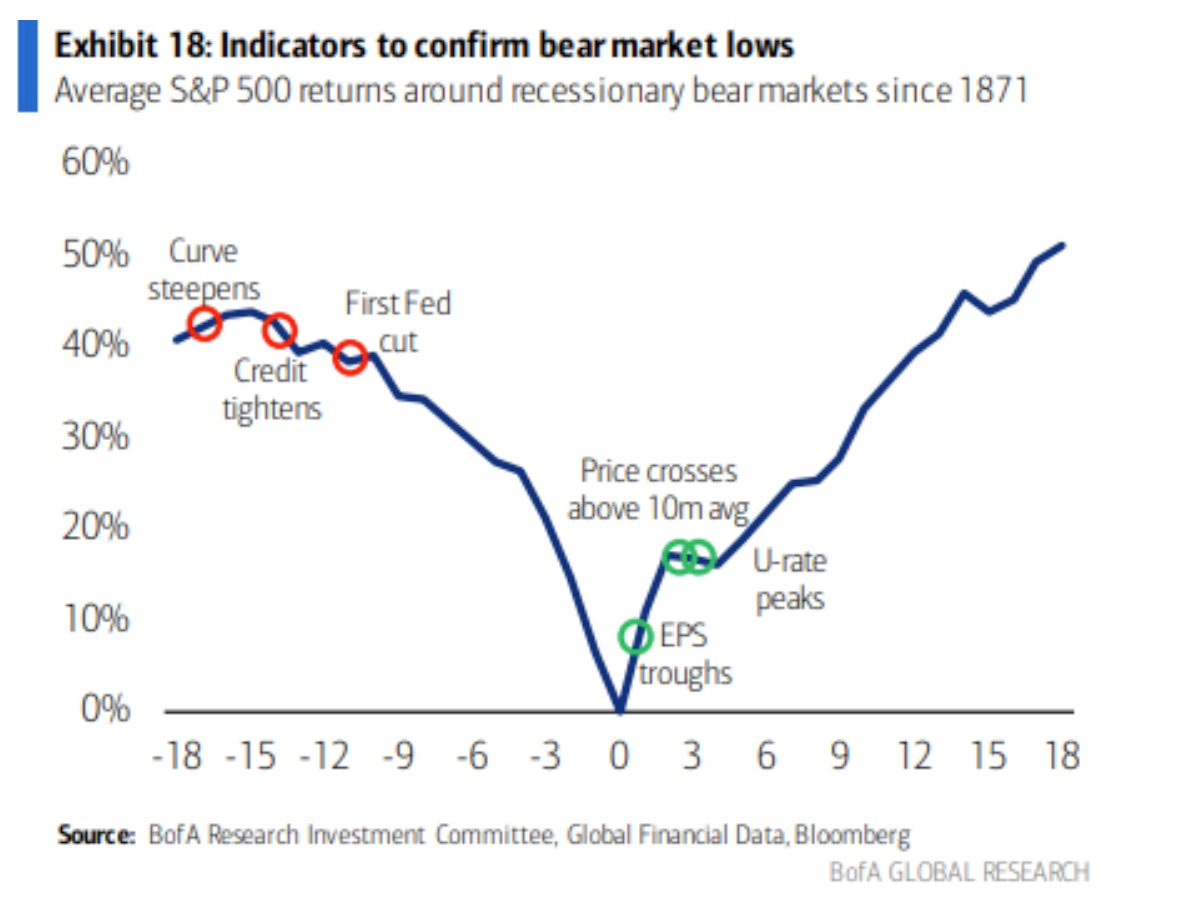
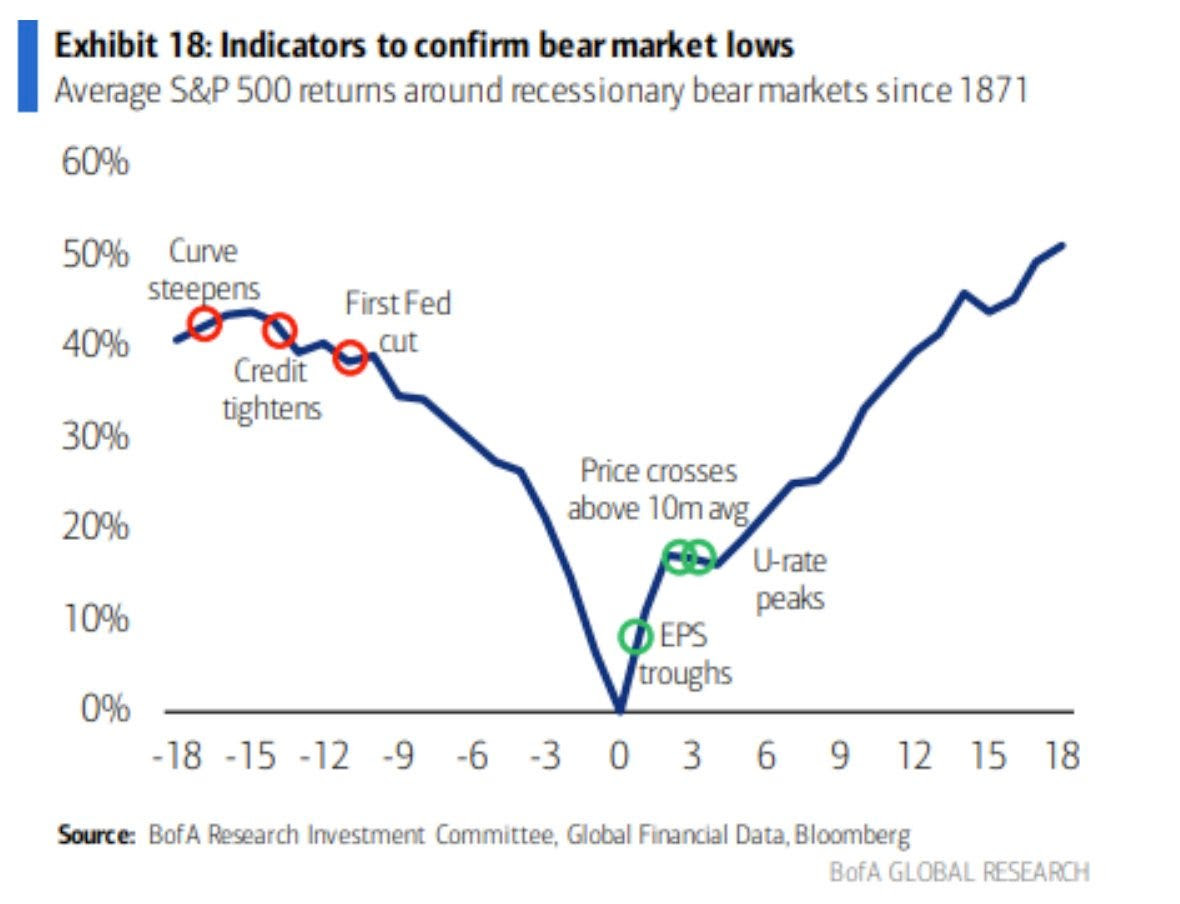
The Federal Reserve’s ranks expect a “mild recession,” too, validating people such as Bank of America Corporation’s (NYSE: BAC) Michael Hartnett, who said investors should steer clear of stocks. Hartnett added the expectations of a recession would solidify following the upcoming earnings season, a test of how companies have managed headwinds like the bank crisis and slowing demand.
Graphic: Retrieved from Bank of America Corporation (NYSE: BAC).
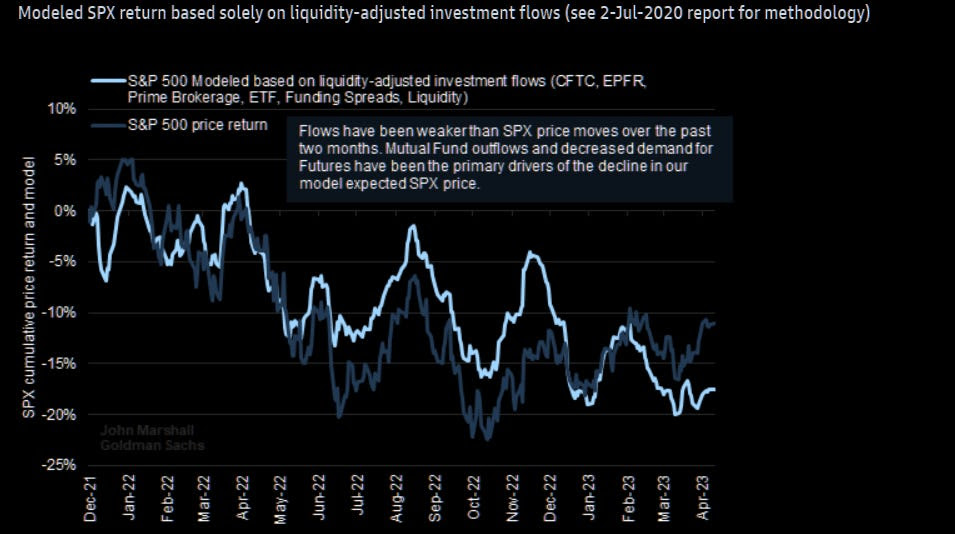
Despite billions in redemptions over the past week or so, the market’sstrengthcan continue for longer, though. Here’s why.
Graphic: Retrieved from Goldman Sachs Group Inc (NYSE: GS) via The Market Ear.
Contextually, positioning overwhelmingly supports the market at this juncture. That’s per the likes of Cem Karsan of Kai Volatility have explained.
Falling volatility has led to billions more in buying flows from volatility-controlled funds rebalancing their risk exposures, Tier1Alpha adds, noting “there is a chance realized volatility [or RVOL] will continue to decrease until the end of next week as long as the SPX returns stay muted. If volatility rises beyond the +/- 2% threshold, net equity sales could exceed $5 billion.”
“This is not expected due to favorable CPI data and dealer positioning,” however.
With markets likely to be contained in the short to medium term, and fundamental weaknesses, such as the Fed hiking long-end yields, likely to cause them to fail in the long run—play near- or medium-term strength via call spread structures, and use the profits to lower the cost of longer-dated bets on markets or rates falling.
In support of this view, per The Market Ear’s summary of some Goldman Sachs Group Inc (NYSE: GS) analyses, “the disconnect between Nasdaq 100 (INDEX: NDX) and bond yields has grown to statistically significant levels.” Thus, “owning downside asymmetry” is starting to look “more attractive.”
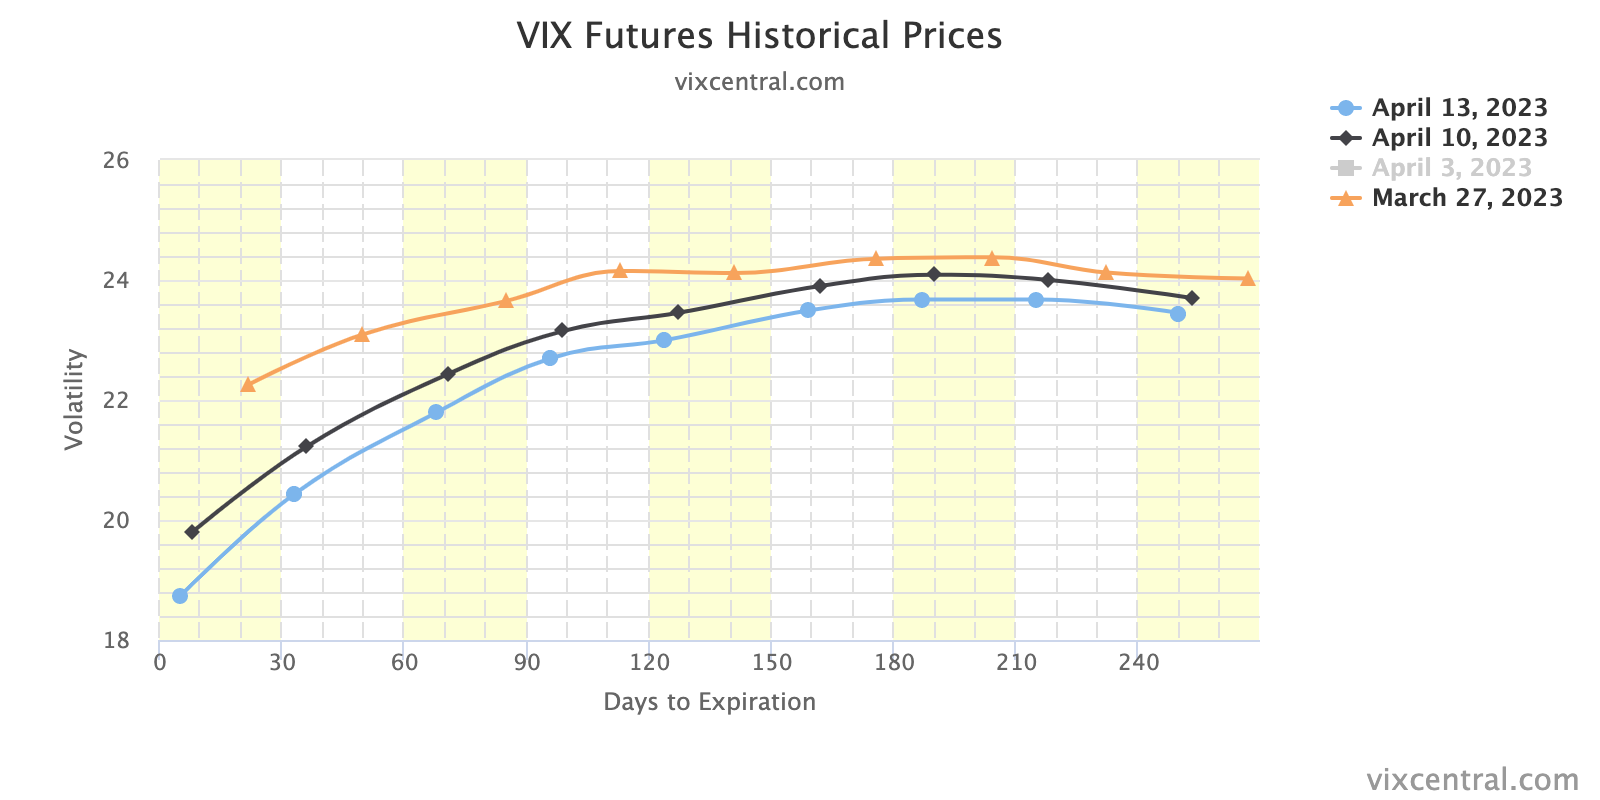
Graphic: Retrieved from VIX Central. The compression of implied volatility, or IVOL, is a booster for equities. Investors are mostly bullish with a +1 Put, +100 Stock, -1 Call position, while dealers hold the opposite with a -1 Put, -100 Stock, +1 Call position. As the volatility trends lower (e.g., S&P 500 realized volatility or RVOL is ~10), options lose value, and dealers must buy back their short stock to re-hedge. This supports the market.
About
Welcome to the Daily Brief by Physik Invest, a soon-to-launch research, consulting, trading, and asset management solutions provider. Learn about our origin story here, and consider subscribing for daily updates on the critical contexts that could lend to future market movement.
Separately, please don’t use this free letter as advice; all content is for informational purposes, and derivatives carry a substantial risk of loss. At this time, Capelj and Physik Invest, non-professional advisors, will never solicit others for capital or collect fees and disbursements. Separately, you may view this letter’s content calendar at this link.
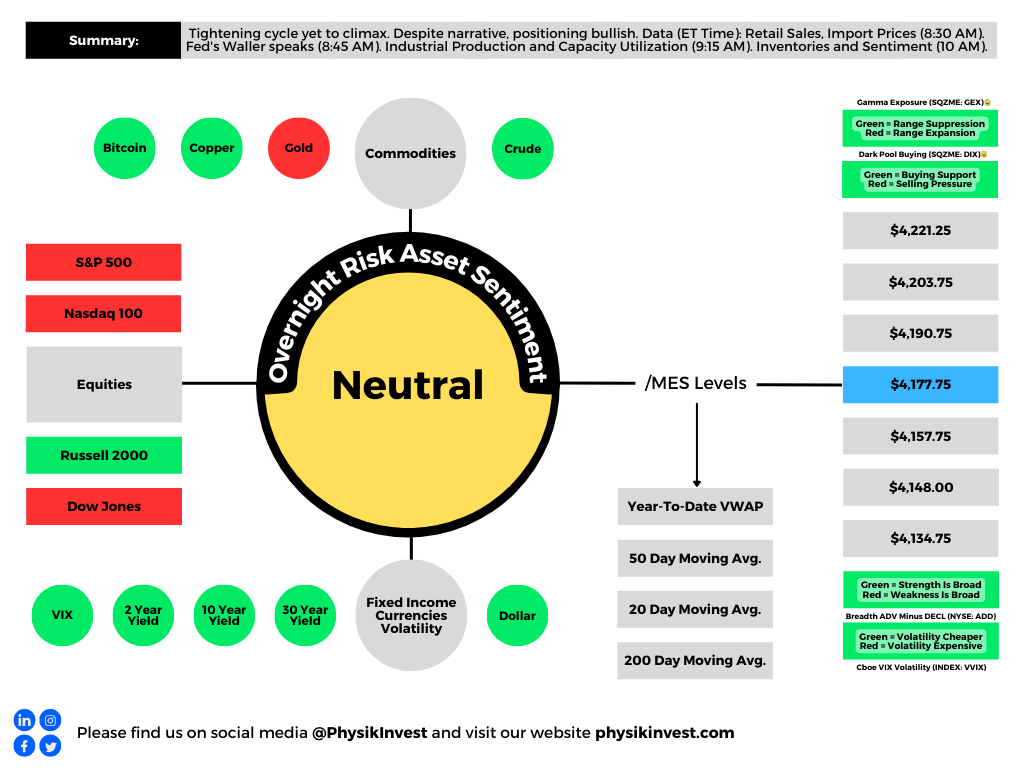
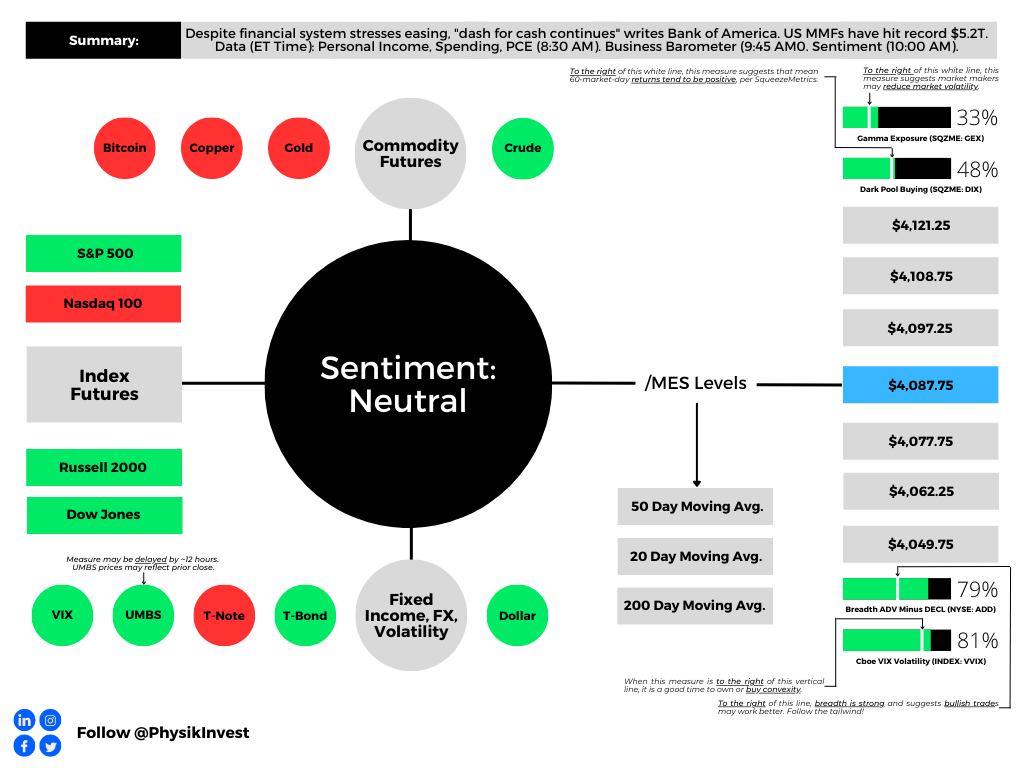
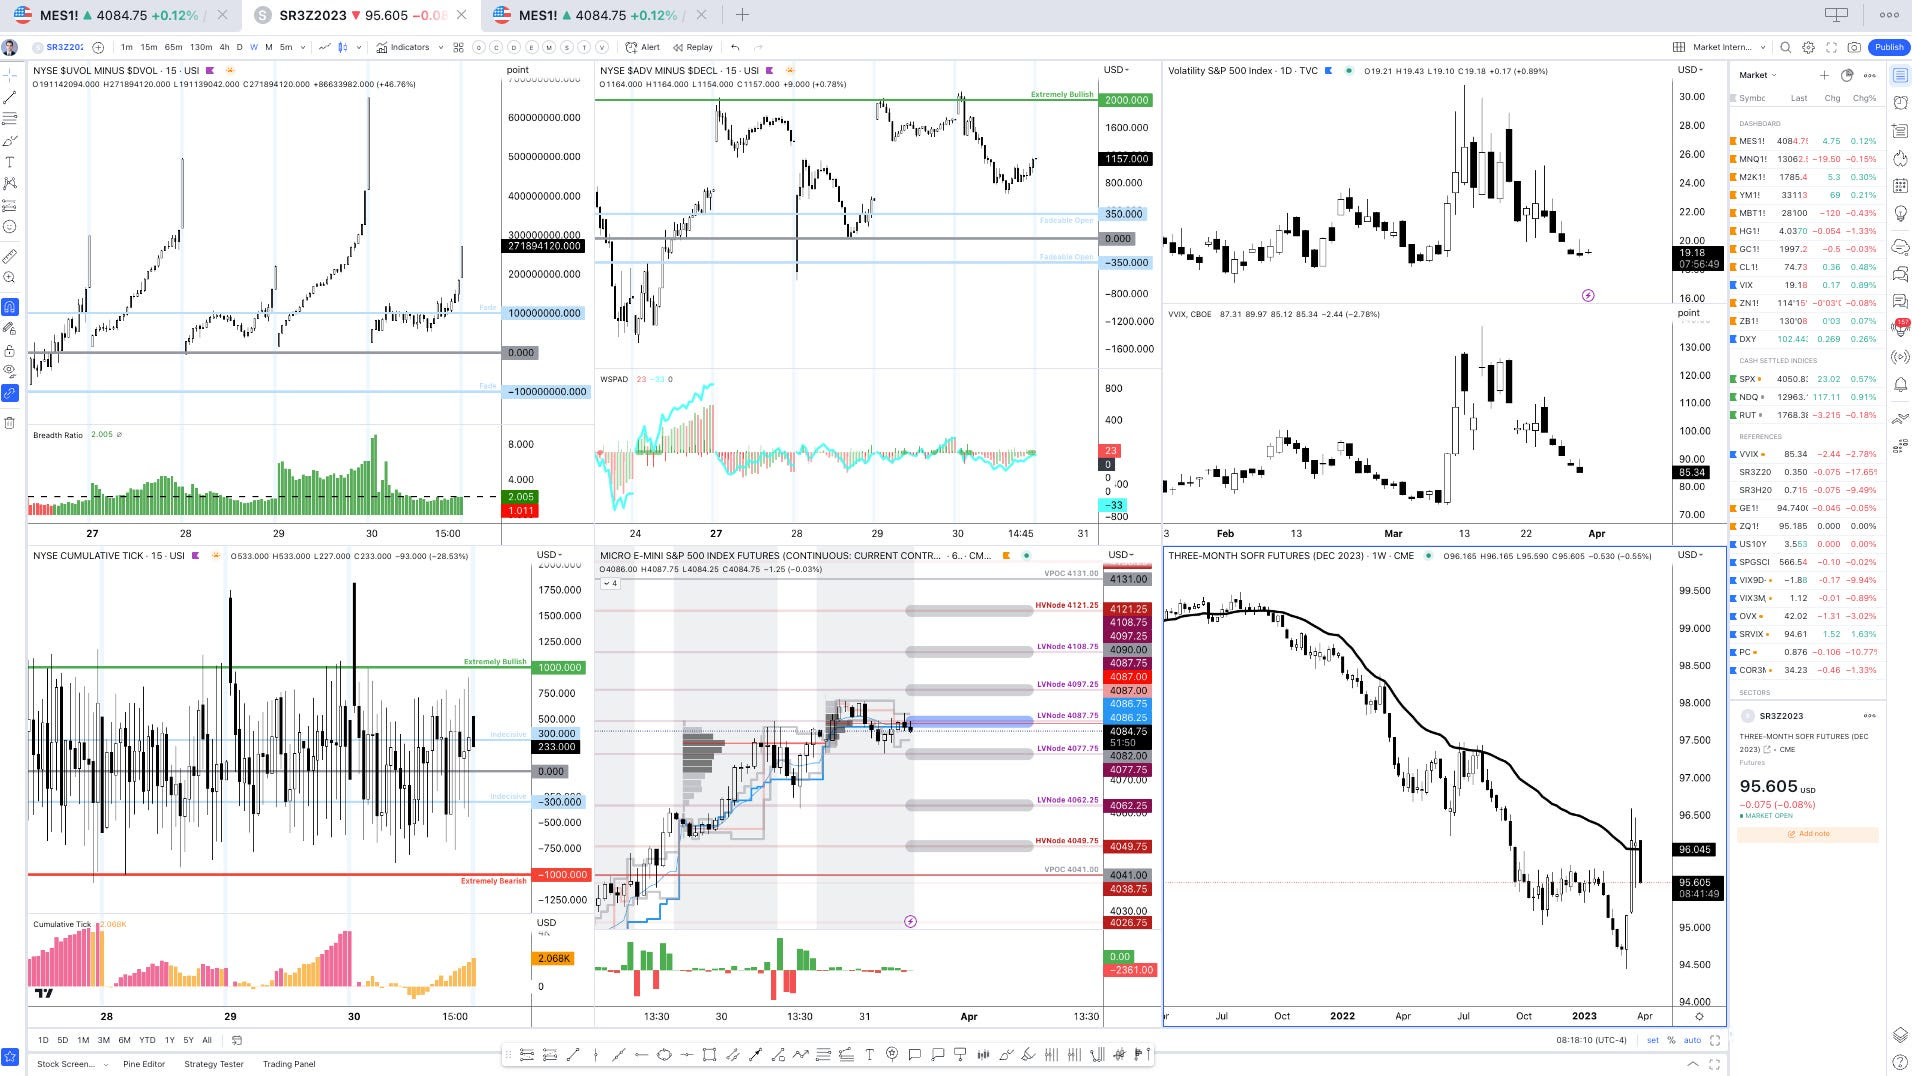
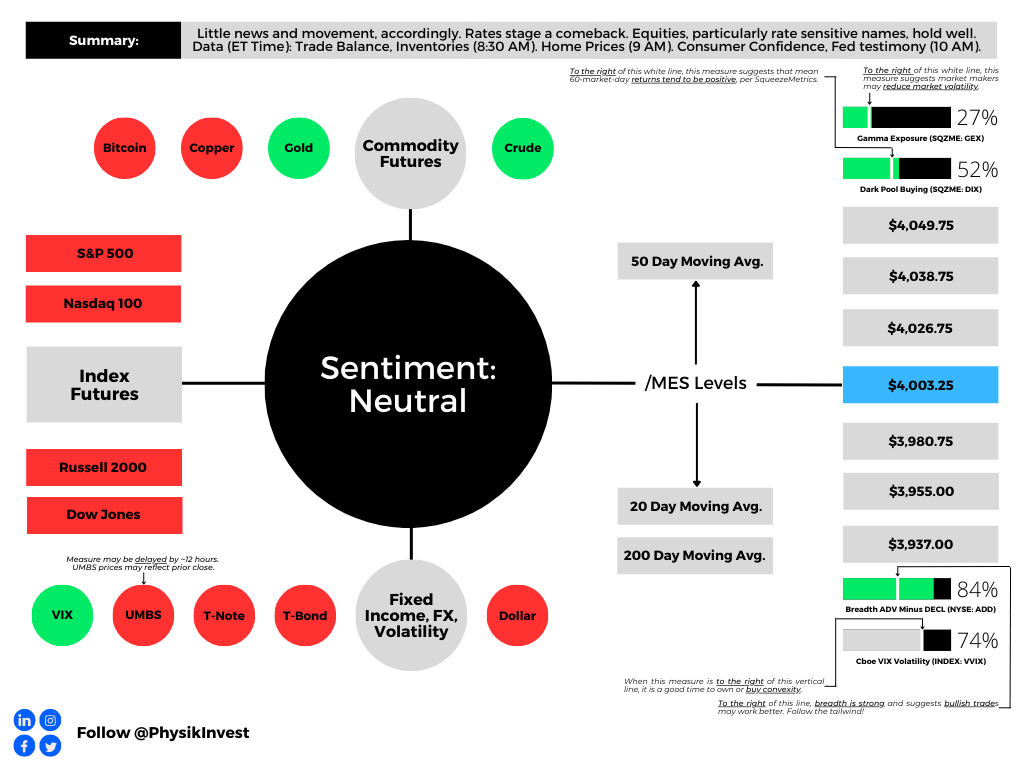
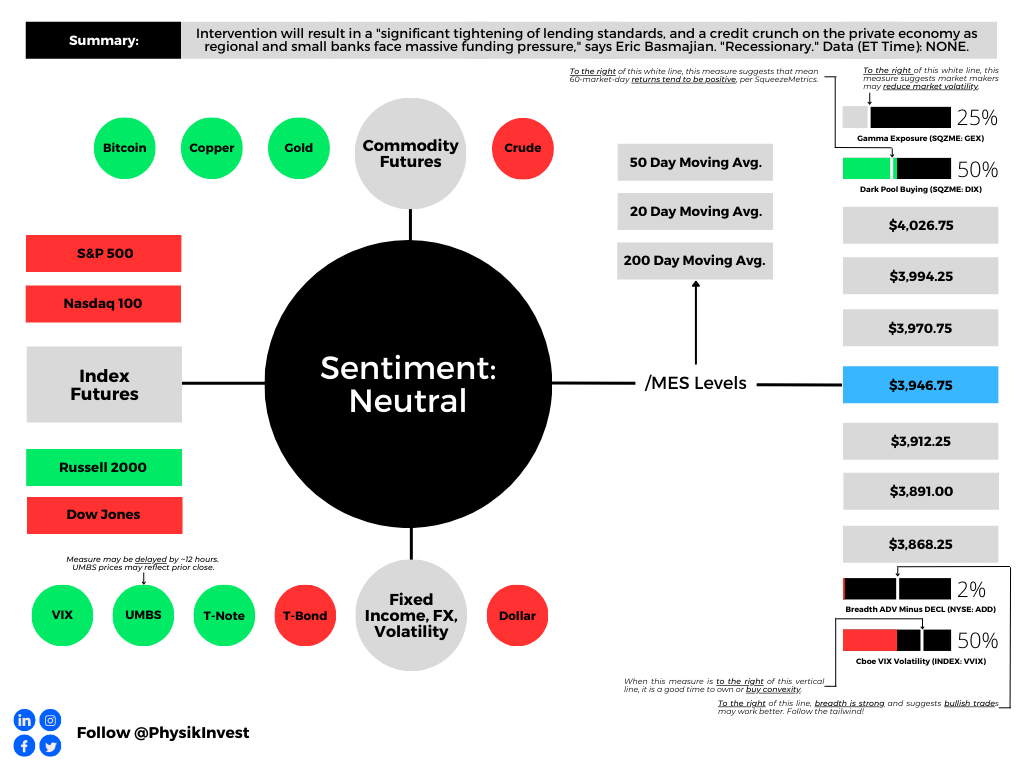
Graphic updated 8:00 AM ET. Sentiment Neutral if expected /MES open is inside of the prior day’s range. /MES levels are derived from the profile graphic at the bottom of this letter. Click here for the latest levels. SqueezeMetrics Dark Pool Index (DIX) and Gamma (GEX) with the latter calculated based on where the prior day’s reading falls with respect to the MAX and MIN of all occurrences available. A higher DIX is bullish. The lower the GEX, the more (expected) volatility. Click to learn the implications of volatility, direction, and moneyness. Breadth reflects a reading of the prior day’s NYSE Advance/Decline indicator. The CBOE VIX Volatility Index (INDEX: VVIX) reflects the attractiveness of owning volatility. UMBS prices via MND. Click here for the economic calendar.
Administrative
Keeping it brief for today. Enjoy your Friday. Be opportunistic and watch your risk.
Positioning
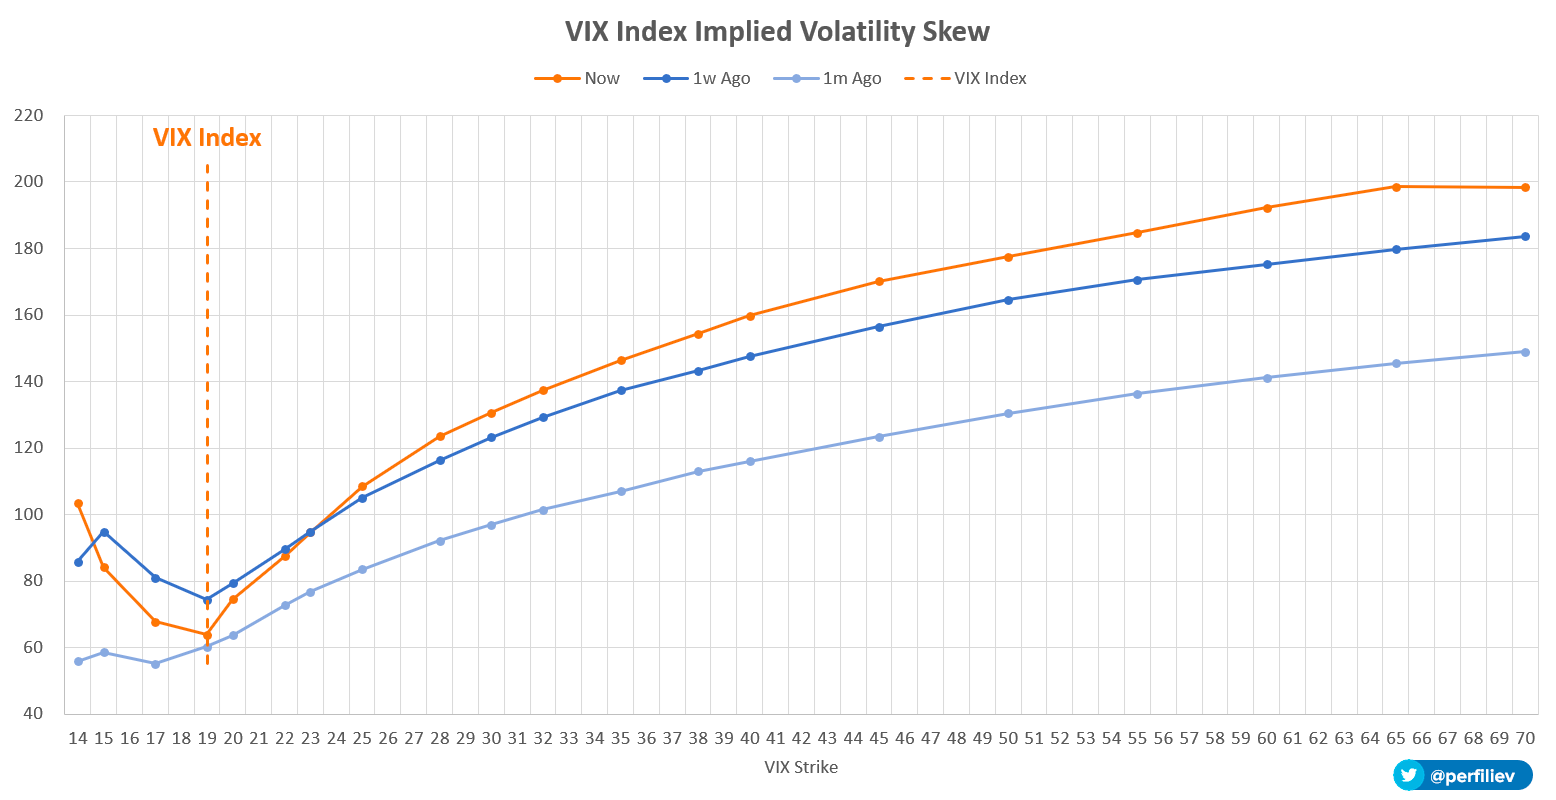
For days prior, top-line measures of implied volatility or IVOL like the Cboe Volatility Index (INDEX: VIX) fell, as did the Cboe VIX Volatility Index (INDEX: VVIX), the latter which is a way to gauge the expensiveness of IVOL or convexity. It was, in part, the resolution of a recent liquidity crisis that prompted this to happen. Under the hood, volatility skew told a different story; traders were hedging against tail outcomes.
Even so, this hedging and volatility skew behavior did little to boost the pricing of most spread structures above and below the market we analyzed. The non-stickiness of IVOL into this rally may have been detrimental to the more expensive call options structures, as we expected; hence, our consistent belief that structures should be kept at low- or no-cost.
The environment changed yesterday, however. Both top- and bottom-line measures of IVOL were sticky into equity market strength. This was observed via the pricing of spread structures (e.g., verticals and back- and ratio-spreads) structured above and below the market. The stickiness of volatility seemed to impact most the put side of the market. Some savvy traders may have been able to build spread structures below the market at a lesser cost potentially.
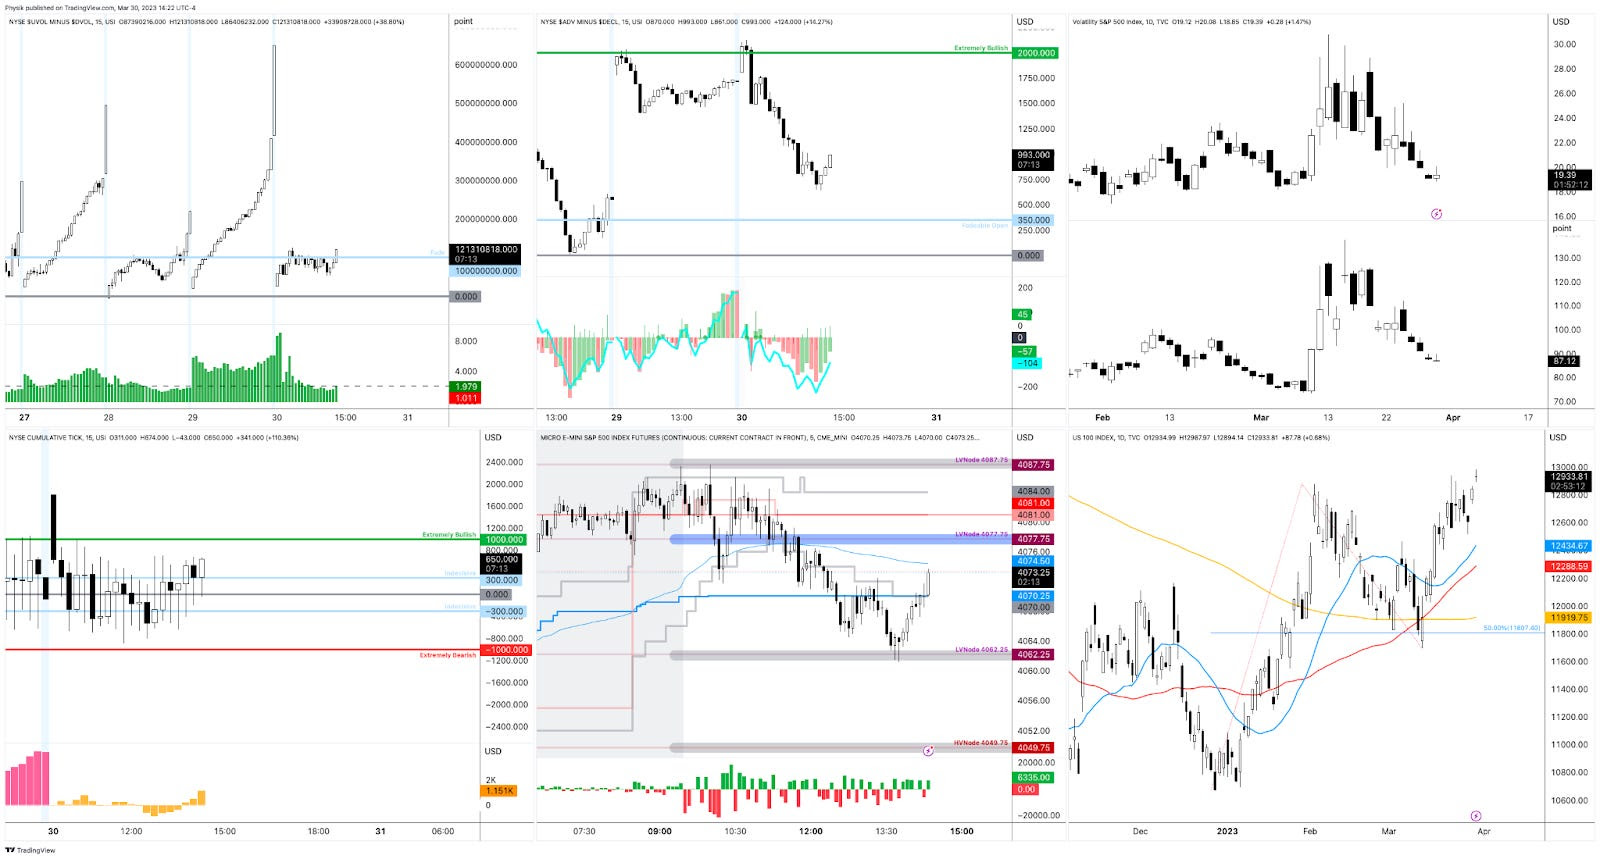
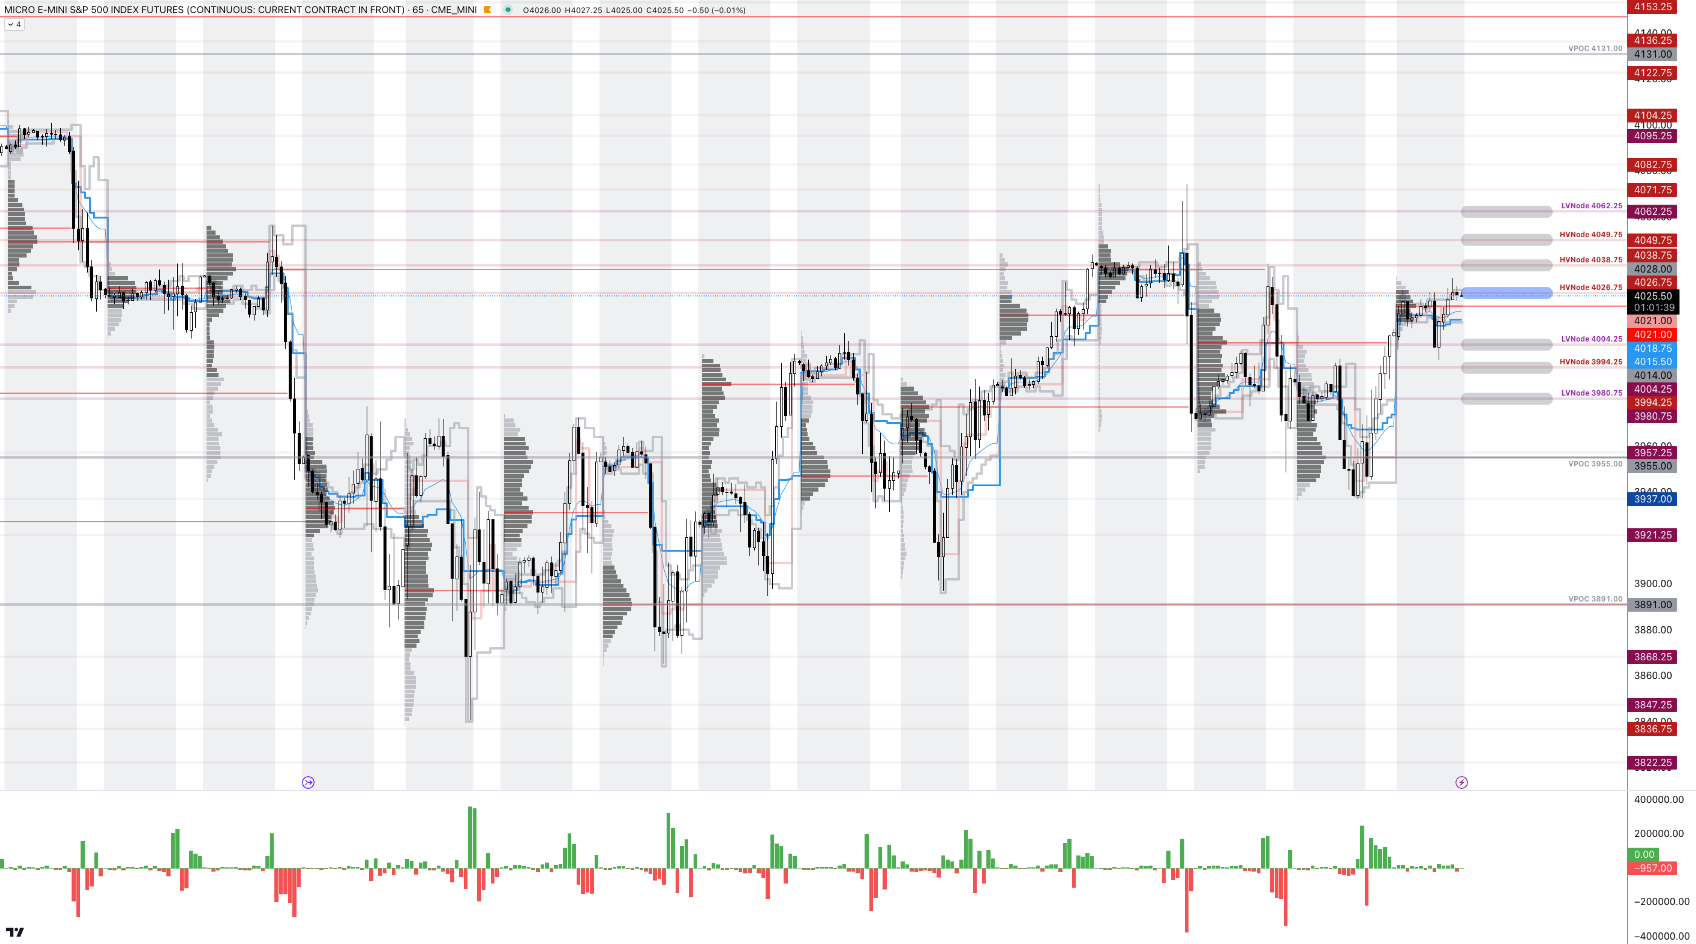
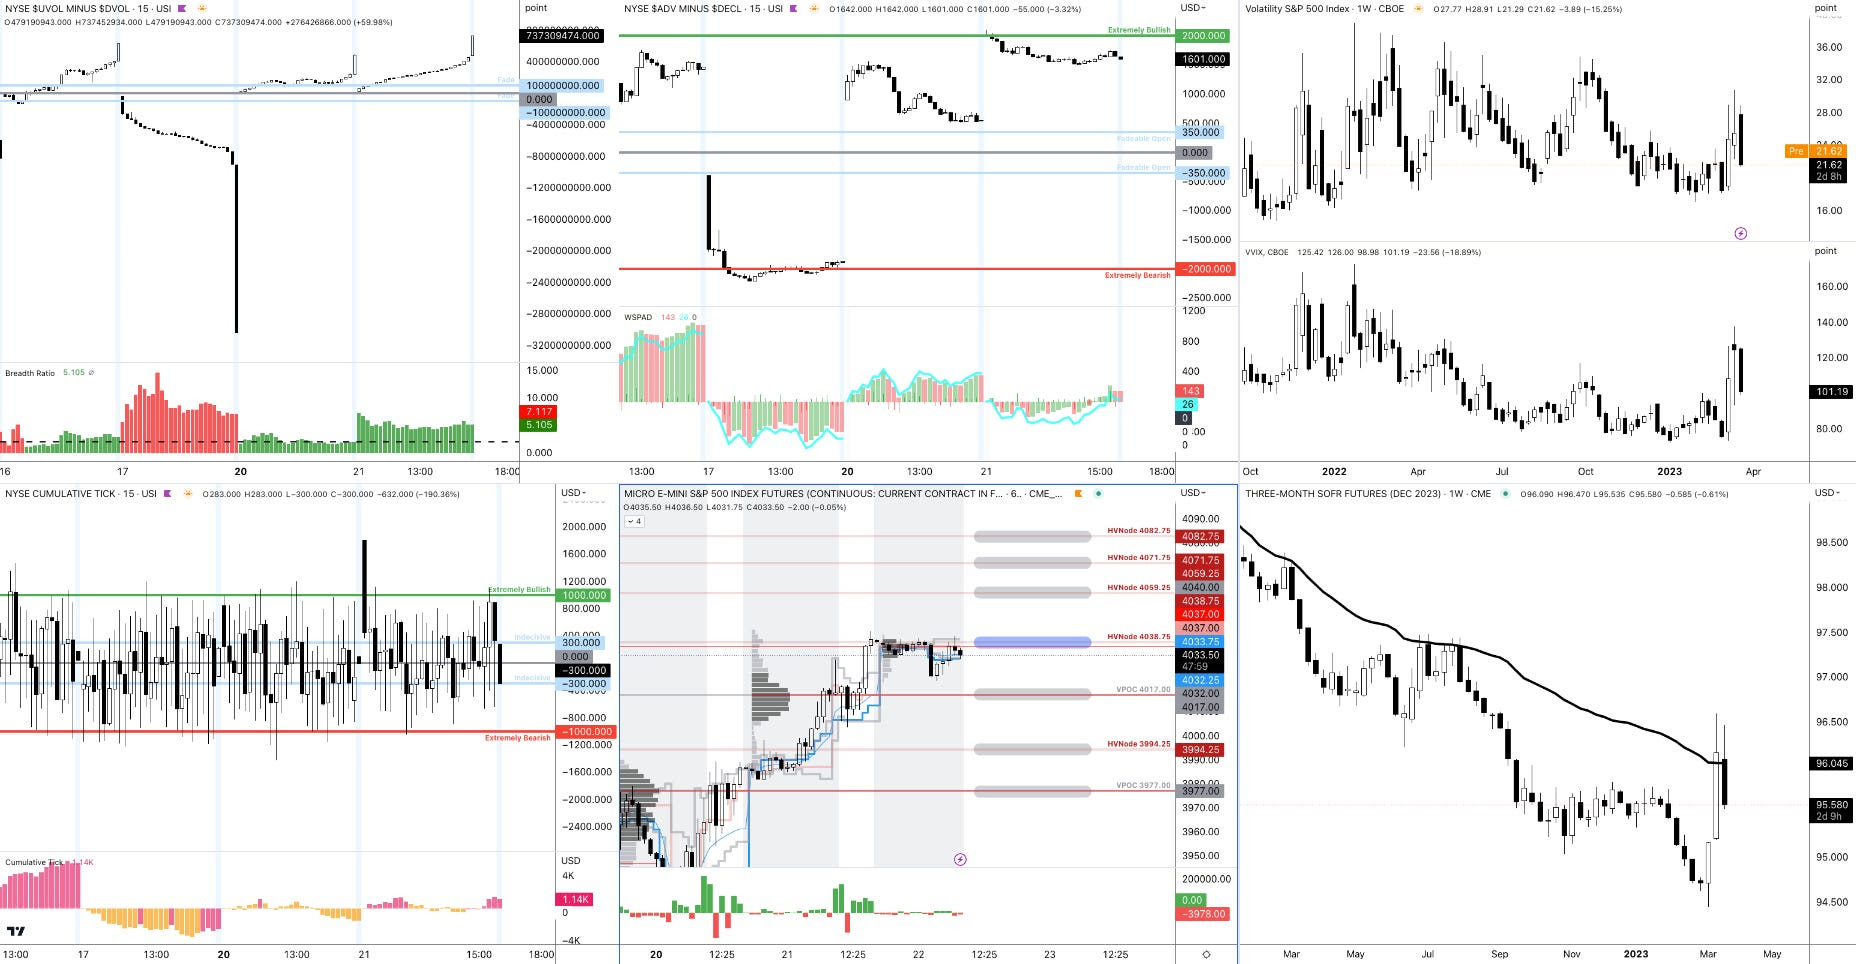
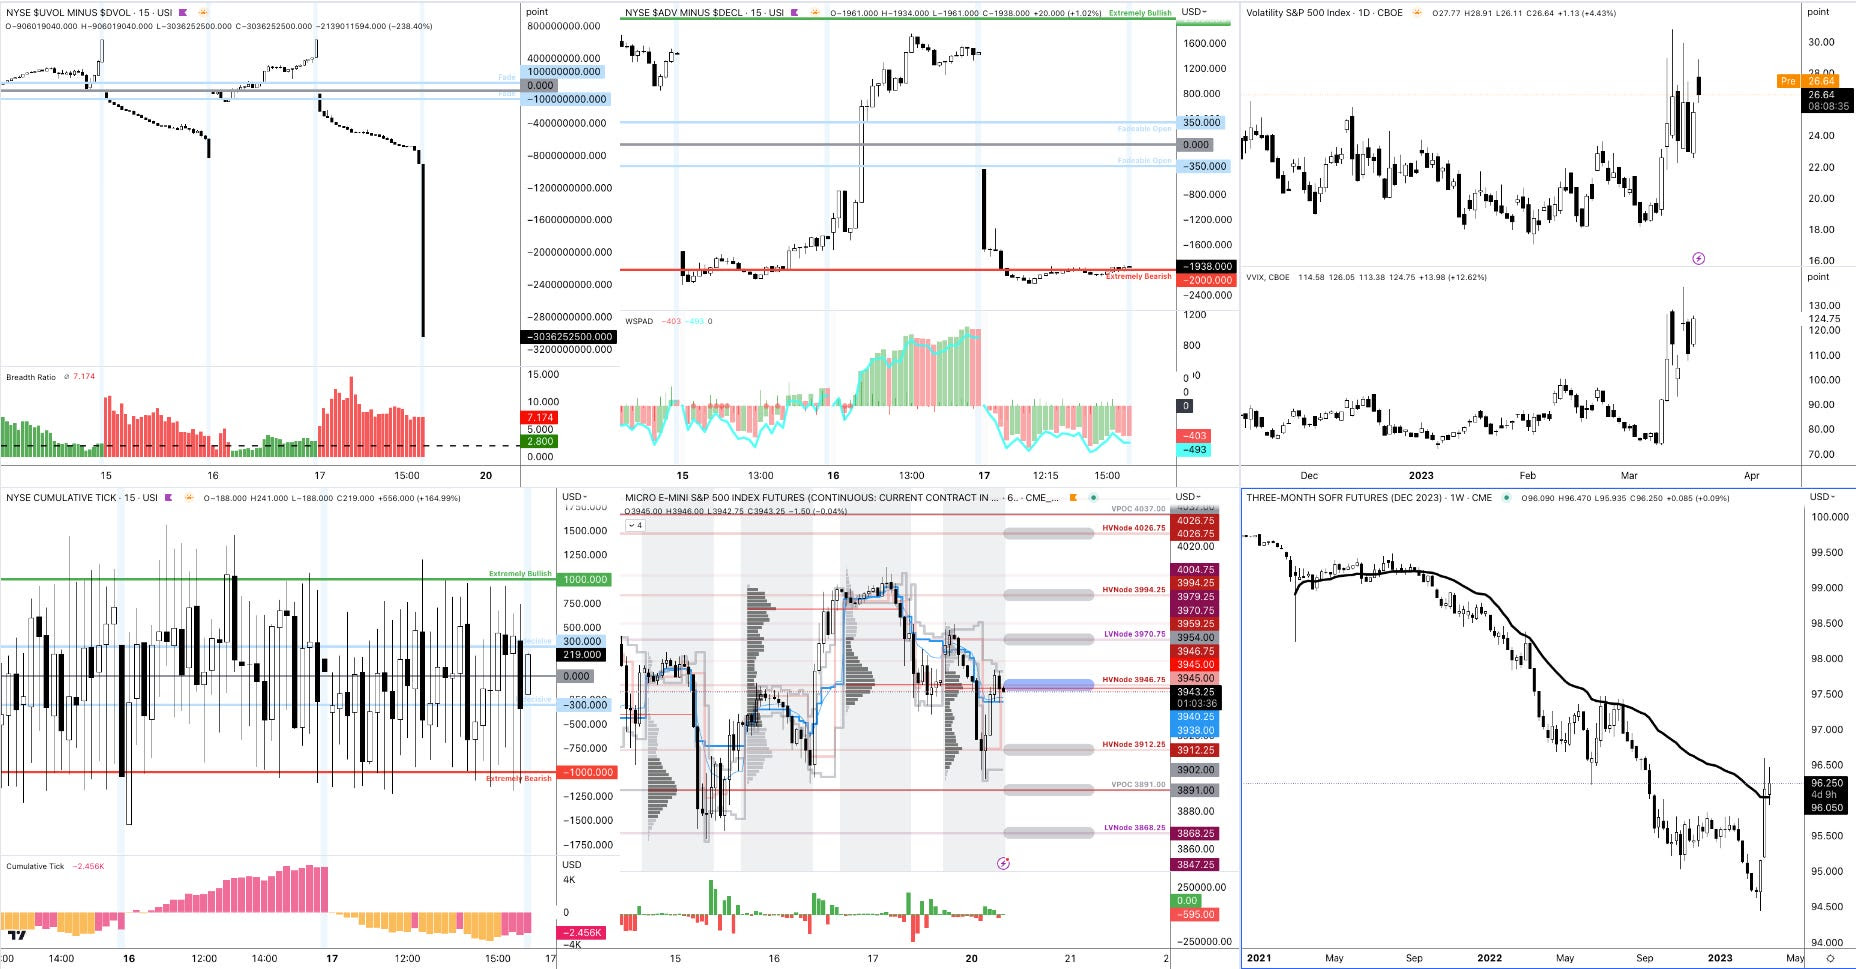
As an aside, some may have observed how well our levels have been working. For instance, as shown below (middle bottom), yesterday’s Daily Brief levels marked the session high and low for the Micro E-mini S&P 500 Index (FUTURE: /MES).
Graphic: Retrieved from TradingView.
Commentators online have rightly pointed out the build-up of short-dated options exposures near current market prices. In short, this activity, and its potential hedging, help promote mean-reversion and responsiveness at our volume profile-derived key levels, which often overlap with centers of significant options activity, as we see. Particularly after the quarterly options expiry (OpEx), this activity’s ability to contain markets will ease; markets will yield to fundamental strengths or weaknesses. Based on top-line measures of breadth and IVOL, “there isn’t much juice left to squeeze,” SpotGamma says. From an options positioning perspective, for volatility to reprice lower and solicit re-hedging that boosts the market, “we need a change in [the] volatility regime (i.e., soft landing, bank crisis resolved, etc.),” SpotGamma adds. The likelihood of that happening is low; some expect the Federal Reserve (Fed) to stick to its original message and continue to tighten and withdraw liquidity. So, blindly selling options (colloquially referred to as volatility) in this environment is dangerous.
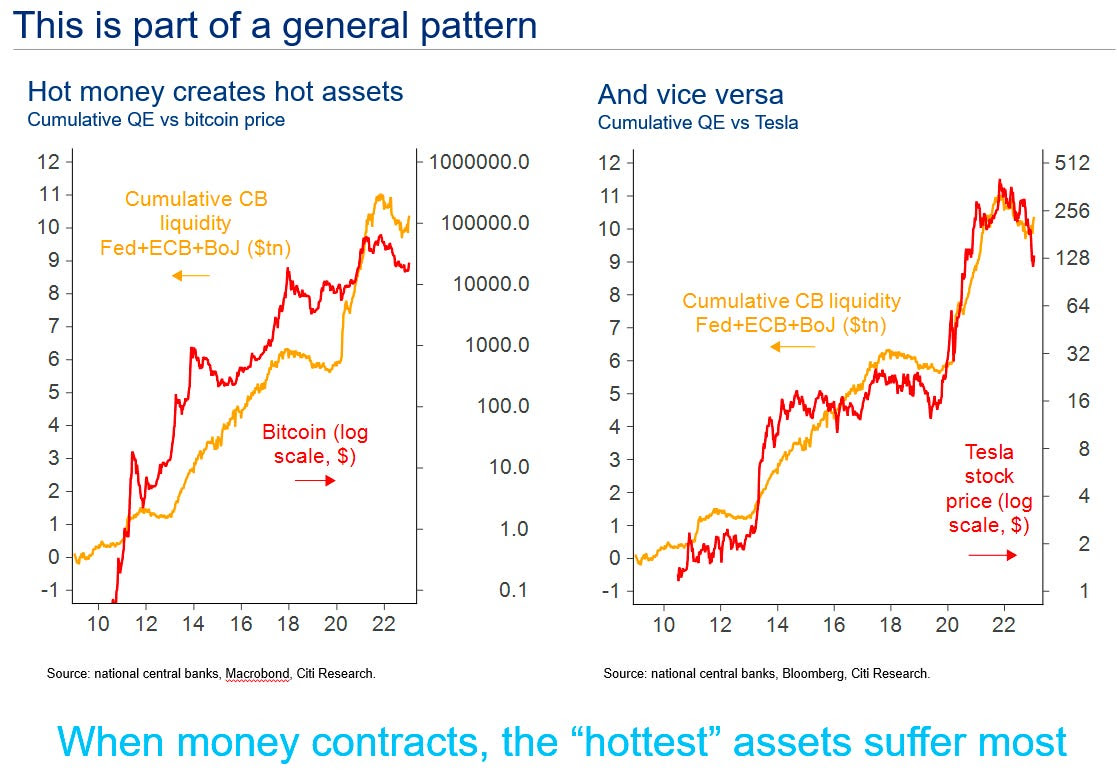
Graphic: Retrieved from Bloomberg’s Joe Weisenthal.
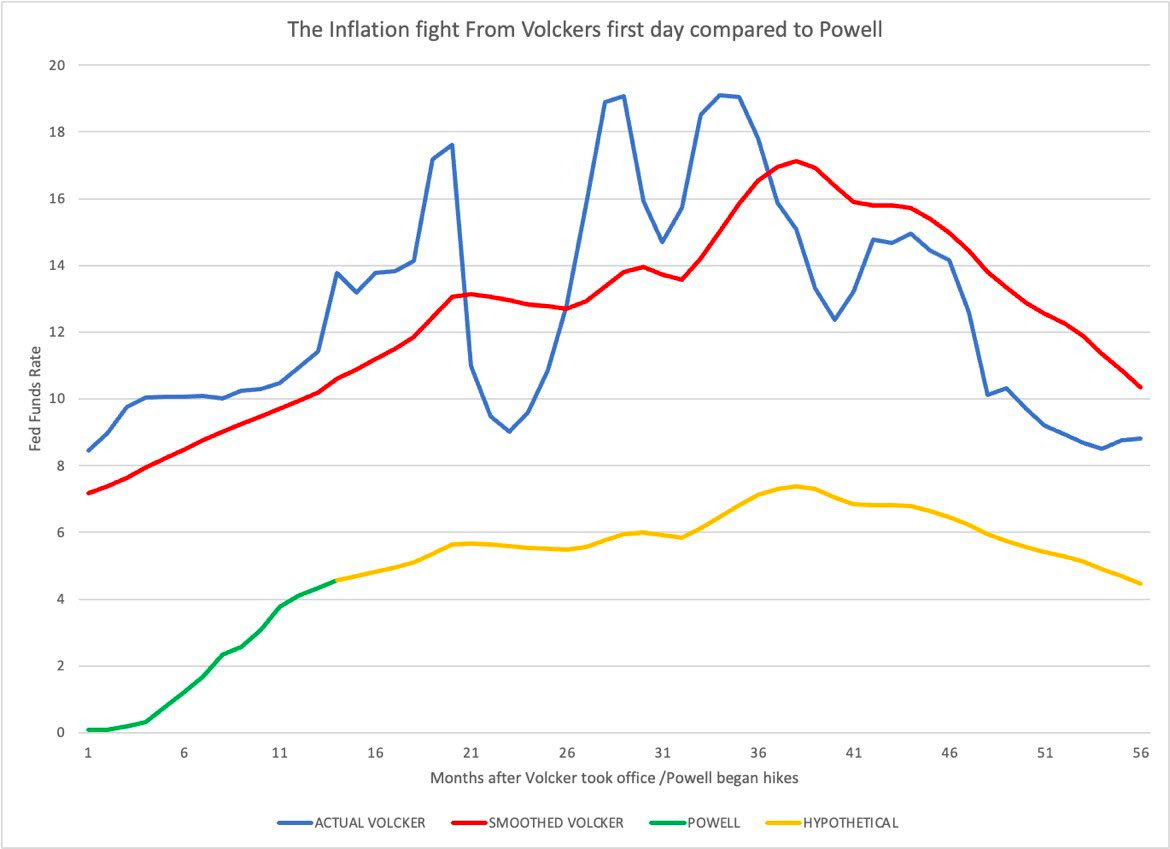
Damped Spring’s Andy Constan overlays past and present inflation fights. What if?
Graphic: Retrieved from Andy Constan of Damped Spring Advisors.
Technical
As of 8:00 AM ET, Friday’s regular session (9:30 AM – 4:00 PM ET) in the S&P 500 will likely open in the middle part of a balanced overnight inventory, inside of the prior day’s range, suggesting a limited potential for immediate directional opportunity.
The S&P 500 pivot for today is $4,087.75.
Key levels to the upside include $4,097.25, $4,108.75, and $4,121.25.
Key levels to the downside include $4,077.75, $4,062.25, and $4,049.75.
Disclaimer: Click here to load the updated key levels via the web-based TradingView platform. New links are produced daily. Quoted levels likely hold, barring an exogenous development.
Graphic: 65-minute profile chart of the Micro E-mini S&P 500 Futures (bottom middle).
About
The author, Renato Leonard Capelj, spends the bulk of his time at Physik Invest, an entity through which he invests and publishes free daily analyses to thousands of subscribers. The analyses offer him and his subscribers a way to stay on the right side of the market.
You may view this letter’s content calendar at this link.
Disclaimer
Do not construe this newsletter as advice; all content is for informational purposes, and derivatives carry a substantial risk of loss. Capelj and Physik Invest, non-professional advisors, will never solicit others for capital or collect fees and disbursements for their work.
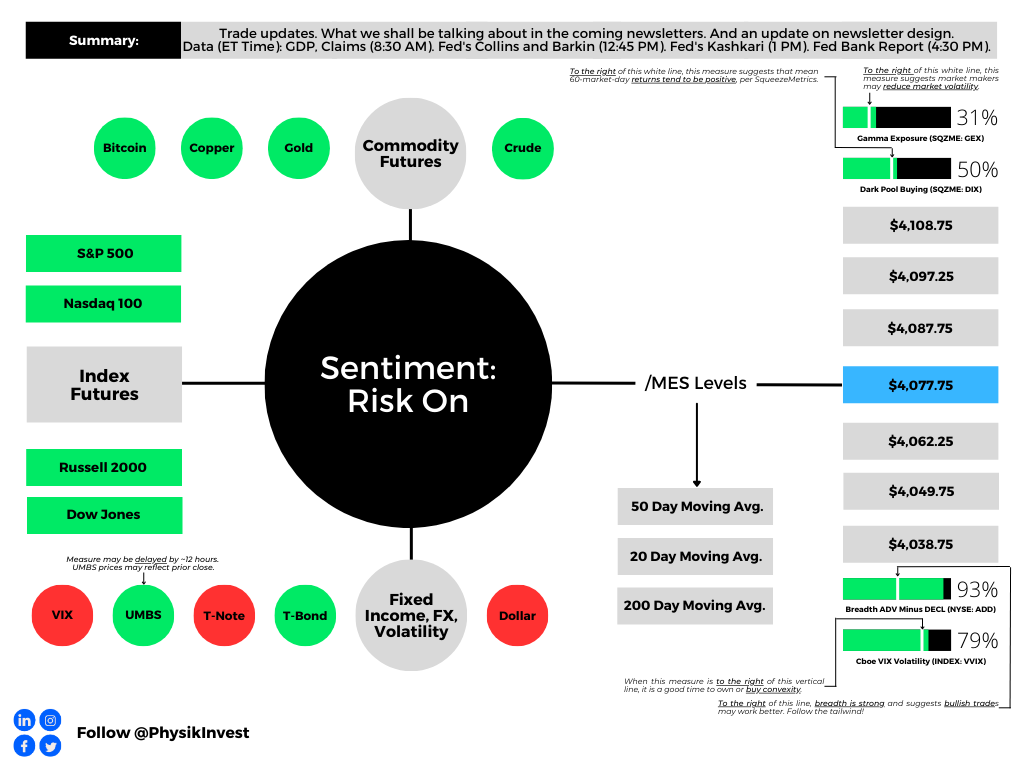
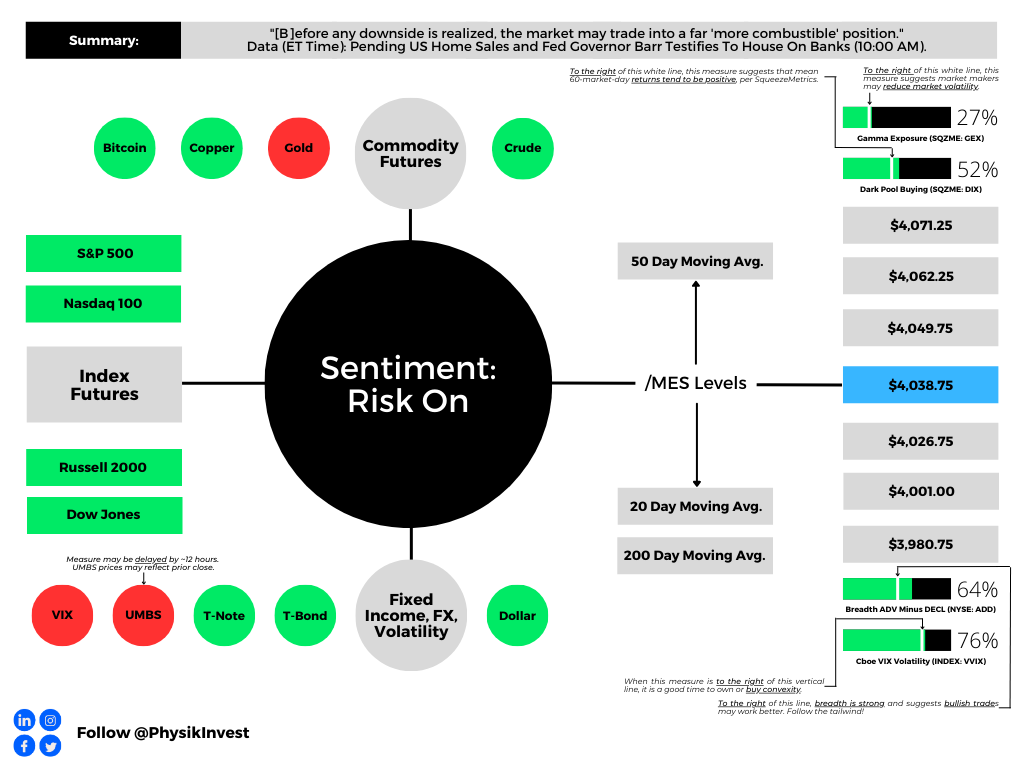
Graphic updated 6:30 AM ET. Sentiment Risk-On if expected /MES open is above the prior day’s range. /MES levels are derived from the profile graphic at the bottom of this letter. Click here for the latest levels. SqueezeMetrics Dark Pool Index (DIX) and Gamma (GEX) with the latter calculated based on where the prior day’s reading falls with respect to the MAX and MIN of all occurrences available. A higher DIX is bullish. The lower the GEX, the more (expected) volatility. Click to learn the implications of volatility, direction, and moneyness. Breadth reflects a reading of the prior day’s NYSE Advance/Decline indicator. The CBOE VIX Volatility Index (INDEX: VVIX) reflects the attractiveness of owning volatility. UMBS prices via MND. Click here for the economic calendar.
Administrative
Thanks for the feedback on the newsletter design! The technical section has returned for your viewing of crucial levels. We may update this section or merge it with another in the future. If you have any feedback, please comment or reply!
By the way, check out fx:macro’s neat market dashboard how-to-build guide! They have a fabulous newsletter, and this dashboard is an excellent component.
👉 A lot of people have asked about the Market Dashboard I'm using and how to build something similar
👉 I've put together a 35-page PDF with >50 screenshots going through the entire process using Excel and TradingView
In the coming sessions, there will be a dive into the geopolitical developments of late, far higher in quality than what we started this week with. For a sneak peek at what we will be talking about, look at this article, this podcast, and the Daily Brief for 1/4/23.
Positioning
In yesterday’s letter on positioning contexts, we concluded it was likely for markets to remain contained through month-end.
We said, “there is potential for markets to move into a far ‘more combustible’ position, … [and], with call skews far up meaningfully steep, still-present low- and zero-cost call structures” in previously depressed products like the Nasdaq 100 (INDEX: NDX), buoyed by financial tensions easing, were attractive to express the bullish view.
Graphic: Retrieved from JPMorgan Chase & Co (NYSE: JPM) via The Market Ear.
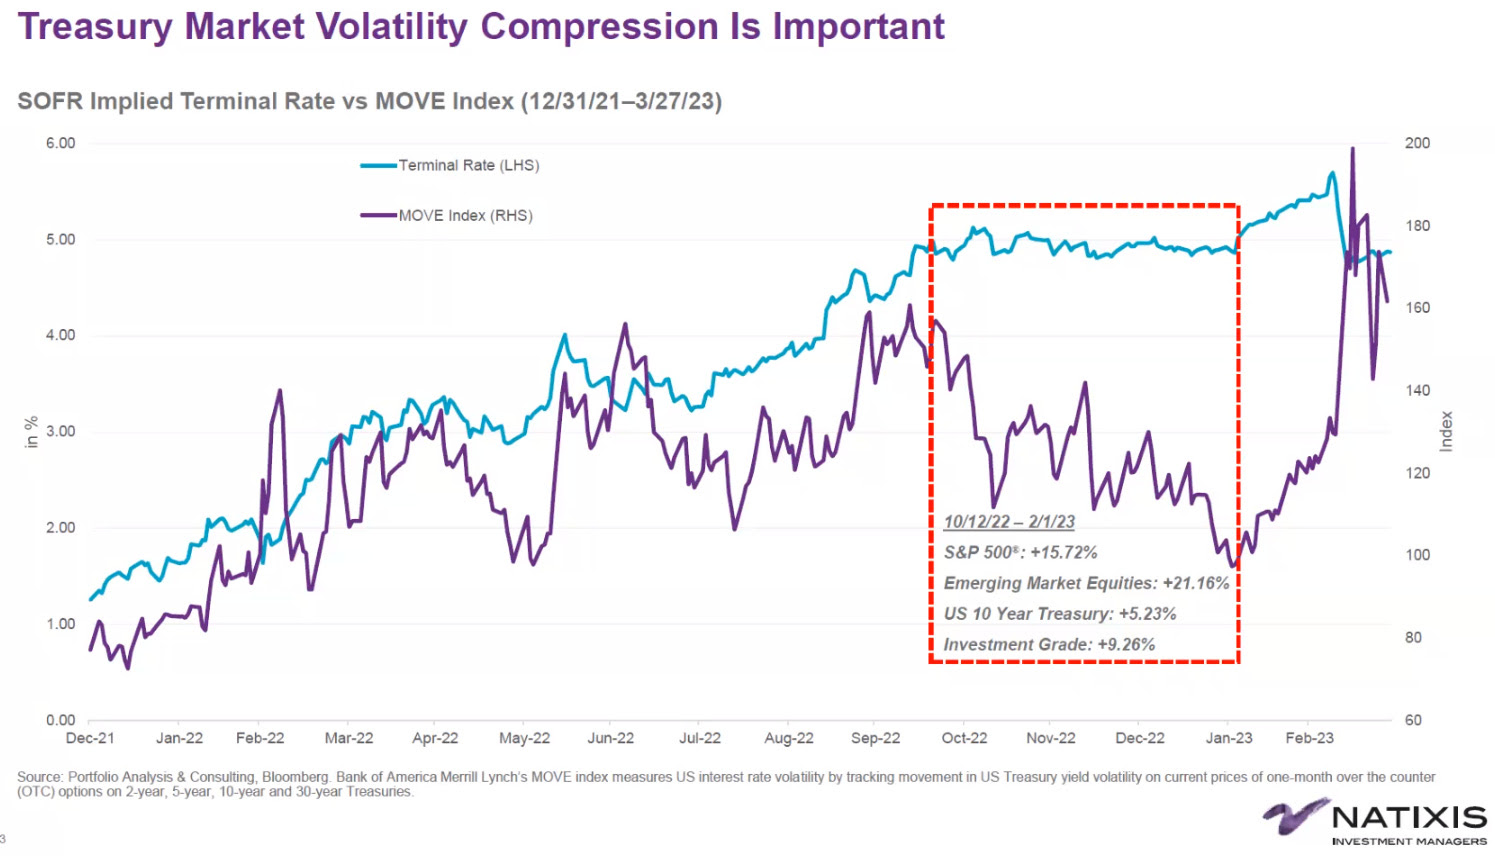
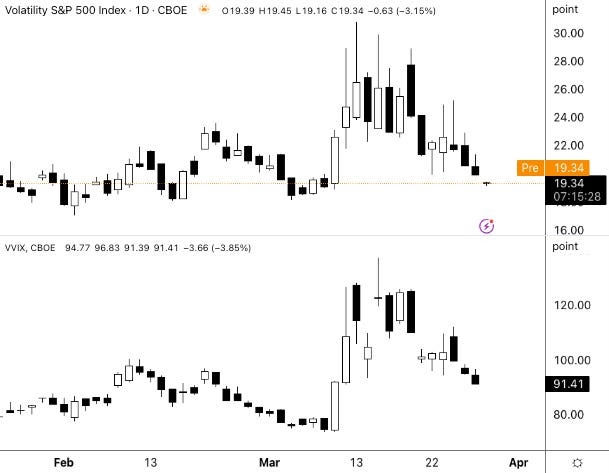
Though we weren’t too right about the potential for volatility to be sticky, which may be detrimental to some of the more expensive structures, such trades’ exposure to direction and movement appears to be offsetting time decay and volatility, sped up by the resolution of the liquidity crisis (i.e., the asset-liability mismatch at some banks that thought their depositors were far more loyal, hence less of a need to hedge risk) which prompted traders a few weeks back to demand protection and reprice options higher; the Merrill Lynch Option Volatility Estimate (INDEX: MOVE) and Cboe Volatility Index (INDEX: VIX) have come in dramatically. Please take a look at the full letter here.
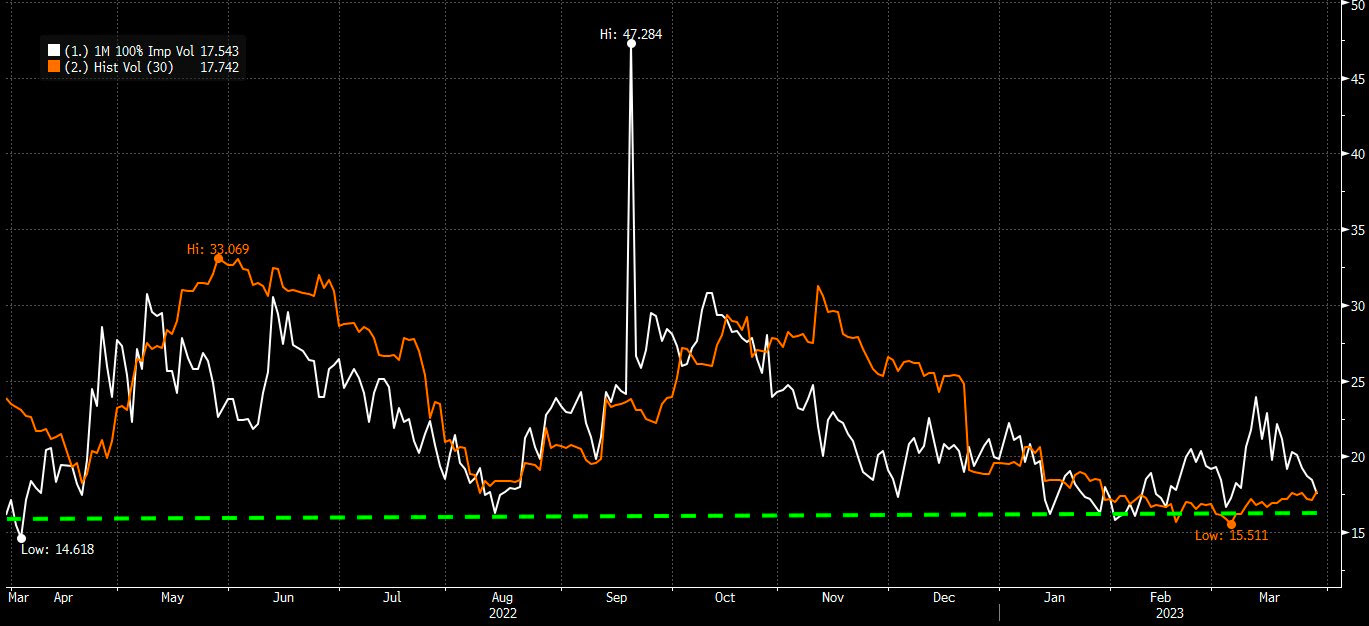
As stated on 3/29, the fundamental view hasn’t changed. Therefore, we may consider monetizing our structures now and in the near future and using those credits to offset debit risk in plays such as far-dated bear put spreads (i.e., buy put and sell another at a lower strike); options data and insight platform SpotGamma says the juice has been squeezed now with S&P 500 (INDEX: SPX) 1-month at-the-money implied volatility or IVOL pricing at 17%. “For a decline to continue, we need a change in volatility regime (i.e., soft landing, bank crisis resolved, etc.) because, with 1-month realized at 15%, you can argue there isn’t much juice left to squeeze.” Caution on the upside plays.
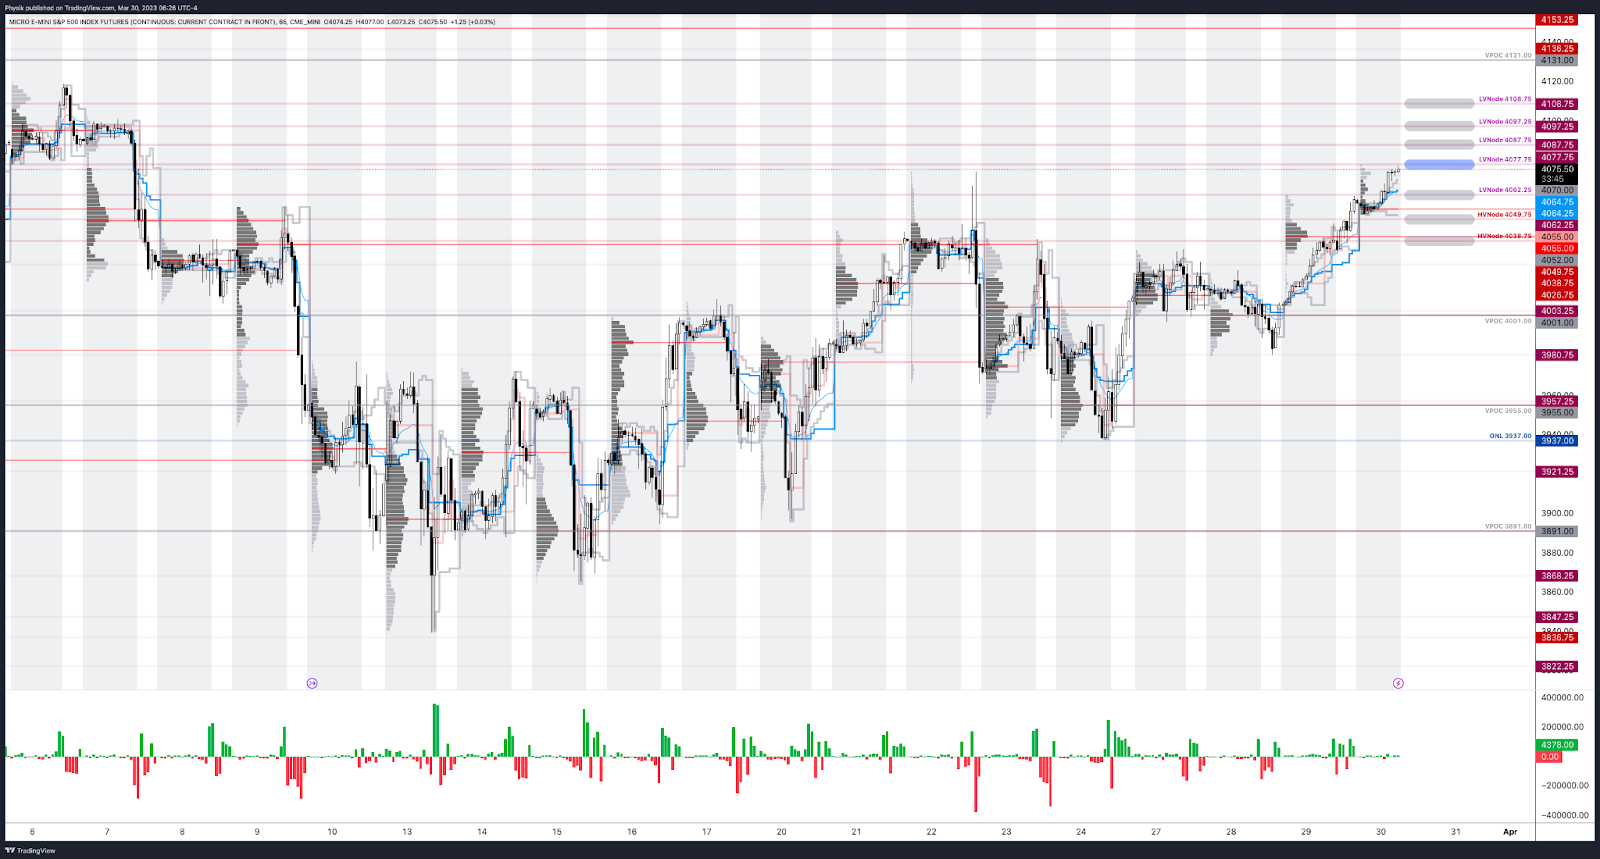
As of 6:30 AM ET, Thursday’s regular session (9:30 AM – 4:00 PM ET) in the S&P 500 will likely open in the upper part of a positively skewed overnight inventory, outside of the prior day’s range, suggesting a potential for immediate directional opportunity.
The S&P 500 pivot for today is $4,077.75.
Key levels to the upside include $4,087.75, $4,097.25, and $4,108.75.
Key levels to the downside include $4,062.25, $4,049.75, and $4,038.75.
Click here to load the updated key levels via the web-based TradingView platform.
New links are produced daily.
Quoted levels likely hold, barring an exogenous development.
Graphic: 65-minute profile chart of the Micro E-mini S&P 500 Futures.
About
The author, Renato Leonard Capelj, spends the bulk of his time at Physik Invest, an entity through which he invests and publishes free daily analyses to thousands of subscribers. The analyses offer him and his subscribers a way to stay on the right side of the market.
You may view this letter’s content calendar at this link.
Disclaimer
Do not construe this newsletter as advice; all content is for informational purposes, and derivatives carry a substantial risk of loss. Capelj and Physik Invest, non-professional advisors, will never solicit others for capital or collect fees and disbursements for their work.
Physik Invest’s Daily Brief is a free newsletter sent to thousands of subscribers daily. Intrigued about what moves markets and how that can impact your financial wellness? Subscribe below.
Graphic updated 7:00 AM ET. Sentiment Risk-On if expected /MES open is above the prior day’s range. Click here for the latest levels. /MES levels are derived from the profile graphic at the bottom of this letter. SqueezeMetrics Dark Pool Index (DIX) and Gamma (GEX) with the latter calculated based on where the prior day’s reading falls with respect to the MAX and MIN of all occurrences available. A higher DIX is bullish. The lower the GEX, the more (expected) volatility. Click to learn the implications of volatility, direction, and moneyness. Breadth reflects a reading of the prior day’s NYSE Advance/Decline indicator. The CBOE VIX Volatility Index (INDEX: VVIX) reflects the attractiveness of owning volatility. UMBS prices via MND. Click here for the economic calendar.
Administrative
The newsletter format needs to evolve a bit. Feedback is welcomed! If you are looking for the link to the daily chart, see the caption below the graphic above. Take care!
Positioning
Fear of contagion prompted demands for protection. Measures of implied volatility or IVOL rose, and consequently, these demands for protection pressured markets.
Previously, this letter explained for protection to keep its value, there would have to be a shift higher in realized volatility or RVOL. Well, RVOL did not come back in a big way at the index level, as many expected.
Thus, the positive effects of the bank-related stimulation and traders’ pulling forward their timeline for easing were compounded by the unwinding of hedging strategies.
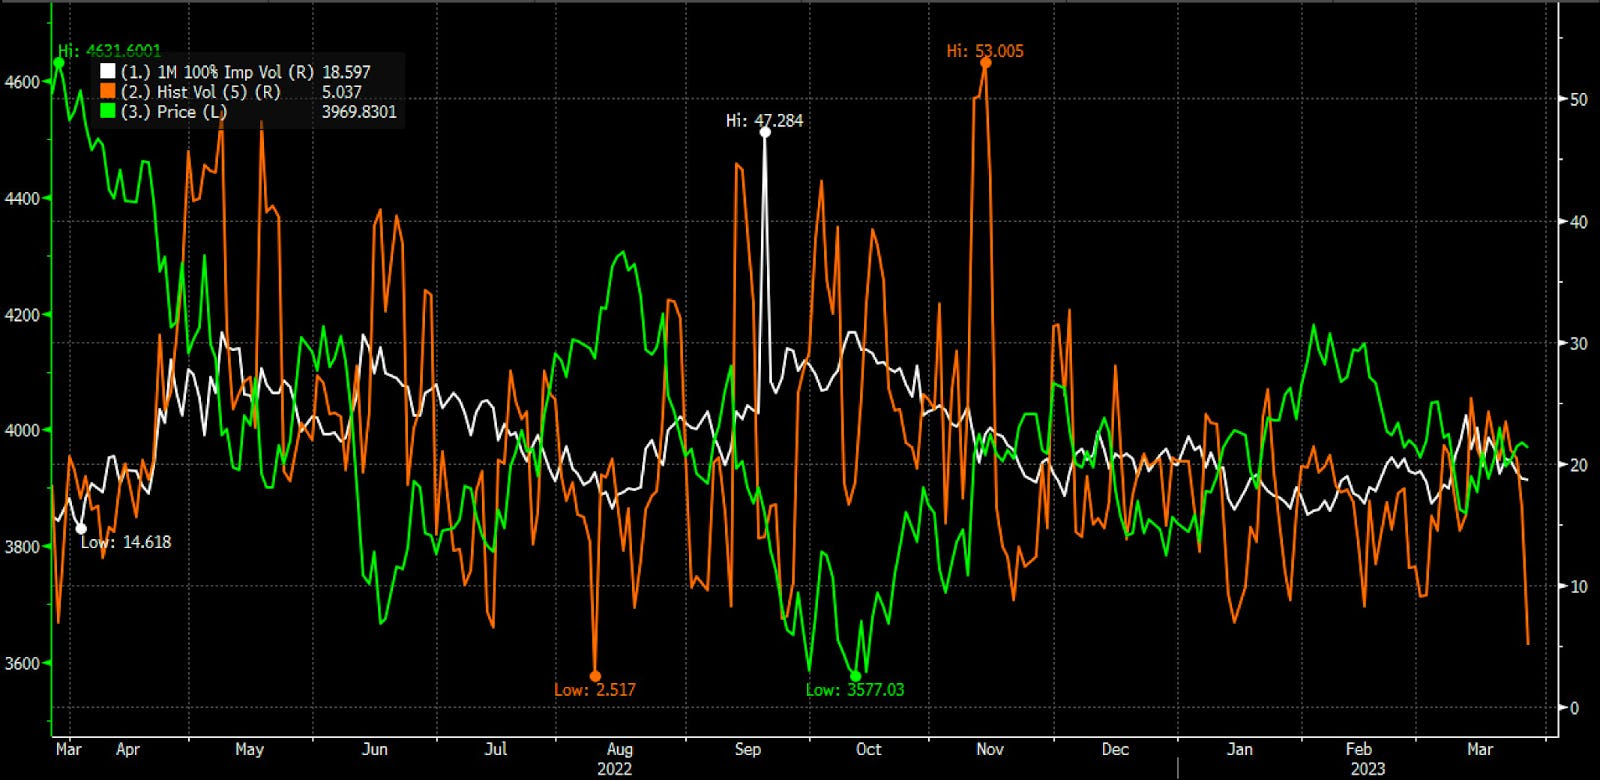
Graphic: Retrieved from Bloomberg via SpotGamma. “This drop in 5-day realized vol (orange) is pretty sharp, given it occurred from such a low relative level. ‘Can’t short it, don’t want to buy it.’ This vol decline comes as SPX put open interest was cleared with March OPEX, and big VIX call interest expired last week.”
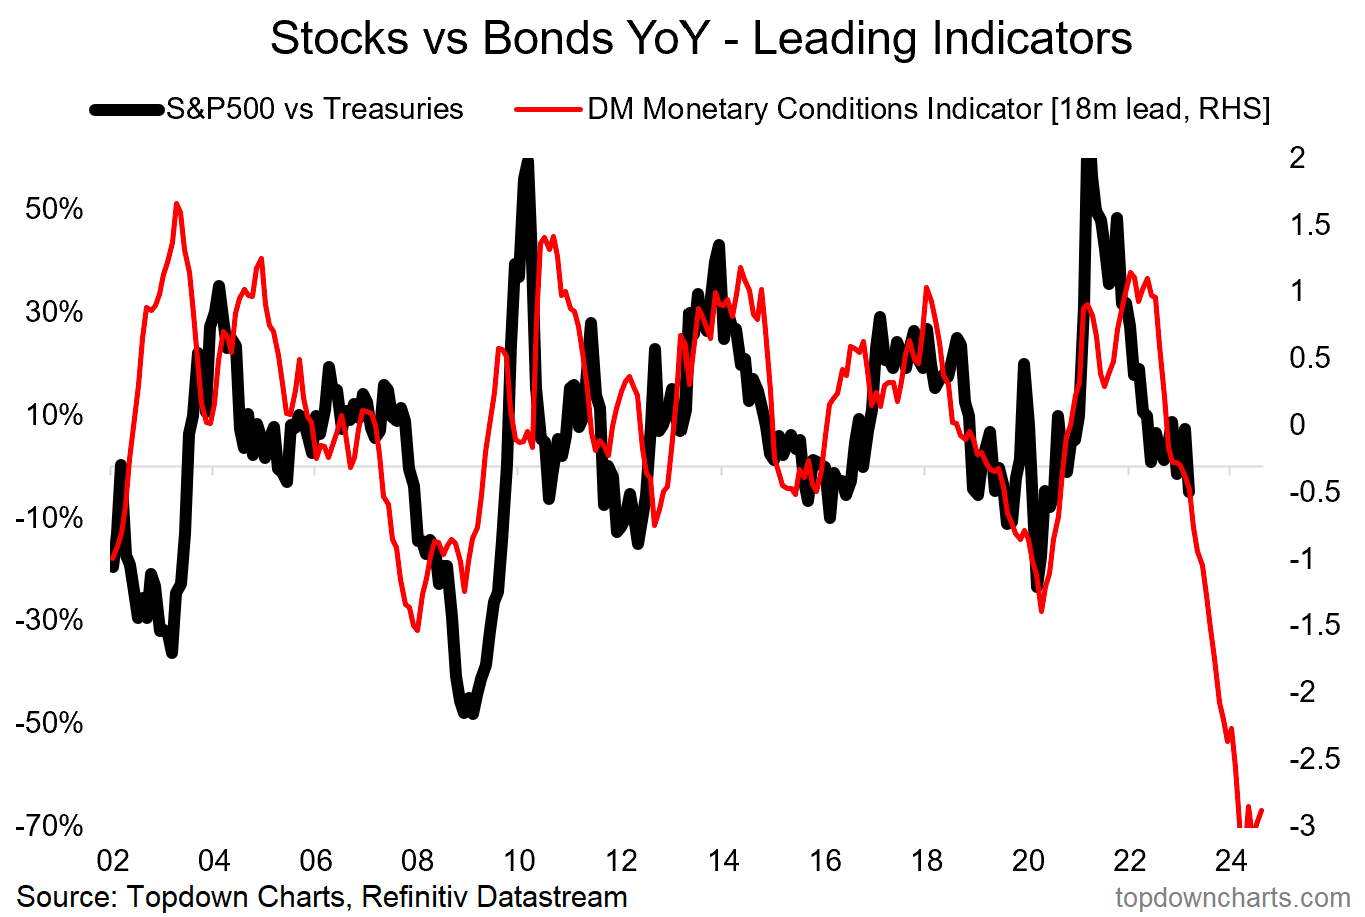
Previously depressed products like the Nasdaq 100 or NDX, which are generally very sensitive to monetary tightening, have performed well.
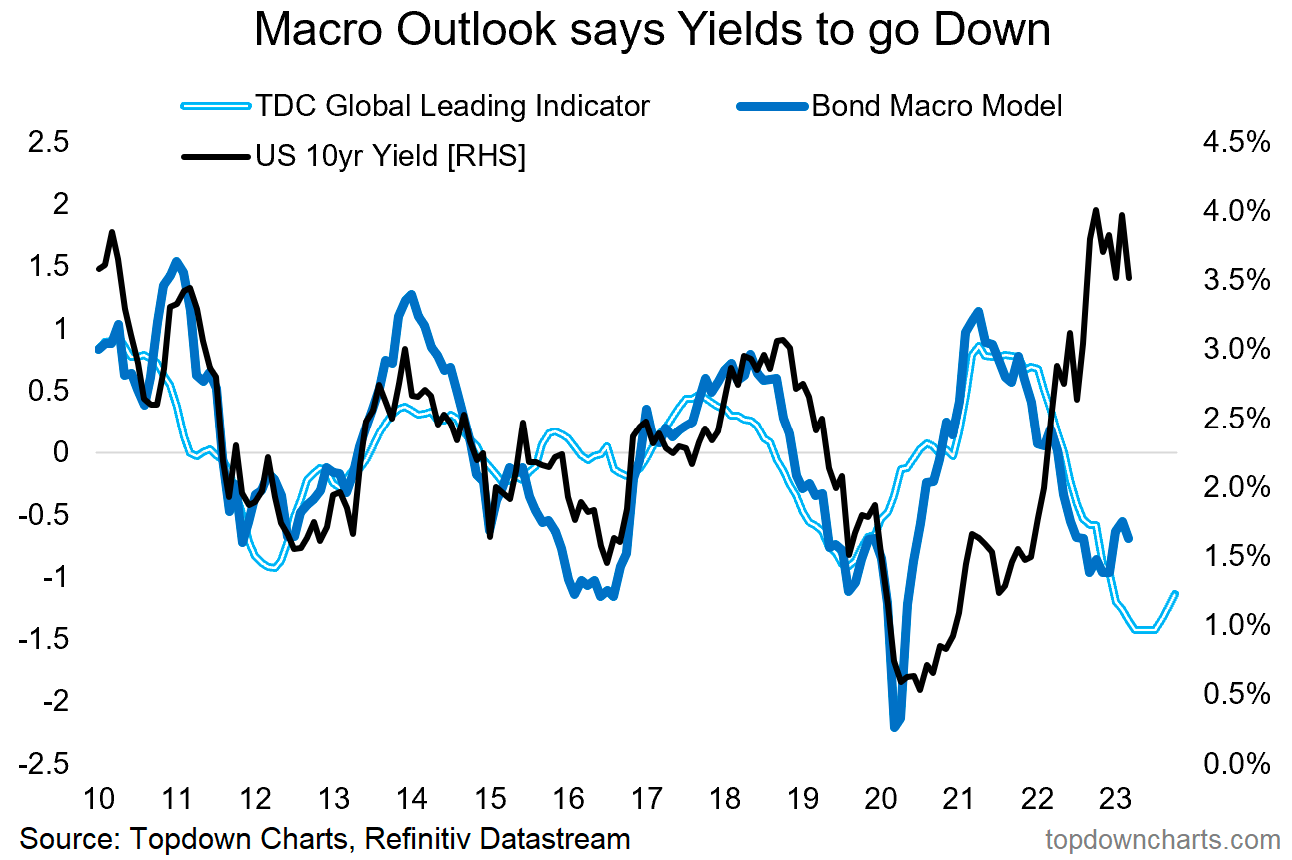
Graphic: Retrieved from Callum Thomas’ Topdown Charts.
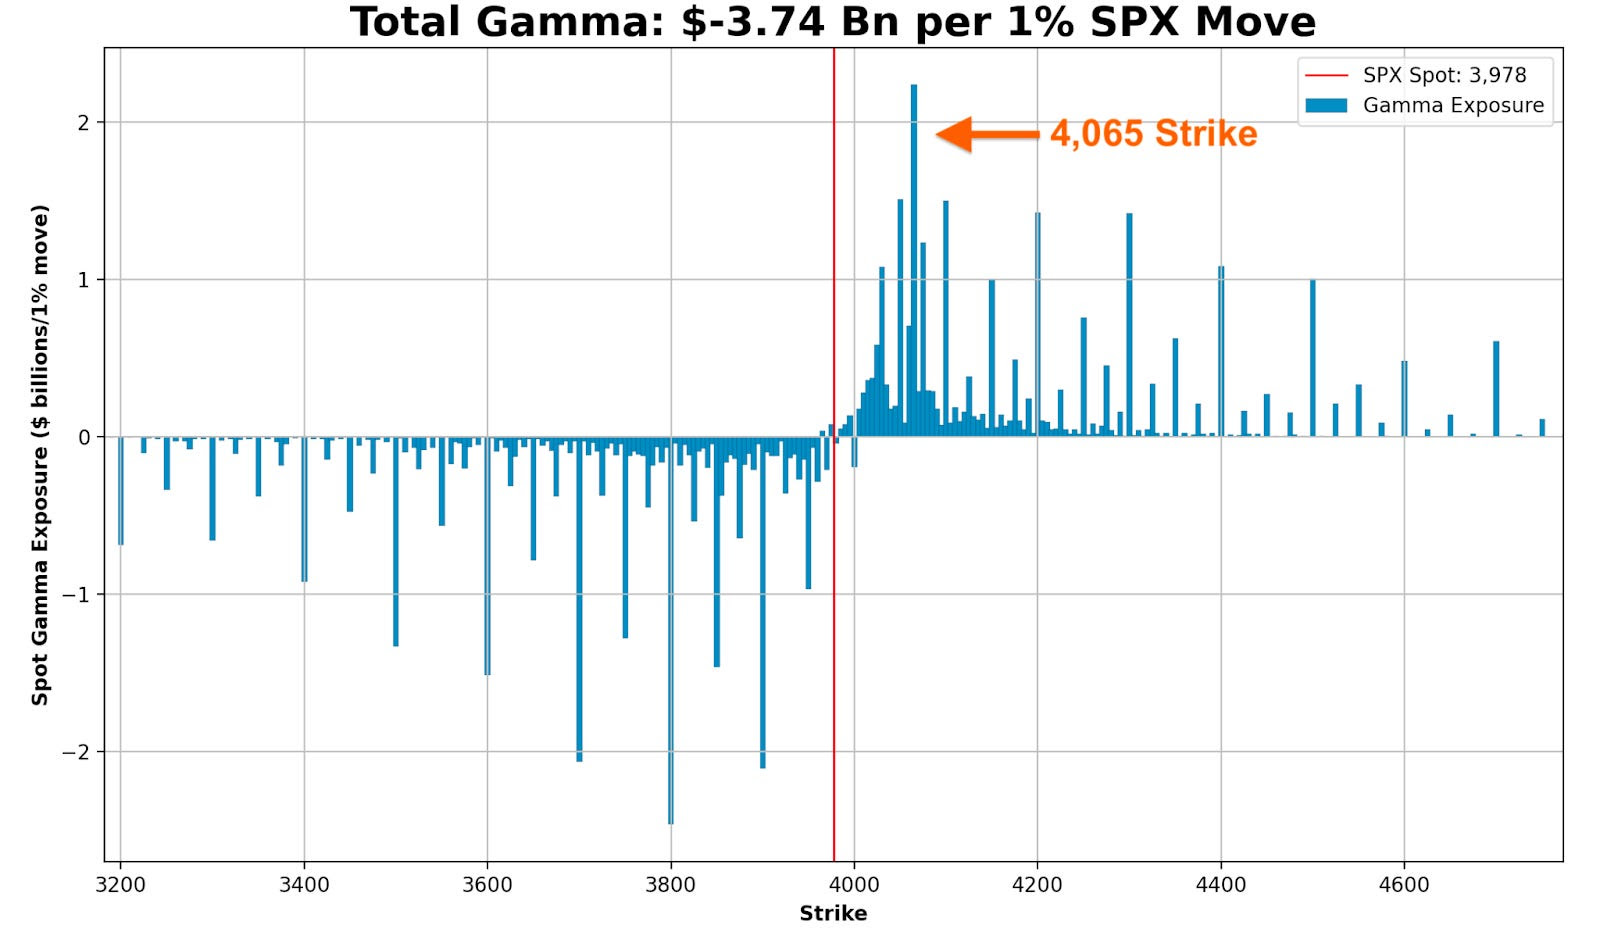
As we near month-end, there is a quarterly derivatives expiry. Above current S&P 500 or SPX levels is a significant concentration of soon-to-roll-off open interest held short by investors. This means the counterparties are dynamically hedging a call they own; they’re selling strength and buying weakness, albeit in a less and less meaningful way, as those options near this expiration and their probability of paying out (i.e., delta or exposure to direction) falls.
Some would allege that volatility compression and time decay would have solicited a more meaningful response from options counterparties at those strike prices above; the absence of downside follow-through had traders supplying previously demanded downside put protection and catalyzing a rally. However, there are not many things for the market to rally on, and so much time has passed that the charm effects (i.e., the impact of time passing on an options delta) have lessened dramatically, some explain.
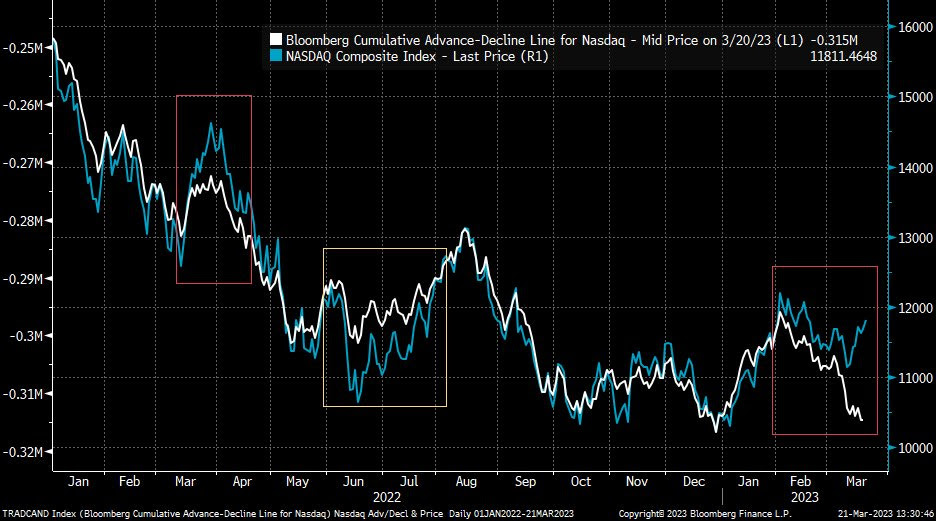
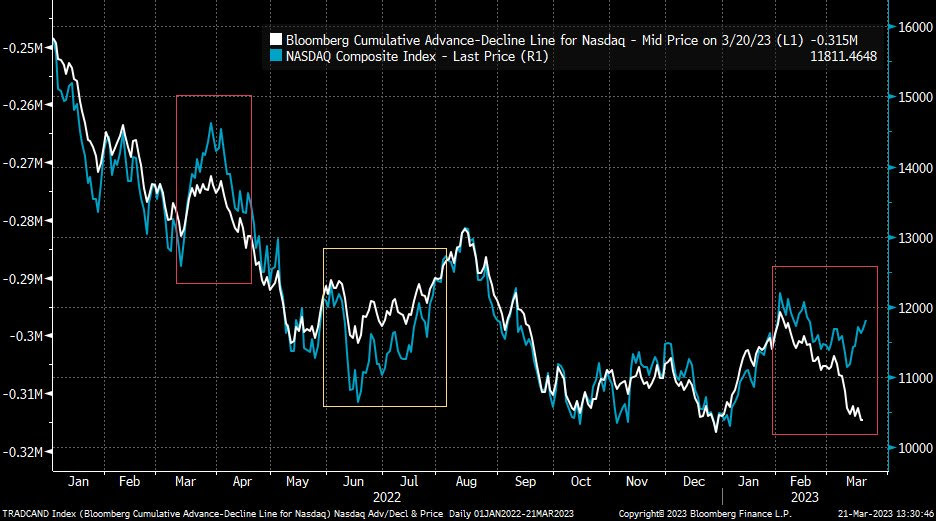
Graphic: Retrieved from Bloomberg via Liz Young. “The Nasdaq’s Cumulative Advance-Decline line has parted ways with index direction in recent days. In other words, the index has rallied despite weak breadth (more stocks falling than rising), the two lines are likely to find their way back together somehow…”
Therefore, it’s probably likely that the market remains contained through month-end. After, movement may increase. This letter acknowledged RVOL might come back in a big way, particularly with the bank intervention doing more to thwart credit creation.
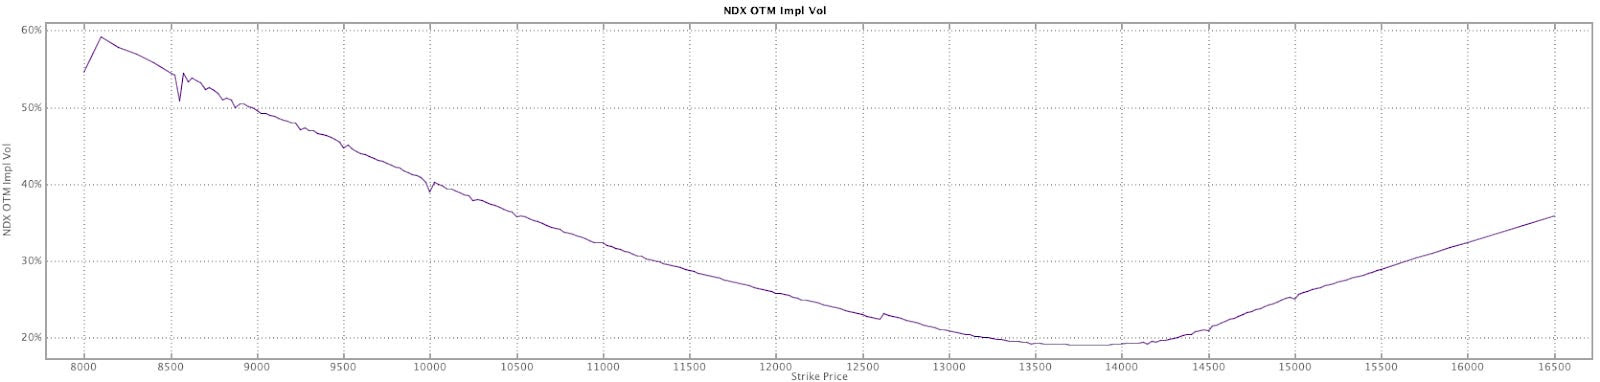
The caveat is that markets can trade spiritedly for far longer. There is a potential for the markets to move into a far “more combustible” position. With call skews far up meaningfully steep, still-present low- and zero-cost call structures this letter has talked about in the past remain attractive.
Graphic: Retrieved from Charles Schwab Corporation-owned (NYSE: SCHW) thinkorswim.
If the market falls apart, your costs are low, and losses are minimal. If markets move higher into that “more combustible” position, wherein “volatility is sticky into a rally,” you may monetize your call structures and roll some of those profits into bear put spreads (i.e., buy put and sell another at a lower strike).
The signs of a “more combustible situation” would likely show when “volatility is sticky into a rally,” explains Kai Volatility’s Cem Karsan. To gauge combustibility, look to the options market.
Remember, calls trade at a lower IVOL than puts. As the market trades higher, it slides to a lower IVOL, reflected by broad IVOL measures. If broad IVOL measures are sticky/bid, “that’s an easy way to say that fixed-strike volatility is coming up and, if that can happen for days, that can unpin volatility and create a situation where dealers themselves are no longer [own] a ton of volatility; they start thinning out on volatility themselves, and that creates a more combustible situation.”
To explain the “thinning out” part of the last paragraph, recall participants often opt to own equity and downside (put) protection financed, in part, with sales of upside (call) protection. More demand for calls will result in counterparties taking on more exposure against movement (i.e., negative gamma) hedged via purchases of the underlying. Once that exposure expires and/or decays, that dealer-based support will be withdrawn. If the assumption is that equity markets are expensive now, then, after another rally, there may be more room to fall, all else equal (a simplistic way to look at this), hence the increased precariousness and combustibility.
Graphic: Retrieved from Callum Thomas’ Topdown charts.
About
The author, Renato Leonard Capelj, spends the bulk of his time at Physik Invest, an entity through which he invests and publishes free daily analyses to thousands of subscribers. The analyses offer him and his subscribers a way to stay on the right side of the market.
You may view this letter’s content calendar at this link.
Disclaimer
Do not construe this newsletter as advice; all content is for informational purposes. Capelj and Physik Invest are non-professional advisors managing their own capital. They will never openly solicit others for capital or manage others’ capital to collect fees and disbursements.
Physik Invest’s Daily Brief is read free by thousands of subscribers. Join this community to learn about the fundamental and technical drivers of markets.
Graphic updated 7:00 AM ET. Sentiment Neutral if expected /MES open is inside of the prior day’s range. /MES levels are derived from the profile graphic at the bottom of this letter. Click here for the latest levels. SqueezeMetrics Dark Pool Index (DIX) and Gamma (GEX) with the latter calculated based on where the prior day’s reading falls with respect to the MAX and MIN of all occurrences available. A higher DIX is bullish. The lower the GEX, the more (expected) volatility. Click to learn the implications of volatility, direction, and moneyness. Breadth reflects a reading of the prior day’s NYSE Advance/Decline indicator. The CBOE VIX Volatility Index (INDEX: VVIX) reflects the attractiveness of owning volatility. UMBS prices via MND. Click here for the economic calendar.
Administrative
Time for something inspiring! Separate from his work at Physik Invest, founder Renato Leonard Capelj is a journalist interviewing global leaders in business, government, and finance. In his desire to learn and apply the methods of those others who are far more experienced, Capelj has a long list of interviews you may find helpful in strengthening your understanding of markets. Check out some recent ones!
Capelj spoke with Simplify Asset Management’s Michael Green about cutting investors’ portfolio volatility while amplifying profit potential.
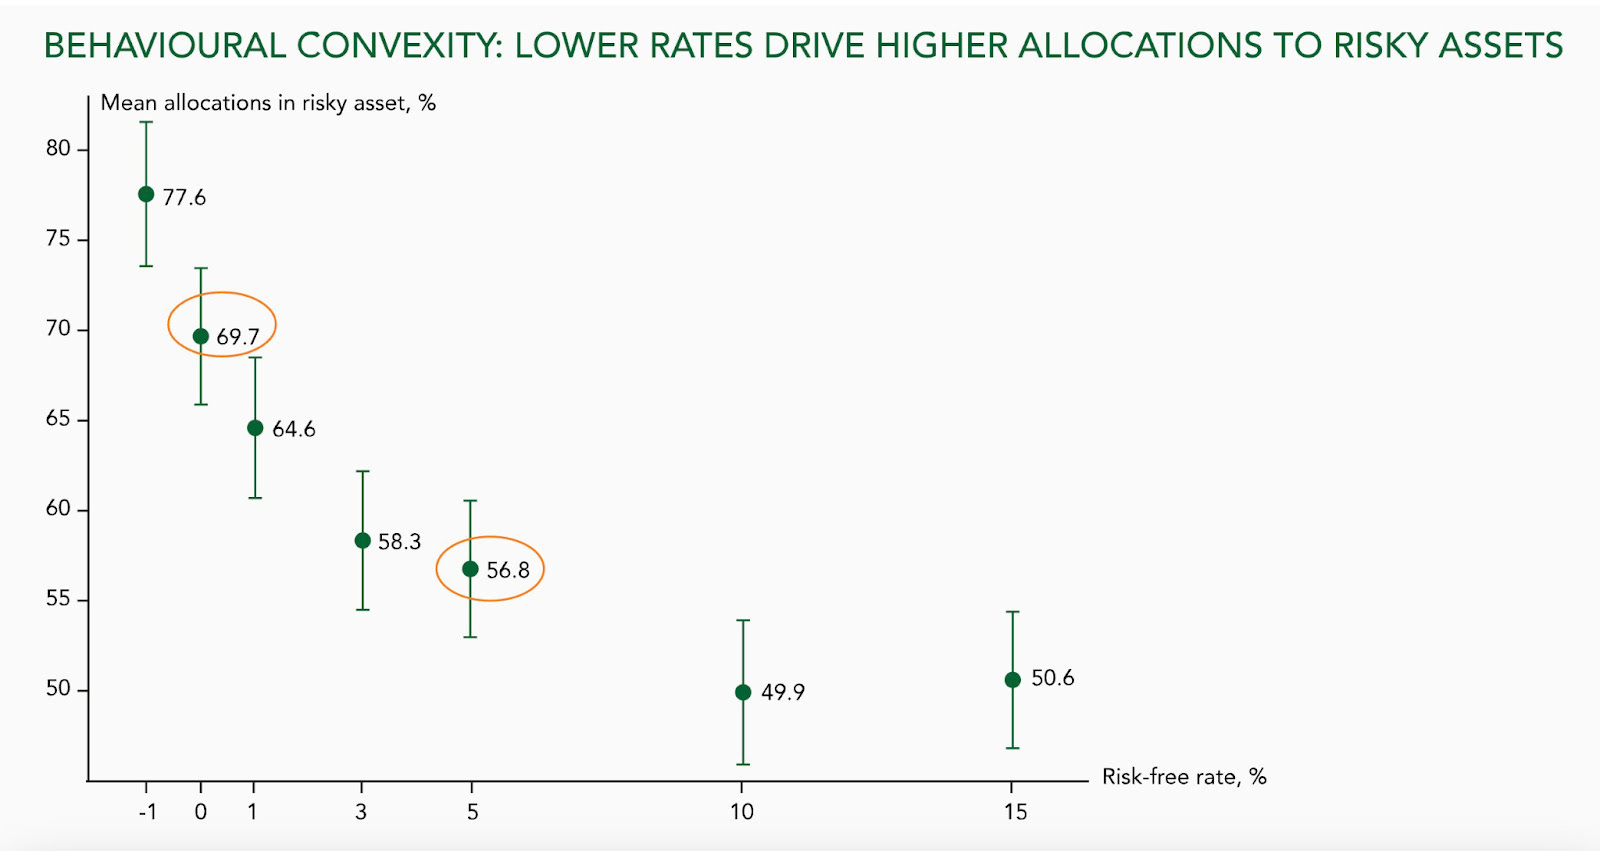
In response to uncertainty, Green says investors can park cash in short-term near-risk-free bonds yielding 5% or more, as well as allocate some capital to volatility “to introduce a degree of convexity,” risking only the premium paid. Alternatively, investors can take a more optimistic long view and position in innovations like artificial intelligence or next-generation energy production.
Capelj spoke with The Ambrus Group’s Kris Sidial about his market perspectives.
Naive measures like the VVIX, which is the volatility of the VIX or the volatility of the S&P 500’s volatility, are printing at levels last seen in 2017, Sidial explains, noting this would suggest “we can get cheap exposure to convexity while a lot of people are worried.”
“Even if inflation continues, the rate at which it rises won’t be the same. Due to this, CTA exposures likely will not perform as well as they did in 2022, and that’s why you may see more opportunities in the volatility space.”
Capelj spoke with Damped Spring Advisors’ Andy Constan about what investors should focus on and how he creates trades that lose him less money.
Constan’s trades are constructed around two- to four-month time horizons and are structured long and short using defined-risk options trades like debit or credit spreads, depending on whether volatility is cheap or expensive.
“I want deltas and leverage. My macro indicators give me an edge on price and in the worst case, the loss is limited to 10%, if everything has to go against me all at once. I can be 100% invested and only risk 10%.”
Capelj spoke with 42 Macro’s Darius Dale about his Wall Street story and perspectives on life and markets.
“We’re tracking at an above-potential level of output in terms of the growth rate of output. We’re also slowing and the pace of that deceleration is likely to pick up steam in the coming quarters.”
By 2023, that process is likely to “catalyze pressure on asset markets through the lens of corporate earnings and valuations you assign to a lower level of growth.”
Floor traders, according to Reznicek, had low capital requirements. As a result, they could put on strategies like the 1×2 ratio — a debit spread with an extra short option — for a low cost.
(See parts 1, 2, and 3 of ShadowTrader’s how-to series on ratio spreads.)
“On the floor, it is either go big or go home,” he chuckled, remarking that ratio spreads were the way of the casino. “You either get rich or they take your house. So, why would you put on any other spread?”
The next big turning point was Jim Dalton, who’s been a member of the Chicago Board of Trade, as well as a member of the Chicago Board Options Exchange (CBOE) and senior executive vice president of the CBOE during its formative years.
“I’m still in touch with him on a regular basis and I consider him a friend,” Reznicek said in a discussion on Dalton’s works like Mind Over Markets and Markets in Profile, as well as his use of WindoTrader Market Profile software. “I went to Chicago twice to see him teach live … and I came home from those seminars with five, six, 10 pages of notes. The nuances of profile continue to mold me.”
Capelj spoke with Kai Volatility Advisors’ Cem Karsan about the implications of record valuations and the growth of derivatives markets on policy, the economy, and financial markets.
“It’s not a coincidence that the mid-February to mid-March 2020 downturn literally started the day after February expiration and ended the day of March quarterly expiration. These derivatives are incredibly embedded in how the tail reacts and there’s not enough liquidity, given the leverage, if the Fed were to taper.”
Capelj spoke with The Ambrus Group’s Kris Sidial to understand how to capitalize on volatility dislocations.
Unlike standard tail-risk funds which systematically buy equity puts, Ambrus’ approach is bespoke, cutting down on negative dynamics like decay with respect to time.
Given dislocations across single stock skew, term structure, and volatility risk premium, Ambrus will position itself in options with less time to maturity, buying protection up to six weeks out.
“The market will underestimate the distribution,” Sidial said in a conversation on Ambrus’ internal models that spot positional imbalances to determine who is off-sides and in what single asset. “We’re buying things that have happened before and we’re looking for it to carry a heavier beta when the sell-off happens.”
So, by analyzing flow, as well as using internal models to assess the probabilities of deleveraging in a risk-off event, Ambrus is able to venture into individual stocks where there may be excess fragility; “I know if stock XYZ goes down five percent, it’s going to go down 10% because this fund needs to deleverage.”
To aid the cost to carry, Ambrus utilizes defined-risk, short-volatility, absolute return strategies.
“I’m basically giving you a free put on the market – with a ton of convexity – with something that offers a payout that’s just more than a regular put,” Sidial summarized. “If the market doesn’t do anything, and we do an amazing job, we’re flat and you made money on all your long-only equity exposure.”
Capelj spoke with The Ambrus Group’s Kris Sidial about the meme stock debacle of 2021.
“You have distressed debt hedge funds that focus on shorting these types of companies. Melvin Capital is the one that is singled out due to the media, but they aren’t the only ones.”
Market participants added to the crash-up dynamics. Retail investors aggressively bought stock and short-term call options, while institutional investors further took advantage of the momentum and dislocations.
“You have this dynamic in the derivatives market where there is a gamma squeeze when people are buying way far out-of-the-money calls, and dealers reflexively have to hedge off their risk,” Sidial said.
“It causes a cascading reaction, moving the stock price up because dealers are short calls and they have to buy stock when the delta moves a specific way.”
The participation in the stock on the institutional side has not received much attention, he said.
“We’ve noticed that some of the flow is more institutional,” he said in reference to activity on the level two and three order books, which are electronic lists of buy and sell orders for a particular security.
“You have certain prop guys and other hedge funds that understand what’s going on, and they’re trying to take advantage of it, as well.”
This institutional activity disrupted traditional correlations and caused shares of distressed debt assets like GameStop, BlackBerry Ltd, and AMC Entertainment Holdings Inc to trade in-line with each other.
“This was not some WallStreetBet user, … if you look at how some of these things were moving premarket, you would see GME drop like 2%, BB’s best bid would drop and AMC’s best bid would drop. That’s an algo.”
The takeaway: although the WallStreetBets crowd is getting most of the blame, institutions are also at fault for the volatility.
Technical
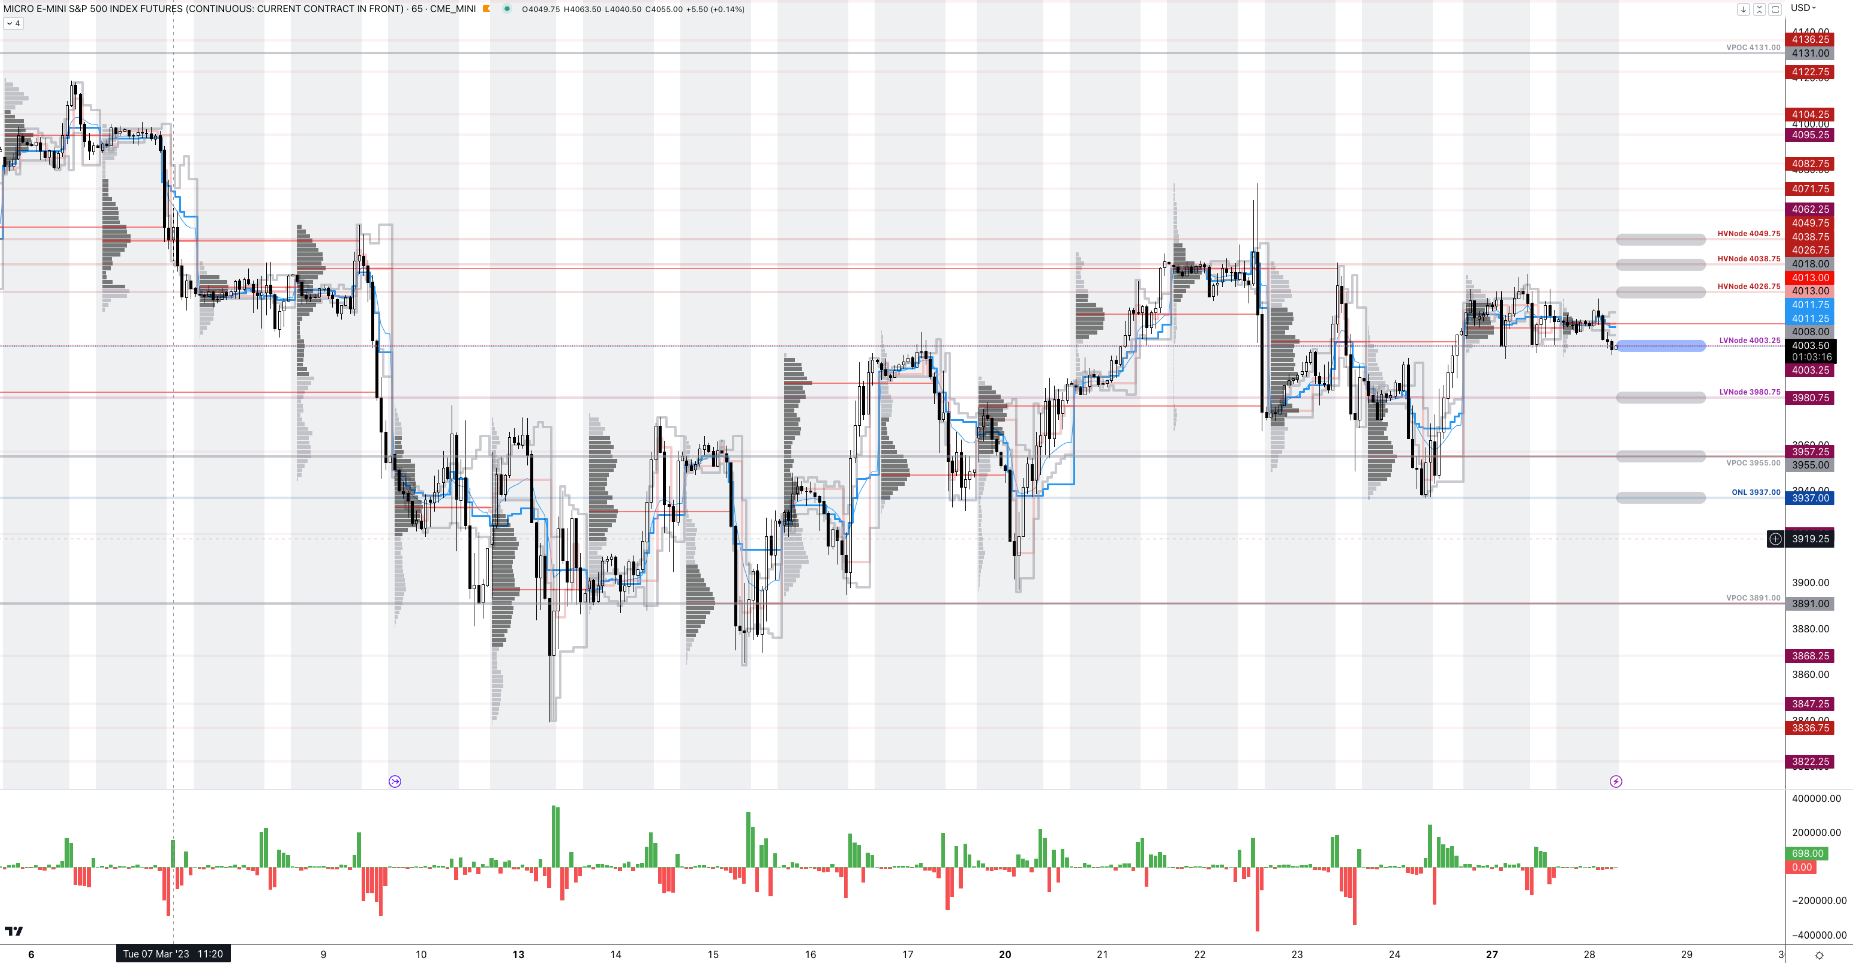
As of 7:00 AM ET, Tuesday’s regular session (9:30 AM – 4:00 PM ET) in the S&P 500 will likely open in the lower part of a balanced overnight inventory, inside the prior day’s range, suggesting a limited potential for immediate directional opportunity.
The S&P 500 pivot for today is $4,003.25.
Key levels to the upside include $4,026.75, $4,038.75, and $4,049.75.
Key levels to the downside include $3,980.75, $3,955.00, and $3,937.00.
Disclaimer: Click here to load the updated key levels via the web-based TradingView platform. New links are produced daily. Quoted levels likely hold, barring an exogenous development.
Graphic: 65-minute profile chart of the Micro E-mini S&P 500 Futures.
Definitions
Overnight Rally Highs (Lows): Typically, there is a low historical probability associated with overnight rally-highs (lows) ending the upside (downside) discovery process.
Volume Areas: Markets will build on areas of high-volume (HVNodes). Should the market trend for some time, this will be identified by a low-volume area (LVNodes). The LVNodes denote directional conviction and ought to offer support on any test.
If participants auction and find acceptance in an area of a prior LVNode, then future discovery ought to be volatile and quick as participants look to the nearest HVNodes for more favorable entry or exit.
POCs: Areas where two-sided trade was most prevalent in a prior day session. Participants will respond to future value tests as they offer favorable entry and exit.
Definitions
Volume Areas: Markets will build on areas of high-volume (HVNodes). Should the market trend for some time, this will be identified by a low-volume area (LVNodes). The LVNodes denote directional conviction and ought to offer support on any test.
If participants auction and find acceptance in an area of a prior LVNode, then future discovery ought to be volatile and quick as participants look to the nearest HVNodes for more favorable entry or exit.
About
The author, Renato Leonard Capelj, spends the bulk of his time at Physik Invest, an entity through which he invests and publishes free daily analyses to thousands of subscribers. The analyses offer him and his subscribers a way to stay on the right side of the market.
You may view this letter’s content calendar at this link.
Disclaimer
Do not construe this newsletter as advice. All content is for informational purposes. Capelj and Physik Invest manage their own capital and will not solicit others for it.
Physik Invest’s Daily Brief is read free by thousands of subscribers. Join this community to learn about the fundamental and technical drivers of markets.
Graphic updated 9:10 AM ET. Sentiment Risk-On if expected /MES open is above the prior day’s range. /MES levels are derived from the profile graphic at the bottom of this letter. Click here for the latest levels. SqueezeMetrics Dark Pool Index (DIX) and Gamma (GEX) with the latter calculated based on where the prior day’s reading falls with respect to the MAX and MIN of all occurrences available. A higher DIX is bullish. The lower the GEX, the more (expected) volatility. Click to learn the implications of volatility, direction, and moneyness. Breadth reflects a reading of the prior day’s NYSE Advance/Decline indicator. The CBOE VIX Volatility Index (INDEX: VVIX) reflects the attractiveness of owning volatility. UMBS prices via MND. Click here for the economic calendar.
Administrative
Sorry for the delay. Please read through the positioning section. Have a great Monday!
As always, if there are holes or unclear language. We will fix this in the next letters.
Fundamental
On 3/22, we mentioned news of Russia wanting to adopt the yuan for settlements.
Putin: We are in favor of using the Chinese yuan for settlements between Russia and the countries of Asia, Africa, and Latin America. I am confident that these forms of settlement in yuan will develop between Russian partners and their counterparts in third countries. pic.twitter.com/Mnw1WfjW4Y
And, with that, publications covering these East alliances use some tough language. One Bloomberg article notes China and Russia “roll[ing] back US power and alliances … [to] create a multipolar world … [and] diminish the reach of democratic values, so autocratic forms of government are secure and even supreme.”
Let’s rewind a bit to understand why all the toughness and fear.
If the US dollar's global supremacy erodes, America will face a reckoning like none before.
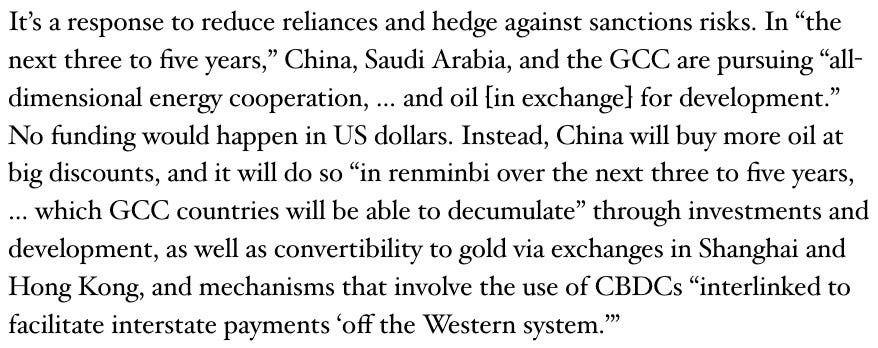
Recall Chinese President Xi Jinping speaking with Saudi and GCC leaders. Here is our 1/4 summary takeaway:
Graphic: Retrieved from Physik Invest’s Daily Brief for January 4, 2023.
Essentially, those remarks confirm the East is hedging sanctions risk. Reliance on the West is falling, and this inevitably will present “non-linear shocks” (i.e., “inflation mess caused by geopolitics, resource nationalism, and BRICS”) monetary policymakers are not equipped to handle. So, are the markets at risk?
President Xi to President Putin:
“Change that hasn’t happened in 100 years is coming and we are driving this change together.”
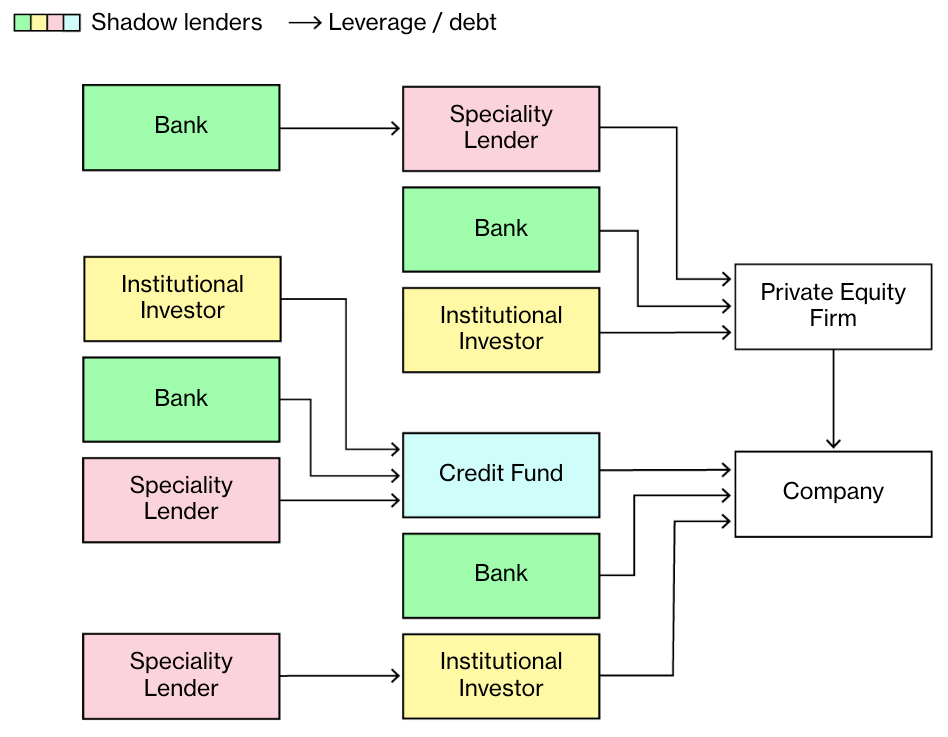
This most recent meeting between China and Russia increases the risks of unwinding the “debt-fueled economy in the US,” FT’s Rana Foroohar confirms, as we wrote in the Daily Brief for 1/4. Further, this is a threat to “hidden leverage and opaqueness.” That means the markets are at risk. Let’s explain more.
With the encumbrance of commodities, among other initiatives, these nations’ weight in currency baskets may rise and keep “inflation from slowing.” If that happens, future rate expectations are off. Additionally, “the US dollar and Treasury securities will likely be dealing with issues they never had to deal with before: less demand, not more; more competition, not less,” we quoted Zoltan Pozsar (ex-Credit Suisse) saying on 1/5.
The markets most responsive to this are public, as we saw with 2022’s de-rate. In 2023 and beyond, added liquidation-type risks lie in the private markets. This will have knock-on effects.
The likes of The Ambrus Group’s Kris Sidial mentioned to your newsletter writer in a Benzinga interview that private market investors’ raising of cash to meet capital calls could prompt sales of their more liquid public market holdings. This is a major risk Sidial noted he was watching, in addition to some risks in the derivatives markets.
At the same time, Eric Basmajian believes the “banking crisis will cause a tightening of money and credit.” This will further solidify the “broader business cycle and corporate profit recession.”
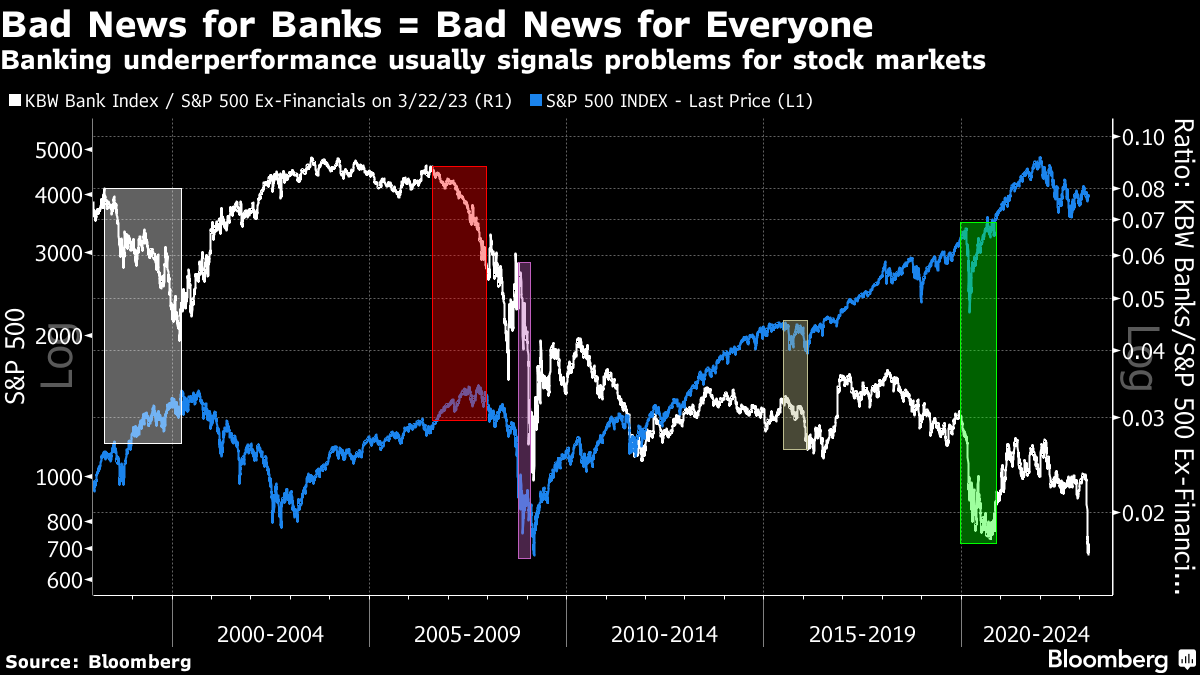
Graphic: Retrieved from Bloomberg. Per John Authers, “the combination of deeply troubled banks and strong performance for the rest of the stock market cannot persist much longer.”
Positioning
Sidial’s well positioned to take advantage of the realization of these risks. In January, he explained that measures like the Cboe VIX Volatility Index (INDEX: VVIX) were low. This suggested, “we can get cheap exposure to convexity while a lot of people are worried.” In an update to Bloomberg, Sidial said The Ambrus Group’s tail-risk strategy (which Sidial has explained to us before) has performed well as the VIX index has risen, a sign of traders hedging concerns about “some contagion hitting and their portfolios being destroyed on that.”
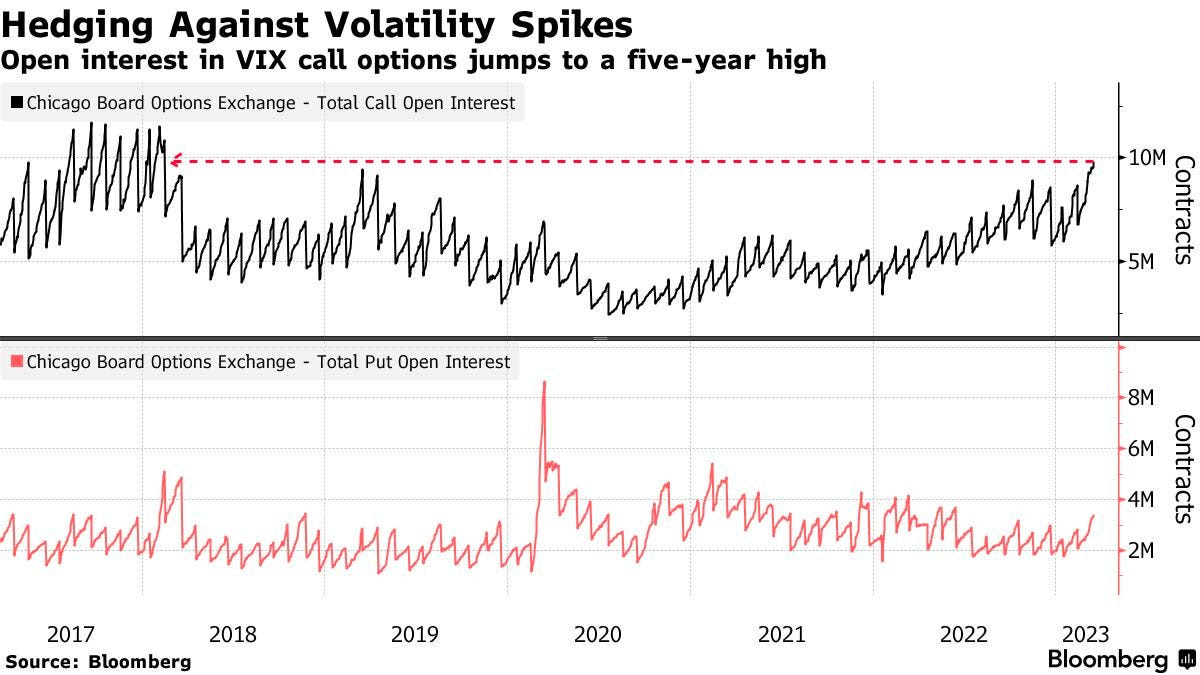
“We have seen an increase in tail hedging,” added Chris Murphy of Susquehanna International Group. “We have continued to see call buying in the VIX since the bank turmoil began.” The caveat, though, is that realized volatility or RVOL, not just implied volatility or IVOL (i.e., that which is implied by traders’ supply and demand of options), must shift and stay higher for those options to maintain their values, which may be difficult according to Kai Volatility’s Cem Karsan.
Though Karsan thinks markets will likely see RVOL come back in a big way, he thinks policymakers’ intervention will be stimulative short-term as it reverses a lot of the quantitative tightening or QT (i.e., flow of capital out of capital markets). Stimulation will be compounded by the continued unwinding of hedging strategies in previously depressed products like the Nasdaq 100 (INDEX: NDX). What do we mean by this?
Recall that traders’ closure and/or monetization of put protection results in options counterparties buying back their short stock and/or futures hedges. Therefore, before any downside is realized, the market may trade into a far “more combustible” position.
Consequently, look for low- and zero-cost call structures (e.g., ratio spreads) to play the upside while opportunistically using higher prices and elevated volatility skew to put on bear put spreads (i.e., buy put and sell another put at a lower strike price) for cheaper prices.
Consider following and supporting us on social media:
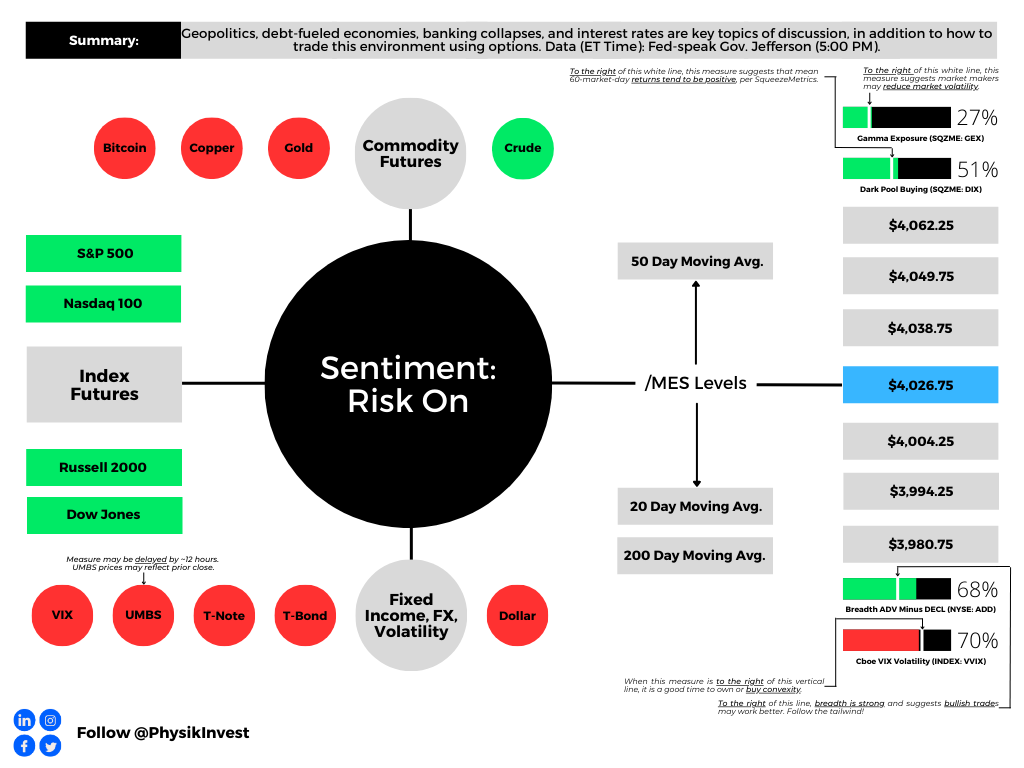
As of 9:10 AM ET, Monday’s regular session (9:30 AM – 4:00 PM ET), in the S&P 500, is likely to open in the upper part of a positively skewed overnight inventory, outside of the prior day’s range, suggesting a potential for immediate directional opportunity.
The S&P 500 pivot for today is $4,026.75.
Key levels to the upside include $4,038.75, $4,049.75, and $4,062.25.
Key levels to the downside include $4,004.25, $3,994.25, and $3,980.75.
Disclaimer: Click here to load the updated key levels via the web-based TradingView platform. New links are produced daily. Quoted levels likely hold barring an exogenous development.
Graphic: 65-minute profile chart of the Micro E-mini S&P 500 Futures.
Definitions
Volume Areas: Markets will build on areas of high-volume (HVNodes). Should the market trend for some time, this will be identified by a low-volume area (LVNodes). The LVNodes denote directional conviction and ought to offer support on any test.
If participants auction and find acceptance in an area of a prior LVNode, then future discovery ought to be volatile and quick as participants look to the nearest HVNodes for more favorable entry or exit.
About
The author, Renato Leonard Capelj, spends the bulk of his time at Physik Invest, an entity through which he invests and publishes free daily analyses to thousands of subscribers. The analyses offer him and his subscribers a way to stay on the right side of the market.
You may view this letter’s content calendar at this link.
Disclaimer
Do not construe this newsletter as advice. All content is for informational purposes. Capelj and Physik Invest manage their own capital and will not solicit others for it.
Separate from his work at Physik Invest, founder Renato Leonard Capelj is an accredited journalist interviewing prestigious global leaders in business, government, and finance.
In his desire to learn and apply the methods of those others who are far more experienced, Capelj has a long list of interviews you may find helpful in strengthening your understanding of markets.
Capelj spoke with Simplify Asset Management’s Michael Green about cutting investors’ portfolio volatility while amplifying profit potential.
In response to uncertainty, Green says investors can park cash in short-term near-risk-free bonds yielding 5% or more, as well as allocate some capital to volatility “to introduce a degree of convexity,” risking only the premium paid. Alternatively, investors can take a more optimistic long view and position in innovations like artificial intelligence or next-generation energy production.
Capelj spoke with The Ambrus Group’s Kris Sidial about his market perspectives.
Naive measures like the VVIX, which is the volatility of the VIX or the volatility of the S&P 500’s volatility, are printing at levels last seen in 2017, Sidial explains, noting this would suggest “we can get cheap exposure to convexity while a lot of people are worried.”
“Even if inflation continues, the rate at which it rises won’t be the same. Due to this, CTA exposures likely will not perform as well as they did in 2022, and that’s why you may see more opportunities in the volatility space.”
Capelj spoke with Damped Spring Advisors’ Andy Constan about what investors should focus on and how he creates trades that lose him less money.
Constan’s trades are constructed around two- to four-month time horizons and are structured long and short using defined-risk options trades like debit or credit spreads, depending on whether volatility is cheap or expensive.
“I want deltas and leverage. My macro indicators give me an edge on price and in the worst case, the loss is limited to 10%, if everything has to go against me all at once. I can be 100% invested and only risk 10%.”
Capelj spoke with 42 Macro’s Darius Dale about his Wall Street story and perspectives on life and markets.
“We’re tracking at an above-potential level of output in terms of the growth rate of output. We’re also slowing and the pace of that deceleration is likely to pick up steam in the coming quarters.”
By 2023, that process is likely to “catalyze pressure on asset markets through the lens of corporate earnings and valuations you assign to a lower level of growth.”
Floor traders, according to Reznicek, had low capital requirements. As a result, they could put on strategies like the 1×2 ratio — a debit spread with an extra short option — for a low cost.
(See parts 1, 2, and 3 of ShadowTrader’s how-to series on ratio spreads.)
“On the floor, it is either go big or go home,” he chuckled, remarking that ratio spreads were the way of the casino. “You either get rich or they take your house. So, why would you put on any other spread?”
The next big turning point was Jim Dalton, who’s been a member of the Chicago Board of Trade, as well as a member of the Chicago Board Options Exchange (CBOE) and senior executive vice president of the CBOE during its formative years.
“I’m still in touch with him on a regular basis and I consider him a friend,” Reznicek said in a discussion on Dalton’s works like Mind Over Markets and Markets in Profile, as well as his use of WindoTrader Market Profile software. “I went to Chicago twice to see him teach live … and I came home from those seminars with five, six, 10 pages of notes. The nuances of profile continue to mold me.”
Capelj spoke with Kai Volatility Advisors’ Cem Karsan about the implications of record valuations and the growth of derivatives markets on policy, the economy, and financial markets.
“It’s not a coincidence that the mid-February to mid-March 2020 downturn literally started the day after February expiration and ended the day of March quarterly expiration. These derivatives are incredibly embedded in how the tail reacts and there’s not enough liquidity, given the leverage, if the Fed were to taper.”
Capelj spoke with The Ambrus Group’s Kris Sidial to understand how to capitalize on volatility dislocations.
Unlike standard tail-risk funds which systematically buy equity puts, Ambrus’ approach is bespoke, cutting down on negative dynamics like decay with respect to time.
Given dislocations across single stock skew, term structure, and volatility risk premium, Ambrus will position itself in options with less time to maturity, buying protection up to six weeks out.
“The market will underestimate the distribution,” Sidial said in a conversation on Ambrus’ internal models that spot positional imbalances to determine who is off-sides and in what single asset. “We’re buying things that have happened before and we’re looking for it to carry a heavier beta when the sell-off happens.”
So, by analyzing flow, as well as using internal models to assess the probabilities of deleveraging in a risk-off event, Ambrus is able to venture into individual stocks where there may be excess fragility; “I know if stock XYZ goes down five percent, it’s going to go down 10% because this fund needs to deleverage.”
To aid the cost to carry, Ambrus utilizes defined-risk, short-volatility, absolute return strategies.
“I’m basically giving you a free put on the market – with a ton of convexity – with something that offers a payout that’s just more than a regular put,” Sidial summarized. “If the market doesn’t do anything, and we do an amazing job, we’re flat and you made money on all your long-only equity exposure.”
Capelj spoke with The Ambrus Group’s Kris Sidial about the meme stock debacle of 2021.
“You have distressed debt hedge funds that focus on shorting these types of companies. Melvin Capital is the one that is singled out due to the media, but they aren’t the only ones.”
Market participants added to the crash-up dynamics. Retail investors aggressively bought stock and short-term call options, while institutional investors further took advantage of the momentum and dislocations.
“You have this dynamic in the derivatives market where there is a gamma squeeze when people are buying way far out-of-the-money calls, and dealers reflexively have to hedge off their risk,” Sidial said.
“It causes a cascading reaction, moving the stock price up because dealers are short calls and they have to buy stock when the delta moves a specific way.”
The participation in the stock on the institutional side has not received much attention, he said.
“We’ve noticed that some of the flow is more institutional,” he said in reference to activity on the level two and three order books, which are electronic lists of buy and sell orders for a particular security.
“You have certain prop guys and other hedge funds that understand what’s going on, and they’re trying to take advantage of it, as well.”
This institutional activity disrupted traditional correlations and caused shares of distressed debt assets like GameStop, BlackBerry Ltd, and AMC Entertainment Holdings Inc to trade in-line with each other.
“This was not some WallStreetBet user, … if you look at how some of these things were moving premarket, you would see GME drop like 2%, BB’s best bid would drop and AMC’s best bid would drop. That’s an algo.”
The takeaway: although the WallStreetBets crowd is getting most of the blame, institutions are also at fault for the volatility.
Physik Invest’s Daily Brief is read free by thousands of subscribers. Join this community to learn about the fundamental and technical drivers of markets.
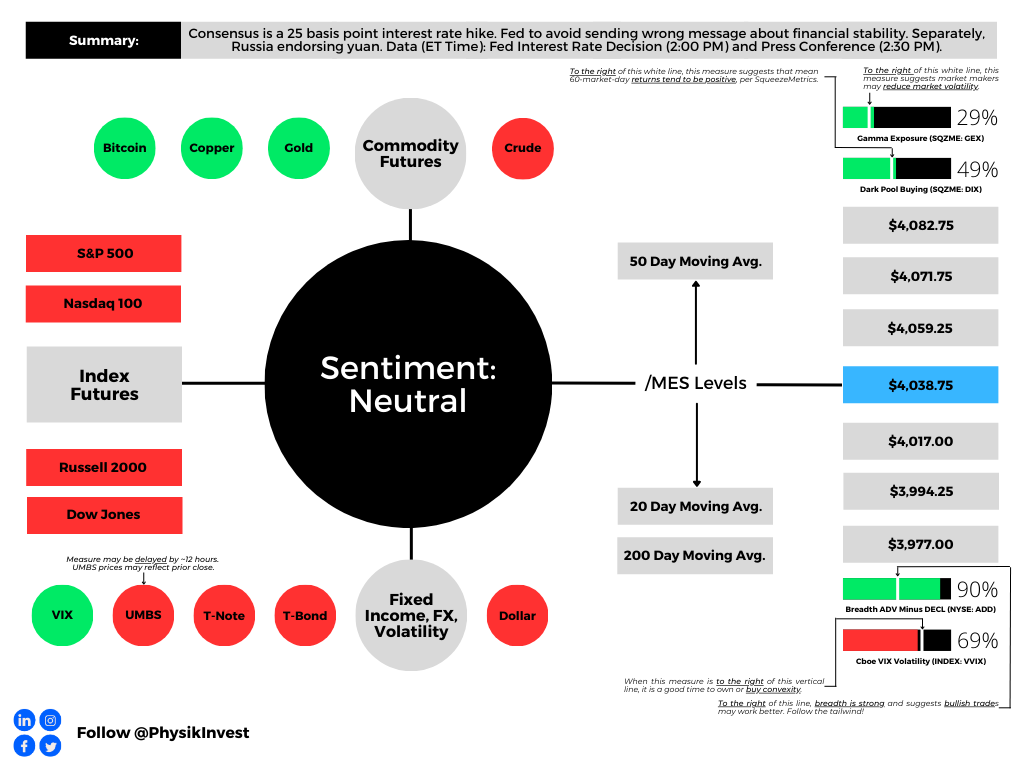
Graphic updated 8:20 AM ET. Sentiment Neutral if expected /MES open is inside of the prior day’s range./MES levels are derived from the profile graphic at the bottom of this letter. Click here for the latest levels. SqueezeMetrics Dark Pool Index (DIX) and Gamma (GEX) with the latter calculated based on where the prior day’s reading falls with respect to the MAX and MIN of all occurrences available. A higher DIX is bullish. The lower the GEX, the more (expected) volatility. Click to learn the implications of volatility, direction, and moneyness. Breadth reflects a reading of the prior day’s NYSE Advance/Decline indicator. The CBOE VIX Volatility Index (INDEX: VVIX) reflects the attractiveness of owning volatility. UMBS prices via MND. Click here for the economic calendar.
Administrative
Recall our past letters pondering the use of the yuan for settlements in the East. Well, there’s been progress on that end.
Putin: We are in favor of using the Chinese yuan for settlements between Russia and the countries of Asia, Africa, and Latin America. I am confident that these forms of settlement in yuan will develop between Russian partners and their counterparts in third countries. pic.twitter.com/Mnw1WfjW4Y
Also recall “the recycling of petrodollars by oil-rich nations” fueling “several emerging market debt crises” and prompting “the creation of a more speculative, debt-fueled economy in the US.” Is this a reversing trend? We shall unpack in a future letter, soon.
Fundamental
The Federal Reserve (Fed) is likely to bump its current target rate up 25 basis points to 4.75-5.00%. Failing to bump interest rates would likely send the wrong message about financial stability. To give up on the inflation fight (a pause or interest rate cut) would tell investors “look out below,” Bloomberg summarizes.
Graphic: Retrieved from CME Group Inc’s (NASDAQ: CME) FedWatch Tool.
The path after is less certain, though most think there is likely to be at least one additional hike in the coming months. The catch is that if market-induced financial tightening persists through the second quarter, it would substitute for rate hikes.
Assuming the Fed publishes its summary of economic projections (SEP) or dot plot, they will likely show the governors “getting less aggressive,” adds Bloomberg’s John Authers.
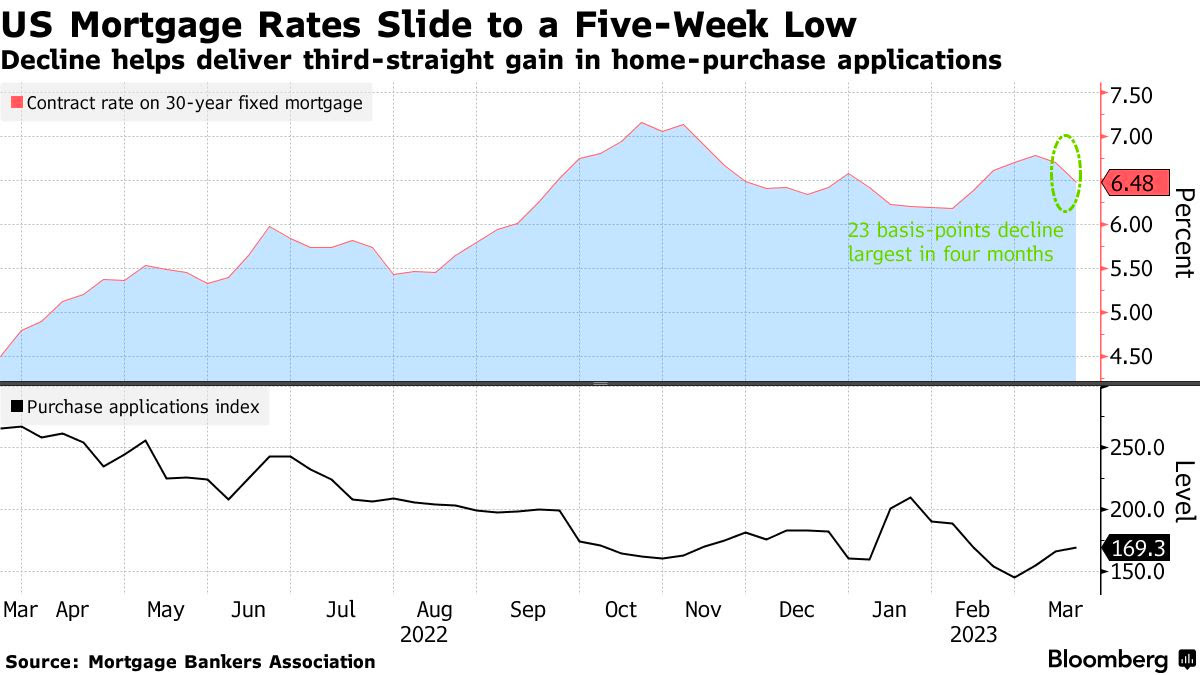
If we recall, Kai Volatility’s Cem Karsan talked about the Fed not wanting liquidations; they want a slow sale, not a fire sale. So, with there being a lag, the Fed may want to slow and assess, carefully telegraphing this being not a pivot. A pivot would probably inspire confidence among investors to own assets “mak[ing] things hotter,” Karsan explains, noting that the Fed really needs to walk up the long end of the yield curve. Recall that the long end fell considerably on the back of the turmoil and intervention, as well as recent data (e.g., housing starts showing more supply, likely a mortgage application booster that would further “make things hotter”).
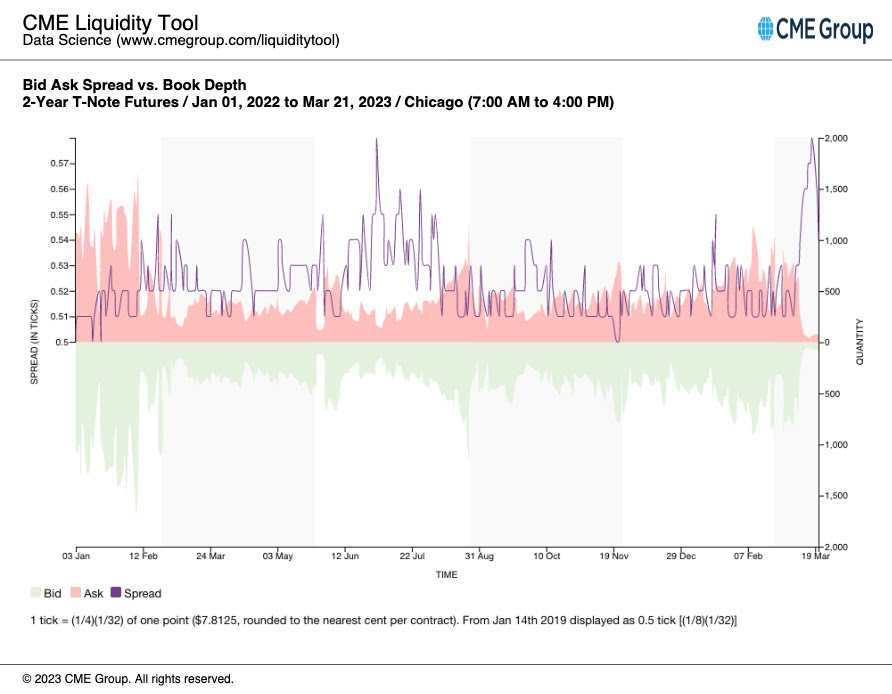
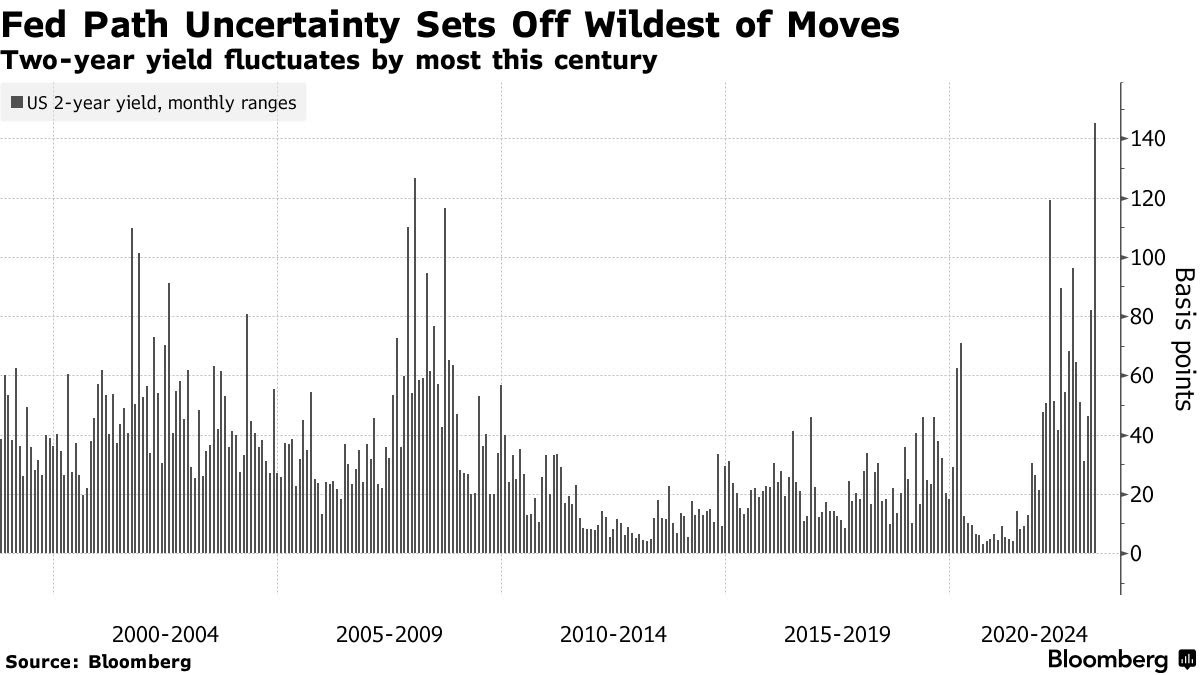
In large part the result of low liquidity, Treasury volatility could prompt the Fed to adjust their quantitative tightening or QT (i.e., the flow of capital out of capital markets) program, instead. Just as quantitative easing or QE (i.e., the flow of capital into capital markets) did little to spark off inflation, it’s unlikely that temping QT would disrupt efforts to rein inflation.
Graphic: Retrieved from CME Group Inc’s (NASDAQ: CME) Liquidity Tool. Per a Bloomberg article, “the spread between offered prices and what sellers will accept has widened for all maturities, … a sign of thinning market depth” and illiquidity.
Adjusting QT, which is contributing to the excessive volatility, “would be preferable to not raising rates … [since] an abrupt pause in rate hikes would likely resurrect the notion that there’s, indeed, a Fed ‘put’ designed to bail out Wall Street at the first sign of stress,” a potential catalyst for market upside, says Robert Burgess.
In Tuesday’s letter, we talked about the potential for fears of downside easing and fears of missing out (i.e., FOMO) on upside rising. Specifically, the letter said the following:
“A response may be FOMO-type demand for call options exposures, coupled with CTAs further ‘raising their equity exposure’ on trend signals and lower volatility, boosting markets into a ‘more combustible’ state as explained on 2/17. This fear of missing out is visible in options volatility skew; traders are hedging those tail outcomes.”
In support of the most recent strength, per JPMorgan Chase & Co’s (NYSE: JPM) trade desk commentary, there is a buy skew. Goldman Sachs Group Inc (NYSE: GS) strategists agree, noting that flows are almost entirely “cover-driven.”
Recall that traders sought protection amidst all the calamities recently. Accordingly, measures of implied volatility or IVOL including the Cboe Volatility Index or VIX rose (e.g. traders demand exposure to downside put protection by way of S&P 500 options which bids options prices and manifests higher IVOL and counterparty pressure from their equity future/stock sales to hedge this demand). These same measures of IVOL are now falling as traders’ closure of protection results in counterparty pressures being lifted (helping explain, in part, the above “cover-driven” remark by GS).
Does this rally have breadth behind it? Look no further than market internals.
Graphic: Retrieved from Bloomberg via Liz Young. “The Nasdaq’s Cumulative Advance-Decline line has parted ways with index direction in recent days. In other words, the index has rallied despite weak breadth (more stocks falling than rising), the two lines are likely to find their way back together somehow…”
A pause before the Fed announcement, and then breadth catches up to price?
Or, has the typical post-Fed IVOL boost been spent?
Regardless, we maintain that low-cost call options structures as proposed in previous letters worked (and may continue to work). Notwithstanding, look for opportunities to play the downside should markets trade higher into a “more combustible” position.
More on trade ideas in the next letters. Take care.
Technical
As of 8:15 AM ET, Wednesday’s regular session (9:30 AM – 4:00 PM ET), in the S&P 500, is likely to open in the upper part of a negatively skewed overnight inventory, inside of the prior day’s range, suggesting a limited potential for immediate directional opportunity.
The S&P 500 pivot for today is $4,038.75.
Key levels to the upside include $4,059.25, $4,071.75, and $4,082.75.
Key levels to the downside include $4,017.00, $3,994.25, and $3,977.00.
Disclaimer: Click here to load the updated key levels via the web-based TradingView platform. New links are produced daily. Quoted levels likely hold barring an exogenous development.
Graphic: 65-minute profile chart of the Micro E-mini S&P 500 Futures (bottom middle).
Definitions
Volume Areas: Markets will build on areas of high-volume (HVNodes). Should the market trend for a period of time, this will be identified by a low-volume area (LVNodes). The LVNodes denote directional conviction and ought to offer support on any test.
If participants auction and find acceptance in an area of a prior LVNode, then future discovery ought to be volatile and quick as participants look to the nearest HVNodes for more favorable entry or exit.
POCs: Areas where two-sided trade was most prevalent in a prior day session. Participants will respond to future tests of value as they offer favorable entry and exit.
About
The author, Renato Leonard Capelj, spends the bulk of his time at Physik Invest, an entity through which he invests and publishes free daily analyses to thousands of subscribers. The analyses offer him and his subscribers a way to stay on the right side of the market.
You may view this letter’s content calendar at this link.
Disclaimer
Do not construe this newsletter as advice. All content is for informational purposes. Capelj and Physik Invest manage their own capital and will not solicit others for it.
Physik Invest’s Daily Brief is read free by thousands of subscribers. Join this community to learn about the fundamental and technical drivers of markets.
Graphic updated 8:10 AM ET. Sentiment Neutral if expected /MES open is inside of the prior day’s range. /MES levels are derived from the profile graphic at the bottom of this letter. Click here for the latest levels. SqueezeMetrics Dark Pool Index (DIX) and Gamma (GEX) with the latter calculated based on where the prior day’s reading falls with respect to the MAX and MIN of all occurrences available. A higher DIX is bullish. The lower the GEX, the more (expected) volatility. Click to learn the implications of volatility, direction, and moneyness. Breadth reflects a reading of the prior day’s NYSE Advance/Decline indicator. The CBOE VIX Volatility Index (INDEX: VVIX) reflects the attractiveness of owning volatility. UMBS prices via MND. Click here for the economic calendar.
Fundamental
As well summarized by Eric Basmajian, inflation, and growth are on a downward trajectory. Most leading indicators “suggest recessionary pressure will be ongoing.” The banking crisis and response, which will ultimately “cause a tightening of lending to the private economy,” likely exacerbates the ongoing recessionary pressures.
Most strategists including the Damped Spring’s Andy Constan agree. In a recent video, Constan detailed the implications of policymakers’ intervention. In short, an asset fire sale was turned into a managed sale, and a reduction in credit creation will tighten financial conditions, slowing the economy and inflation.
“Small banks that are facing deposit outflows will see earnings and margins collapse as their cost of funds surges from 1% or 2% on deposits to 4% or 5% at the Fed funding facility,” Basmajian summarizes, noting that the increase in the Federal Reserve (Fed) balance sheet came from the discount window, new bank funding facilities, and spillover from the FDIC insurance backstop, all of which are not to be confused with quantitative easing or QE (i.e., monetary stimulus and a flow of capital into capital markets).
Graphic: Retrieved from Bank of American Corporation (NYSE: BAC) via The Market Ear.
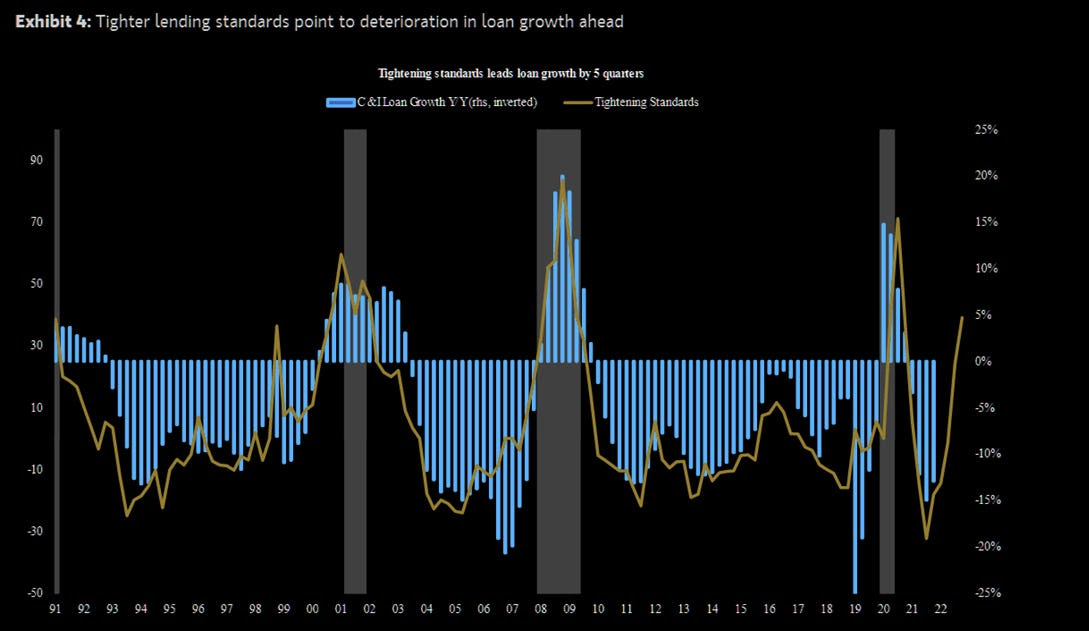
“As deposits leave regional and smaller banks for more yield and safety, they will flow into bigger banks that do less lending or into money market funds that don’t drive credit creation.” Consequently, there will be “a significant tightening of lending standards, and a credit crunch on the private economy as regional and smaller banks face massive funding pressure.”
Graphic: Retrieved from Morgan Stanley (NYSE: MS) via The Market Ear. “MS models show that a permanent +10pt tightening in lending standards for C&I loans leads to a 35bps rise in the unemployment rate over the next two years. Historically, recessions have arrived more than half a year after jobless claims begin a sustained rise.”
Traders are conflicted about the Fed’s coming interest rate decision. Many were expecting a couple more hikes of at least 25 basis points in size. However, following the recent bank turmoil in the US and abroad, it appears that traders think it will be one additional 25 basis point hike before rate cuts ensue in mid-2023.
Graphic: Retrieved from CME Group Inc’s (NASDAQ: CME) FedWatch Tool.
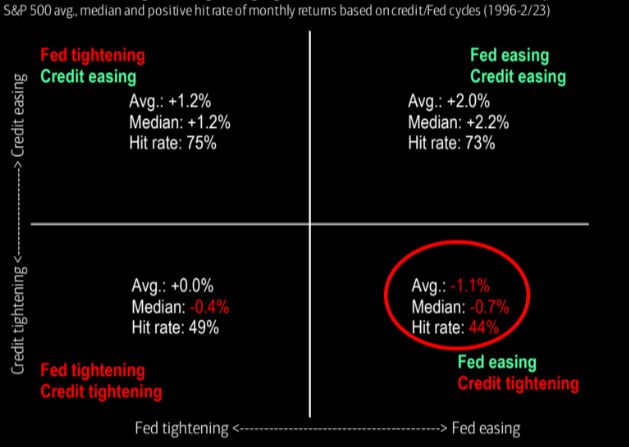
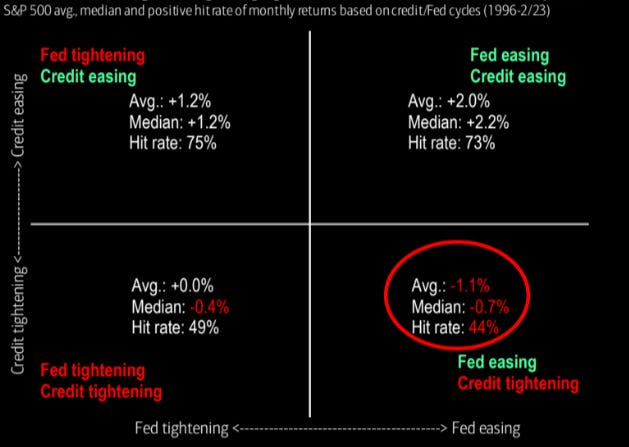
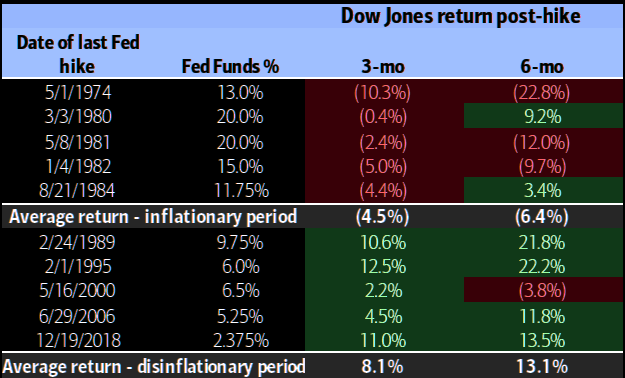
Historically, selling markets on the last Fed rate hike is a good strategy, Bank of America found.
Graphic: Retrieved from Bank of American Corporation (NYSE: BAC) via The Market Ear.
Positioning
Top-line measures of implied volatility or IVOL including the Cboe Volatility Index or VIX are higher heading into Monday’s trade.
Macro uncertainties have some frightened, hence “equity volatility present[ing] itself in a much stronger way,” said The Ambrus Group’s Kris Sidial. For this equity volatility (i.e., implied volatility or IVOL) to continue performing well, realized volatility or RVOL (i.e., the movement that actually happens and is not implied by traders’ supply and demand of options) must shift and stay higher as well (note: in many ways RVOL and IVOL reinforce the other during extreme greed or fear events.
Though big options expiries (OpEx) “may help unpin the market” and manifest market downside and follow-through in RVOL needed to keep IVOL performing, the window for this to happen may be closing.
The monetization of profitable options structures, as well as volatility compression and options decay, may result in counterparties buying back their short stock and/or futures hedges (to the short put positions they have on), thus boosting the market (particularly the depressed and rate-sensitive Nasdaq 100).
If the market rallies, that has the potential to “make things hotter” in the economy, explained Kai Volatility’s Cem Karsan, which emboldens policymakers to make and keep policy tighter. So, barring follow-through to the downside, any equity market upside that arises is likely limited, as a disclaimer, some think.
Apologies for rushing this section, today. More on positioning in the coming letters.
Technical
As of 8:10 AM ET, Monday’s regular session (9:30 AM – 4:00 PM ET), in the S&P 500, is likely to open in the middle part of a negatively skewed overnight inventory, inside of the prior day’s range, suggesting a limited potential for immediate directional opportunity.
The S&P 500 pivot for today is $3,946.75.
Key levels to the upside include $3,970.75, $3,994.25, and $4,026.75.
Key levels to the downside include $3,912.25, $3,891.00, and $3,868.25.
Disclaimer: Click here to load the updated key levels via the web-based TradingView platform. New links are produced daily. Quoted levels likely hold barring an exogenous development.
Graphic: 65-minute profile chart of the Micro E-mini S&P 500 (FUTURE: /MES) bottom-middle.
Definitions
Volume Areas: Markets will build on areas of high-volume (HVNodes). Should the market trend for a period of time, this will be identified by a low-volume area (LVNodes). The LVNodes denote directional conviction and ought to offer support on any test.
If participants auction and find acceptance in an area of a prior LVNode, then future discovery ought to be volatile and quick as participants look to the nearest HVNodes for more favorable entry or exit.
POCs: Areas where two-sided trade was most prevalent in a prior day session. Participants will respond to future tests of value as they offer favorable entry and exit.
About
The author, Renato Leonard Capelj, spends the bulk of his time at Physik Invest, an entity through which he invests and publishes free daily analyses to thousands of subscribers. The analyses offer him and his subscribers a way to stay on the right side of the market.
You may view this letter’s content calendar at this link.
Disclaimer
Do not construe this newsletter as advice. All content is for informational purposes. Capelj and Physik Invest manage their own capital and will not solicit others for it.
Physik Invest’s Daily Brief is read free by thousands of subscribers. Join this community to learn about the fundamental and technical drivers of markets.
Graphic updated 7:15 AM ET. Sentiment Neutral if expected /MES open is inside of the prior day’s range. /MES levels are derived from the profile graphic at the bottom of this letter. Click here for the latest levels. SqueezeMetrics Dark Pool Index (DIX) and Gamma (GEX) with the latter calculated based on where the prior day’s reading falls with respect to the MAX and MIN of all occurrences available. A higher DIX is bullish. The lower the GEX, the more (expected) volatility. Click to learn the implications of volatility, direction, and moneyness. Breadth reflects a reading of the prior day’s NYSE Advance/Decline indicator. The CBOE VIX Volatility Index (INDEX: VVIX) reflects the attractiveness of owning volatility. UMBS prices via MND. Click here for the economic calendar.
Administrative
As previously indicated, through the end-of-this week, newsletters may be shorter due to the letter writer’s commitments. Take care!
Fundamental
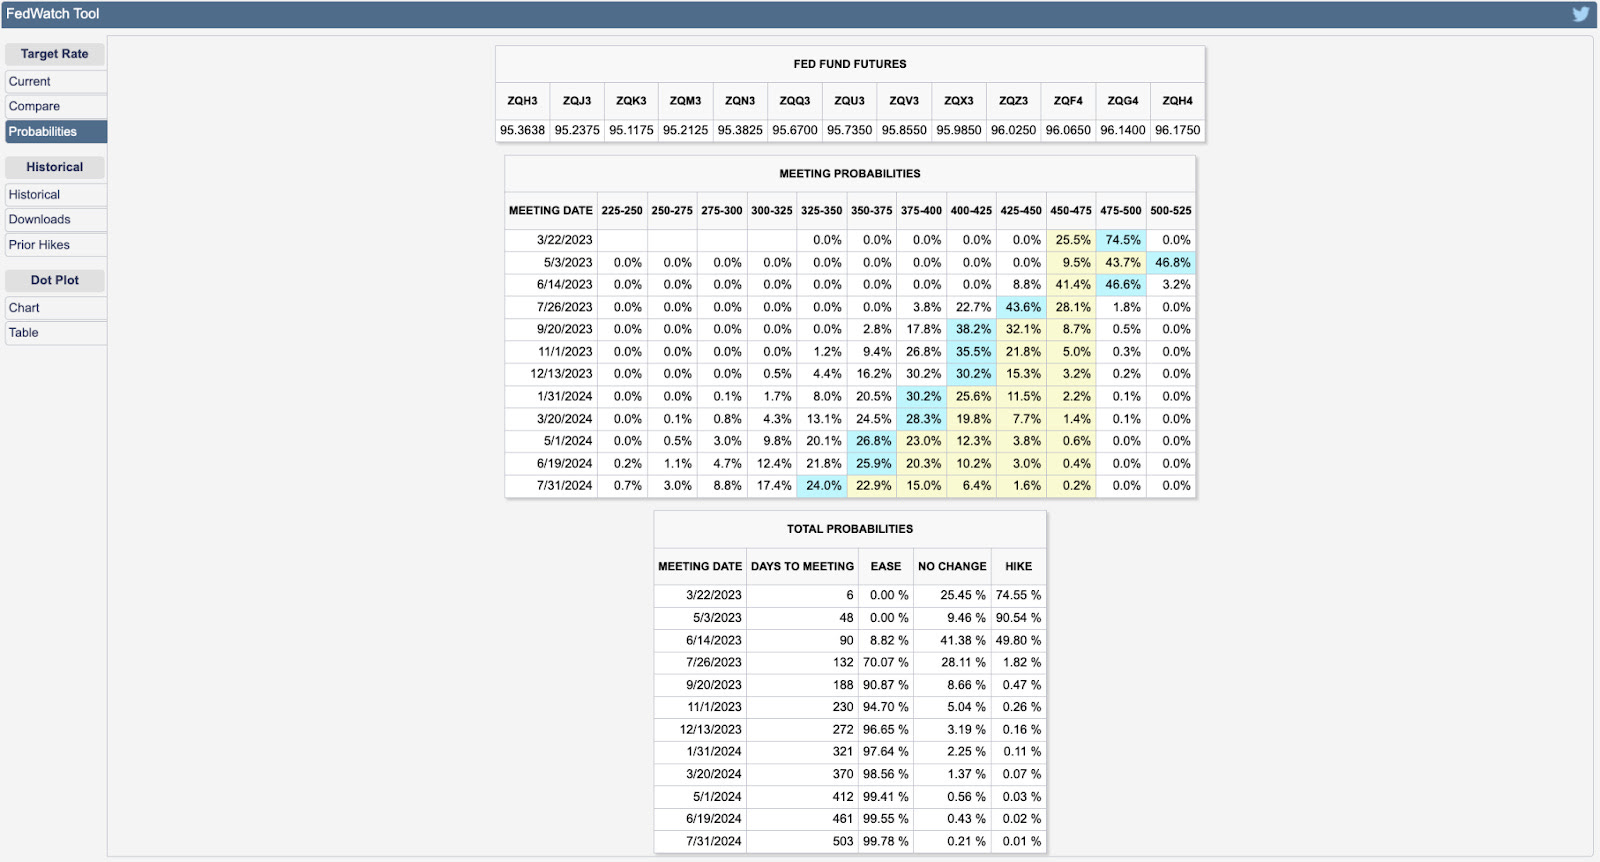
Based on the 30-Day Fed Funds (FUTURE: /ZQ), traders expect the Federal Reserve (Fed) to continue its tightening campaign with a 25 basis point rate hike at the next Federal Open Market Committee (FOMC) meeting. Following this, traders expect one more 25 basis point hike that brings the terminal or peak rate to 5.00-5.25%.
Graphic: Retrieved from CME Group Inc’s (NASDAQ: CME) FedWatch Tool.
Earlier this week, traders were pricing out hikes on financial institutions’ liquidity issues (e.g., SVB Financial Group) and data, including producer prices and retail sales, “moving in the right direction,” said Vital Knowledge’s Adam Crisafulli.
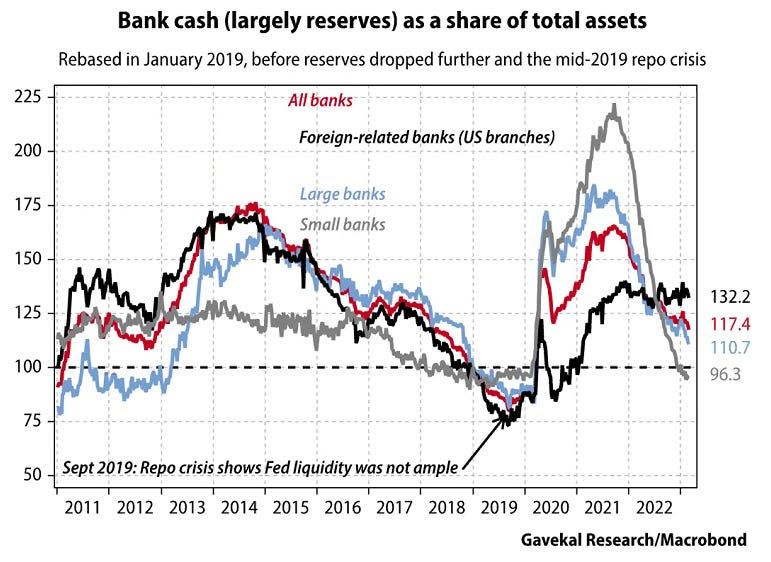
Graphic: Retrieved from Bloomberg via Gavekal Research/Macrobond. Recall that the Fed believes in needs a certain level of reserves for the proper functioning of the financial system (~$2 trillion). In 2019, banks dumped a lot of their reserves into repo to earn some extra return. When QT was about to end, there was less money in their reserves which preceded a spike in rates and a blow-up among those who needed the money the most, as explained here. Read the Daily Brief for September 20, 2022, for more.
Now, with fear of contagion ebbing on authorities’ commitment to preventing an “all-out systemic crisis,” explains Bloomberg’s John Authers, traders are again expecting a 5.00-5.25% terminal or peak rate.
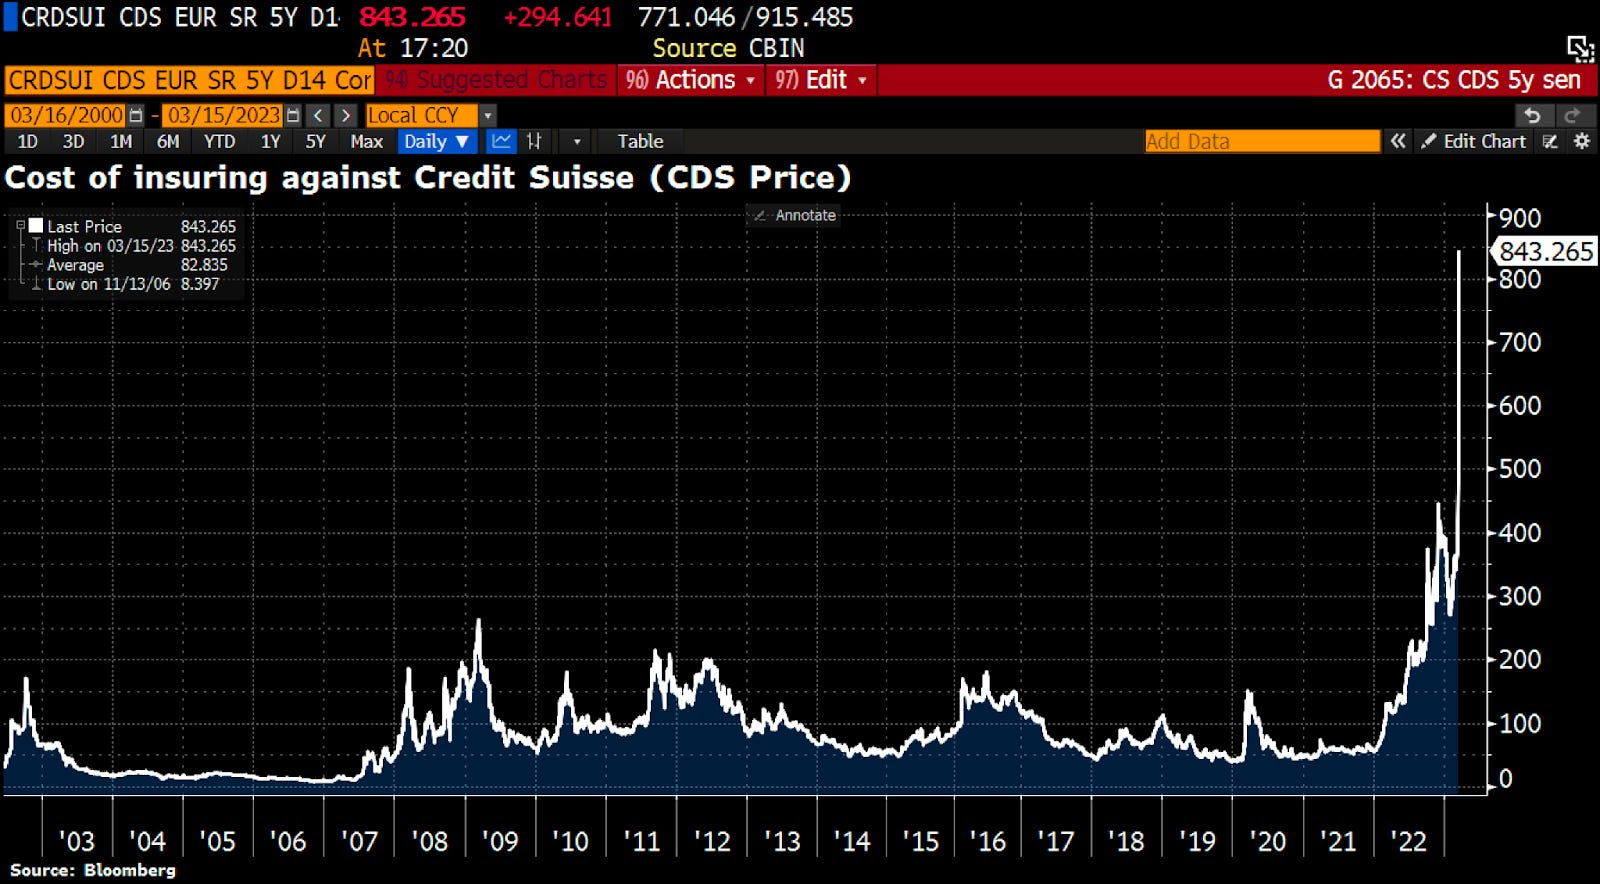
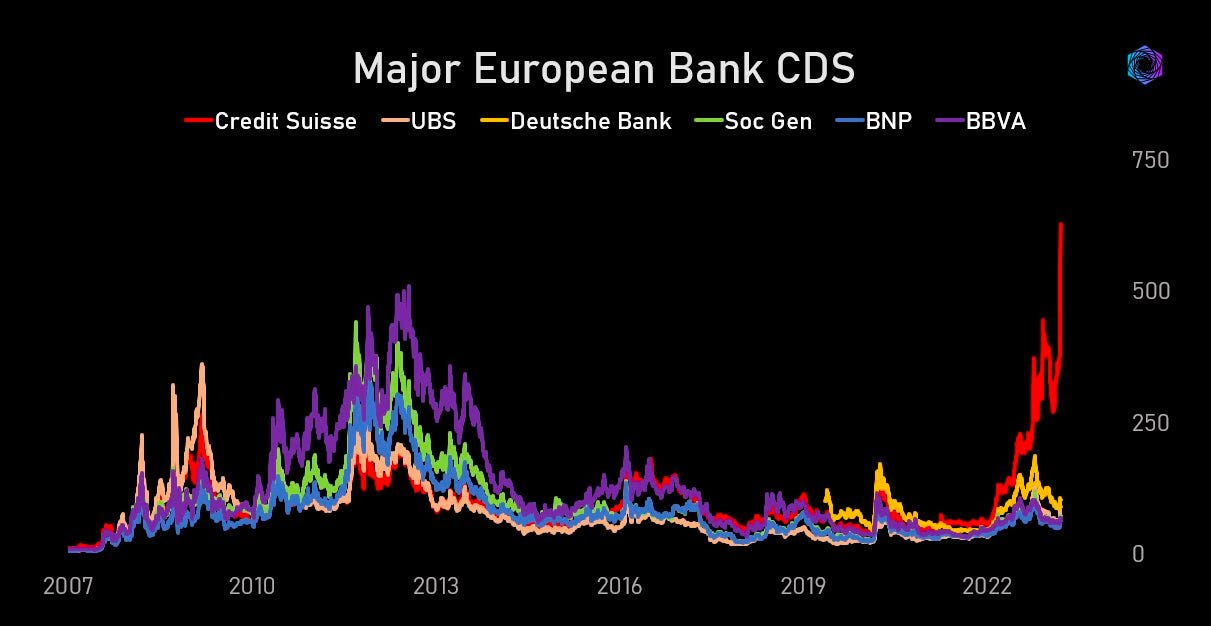
Read: Credit Suisse Group AG (NYSE: CS) protection reaches prohibitively expensive levels as banks rush into CDS after big shareholders hesitate to boost their stake. Switzerland was forced to step in with a $54 billion lifeline to stabilize the crisis.
Graphic: Retrieved from Bloomberg via Holger Zschaepitz.
Adding, as Unlimited’s Bob Elliott puts it, “in the [Global Financial Crisis], credit risk spread rapidly. Today, there is very little [credit default swap] impact” or carryover.
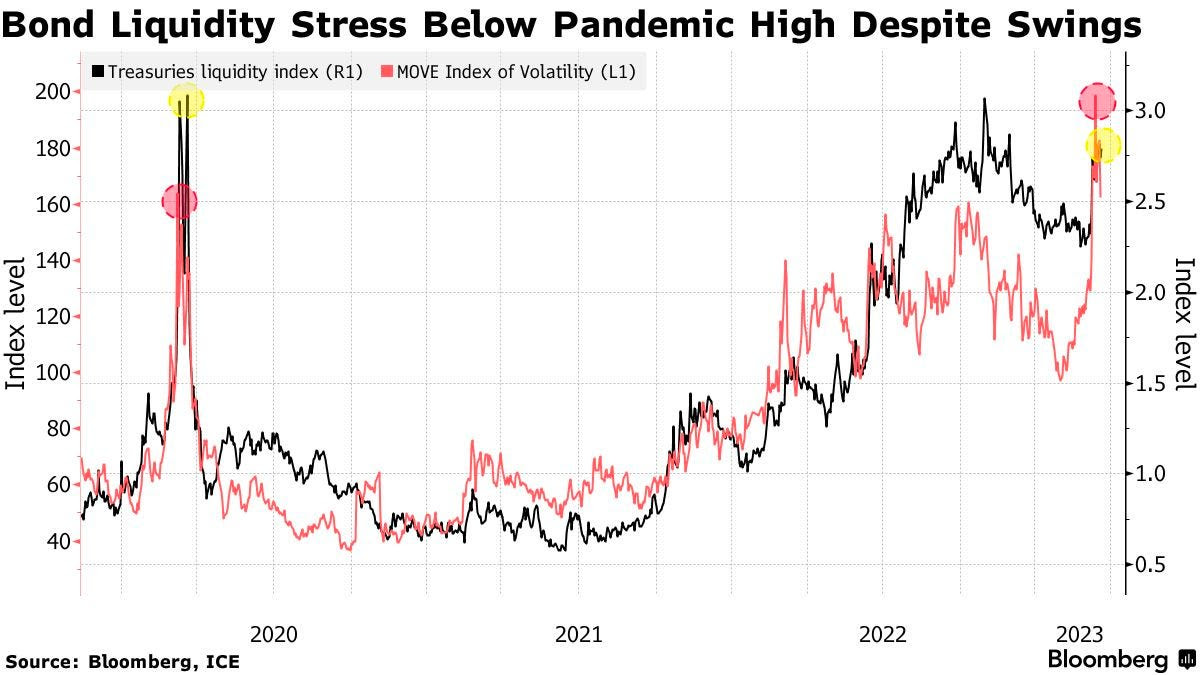
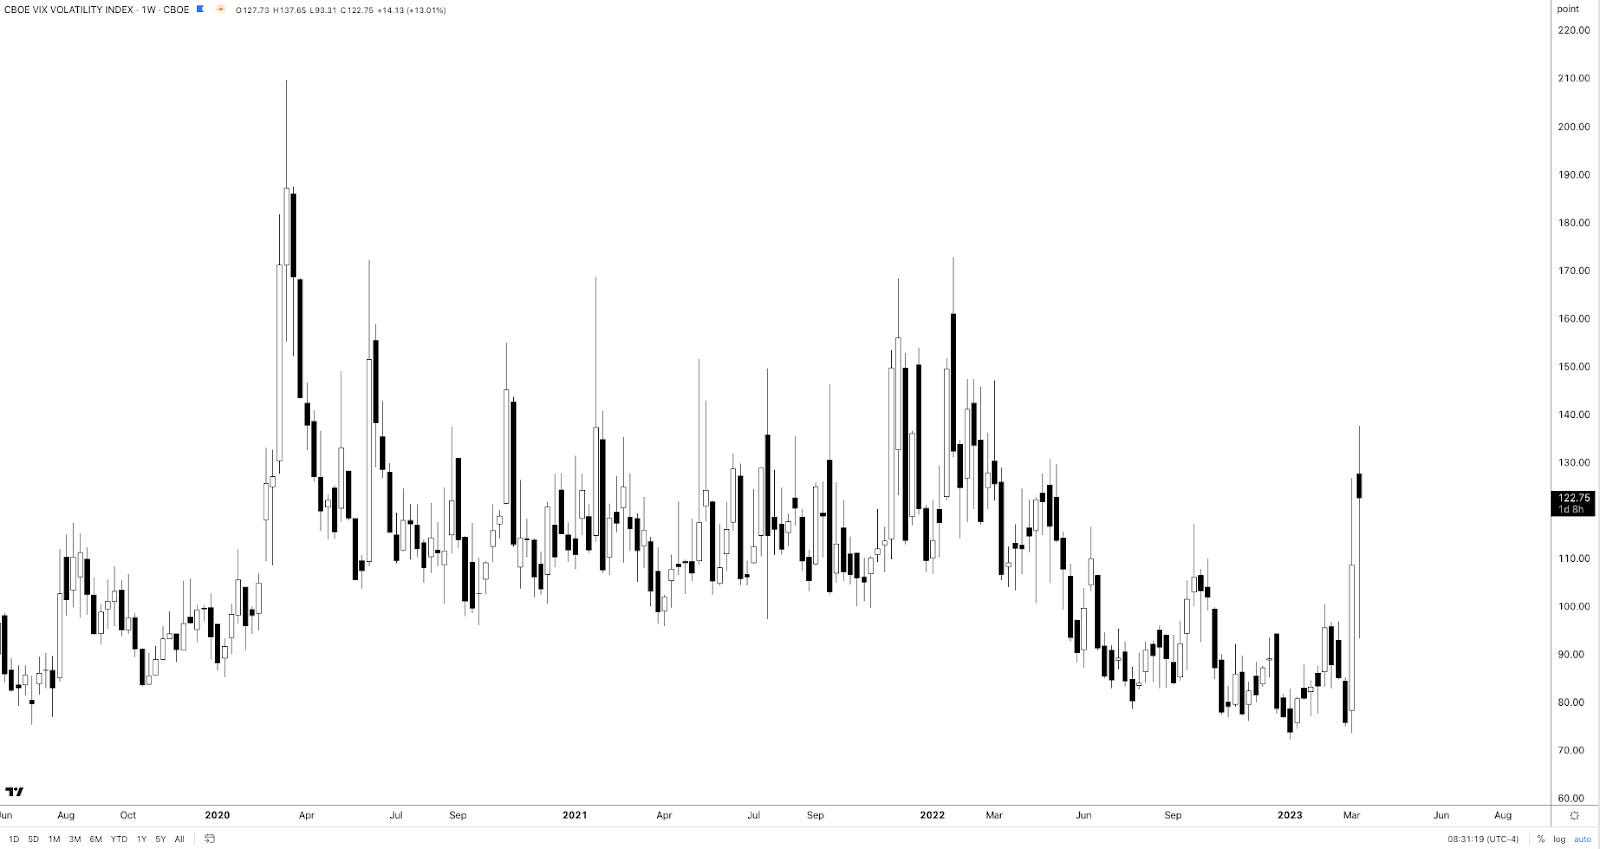
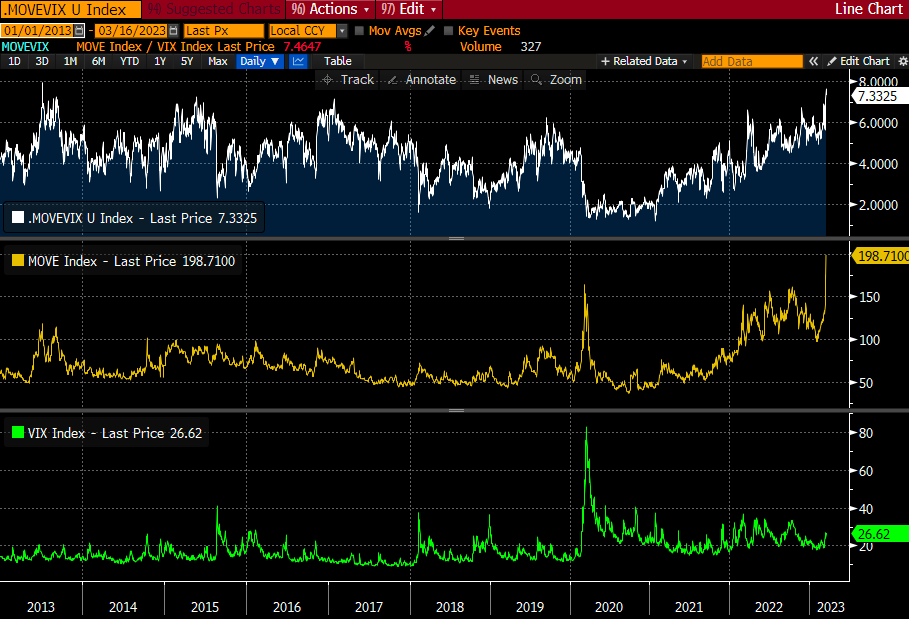
Following measures of US Treasury yield volatility implied by options (i.e., bets or hedges on or against market movement) adjusting higher, equity market volatility strengthened as observed by measures of convexity (e.g., Cboe VIX Volatility Index or VVIX). The Daily Brief for March 14 talked about this in detail.
Graphic: VVIX chart retrieved from TradingView.
For this protection to keep its value and continue to perform well, realized volatility or RVOL must shift higher substantially and stay elevated. That’s not really happening to some big extent, at least in the equity market. Consequently, put structures such as bear put spreads in the S&P 500 (INDEX: SPX), for example, are not performing.
Graphic: Retrieved from Alpha_Ex_LLC. “Easy to argue that rate vol is leading and in this context, one could suggest VIX has room to rise from here.” However, it would “take a lot for the MOVE to sustain itself at this level.”
This information, coupled with falling implied volatility or IVOL, the passage of nearing derivatives expiries, and the strength of products like the Nasdaq 100 (INDEX: NDX) relative to others like the Russell 2000 (INDEX: RUT), has your letter writer leaning optimistic. Though it may be too early to position for strength, one may consider it the way it was explained in the Daily Brief on March 14.
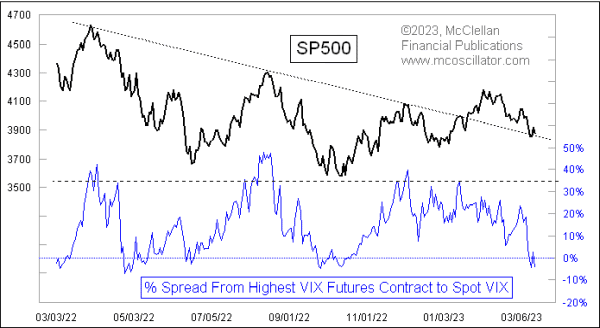
Graphic: Retrieved from Tom McClellan. “The direct message is that the SP500 options traders who drive the VIX Index are feeling more fearful than the VIX futures traders believe is merited.”
Technical
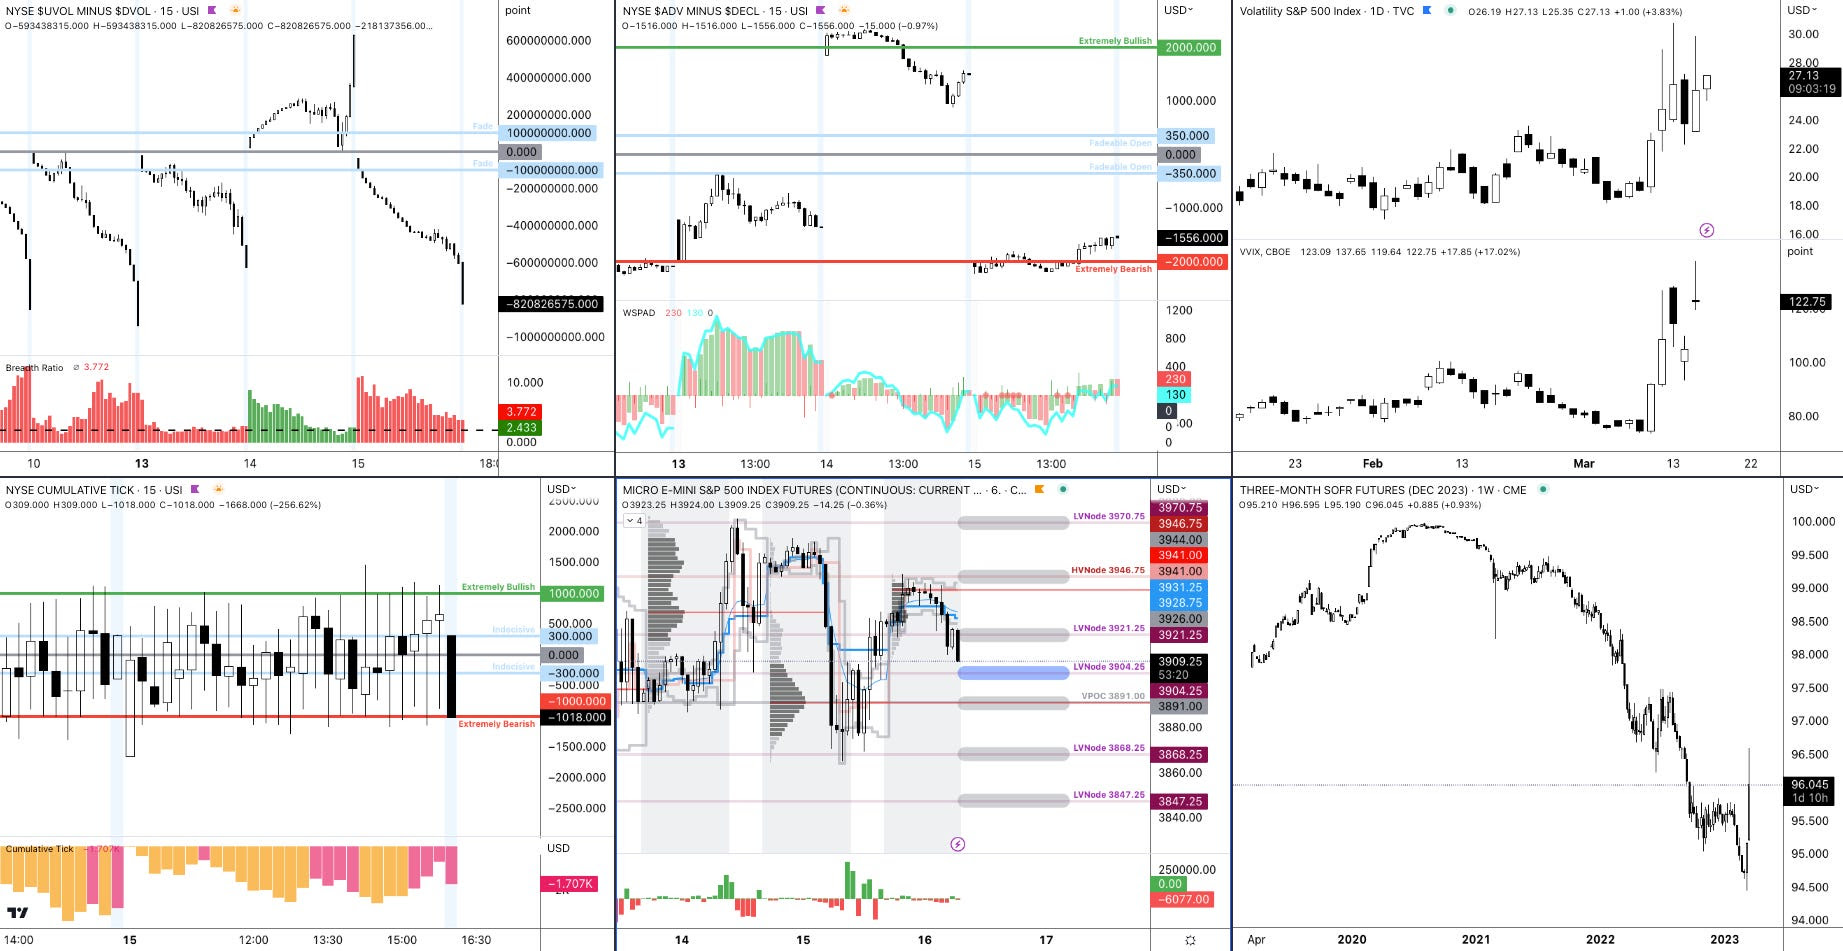
As of 7:15 AM ET, Thursday’s regular session (9:30 AM – 4:00 PM ET), in the S&P 500, is likely to open in the lower part of a balanced overnight inventory, inside of the prior day’s range, suggesting a limited potential for immediate directional opportunity.
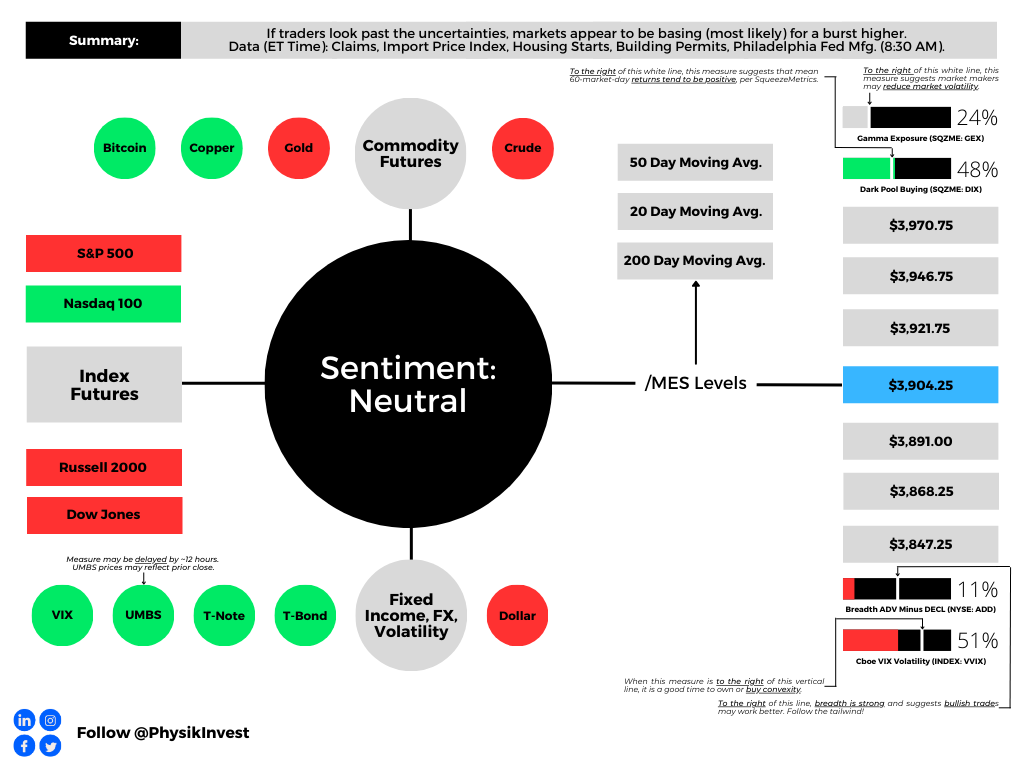
The S&P 500 pivot for today is $3,904.25.
Key levels to the upside include $3,921.25, $3,946.75, and $3,970.75.
Key levels to the downside include $3,891.00, $3,868.25, and $3,847.25.
Disclaimer: Click here to load the updated key levels via the web-based TradingView platform. New links are produced daily. Quoted levels likely hold barring an exogenous development.
Graphic: 65-minute profile chart of the Micro E-mini S&P 500 Futures (bottom middle).
Definitions
Volume Areas: Markets will build on areas of high-volume (HVNodes). Should the market trend for a period of time, this will be identified by a low-volume area (LVNodes). The LVNodes denote directional conviction and ought to offer support on any test.
If participants auction and find acceptance in an area of a prior LVNode, then future discovery ought to be volatile and quick as participants look to the nearest HVNodes for more favorable entry or exit.
POCs: Areas where two-sided trade was most prevalent in a prior day session. Participants will respond to future tests of value as they offer favorable entry and exit.
Volume-Weighted Average Prices (VWAPs): A metric highly regarded by chief investment officers, among other participants, for quality of trade. Additionally, liquidity algorithms are benchmarked and programmed to buy and sell around VWAPs.
About
The author, Renato Leonard Capelj, spends the bulk of his time at Physik Invest, an entity through which he invests and publishes free daily analyses to thousands of subscribers. The analyses offer him and his subscribers a way to stay on the right side of the market.
You may view this letter’s content calendar at this link.
Disclaimer
Do not construe this newsletter as advice. All content is for informational purposes. Capelj and Physik Invest manage their own capital and will not solicit others for it.