Categories
Commentary

Daily Brief For February 1, 2023

Physik Invest’s Daily Brief is read by thousands of subscribers. You, too, can join this community to learn about the fundamental and technical drivers of markets.
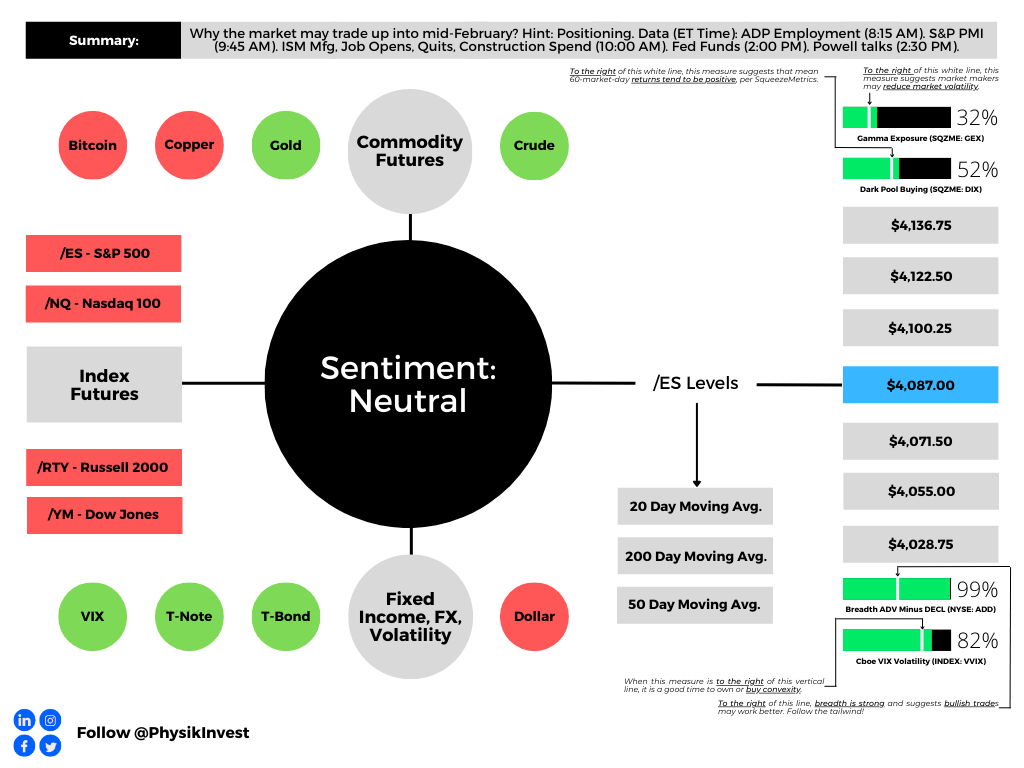
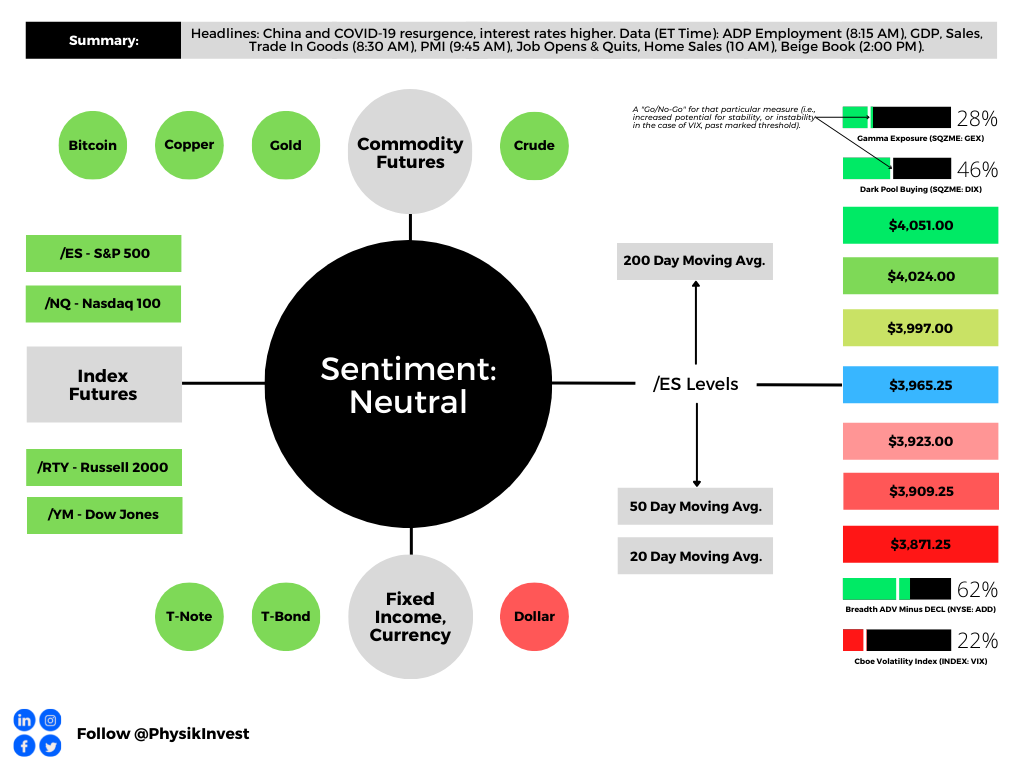
Graphic updated 8:00 AM ET. Sentiment Neutral if expected /ES open is inside of the prior day’s range. /ES levels are derived from the profile graphic at the bottom of this letter. Click here for the latest levels. SqueezeMetrics Dark Pool Index (DIX) and Gamma (GEX) with the latter calculated based on where the prior day’s reading falls with respect to the MAX and MIN of all occurrences available. A higher DIX is bullish. At the same time, the lower the GEX, the more (expected) volatility. Click to learn the implications of volatility, direction, and moneyness. Breadth reflects a reading of the prior day’s NYSE Advance/Decline indicator. The CBOE VIX Volatility Index (INDEX: VVIX) reflects the attractiveness of owning volatility.

Positioning

Markets think the Federal Reserve (Fed) raises its benchmark rate by 25 basis points. Notwithstanding the less aggressive hike, strategists believe the Fed will stay tougher on inflation for far longer and, accordingly, crush traders’ optimism.

“I suspect the Fed messaging tomorrow will push back against the pivot narrative and thereby current bond market pricing,” DoubleLine Capital CIO Jeffrey Gundlach said. Former investment banker and trader, as well as the president of the Minneapolis Fed, Neel Kashkari warned the Fed is set on finishing the job and cutting inflation, even if it costs millions of Americans their jobs. “I’ve spent enough time around Wall Street to know that they are culturally, institutionally, optimistic,” he said.

Further, relief in markets (e.g., stocks, housing) is a boon for asset owners and may enable companies to raise cash, bid up equipment prices, and demand new hires. 
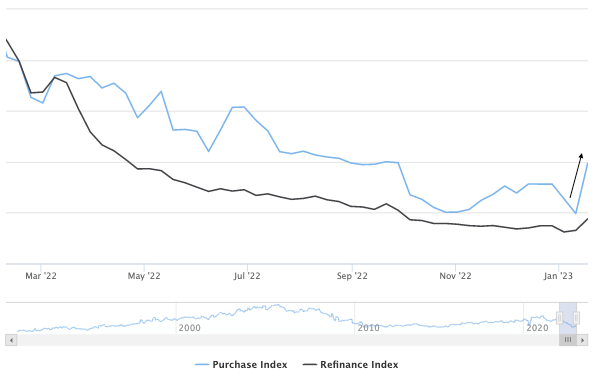
Graphic: Retrieved from Mortgage News Daily. “A trend of [increasing] purchase applications implies home buyer demand is [increasing].” The prevailing narrative is that the Fed wants less inflation and less demand. This narrative’s been disrupted, in part. Recall our Monday letter talking about investors’ desire to put their cash to work and the demand for treasuries (i.e., bond bid and yield pressured) which forced investors into previously depressed assets.

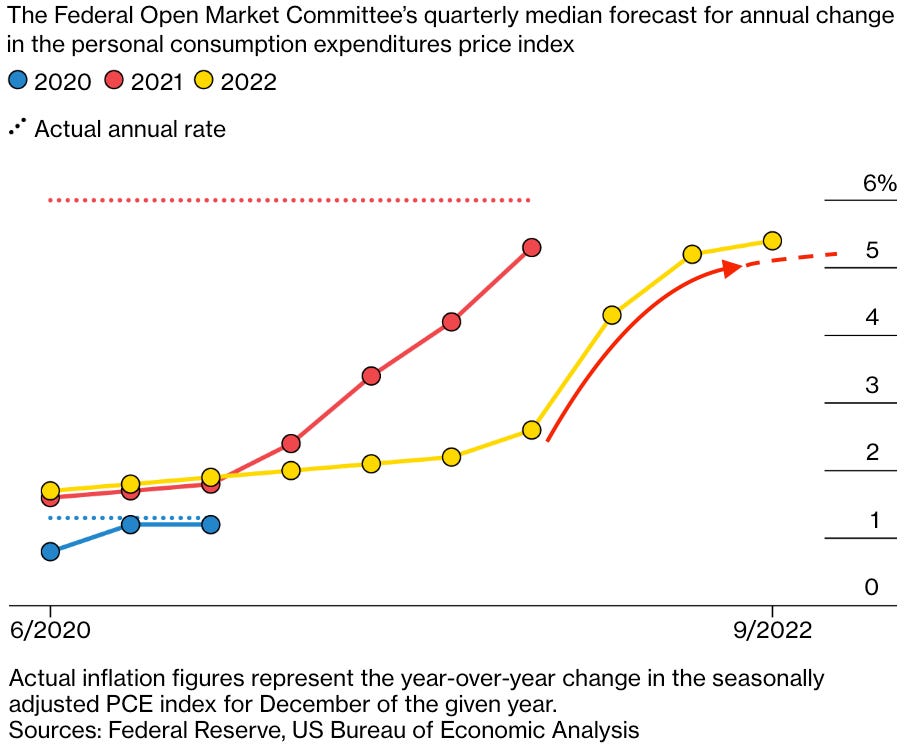
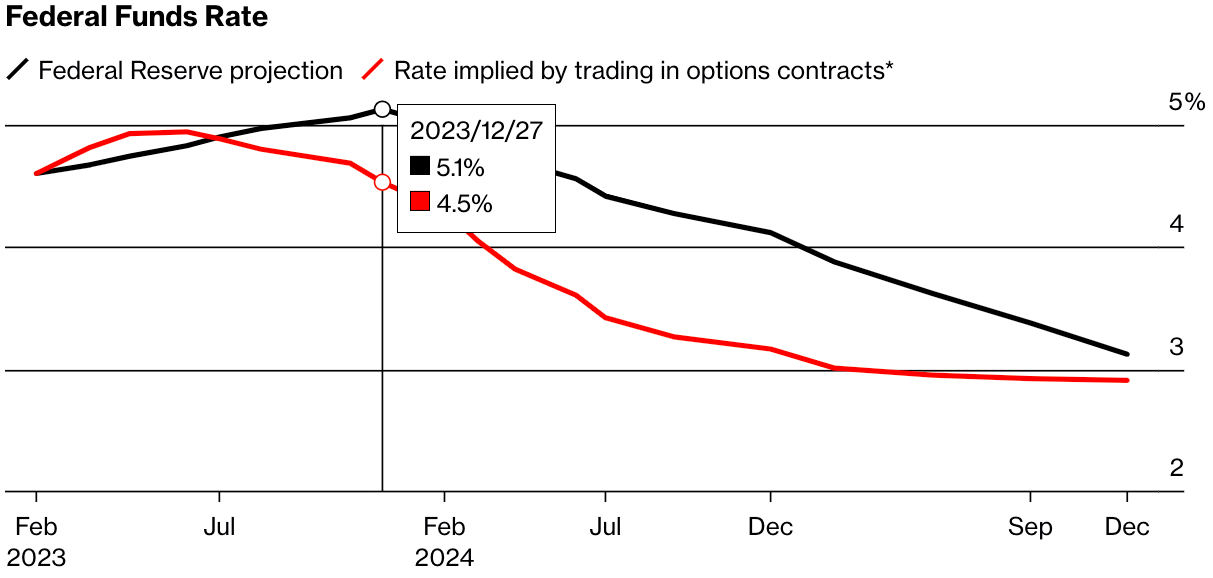
With inflation still a problem, regardless of whether there are better solutions as we put forth in the January 31 letter, the Fed is looking to keep rates above 5% for the rest of 2023, though markets are pricing a pivot far earlier and at a lower rate.
Graphic: Retrieved from Bloomberg.

Despite the expectation of toughness from the Fed, markets have not broken down. Rather, if we zoom out, they are trending sideways to higher and may continue to do so. That’s according to Kai Volatility’s Cem Karsan who says that implied volatility (IVOL) is heightened across options with very little time to expiry (1- to 3-days). 

“Event vol, which is the pricing of one-, two-, and three-day options, is significantly higher than everything else behind it right now,” he said, noting that customers’ or traders’ demands for downside put protection is the culprit. That said, despite the committee’s recent hawkishness, “the market responded relatively well at those levels, and you’re seeing vol come back down.”
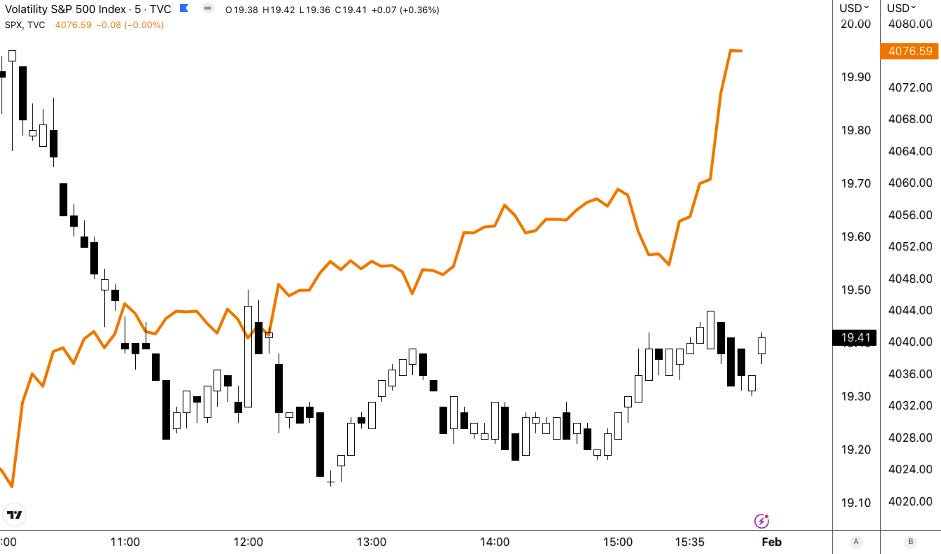
Graphic: Retrieved from TradingView. First included in SpotGamma’s PM Note for 1/31/2023. During Tuesday’s strength, measures of IVOL, such as the Cboe Volatility Index (INDEX: VIX) fell, though the VIX did not move lower in as sharp of a fashion that the S&P 500 (INDEX: SPX) traded higher. In fact, the VIX trended up into the close, after a mid-day bottom, suggesting some left-over hedging demands ahead of some important macroeconomic drivers this week.

“I think that’s kind of likely what you’re going to see, regardless of what the Fed does,” Karsan added. That’s because, barring some unexpected development, traders will not be able to justify the pricing of ultra-short-dated options post-Fed; the supply and expiry of short-dated options will coincide with the dealers or market makers who are short-stock against the puts they supplied buying back their hedges.

“Vol structurally affects how markets move. Puts are the way people hedge in the market and dealers are short the puts. If you have an event vol that comes down, those vanna and charm effects will naturally lead to a buyback,” post-Fed.

For context, vanna is the change in an options delta with respect to changes in IVOL. Charm is the change in an options delta with respect to changes in time. These are second-order derivatives of an option’s value, once to time or IVOL, and once to delta.

As your letter writer explained in a SpotGamma analysis yesterday, we saw an interest to hedge heading into this week’s Fed announcement. This coincided with a slight rebound in measures like the Cboe VIX Volatility (INDEX: VVIX) (which, in general, reads low and suggests convexity is a good place to be), and put a damper on the rally, hence its climax on Friday.
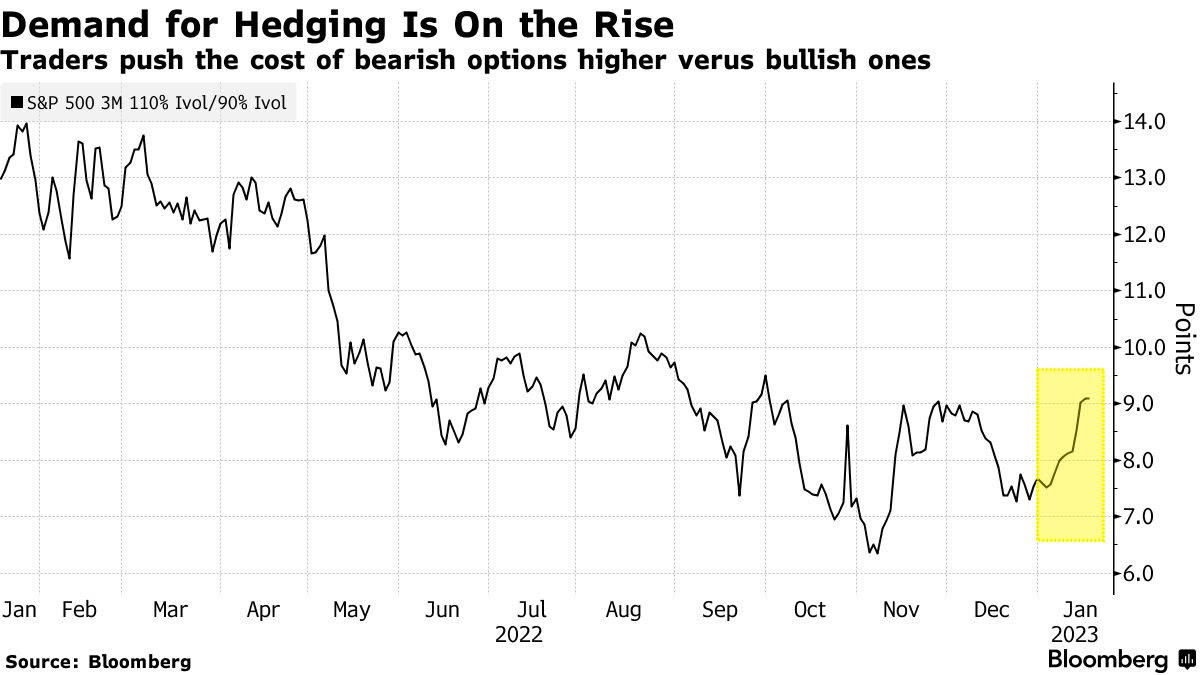
Graphic: Retrieved from Bloomberg.

Moreover, if “macroeconomic events do not disappoint, IVOL compression may provide markets a boost,” SpotGamma explained. “Notwithstanding, the marginal compression of heightened IVOL, because of its lower starting point, probably does less to encourage a longer-lasting rally,” hence the thought that, if there was to be relief post-Fed, it would likely last up until the mid-February monthly options expiration (OpEx). OpEx’s removal of traders’ options protection (as well as dealers’ supportive buyback to those options that were demanded), may leave the market at risk of bearish macro-type flows.

Compounding the risk is traders’ expected reaction in case of weakness. The desire to hedge during a drop would coincide with a re-pricing in IVOL dangerous to anyone who is short volatility, hence this letter’s recent focus on owning the S&P 500 (INDEX: SPX) via call butterflies and call ratio spreads, the sorts of trades that would benefit from an SPX and VIX up environment (the result of traders bidding up call options due to their fear of missing out, in the context of less liquidity to absorb those demands).

To summarize everything, we have the Fed rate decision coming up. After, markets will be volatile but more likely to trend higher into mid-February, bolstered by traders’ fears of missing out in the context of a lower liquidity environment, as well as stimulus (e.g., falling Treasury General Account played into an easing of financial conditions by making it easier for banks to lend and finance trading activities). After mid-February, the window for markets to weaken and accelerate to the downside may open, based on the information we have today.

As an aside, the last time the Nasdaq 100 (INDEX: NDX) was up more than 10% in January was in 2001, The Market Ear informed subscribers yesterday.
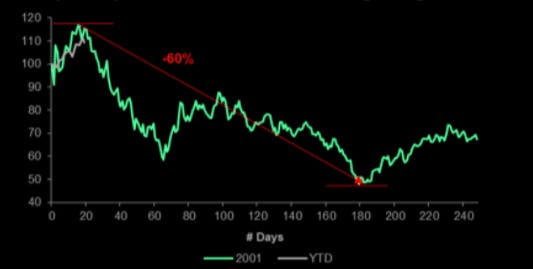
Graphic: Retrieved from BNP Paribas ADR (OTC: BNPQY) via The Market Ear.

Should you wish to hedge, longer-dated SPX IVOL is cheap, relative to recent history.
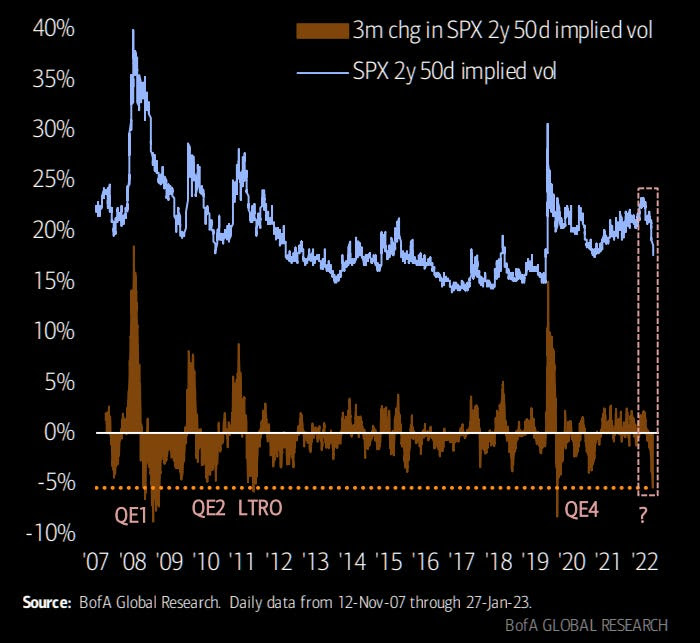
Graphic: Retrieved from Bank of America Corporation (NYSE: BAC) via The Market Ear.

Finally, if you’re interested in following further along the fundamental conversation in Tuesday’s letter, check out Dr. Pippa Malmgren’s post on “ancient empires springing back to life.”

Technical

As of 8:00 AM ET, Wednesday’s regular session (9:30 AM – 4:00 PM ET), in the S&P 500, is likely to open in the middle part of a negatively skewed overnight inventory, inside of the prior range, suggesting a limited potential for immediate directional opportunity.

The S&P 500 pivot for today is $4,087.00. 

Key levels to the upside include $4,100.25, $4,122.50, and $4,136.75.

Key levels to the downside include $4,071.50, $4,055.00, and $4,028.75.

Disclaimer: Click here to load the updated key levels via the web-based TradingView platform. New links are produced daily. Quoted levels hold weight barring an exogenous development.
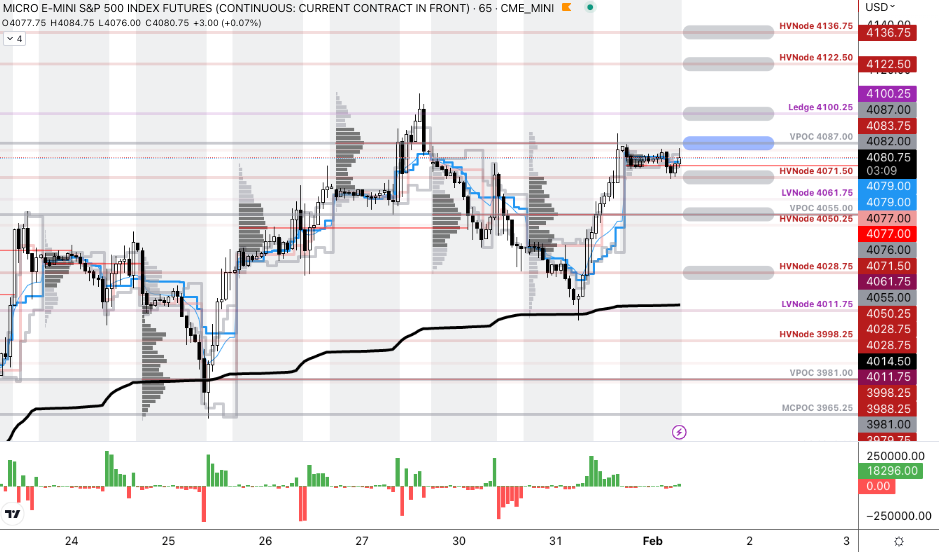
Graphic: 65-minute profile chart of the Micro E-mini S&P 500 Futures.

Definitions

Volume Areas: Markets will build on areas of high-volume (HVNodes). Should the market trend for a period of time, this will be identified by a low-volume area (LVNodes). The LVNodes denote directional conviction and ought to offer support on any test.

If participants auction and find acceptance in an area of a prior LVNode, then future discovery ought to be volatile and quick as participants look to the nearest HVNodes for more favorable entry or exit.

POCs: Areas where two-sided trade was most prevalent in a prior day session. Participants will respond to future tests of value as they offer favorable entry and exit.


About

In short, Renato Leonard Capelj is an economics graduate working in finance and journalism.

Capelj spends most of his time as the founder of Physik Invest through which he invests and publishes daily analyses to subscribers, some of whom represent well-known institutions.

Separately, Capelj is an equity options analyst at SpotGamma and an accredited journalist interviewing global leaders in business, government, and finance.

Past works include conversations with investor Kevin O’Leary, ARK Invest’s Catherine Wood, FTX’s Sam Bankman-Fried, Lithuania’s Minister of Economy and Innovation Aušrinė Armonaitė, former Cisco chairman and CEO John Chambers, and persons at the Clinton Global Initiative.

Contact

Direct queries to renato@physikinvest.com or Renato Capelj#8625 on Discord.

Calendar

You may view this letter’s content calendar at this link.

Disclaimer

Do not construe this newsletter as advice. All content is for informational purposes.

Categories
Commentary

Daily Brief For January 25, 2023

Physik Invest’s Daily Brief is read by thousands of subscribers. You, too, can join this community to learn about the fundamental and technical drivers of markets.

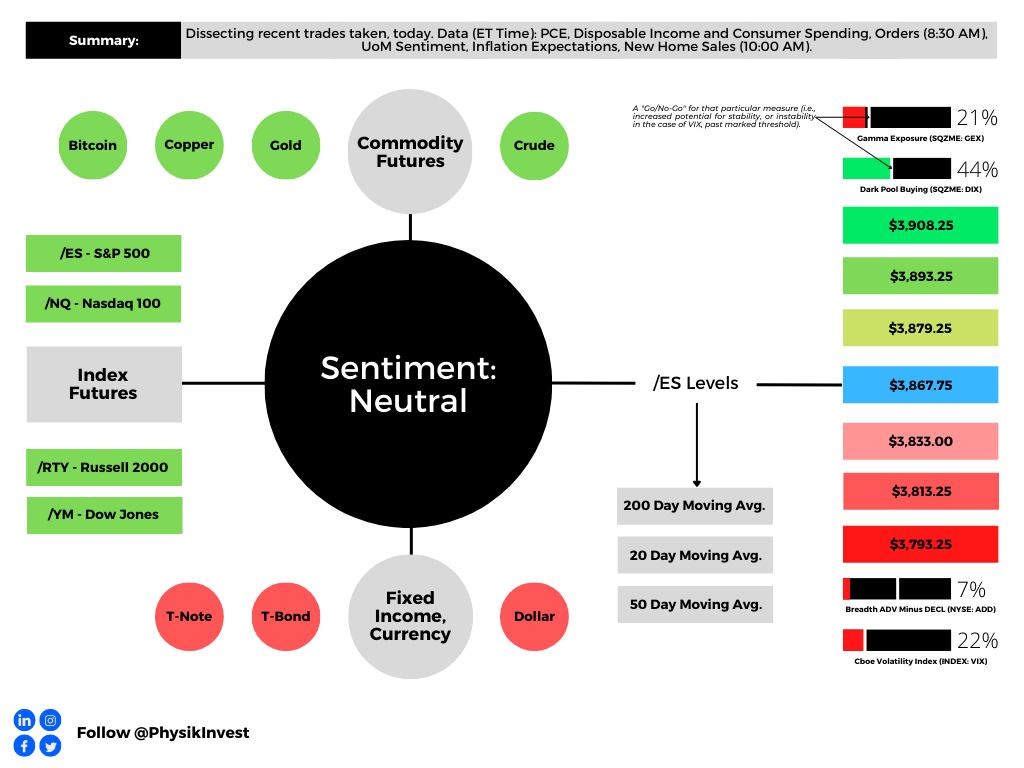
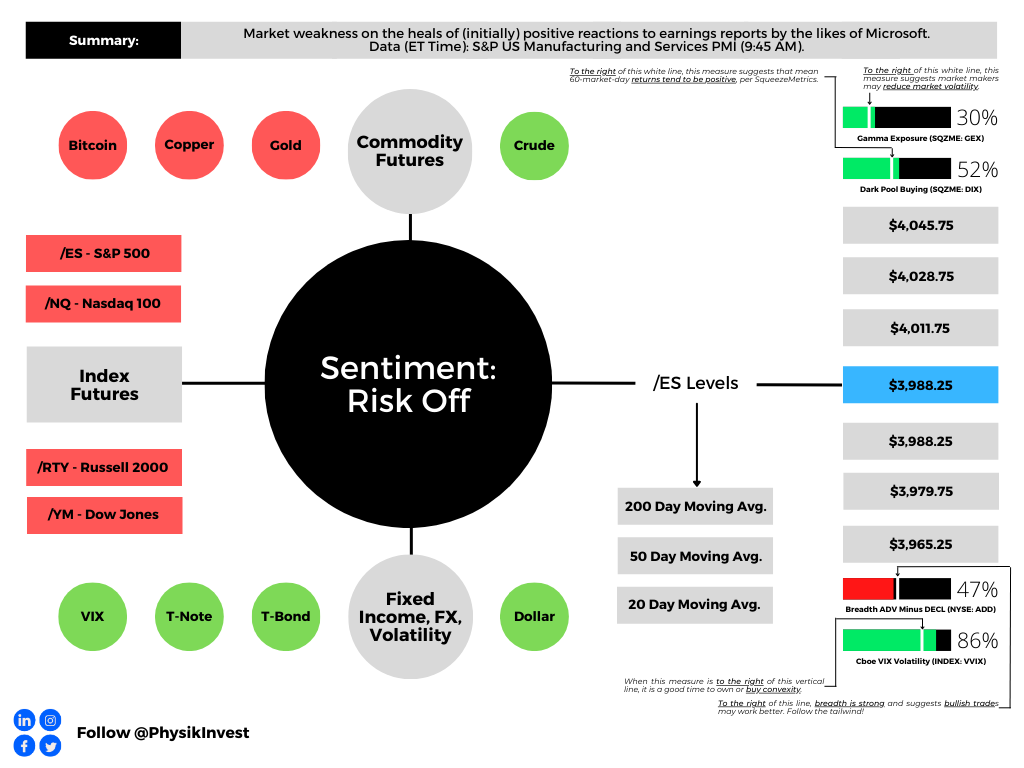
Graphic updated 8:00 AM ET. Sentiment Risk-Off if expected /ES open is below the prior day’s range. /ES levels are derived from the profile graphic at the bottom of this letter. Click here for the latest levels. SqueezeMetrics Dark Pool Index (DIX) and Gamma (GEX) with the latter calculated based on where the prior day’s reading falls with respect to the MAX and MIN of all occurrences available. A higher DIX is bullish. At the same time, the lower the GEX, the more (expected) volatility. Click to learn the implications of volatility, direction, and moneyness. Breadth reflects a reading of the prior day’s NYSE Advance/Decline indicator. The CBOE VIX Volatility Index (INDEX: VVIX) reflects the attractiveness of owning volatility.

Positioning

After a rocky end to 2022, the result of rebalances and repositioning, stocks rallied in the face of incredibly bearish sentiment and off-sides positioning. The detailed Daily Brief for January 24 discussed this context.

Presently, the S&P 500 (INDEX: SPX) is riding above an important inflection (i.e., the 200-day simple moving average) which is a trigger for many traders to flip to owning stocks. At the same time, implied volatility (IVOL), as measured by measures such as the Cboe Volatility Index (INDEX: VIX), is trending higher, and that’s, in part, a result of options hedging in a lower liquidity environment.

Anyways, little is expected to change until the middle of February, this letter quoted Kai Volatility’s Cem Karsan stating, yesterday. Following mid-February, a window for weakness opens. This could be a problem for some traders who are short volatility.

The reason being is as follows. Traders’ disinterest in hedging downside leaves them offside should the market drop quickly. Consequently, the demand for hedges (puts) will coincide with a re-pricing in IVOL dangerous to anyone who is short volatility.

Given the unstable SPX and VIX up environment, attractive trades provide exposure to the upside while limiting the downside. Structures such as call butterflies or ratio spreads, as included in yesterday’s letter, may work well.

In yesterday’s example, owning the 20-point FEB 1×2 Tesla Call Ratio Spread resulted in about 400% profit in the span of 14 days or so (i.e., $0.20 db → $1.00 cr). The loss was limited* to about $20.00 at entry while the exit was marked in excess of $100.00.

*Note that losses can exceed the entry debit should the underlying stock trade very far beyond the ratio spread’s short strikes.

Similar trades can be structured in the indexes such as the Nasdaq 100 (INDEX: NDX) where there is a steeper skew that may enable us to collect more credit in the options we are short, helping us lower the cost of the entire spread we own.

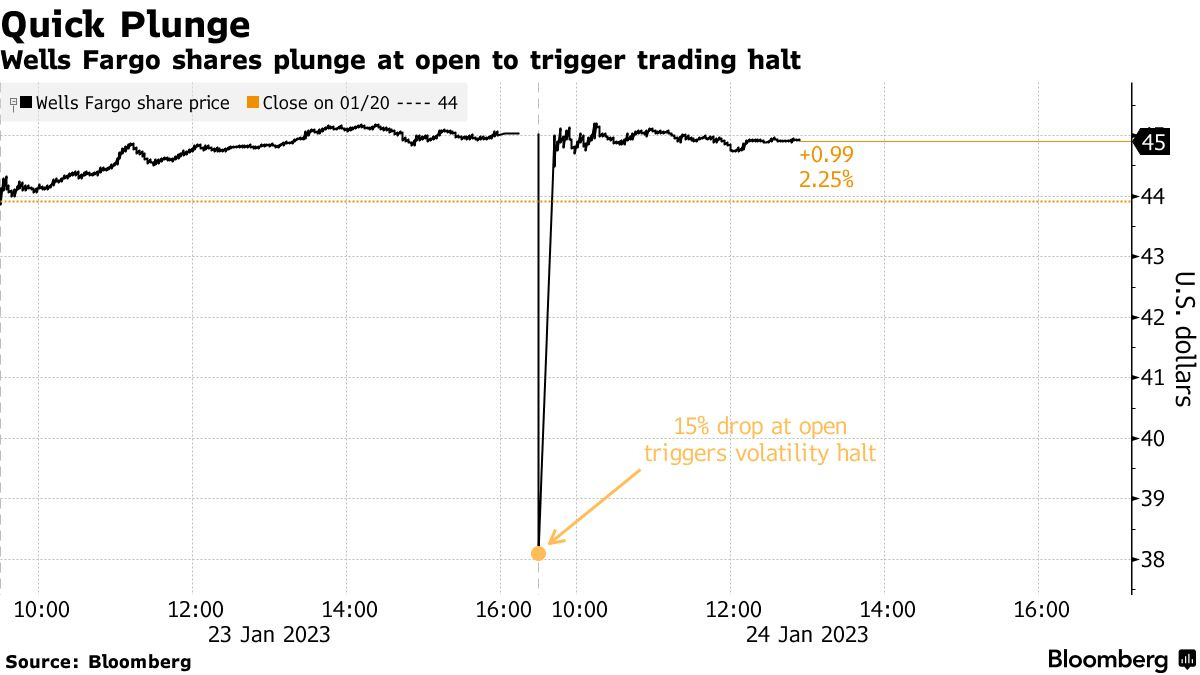
If you’re leaning toward the indexes, then you may avoid some of the volatility we saw yesterday when large swaths of stocks on the Intercontinental Exchange Inc-owned (NYSE: ICE) New York Stock Exchange commenced trading with an open book some reports have suggested.

As SpotGamma explained yesterday, “movement-reducing hedging activities” in the indexes “can mask realized volatility (RV) under the hood in single stocks.” Therefore, your index positions may be better isolated from what’s going on under the hood.

Graphic: Retrieved from Bloomberg.

Technical

As of 8:00 AM ET, Wednesday’s regular session (9:30 AM – 4:00 PM ET), in the S&P 500, is likely to open in the lower part of a negatively skewed overnight inventory, outside of prior-range and -value, suggesting a potential for immediate directional opportunity.

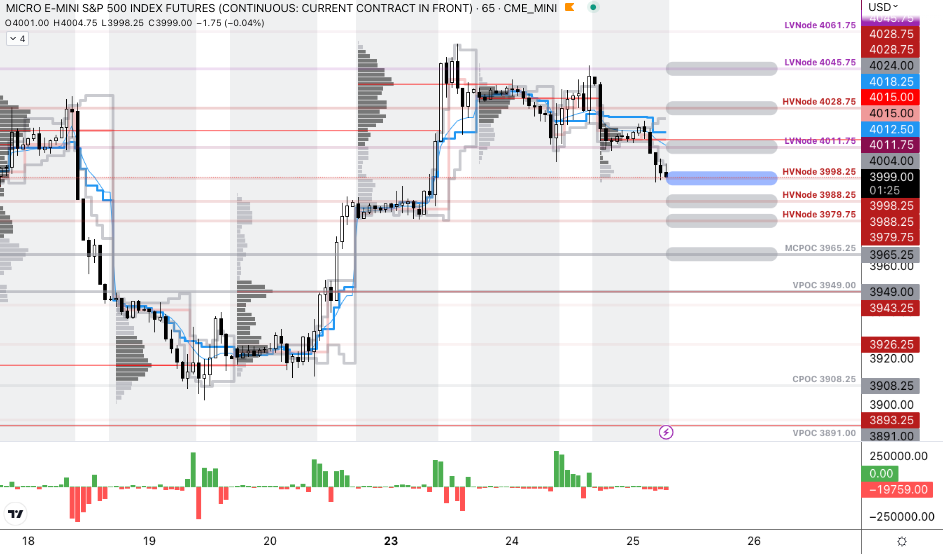
Our S&P 500 pivot for today is $3,998.25. 

Key levels to the upside include $4,011.75, $4,028.75, and $4,045.75.

Key levels to the downside include $3,988.25, $3,979.75, and $3,965.25.

Click here to load updated key levels into the web-based TradingView platform. All levels are derived using the 65-minute timeframe. New links are produced, daily. 

Graphic: 65-minute profile chart of the Micro E-mini S&P 500 Futures.

Definitions

Volume Areas: Markets will build on areas of high-volume (HVNodes). Should the market trend for long periods of time, it will be identified by low-volume areas (LVNodes). LVNodes denote directional conviction and ought to offer support on any test.

If participants auction and find acceptance in an area of a prior LVNode, then future discovery ought to be volatile and quick as participants look to HVNodes for favorable entry or exit.

MCPOCs: Denote areas where two-sided trade was most prevalent over numerous sessions. Participants will respond to future tests of value as they offer favorable entry and exit.


About

In short, Renato Leonard Capelj is an economics graduate working in finance and journalism.

Capelj spends most of his time as the founder of Physik Invest through which he invests and publishes daily analyses to subscribers, some of whom represent well-known institutions.

Separately, Capelj is an equity options analyst at SpotGamma and an accredited journalist interviewing global leaders in business, government, and finance.

Past works include conversations with investor Kevin O’Leary, ARK Invest’s Catherine Wood, FTX’s Sam Bankman-Fried, Lithuania’s Minister of Economy and Innovation Aušrinė Armonaitė, former Cisco chairman and CEO John Chambers, and persons at the Clinton Global Initiative.

Contact

Direct queries to renato@physikinvest.com or Renato Capelj#8625 on Discord.

Calendar

You may view this letter’s content calendar at this link.

Disclaimer

Do not construe this newsletter as advice. All content is for informational purposes.

Categories
Commentary

Daily Brief For December 23, 2022

Physik Invest’s Daily Brief is read by thousands of subscribers. You, too, can join this community to learn about the fundamental and technical drivers of markets.

Graphic updated 8:30 AM ET. Sentiment Neutral if expected /ES open is inside of the prior day’s range. /ES levels are derived from the profile graphic at the bottom of this letter. Levels may have changed since initially quoted; click here for the latest levels. SqueezeMetrics Dark Pool Index (DIX) and Gamma (GEX) with the latter calculated based on where the prior day’s reading falls with respect to the MAX and MIN of all occurrences available. A higher DIX is bullish. At the same time, the lower the GEX, the more (expected) volatility. Click to learn the implications of volatility, direction, and moneyness. Breadth reflects a reading of the prior day’s NYSE Advance/Decline indicator. VIX reflects a current reading of the CBOE Volatility Index (INDEX: VIX) from 0-100.

Positioning

Friends, please read the entire post.

In the Daily Brief for December 21, 2022, this letter dissected some of the positioning contexts responsible for fixed-strike and top-line implied volatility (IVOL) measures’ downward trajectory with the S&P 500. Since this detailed letter was published, IVOL has increased, albeit not by a massive amount so to speak. The moves lower, coupled with the volatility skew not blowing out, have enabled your letter writer to monetize structures entered into while on travel for a nice return. Let’s talk about it, further.

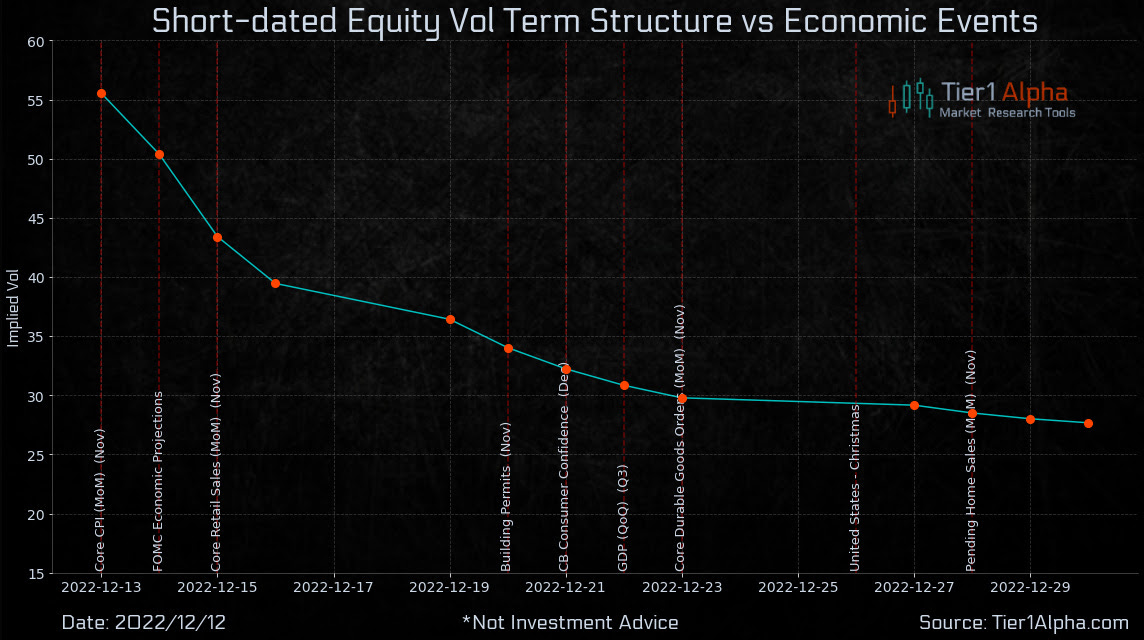
Heading into consumer price (i.e., inflation) updates, as well as updates from the Federal Reserve on their commitment to stemming inflation, traders sought to protect against (or bet on) movement thereby bidding measures of IVOL.

To quote The Ambrus Group’s Kris Sidial, the “entire term structure was jacked going into CPI and FOMC.” Additionally, “granted nothing out of left field,” Sidial added, it would be tough “for December and January vol[atility] to remain bid.”

Graphic: IVOL term structure retrieved from Tier1Alpha.com.

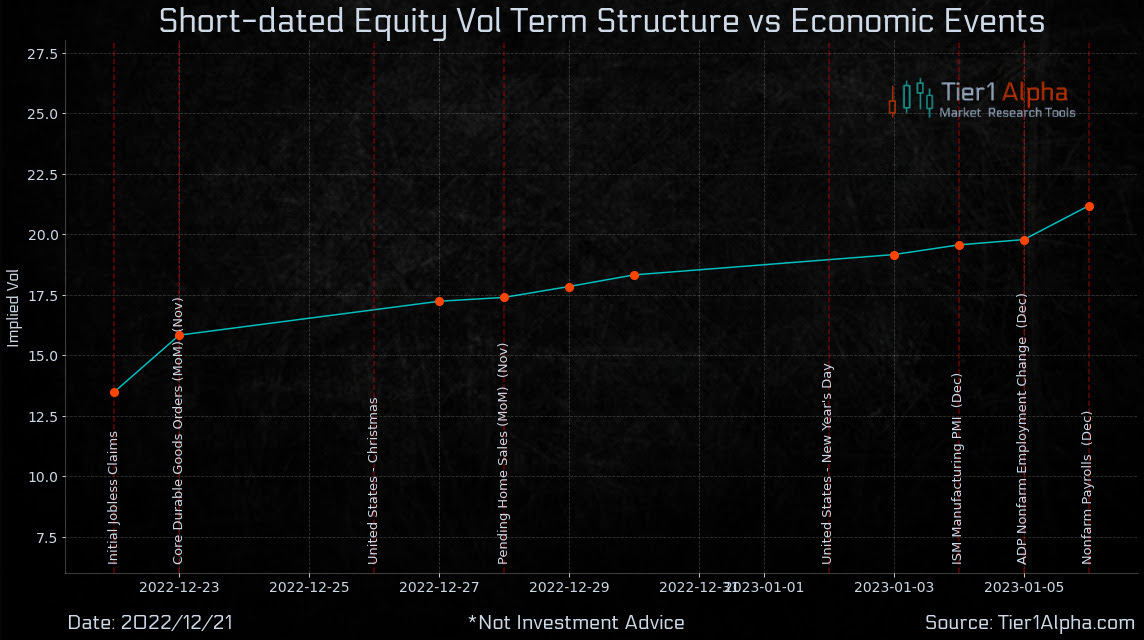
Accordingly, after the CPI and FOMC, market concerns ebbed and traders’ supply of the options they demanded, particularly at the front-end of the curve, pushed the term structure back to an upward-sloping so-called contango.

Graphic: IVOL term structure retrieved from Tier1Alpha.com.

As was detailed in the December 21 letter, this dynamic following the release of CPI and FOMC would do a lot to keep IVOL and equity movement contained. Knowing this, your letter writer’s trading partner alerted him while on a trip of skew presenting some nice, zero-cost trades that would expand should the market trade lower and IVOL remain contained (i.e., volatility skew not blowing out).

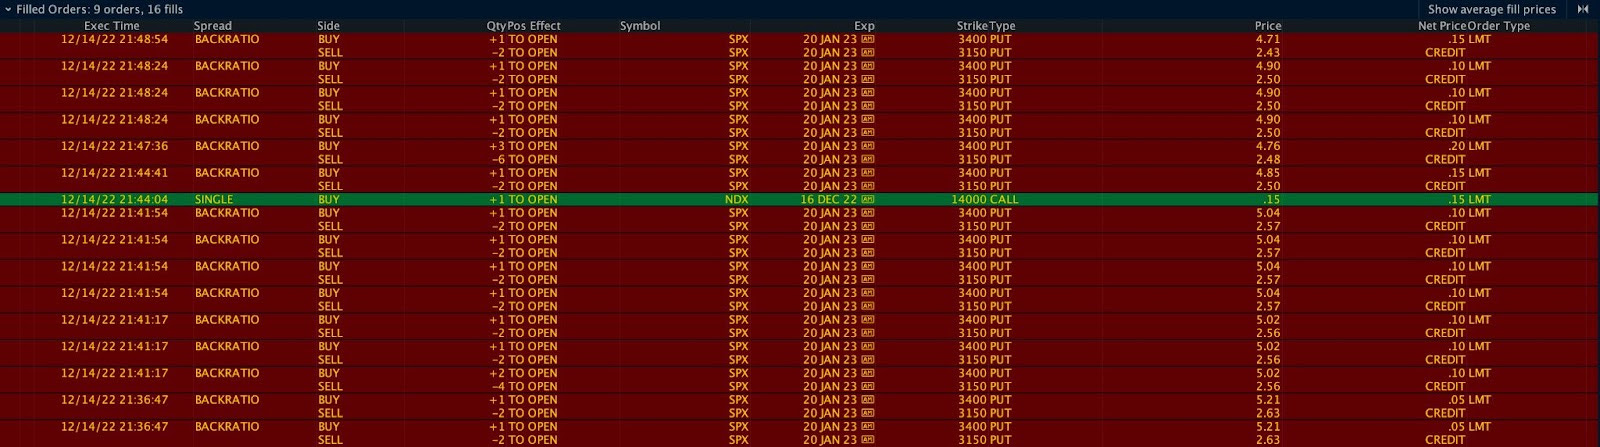
Upon analysis, entered was a simple +1 x -2 Put Ratio Spread (Trade Ticket: SOLD -1 1/2 BACKRATIO SPX 100 20 JAN 23 [AM] 3400/3150 PUT @.10) for a ~$10.00 credit before fees and commissions, a favorite of your letter writer’s.

Graphic: Filled orders on December 14, 2022.

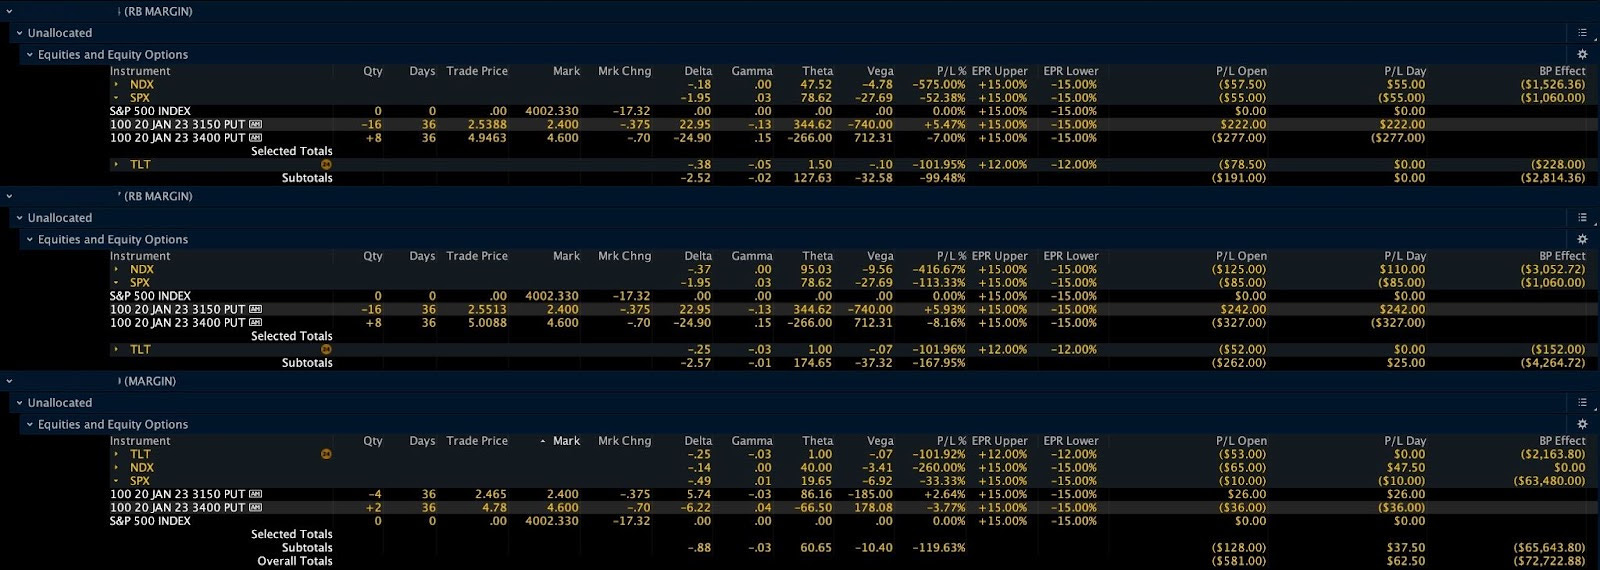
The trades provided exposure to -Delta (direction) and +Gamma (movement).

Graphic: Position statement on December 14, 2022. Using portfolio margin to lower BP Effect.

As an aside, from the start the Vega (sensitivity to changes in IVOL) was negative but, this has a lot to do with how far out the spread is on the chain and, should there be movement as you’re about to see, enabling the put leg you own to start kicking in, so to speak, Vega ends up turning positive very quickly, all else equal.

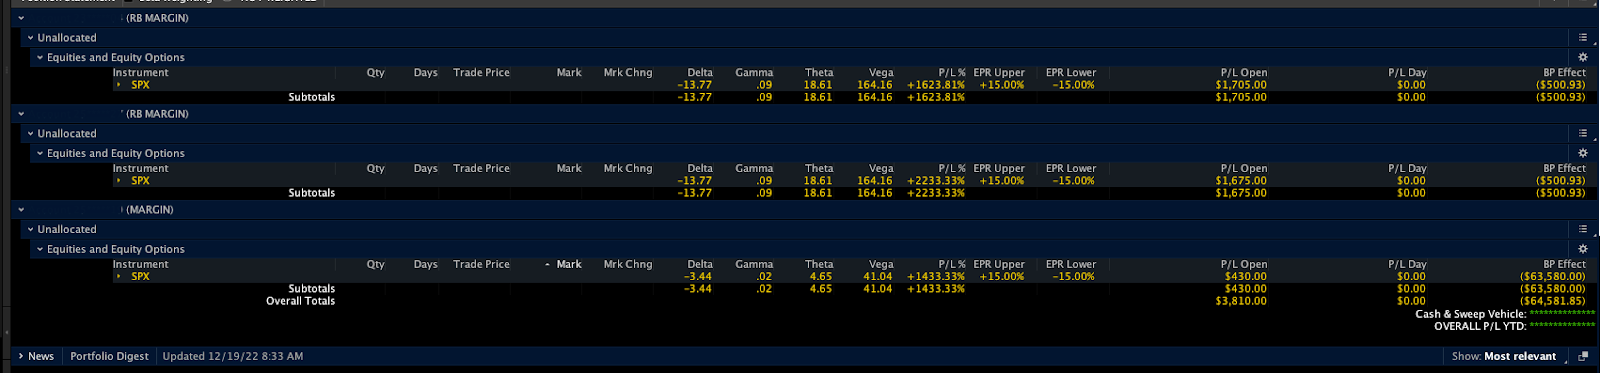
The below graphic, taken on December 19, prior to much of the spread being monetized, shows a large -Delta, +Gamma, and +Vega (i.e., if the market moves lower or IVOL rises, the spread is to rise in value), much like it did when the market traded down into the beginning of this week and IVOL rose into the end of this week.

Graphic: Position statement on December 19, 2022. Using portfolio margin to lower BP Effect.

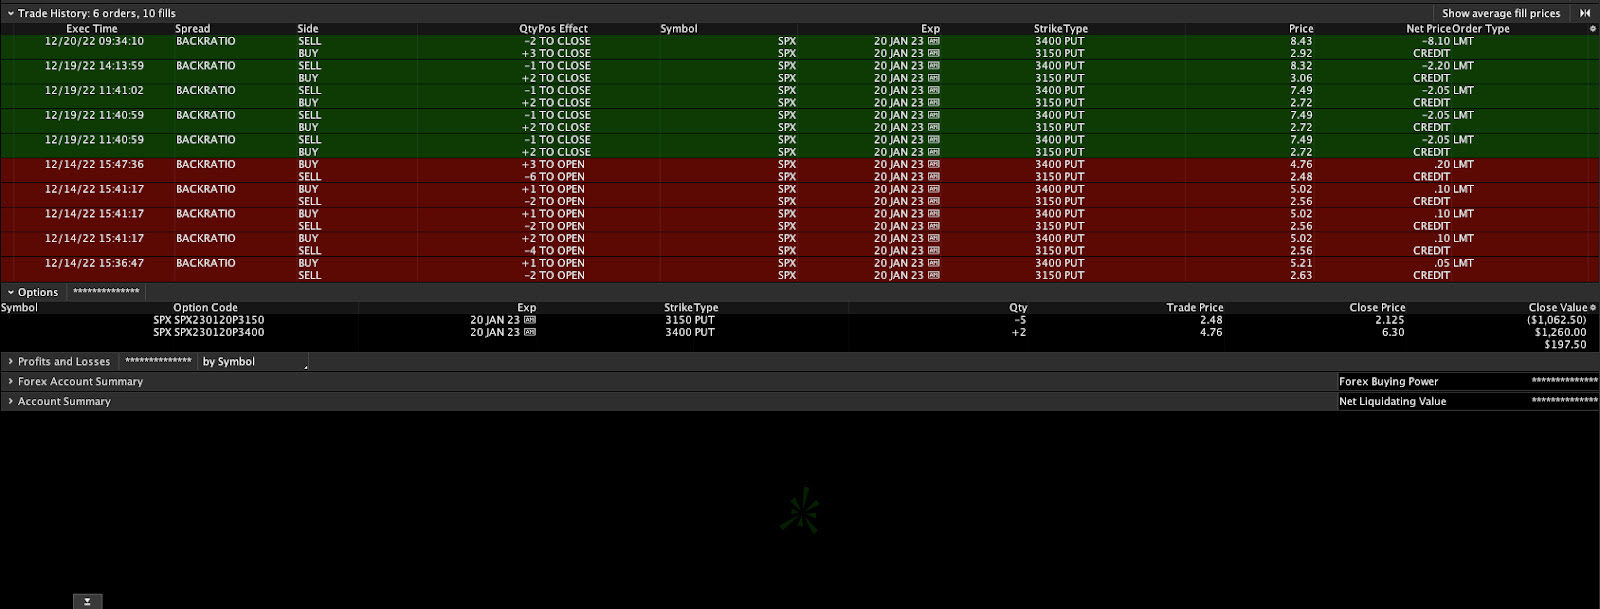
For one account, 50% of the initial trade was closed for $205-220.00 in credit per spread. After this closure, the remaining structure, in this one account, was turned into a +2 x -5 Ratio. Why? In short, the market was strengthening and the odds of a large move lower were, in short, low. To have downside exposure but be paid for the initial effort, the conversion from a +4 x -8 to a +2 x -5 resulted in an additional $8.10 credit, leaving your letter writer with a -Delta, +Gamma, and +Vega, still.

Graphic: Trade history on December 23, 2022.

In the days after, the market turned and traded lower, far more than expected. Notwithstanding, the remaining structures (both +1 x -2 and +2 x -5) performed well, though the 2×5’s Vegas briefly turned negative on the sharp selling yesterday, which, if it had remained like that, would have solicited action (i.e., repositioning, closure, or hedging via correlated instrument).

Graphic: Working orders on December 23, 2022.

At the end of the day, what’s important to your letter writer, here, is how the spread prices if the market moves to it today, all else (e.g., time, IVOL, etc) remains equal. If the spread prices at a better price to close at the money, that’s a quick check that says: “Hey, your bet on the market moving lower actually makes money if the market moves lower, all else equal.”

To explain further, look at the working orders above. At current S&P 500 levels, the +1 x -2 prices for $215.00 credit to close. The Delta is negative, as desired, and both the Gamma and Vega are positive. If the spread was at the money, it prices for nearly a $4,500.00 credit to close as shown below.

Graphic: Pricing an order on December 23, 2022.

So, what now? Well, the exposure is really light and much of the structure was monetized. From here, if the market moves lower that would likely be good for the remaining structures. Any costs to enter have been covered and, at this point, the trade is a free bet on the downside.

Obviously, there are pieces not included in this trade dissection, today, including how to properly manage your greek risk, as well as size the position at entry. These are the secret sauces, so to speak, that will either make or break you in the long run.

Should you want more write-ups like this, comment below. Your letter writer attempts to make these updates as informative and engaging as possible. It’s tough, at times, given the dullness of the material. Separately, trading is not as hard as it’s all made out to be. Sure, you need to have a good read on markets (e.g., skew), but, as your letter writer has learned over the many years he’s been engaging with markets, the theory is nothing like practice. No formula will help you price and enter the correct trade structure in a fast-moving meme stock with IVOL blowing out. 

If all could be automated, there would be no market. Markets are the product of human emotion. Avoid acting on theory, blindly. Price different structures, like the ones this letter has detailed, and observe how the different parts of the trade interact with each other as the market moves, IVOL moves, time passes, interest rates change, and so on.

For instance, you could have owned puts early in the week and still lost money as the market moved lower. If you would have leveraged a short leg against your long leg, then you could have offset the decay, as your letter writer did above.

There’s no substitute for time in the seat (e.g., you could have observed the -Vega at the entry on the trade structure above and not entered, missing out on the trade’s expansion. Time in the seat taught your letter writer better).

Don’t construe this letter’s simplicity as naivety, also. In the end, what’s your exposure to movement? If your bet is on movement, will you make money if the market moves? If not, find another trade structure or sit out.

Anyways, happy holidays to you and your closest. It’s been quite the year and I have a lot to be thankful for and reflect on. See you next week, most likely (though your letter writer’s burn-out may result in new publications being delayed until the new year).

Technical

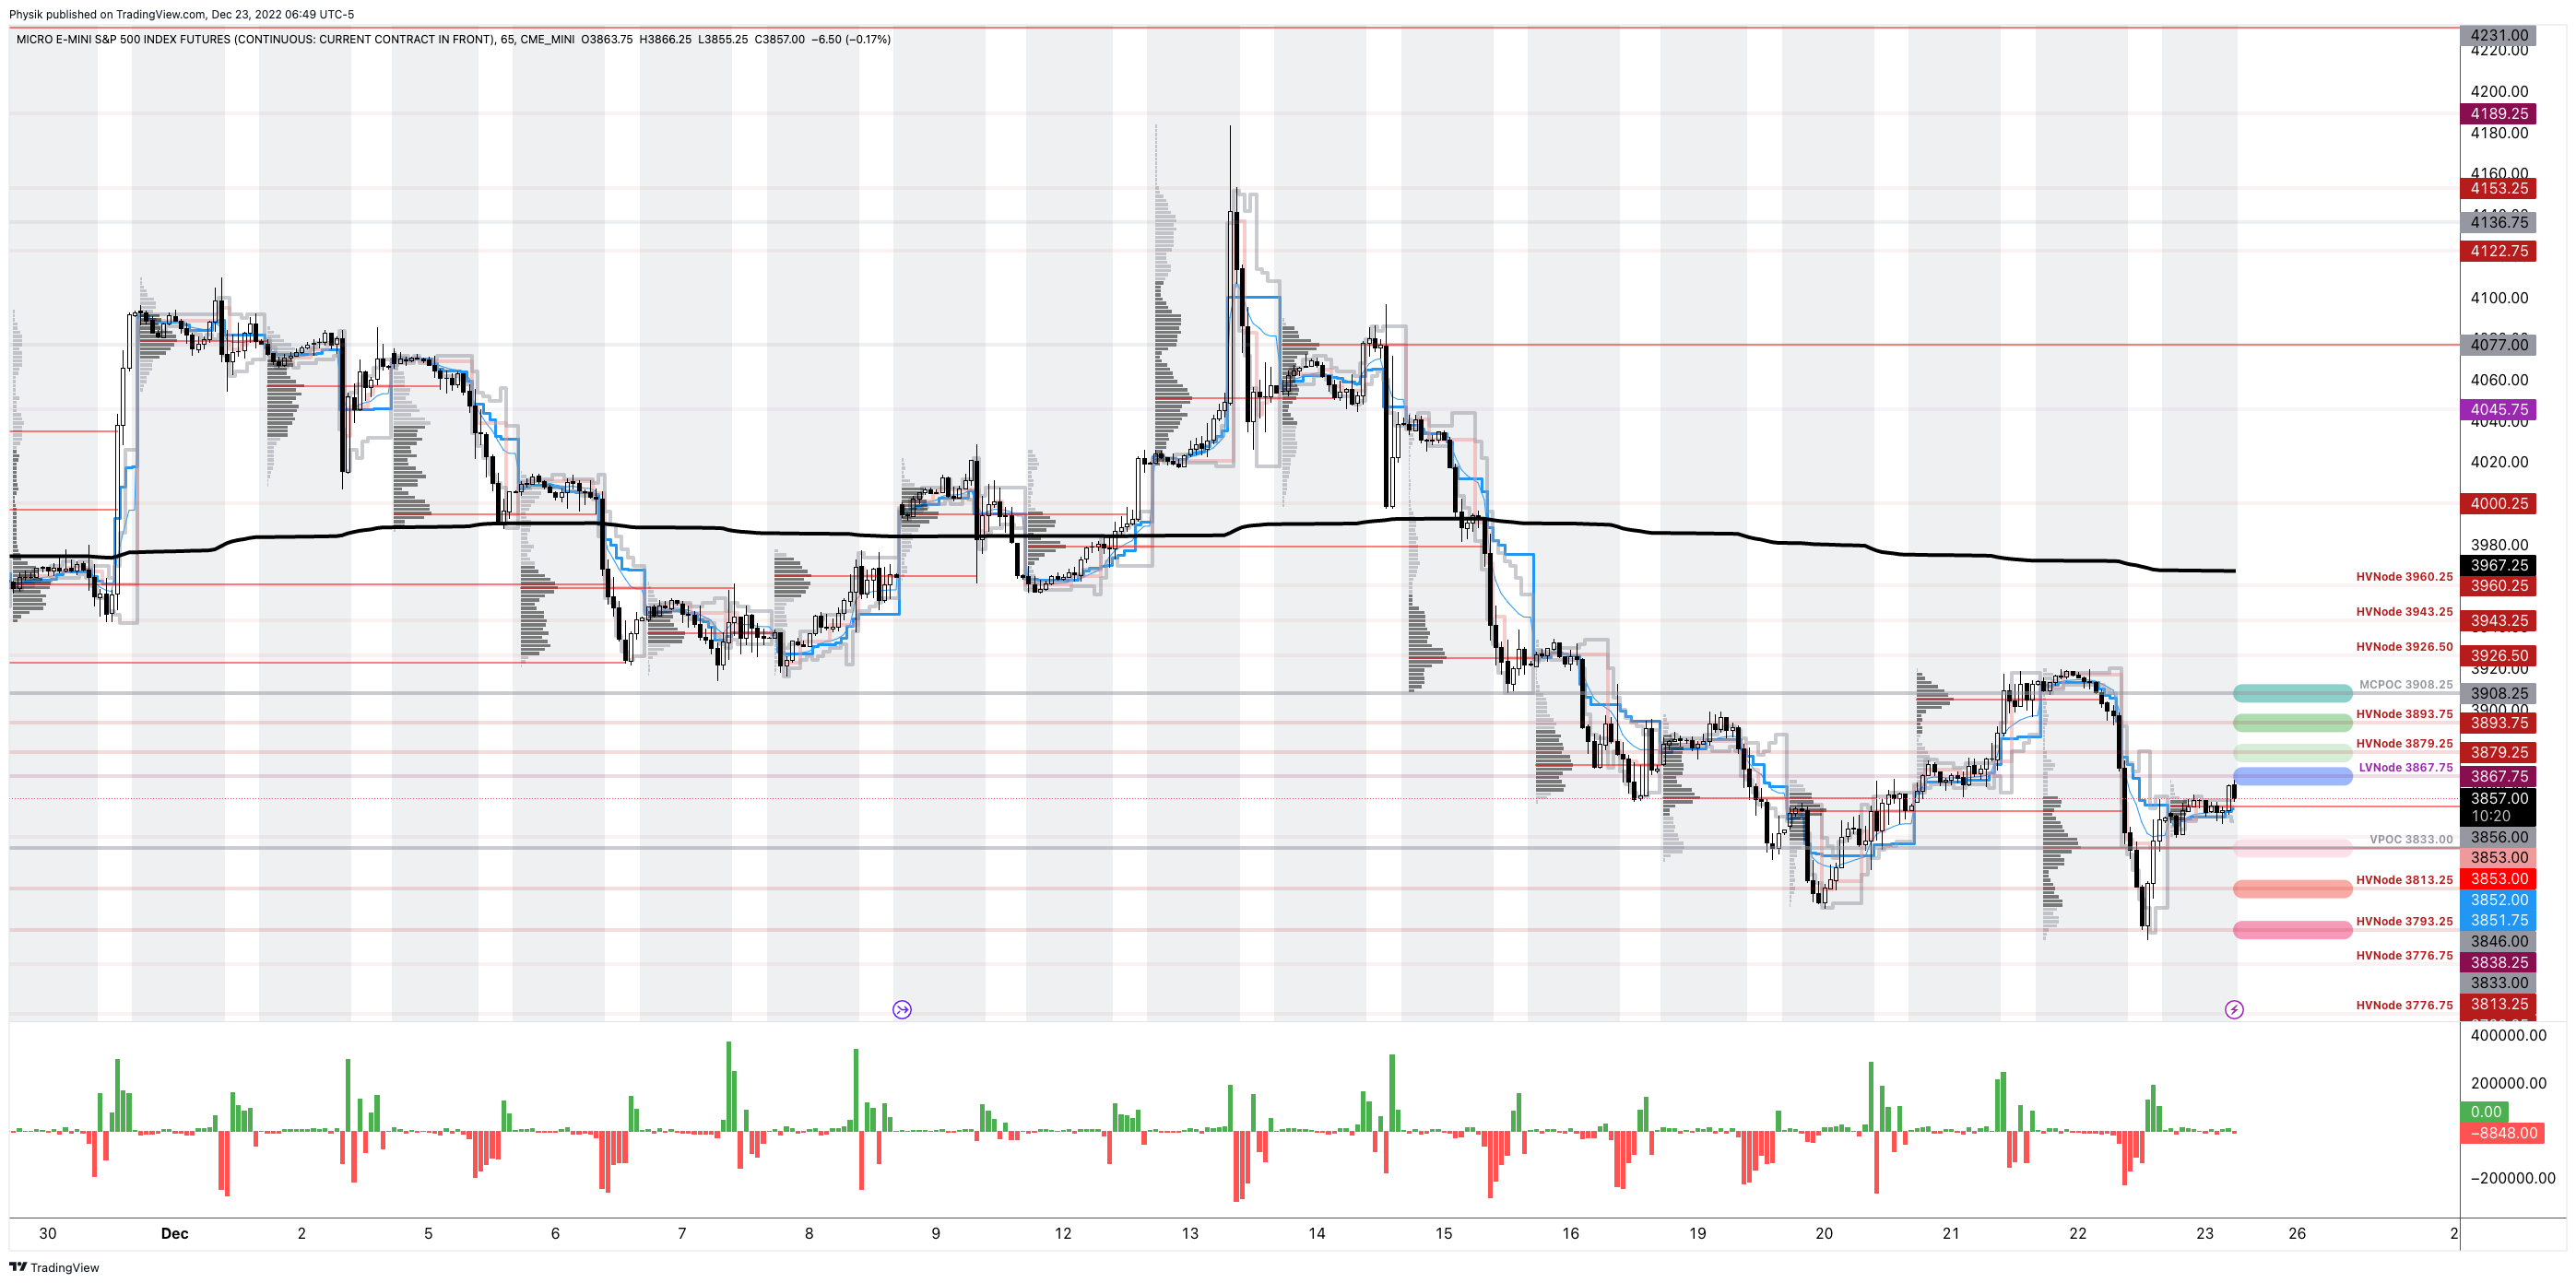
As of 8:20 AM ET, Friday’s regular session (9:30 AM – 4:00 PM ET), in the S&P 500, is likely to open in the upper part of a positively skewed overnight inventory, inside of prior-range and -value, suggesting a limited potential for immediate directional opportunity.

Our S&P 500 pivot for today is $3,867.75. 

Key levels to the upside include $3,879.25, $3,893.75, and $3,908.25. 

Key levels to the downside include $3,833.00, $3,813.25, and $3,793.25.

Click here to load today’s key levels into the web-based TradingView platform. All levels are derived using the 65-minute timeframe. New links are produced, daily.

Graphic: 65-minute profile chart of the Micro E-mini S&P 500 Futures.

Definitions

Volume Areas: Markets will build on areas of high-volume (HVNodes). Should the market trend for long periods of time, it will be identified by low-volume areas (LVNodes). LVNodes denote directional conviction and ought to offer support on any test.

If participants auction and find acceptance in an area of a prior LVNode, then future discovery ought to be volatile and quick as participants look to HVNodes for favorable entry or exit.

POCs: Denote areas where two-sided trade was most prevalent in a prior day session. Participants will respond to future tests of value as they offer favorable entry and exit.

MCPOCs: Denote areas where two-sided trade was most prevalent over numerous sessions. Participants will respond to future tests of value as they offer favorable entry and exit.


About

In short, an economics graduate working in finance and journalism.

Capelj spends most of his time as the founder of Physik Invest through which he invests and publishes daily analyses to subscribers, some of whom represent well-known institutions.

Separately, Capelj is an equity options analyst at SpotGamma and an accredited journalist interviewing global leaders in business, government, and finance.

Past works include conversations with investor Kevin O’Leary, ARK Invest’s Catherine Wood, FTX’s Sam Bankman-Fried, Lithuania’s Minister of Economy and Innovation Aušrinė Armonaitė, former Cisco chairman and CEO John Chambers, and persons at the Clinton Global Initiative.

Contact

Direct queries to renato@physikinvest.com or Renato Capelj#8625 on Discord.

Calendar

You may view this letter’s content calendar at this link.

Disclaimer

Do not construe this newsletter as advice. All content is for informational purposes.

Categories
Commentary

Daily Brief For December 5, 2022

Physik Invest’s Daily Brief is read by thousands of subscribers. You, too, can join this community to learn about the fundamental and technical drivers of markets.

Graphic updated 7:30 AM ET. Sentiment Neutral if expected /ES open is inside of the prior day’s range. /ES levels are derived from the profile graphic at the bottom of this letter. Levels may have changed since initially quoted; click here for the latest levels. SqueezeMetrics Dark Pool Index (DIX) and Gamma (GEX) with the latter calculated based on where the prior day’s reading falls with respect to the MAX and MIN of all occurrences available. A higher DIX is bullish. At the same time, the lower the GEX, the more (expected) volatility. Click to learn the implications of volatility, direction, and moneyness. Breadth reflects a reading of the prior day’s NYSE Advance/Decline indicator. VIX reflects a current reading of the CBOE Volatility Index (INDEX: VIX) from 0-100.

Administrative

Due to the writer’s travel, from 12/6 to 12/16 there will be little or no commentary. If any queries, ping renato@physikinvest.com or Renato Capelj#8625 on Discord.

Positioning

Thanks for the feedback on the December 1, 2022 letter, everyone! Here is a wordy response I sent to one subscriber on an example trade that was detailed.

“No worries on not taking the NDX [Ratio Spread] trade. So long as you know what to look for and how to enter the trade (w.r.t time, width, size), you will find opportunities every week!

My general rules of thumb [for Ratio Spreads] are as follows:

  1. 10-15 days to expiry at a maximum in most cases.
  2. Does the spread price for a credit to close if [you move it to current prices or ATM]?
  3. In the size that you enter the trade, do you have enough capital to maintain the position (i.e., do you exceed the margin requirement if the market moves to that spread)?

Those are a few quick tests you can make before entering. Just price the spread at the money. If it’s a credit to close, the test passed! If the margin is not exceeded, the test is passed! This is my go-to strategy, particularly when I am unsure of what the next market move will be.

If up, that’s great! I may make money. If lower, no problem! I did not lose that much.

On my desk at all times I have:

  • Dynamic Hedging (Taleb)
  • The Rise of Carry (Lee et al)
  • Positional Option Trading (Sinclair)
  • The Second Leg Down (Krishnan)
  • Exotic Options and Hybrids (Bouzoubaa et al)

Separately, here’s an in-depth Ratio Spread case study published a few months back.

Take care and see you soon!

Technical

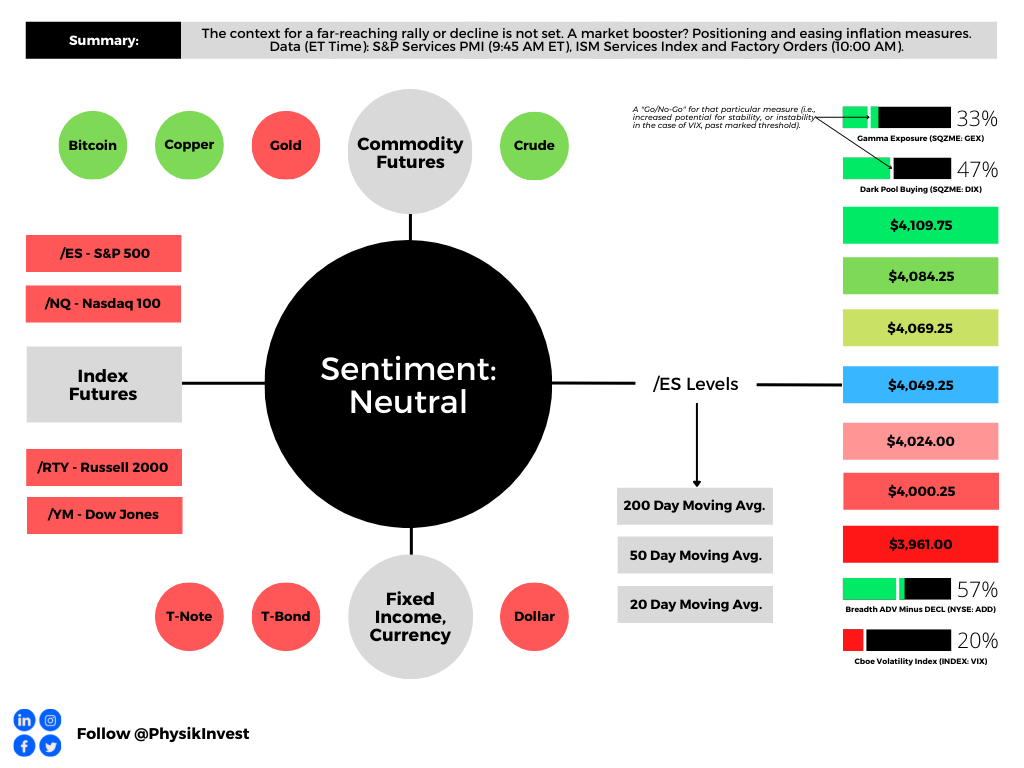
As of 7:30 AM ET, Monday’s regular session (9:30 AM – 4:00 PM ET), in the S&P 500, is likely to open in the lower part of a negatively skewed overnight inventory, inside of prior-range and -value, suggesting a limited potential for immediate directional opportunity.

Our S&P 500 pivot for today is $4,049.25. 

Key levels to the upside include $4,069.25, $4,084.25, and $4,109.75. 

Key levels to the downside include $4,024.00, $4,000.25, and $3,961.00.

Click here to load today’s key levels into the web-based TradingView platform. All levels are derived using the 65-minute timeframe. New links are produced, daily.

Graphic: 65-minute profile chart of the Micro E-mini S&P 500 Futures.

Definitions

Volume Areas: Markets will build on areas of high-volume (HVNodes). Should the market trend for long periods of time, it will be identified by low-volume areas (LVNodes). LVNodes denote directional conviction and ought to offer support on any test.

If participants auction and find acceptance in an area of a prior LVNode, then future discovery ought to be volatile and quick as participants look to HVNodes for favorable entry or exit.

POCs: Denote areas where two-sided trade was most prevalent in a prior day session. Participants will respond to future tests of value as they offer favorable entry and exit.

Volume-Weighted Average Prices (VWAPs): A metric highly regarded by chief investment officers, among other participants, for quality of trade. Additionally, liquidity algorithms are benchmarked and programmed to buy and sell around VWAPs.


About

In short, an economics graduate working in finance and journalism.

Capelj spends most of his time as the founder of Physik Invest through which he invests and publishes daily analyses to subscribers, some of whom represent well-known institutions.

Separately, Capelj is an equity options analyst at SpotGamma and an accredited journalist interviewing global leaders in business, government, and finance.

Past works include conversations with investor Kevin O’Leary, ARK Invest’s Catherine Wood, FTX’s Sam Bankman-Fried, Lithuania’s Minister of Economy and Innovation Aušrinė Armonaitė, former Cisco chairman and CEO John Chambers, and persons at the Clinton Global Initiative.

Contact

Direct queries to renato@physikinvest.com or Renato Capelj#8625 on Discord.

Disclaimer

Do not construe this newsletter as advice. All content is for informational purposes.

Categories
Commentary

Daily Brief For December 1, 2022

Physik Invest’s Daily Brief is read by thousands of subscribers. You, too, can join this community to learn about the fundamental and technical drivers of markets.

Graphic updated 7:00 AM ET. Sentiment Neutral if expected /ES open is inside of the prior day’s range. /ES levels are derived from the profile graphic at the bottom of this letter. Levels may have changed since initially quoted; click here for the latest levels. SqueezeMetrics Dark Pool Index (DIX) and Gamma (GEX) with the latter calculated based on where the prior day’s reading falls with respect to the MAX and MIN of all occurrences available. A higher DIX is bullish. At the same time, the lower the GEX, the more (expected) volatility. Click to learn the implications of volatility, direction, and moneyness. Breadth reflects a reading of the prior day’s NYSE Advance/Decline indicator. VIX reflects a current reading of the CBOE Volatility Index (INDEX: VIX) from 0-100.

Administrative

We will issue a content calendar, soon, revealing the dates letters are likely to be published and the content that may be covered. That said, due to the writer’s travel commitments, from 12/6 to 12/9 and 12/12 to 12/16 there will be no commentaries. If any queries, or if you are local to New York City or Paris, ping renato@physikinvest.com or Renato Capelj#8625 on Discord.

Reflections

Fundamentally, our Wednesday letter pointed to some macro-type forces creating an uncertain context for traders.

Key crosswinds are numbered (1-4).

Alongside (1) easing financial conditions, the markets roared higher with boosts coming from (2) a “vol crunch” and “systemic exposure reallocation,” Nomura Holdings Inc’s (NYSE: NMR) Charlie McElligott November 28, 2022, said.

Our November 30, 2022 letter noted Morgan Stanley (NYSE: MS) strategists were seeing a (3) “contraction … [or] squeezing of liquidity that, alone, implies an 8% drop for the S&P 500.”

Strategists JPMorgan Chase & Co (NYSE: JPM) agreed

On “a significant decline in corporate earnings, at a time of higher interest rates (implying lower P/Es and lower prices relative to the 2022 lows), … [a] market decline could happen between now and the end of the first quarter of 2023.”

With (4) “the financial system … evolved around an environment of near-zero interest rates, … [built up] market interdependencies … can cause selloffs” that feed on themselves (i.e., large market drops statistically add to the likelihood of further large drops).

In light of the above (1-4) crosswinds, we took a step back and asked: 

How do we get bullish – particularly if policymakers ease the pace of rate increases – and not lose much money if the market falls, or position ourselves for the drop many expect?

Graphic: Retrieved from Bloomberg.

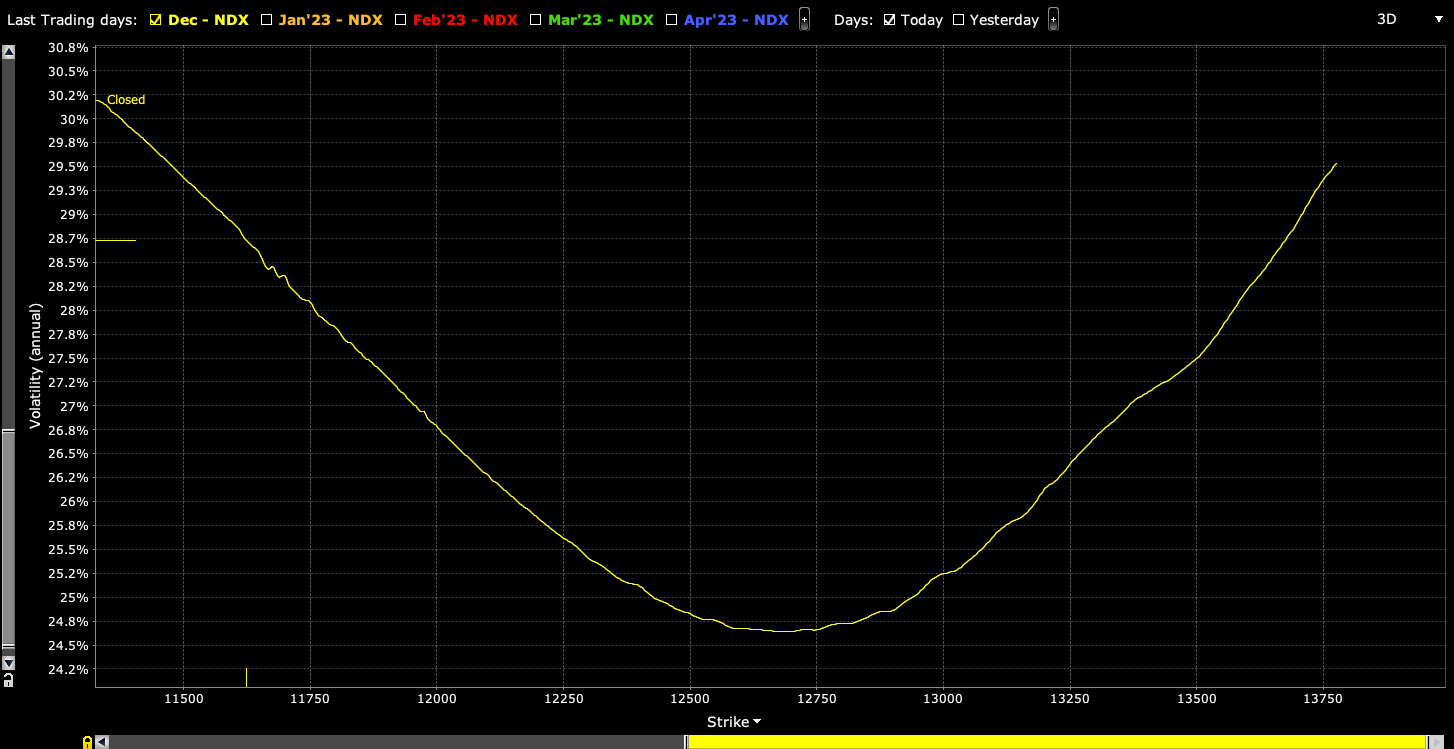
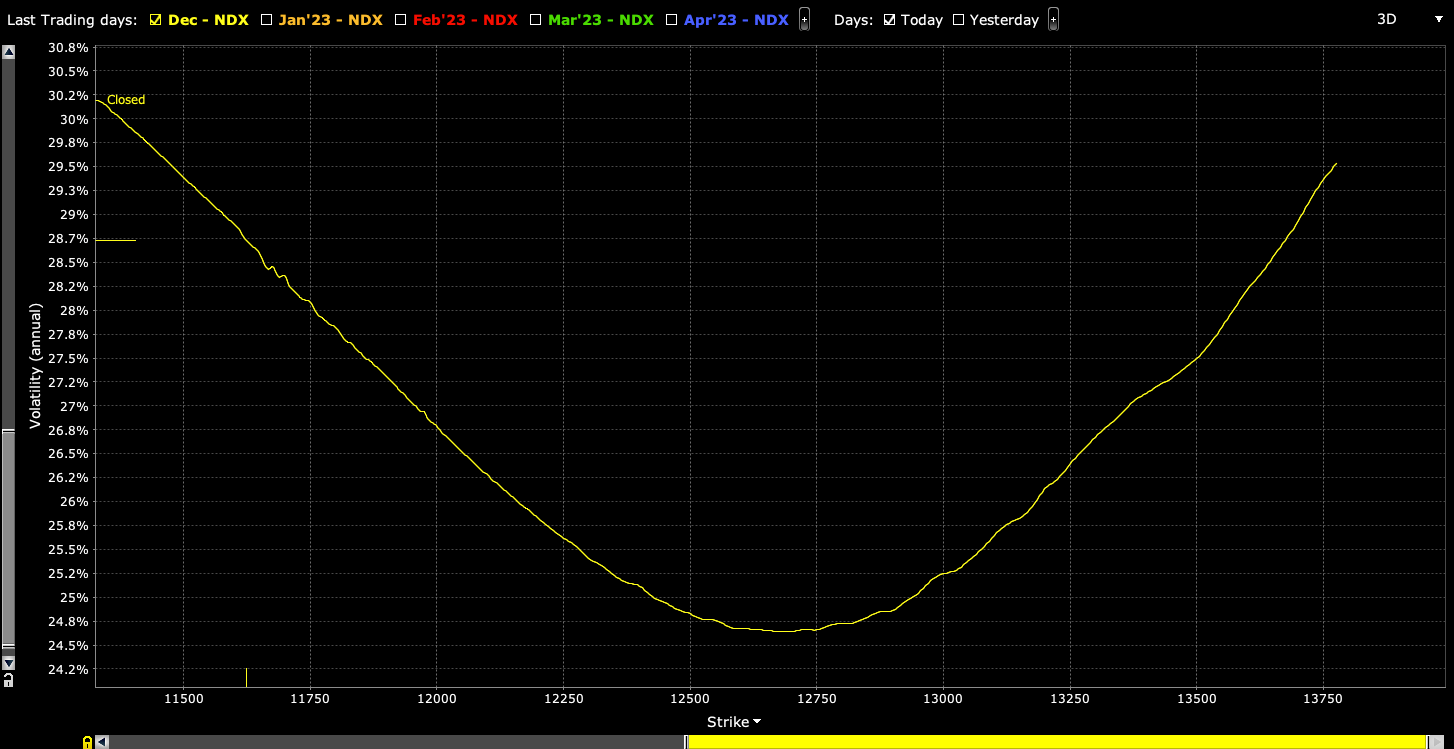
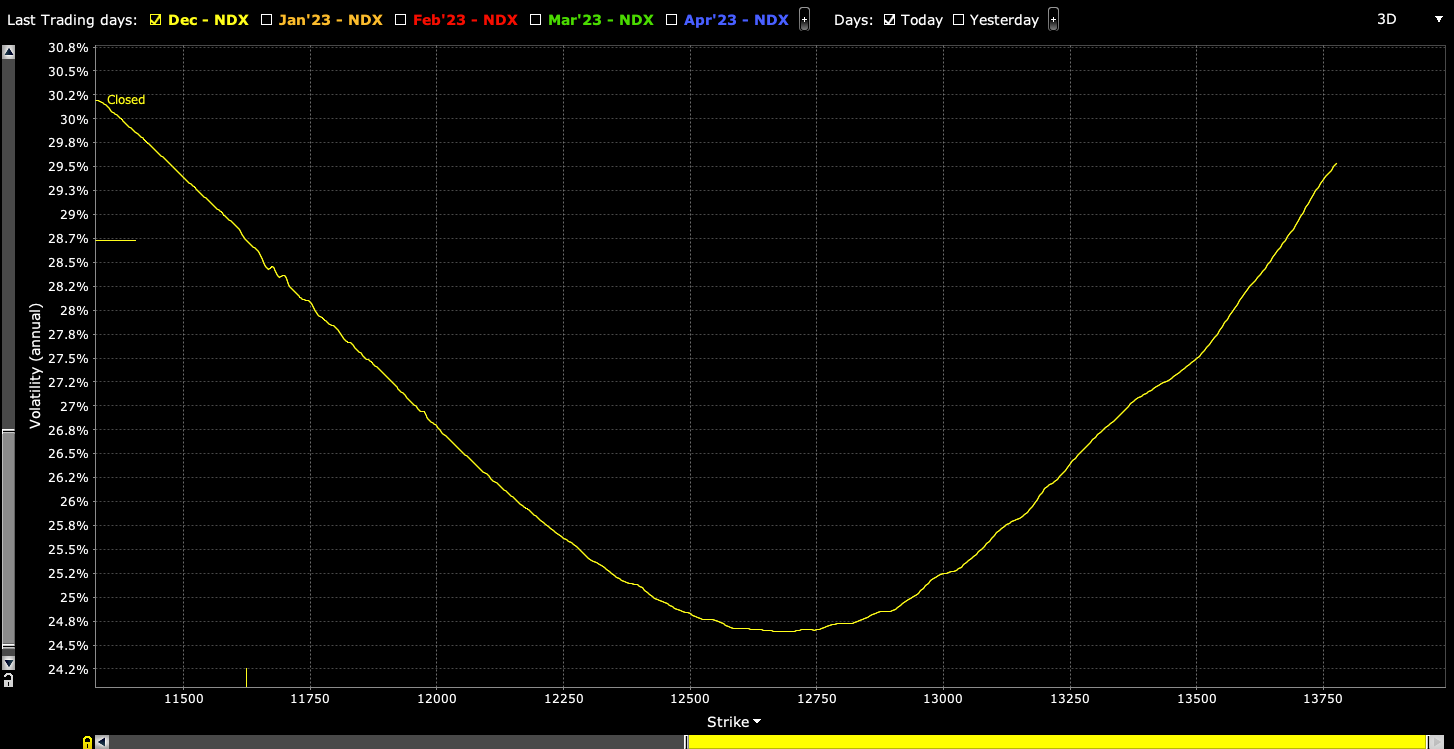
To quote our November 30, 2022 letter, the Nasdaq 100’s (INDEX: NDX) “volatility skew … was smile-shaped, … making for some great trades to the upside,” we said, adding: “we can use the richness of further away calls to reduce the cost of our bets on the market upside.”

Graphic: Updated 11/28/2022. Retrieved from Interactive Brokers (NASDAQ: IBKR). Nasdaq 100 (INDEX: NDX) volatility skew resembles the so-called smile.

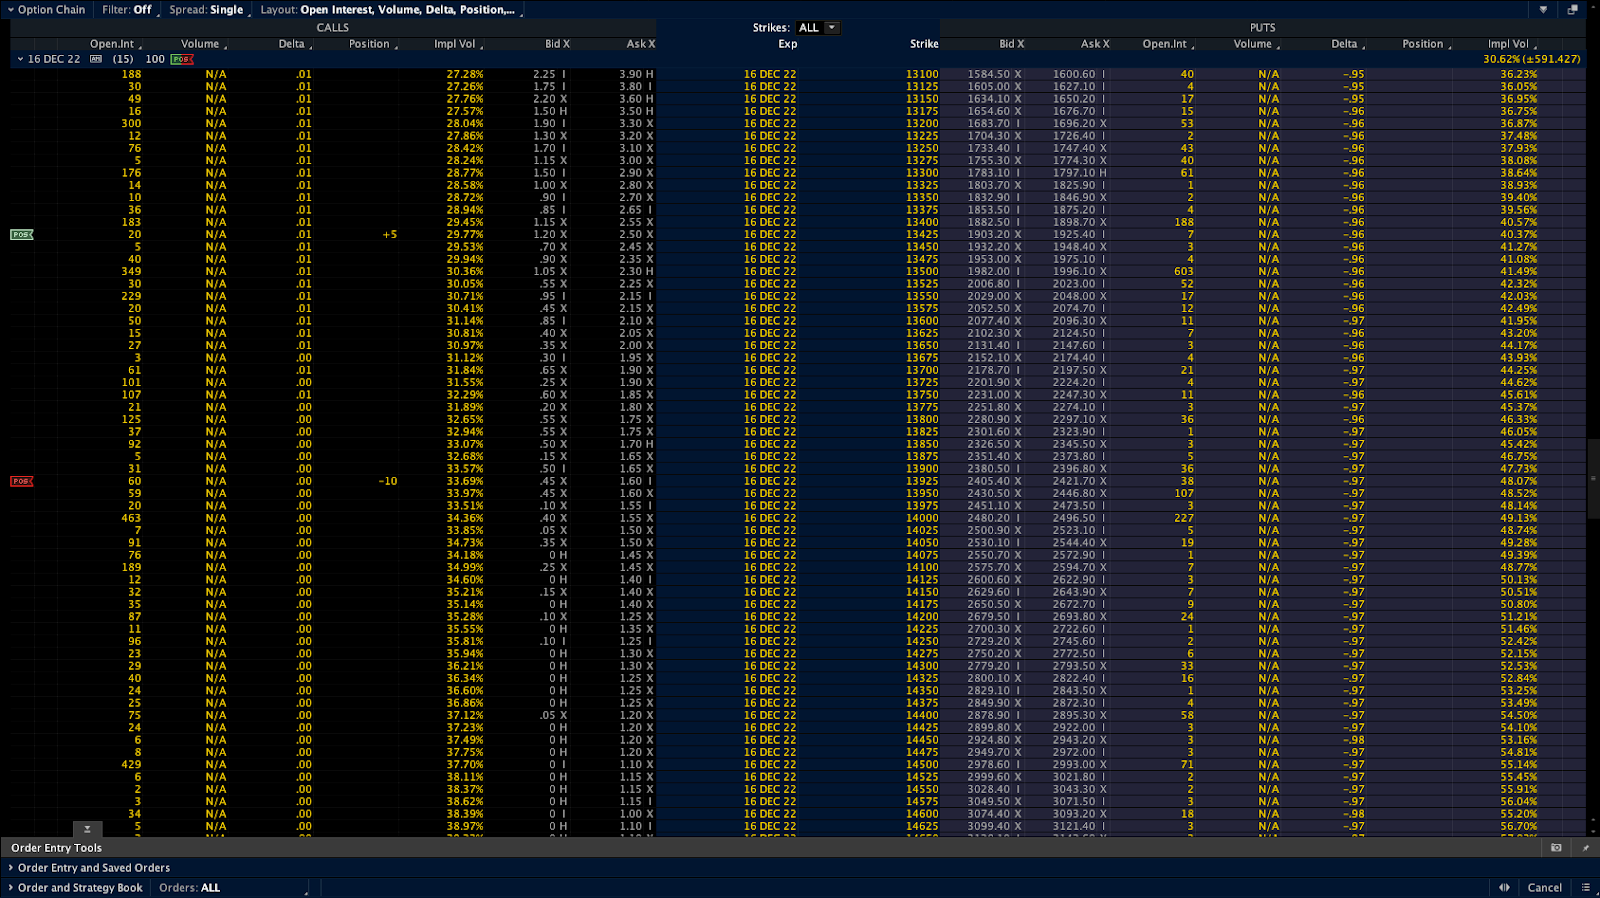
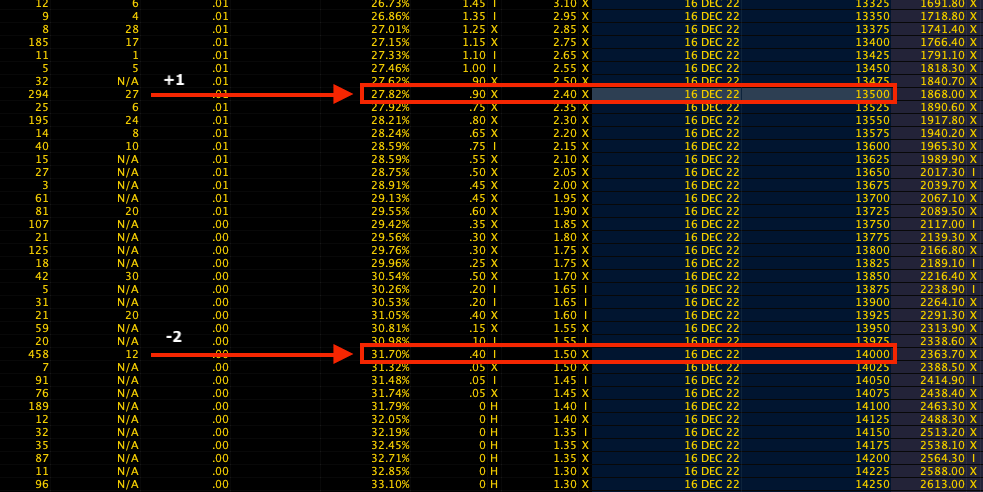
The sample trade provided: 500-1000 points wide call ratio spreads (buy the closer leg, sell two of the farther legs) expiring in fifteen days may work well (e.g., SELL -1 1/2 BACKRATIO NDX 100 16 DEC 22 [AM] 13425/13925 CALL @.20 CR LMT). 

The trade’s key greeks (+Delta and +Gamma) suggested upside would result in profit. The NDX did rise, and the sample trade priced as high as +2,000%. Adding, as sized by the letter writer, if NDX -10.00%, the loss was limited to $60.00. If the NDX +10.00%, with other conditions the same, profit ~$12,000.00. 

Graphic: Retrieved from the Charles Schwab Corporation-owned (NYSE: SCHW) thinkorswim platform. Nasdaq 100 options prices. 

Back to the present. What now?

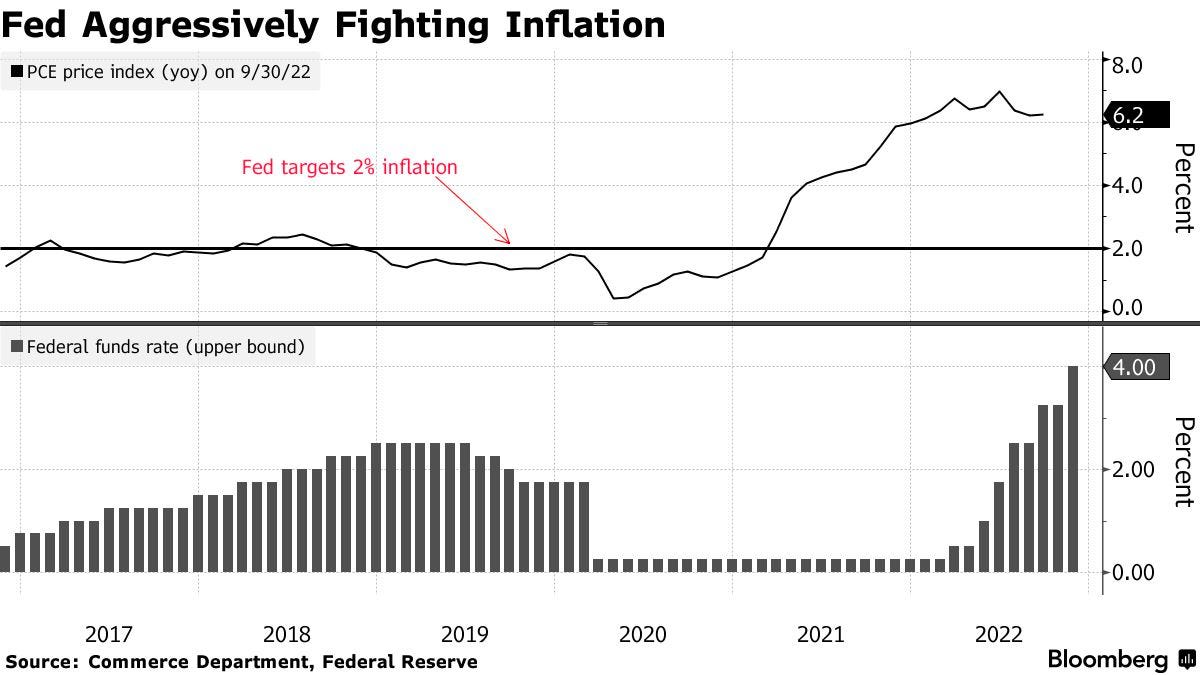
With news that China is loosening its grip on Covid, and the Federal Reserve seeing inflation fall in some parts of the economy (despite markets showing the terminal rate at ~5.20% next spring) ahead of PCE inflation updates this morning, there is a chance for follow-on bullishness.

Graphic: Via Charles Schwab Corporation’s (NYSE: SCHW) TD Ameritrade thinkorswim. Observed is the Eurodollar, the interest offered on U.S. dollar-denominated deposits held at banks outside of the U.S. (i.e., participants’ outlook on interest rates).

So, what is the takeaway?

The purpose of this letter, though it seems we venture beyond it at times, is to ponder theory as well as generate actionable trade ideas based on the application of theory to recent happenings. 

Though there are factors that may skew the expected distribution of returns one way or another, a trade is a coinflip; your bet either works or it does not. Using the factors of volatility and time to our advantage may lower the risk and cost of bets, in case they do not pan out.

In short, we don’t know if up or down, but we can use market context to lower our costs and live to fight another day! See you later.

Technical

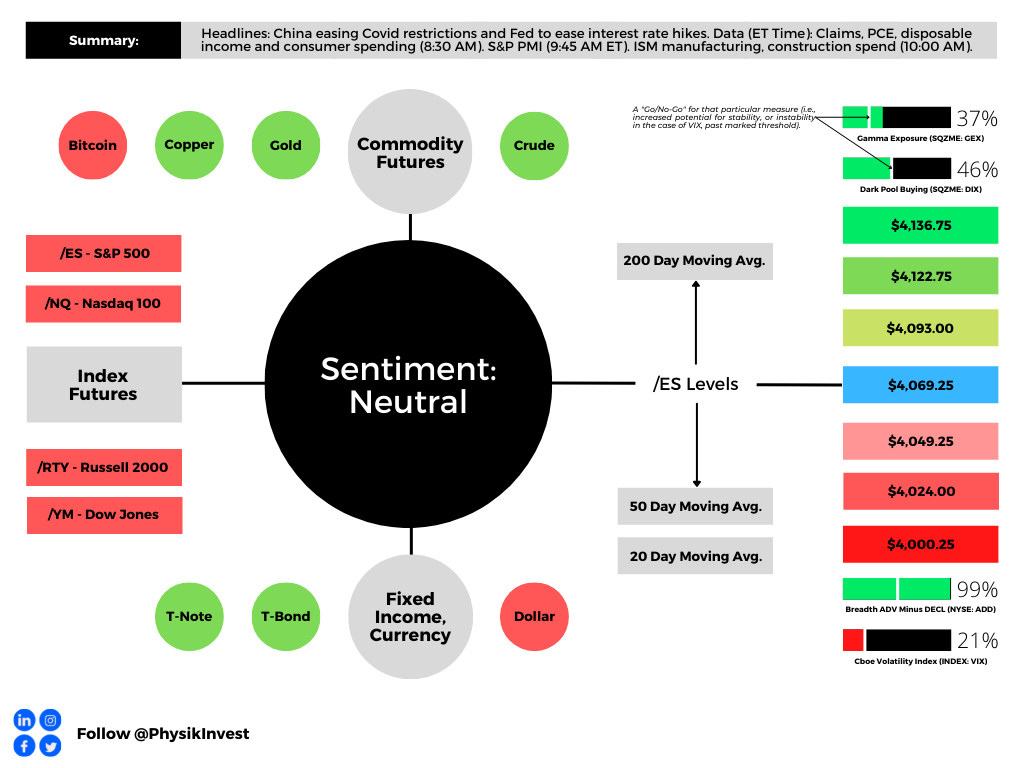
As of 7:00 AM ET, Thursday’s regular session (9:30 AM – 4:00 PM ET), in the S&P 500, is likely to open in the lower part of a negatively skewed overnight inventory, inside of prior-range and -value, suggesting a limited potential for immediate directional opportunity.

Our S&P 500 pivot for today is $4,069.25. 

Key levels to the upside include $4,093.00, $4,122.75, and $4,136.75. 

Key levels to the downside include $4,049.25, $4,024.00, and $4,000.25.

Click here to load today’s key levels into the web-based TradingView platform. All levels are derived using the 65-minute timeframe. New links are produced, daily.

Graphic: 65-minute profile chart of the Micro E-mini S&P 500 Futures.

Definitions

Volume Areas: Markets will build on areas of high-volume (HVNodes). Should the market trend for long periods of time, it will be identified by low-volume areas (LVNodes). LVNodes denote directional conviction and ought to offer support on any test.

If participants auction and find acceptance in an area of a prior LVNode, then future discovery ought to be volatile and quick as participants look to HVNodes for favorable entry or exit.

POCs: Denote areas where two-sided trade was most prevalent in a prior day session. Participants will respond to future tests of value as they offer favorable entry and exit.

MCPOCs: Denote areas where two-sided trade was most prevalent over numerous sessions. Participants will respond to future tests of value as they offer favorable entry and exit.

Volume-Weighted Average Prices (VWAPs): A metric highly regarded by chief investment officers, among other participants, for quality of trade. Additionally, liquidity algorithms are benchmarked and programmed to buy and sell around VWAPs.


About

In short, an economics graduate working in finance and journalism.

Capelj spends most of his time as the founder of Physik Invest through which he invests and publishes daily analyses to subscribers, some of whom represent well-known institutions.

Separately, Capelj is an equity options analyst at SpotGamma and an accredited journalist interviewing global leaders in business, government, and finance.

Past works include conversations with investor Kevin O’Leary, ARK Invest’s Catherine Wood, FTX’s Sam Bankman-Fried, Lithuania’s Minister of Economy and Innovation Aušrinė Armonaitė, former Cisco chairman and CEO John Chambers, and persons at the Clinton Global Initiative.

Contact

Direct queries to renato@physikinvest.com or Renato Capelj#8625 on Discord.

Disclaimer

Do not construe this newsletter as advice. All content is for informational purposes.

Categories
Commentary

Daily Brief For November 30, 2022

Physik Invest’s Daily Brief is read by thousands of subscribers. You, too, can join this community to learn about the fundamental and technical drivers of markets.

Graphic updated 7:20 AM ET. Sentiment Neutral if expected /ES open is inside of the prior day’s range. /ES levels are derived from the profile graphic at the bottom of this letter. Levels may have changed since initially quoted; click here for the latest levels. SqueezeMetrics Dark Pool Index (DIX) and Gamma (GEX) with the latter calculated based on where the prior day’s reading falls with respect to the MAX and MIN of all occurrences available. A higher DIX is bullish. At the same time, the lower the GEX, the more (expected) volatility. Click to learn the implications of volatility, direction, and moneyness. Breadth reflects a reading of the prior day’s NYSE Advance/Decline indicator. VIX reflects a current reading of the CBOE Volatility Index (INDEX: VIX) from 0-100.

Administrative

For the first time in a while, I am able to catch up to and focus more on active trading, hence the earlier letter, today. What a crazy past few months. Almost back to normal!

We will issue a content calendar, soon, revealing the dates letters are likely to be published and the content that may be covered.

That said, due to the writer’s travel commitments, from 12/6 to 12/9 and 12/12 to 12/16 there will be no commentaries. If any queries, or if you are local to New York City or Paris, ping renato@physikinvest.com or Renato Capelj#8625 on Discord.

Fundamental

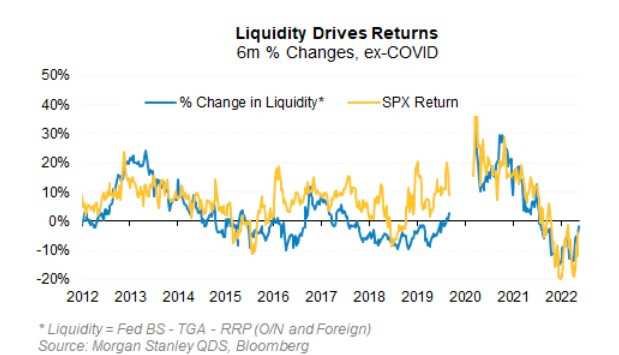
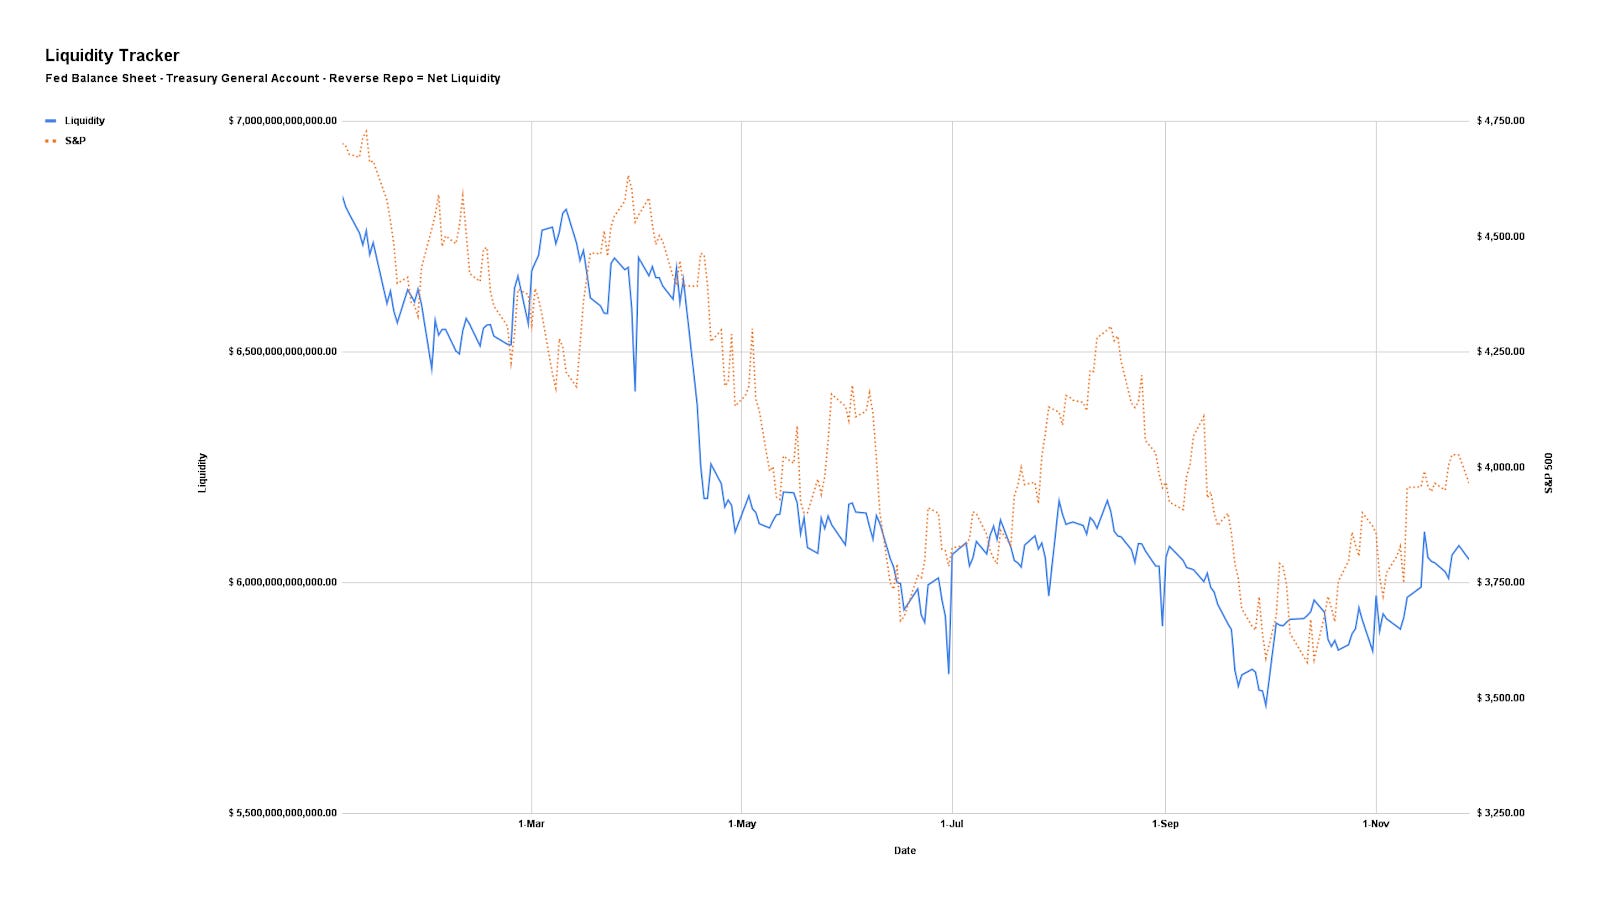
In many ways, the opposite of what happened to bolster a rally across risk assets like equities and crypto is happening, now. As unpacked in detail across letters including our Daily Brief for October 5, 2022, liquidity measures are in a near-lockstep fall with the S&P 500 (INDEX: SPX).

The correlation between so-called net liquidity described further below, and the S&P 500, over the past ten years is about 0.70 and explains more than half of the movement in price-earings multiples over the past decade.

Graphic: Retrieved from Bloomberg.

Detailed in previous letters was how processes like quantitative tightening manifest themselves as less demand for assets; per Fabian Wintersberger, central bankers must “recycle bonds into the markets on an unprecedented scale, which could easily lead to lower bond prices/higher yields” causing a “reflux of capital to safe-haven assets, like treasuries.”

Alfonso Peccatiello of The Macro Compass details more on the impact of more or less financial sector money in a post titled “All They Told You About Money Printing Is Really, Really Wrong.”

Adding, “the Fed has [only] reduced its holdings by 1.5% by letting bonds mature on its balance sheet. If they want to reduce the balance sheet back to the level of 2020, it needs to reduce it by 41%; … [therefore], [i]f history is any guide, the stock market has yet to face its most significant problems in such a scenario.”

Morgan Stanley’s (NYSE: MS) trading team agrees, per a recent Bloomberg article on a looming bear case for the S&P 500.

Though “rate increases get all the blame for this year’s bear market” and a projected “slowdown in the pace of rate hikes” helping “equities emerge from the yearlong bear, … the S&P 500 will drop as much as 15% by March, based on historic patterns and projected money flows,” which major inputs include “changes in the Fed’s balance sheet (BS); the Treasury General Account (TGA), or Treasury cash held at the central bank; and Reverse Repo Facilities (RRP), or cash parked at the Fed by money market funds and others.”

Graphic: Retrieved from Bloomberg. Inflation increases are easing.

In other words, net liquidity is the Fed’s BS less TGA and RRP. See the below graphic.

Accordingly, “a rise in Fed’s balance sheet means an expansion in liquidity that bodes well for stocks, while an increase in TGA or RRP suggests a contraction in liquidity.” 

Based on the QT pace ($95 billion per month) and forecasts the Treasury cash balance will “rise by $200 billion into yearend, … [amounting] to a squeezing of liquidity that alone implies an 8% drop for the S&P 500 by the end of December.”

Graphic: Via Physik Invest. Data compiled by @jkonopas623. Fed Balance Sheet data, here. Treasury General Account Data, here. Reverse Repo data, here. NL = BS – TGA – RRP.

In summary, “there’s no longer enough money to finance [the] production of those goods and to support a stock market that’s still far from cheap.”

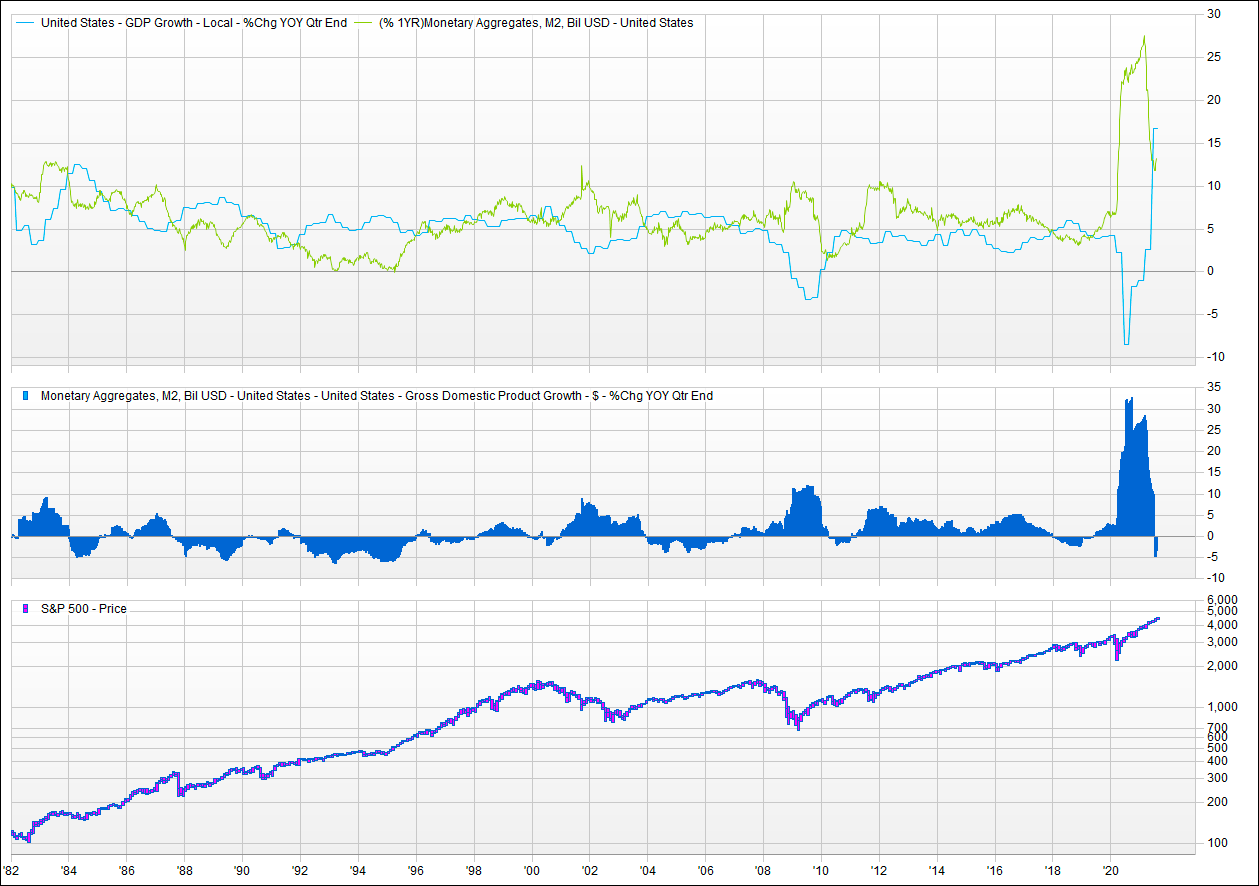
Graphic: Retrieved from VettaFi. “If the supply of money (in aggregate, M2) is higher than the demand for money (represented by nominal GDP), then there is “excess” liquidity that can and will find its way into asset prices.  Furthermore, if the growth of money supply exceeds the growth of GDP, that excess liquidity builds, and there is more of it to find its way into more asset prices.  In theory, the inverse would also hold true.  If the growth of GDP exceeds the growth of money supply, then excess liquidity is being consumed by the demand for money.  In this scenario, the real economy is feeding on liquidity that was once flowing into asset prices.”

Positioning

As we said earlier this week (November 29, 2022, and November 28, 2022), it’s not a terrible time to hedge, and selling volatility, blindly, on either side of the market, is not a great trade.

As SpotGamma put well, yesterday, implied volatility (IVOL) is at a low meaning “it makes sense to buy volatility and put on trades that make money if the market moves” but leverage the skew to sell “options to cut down the cost of waiting for that movement to happen.”

In our letter, yesterday, we highlighted Nasdaq 100 (INDEX: NDX) volatility skew and showed it was smile-shaped, rather than the typical smirk-shaped reverse pattern, making for some great trades to the upside. Through steeper call volatility skew – a result of traders positioning for an upside move – we can use the richness of further away calls to reduce the cost of our bets on the market upside.

Graphic: Updated 11/28/2022. Retrieved from Interactive Brokers (NASDAQ: IBKR). Nasdaq 100 (INDEX: NDX) volatility skew resembles the so-called smile.

For instance, low-cost 500-1000 points wide call ratio spreads (buy the closer leg, sell two of the farther legs) expiring in fifteen days may work well (e.g., SELL -1 1/2 BACKRATIO NDX 100 16 DEC 22 [AM] 13425/13925 CALL @.20 CR LMT). The immediate concern with these strategies is your exposure to Delta (i.e., direction) and Gamma (i.e., does movement make you money).

The required reading is Dynamic Hedging: Managing Vanilla and Exotic Options!

Graphic: Retrieved from the Charles Schwab Corporation-owned (NYSE: SCHW) thinkorswim platform. Nasdaq 100 options prices.

If you are exposed to +Delta and +Gamma, your trade makes money in an increasing way as the market rises, barring any other changes (e.g., passage of time, increases in volatility, etc).

If you are exposed to -Delta and -Gamma, your trade loses money in an increasing way as the market rises, barring any other changes. Should the movement happen quickly, and volatility rise, which is not likely, then that worsens the situation. 

The required reading is Dynamic Hedging: Managing Vanilla and Exotic Options!

This is not advice but a framework for how to act on the theory we talk about on a daily basis. In short, don’t sell calls and puts blindly. Adding, the above trade may not provide safe exposure to the market upside or downside. Given the sideways trade and contraction in ranges, we aim to be well-positioned for a move from low to high volatility. Stay safe and watch your risk.

Noting, should you sell IVOL, the market trade lower, and the demand for IVOL rises, you may be left in an awkward position; big market drops statistically add to the likelihood of more drops.

Read The Second Leg Down: Strategies for Profiting after a Market Sell-Off!

Graphic: Retrieved from SqueezeMetrics.

Technical

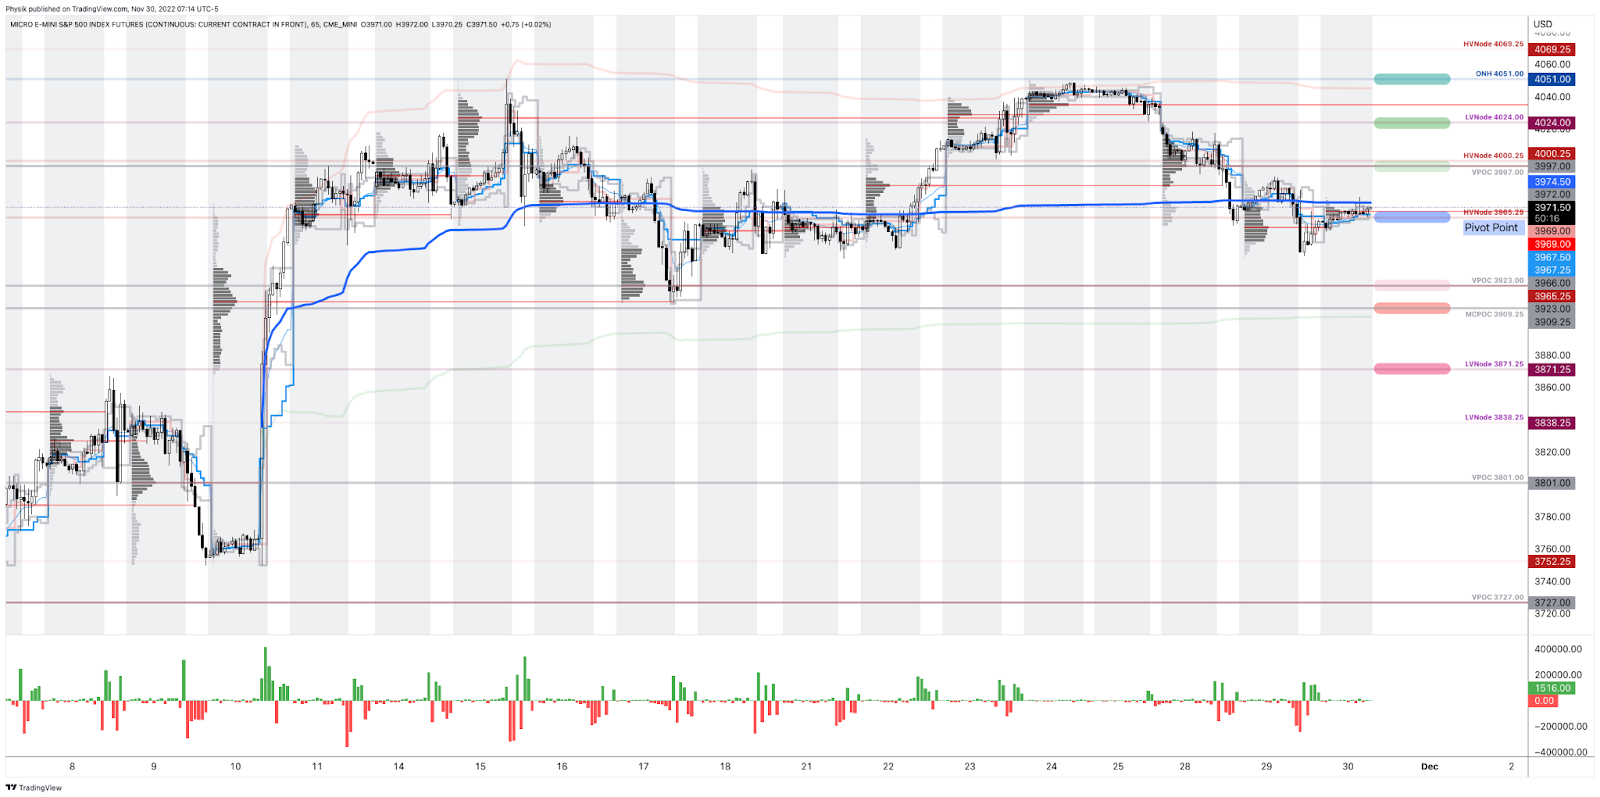
As of 7:15 AM ET, Wednesday’s regular session (9:30 AM – 4:00 PM ET), in the S&P 500, is likely to open in the upper part of a positively skewed overnight inventory, inside of prior-range and -value, suggesting a limited potential for immediate directional opportunity.

Our S&P 500 pivot for today is $3,965.25. 

Key levels to the upside include $3,997.00, $4,024.00, and $4,051.00. 

Key levels to the downside include $3,923.00, $3,909.25, and $3,871.25.

Click here to load today’s key levels into the web-based TradingView platform. All levels are derived using the 65-minute timeframe. New links are produced, daily.

Graphic: 65-minute profile chart of the Micro E-mini S&P 500 Futures.

Definitions

Volume Areas: Markets will build on areas of high-volume (HVNodes). Should the market trend for long periods of time, it will be identified by low-volume areas (LVNodes). LVNodes denote directional conviction and ought to offer support on any test.

If participants auction and find acceptance in an area of a prior LVNode, then future discovery ought to be volatile and quick as participants look to HVNodes for favorable entry or exit.

Gamma: The sensitivity of an option’s Delta to changes in the underlying asset’s price.

Volga: The sensitivity of an option’s Vega to changes in the underlying’s implied volatility.

POCs: Denote areas where two-sided trade was most prevalent in a prior day session. Participants will respond to future tests of value as they offer favorable entry and exit.

MCPOCs: Denote areas where two-sided trade was most prevalent over numerous sessions. Participants will respond to future tests of value as they offer favorable entry and exit.

Volume-Weighted Average Prices (VWAPs): A metric highly regarded by chief investment officers, among other participants, for quality of trade. Additionally, liquidity algorithms are benchmarked and programmed to buy and sell around VWAPs.


About

In short, an economics graduate working in finance and journalism.

Capelj spends most of his time as the founder of Physik Invest through which he invests and publishes daily analyses to subscribers, some of whom represent well-known institutions.

Separately, Capelj is an equity options analyst at SpotGamma and an accredited journalist interviewing global leaders in business, government, and finance.

Past works include conversations with investor Kevin O’Leary, ARK Invest’s Catherine Wood, FTX’s Sam Bankman-Fried, Lithuania’s Minister of Economy and Innovation Aušrinė Armonaitė, former Cisco chairman and CEO John Chambers, and persons at the Clinton Global Initiative.

Contact

Direct queries to renato@physikinvest.com or Renato Capelj#8625 on Discord.

Disclaimer

Do not construe this newsletter as advice. All content is for informational purposes.
Categories
Commentary

Daily Brief For November 29, 2022

Physik Invest’s Daily Brief is read by over 1,200 people. To join this community and learn about the fundamental and technical drivers of markets, subscribe below.

Graphic updated 6:50 AM ET. Sentiment Neutral if expected /ES open is inside of the prior day’s range. /ES levels are derived from the profile graphic at the bottom of this letter. Levels may have changed since initially quoted; click here for the latest levels. SqueezeMetrics Dark Pool Index (DIX) and Gamma (GEX) with the latter calculated based on where the prior day’s reading falls with respect to the MAX and MIN of all occurrences available. A higher DIX is bullish. At the same time, the lower the GEX, the more (expected) volatility. Click to learn the implications of volatility, direction, and moneyness. Breadth reflects a reading of the prior day’s NYSE Advance/Decline indicator. VIX reflects a current reading of the CBOE Volatility Index (INDEX: VIX) from 0-100.

Positioning

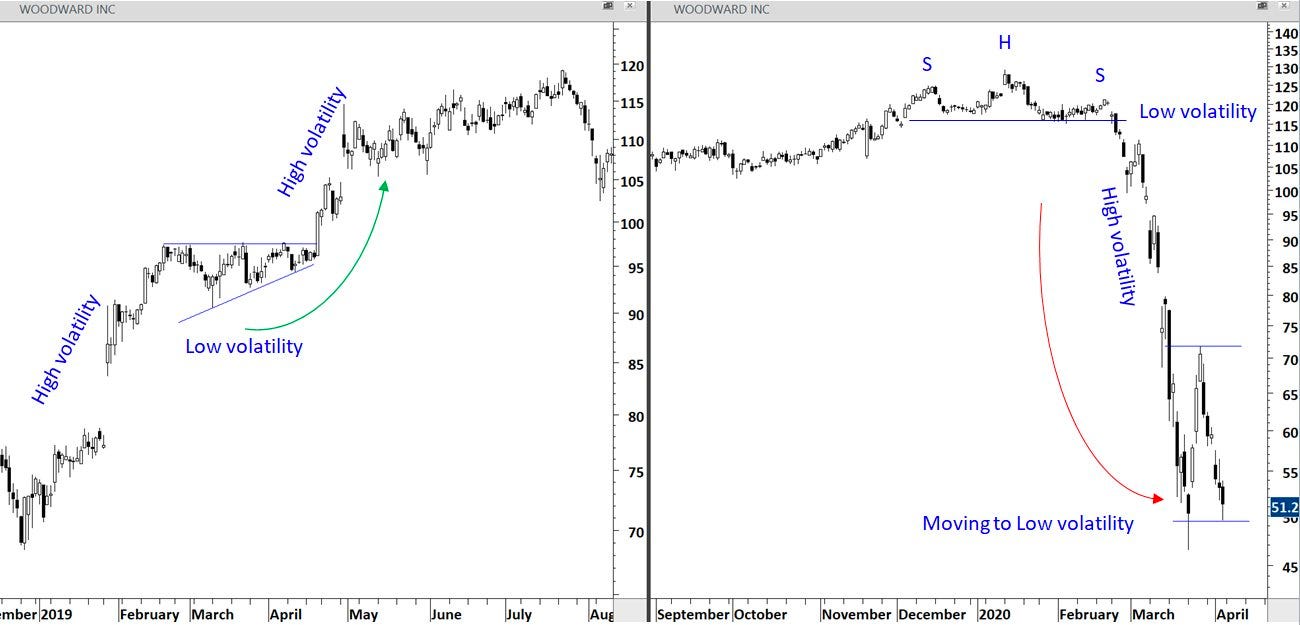
Aksel Kibar of Tech Charts said it well: There are two types of trades.

1) Trades that you take moving from low volatility to high volatility [and] 2) trades that you take in high volatility while moving to low volatility.”

Graphic: Retrieved from Aksel Kibar, CMT.

Like Kibar, we aim to be well-positioned for a move from low to high volatility. In short, that is where we are today. After an expansion of range to the upside, markets are trading sideways, in a tight range, and traders’ recent activities are likely to keep the status quo intact a bit longer.

Notwithstanding, we are likely nearing an expansion of realized volatility (RVOL), per the implied volatility (IVOL) bid; on Monday, some IVOL measures, such as the Cboe Volatility Index (INDEX: VIX), shifted up, as did term structure. Markets sold a bit, too.

Quick aside:

Changes in IVOL are a byproduct of supply and demand (i.e., demand rushes in → IVOL rises → option prices adjust higher).

When protection is demanded by investors, counterparties may pressure markets (a naive take, if we will, for the purpose of breaking things down).

To explain further, say the market is in balance and trading sideways, and traders seek to protect against potential downside movement by purchasing put options.

This new demand will bid put options prices, causing counterparties to hedge in a manner that pressures the market (i.e., a trader buys put and bids IVOL → the counterparty sells that put and futures to hedge that put), as we’re seeing (i.e., IVOL higher and market lower ahead of updates to measures like the Personal Consumption Expenditures [INDEX: PCE], the Fed’s go-to inflation reading).

Back to the letter:

Upon some new information, participants will enter and reprice the market.

Counterparties’ re-hedging could add to the movement up or down (e.g., traders sell their put hedges → IVOL compresses → counterparties buy back futures hedges and support the market).

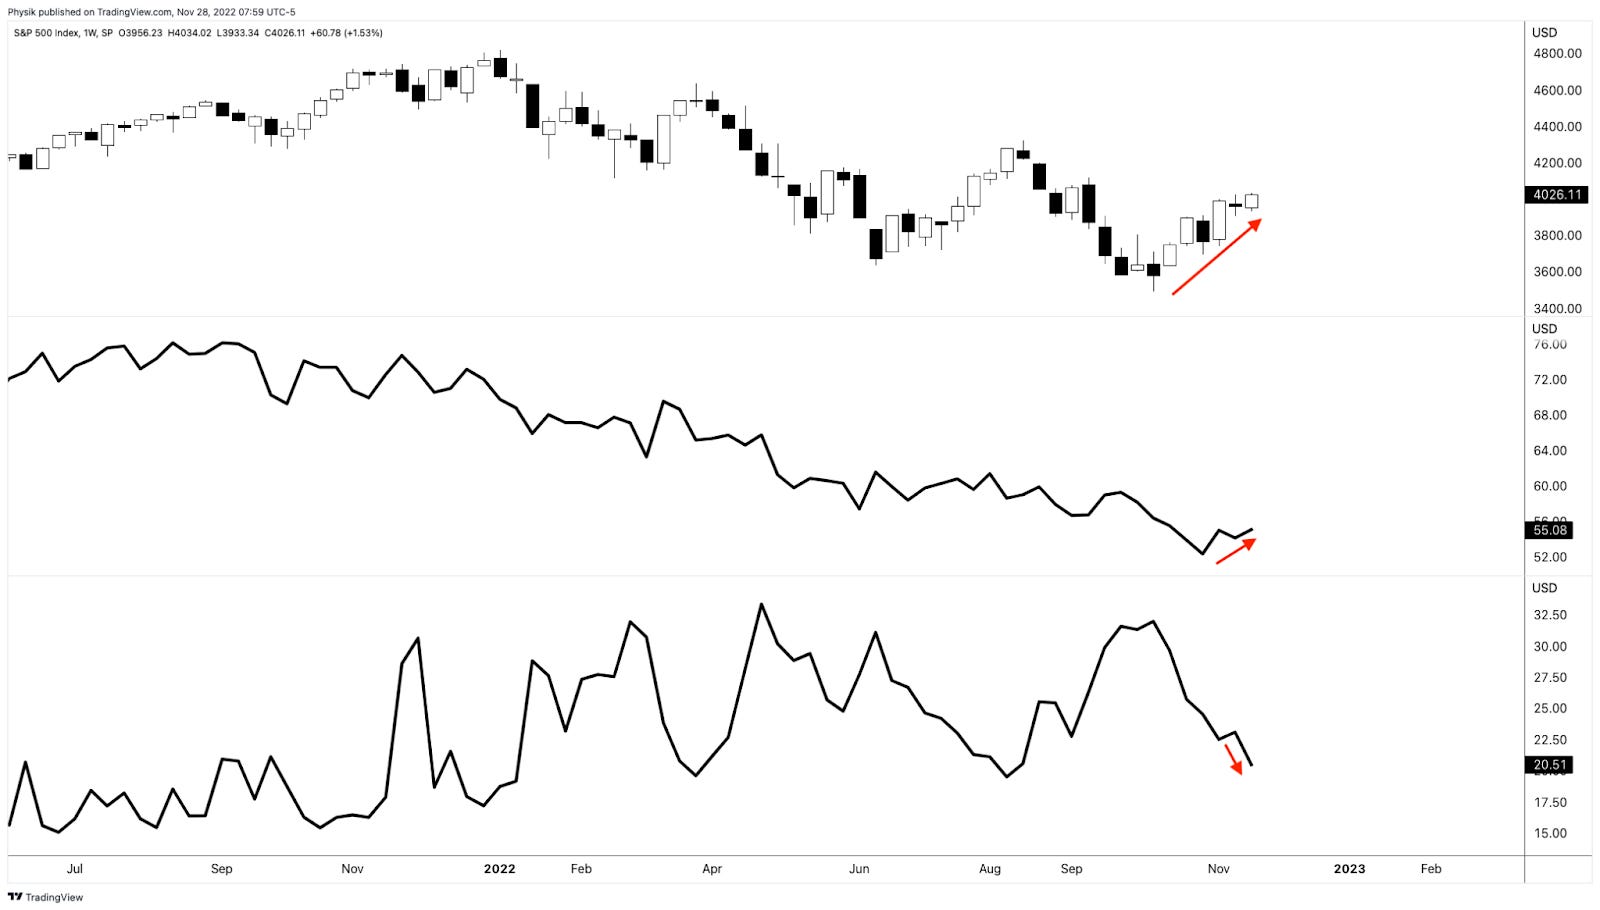
If you’re betting on lower prices, recommended is a quick reference of Physik Invest’s Daily Brief for November 28, 2022. In short, according to SpotGamma, “there’s less to be lost owning protection down below,” given the performance of skew, relative to topline measures such as the Cboe Volatility Index (INDEX: VIX).

“On the contrary, if you buy [protection] and nothing happens, that [protection] may very well hold its value better than in the past.”

Graphic: Retrieved from TradingView. Top, S&P 500 (INDEX: SPX). Middle Nations SkewDex (INDEX: SDEX). Bottom Cboe Volatility Index (INDEX: VIX). According to one paper from Nations Indexes, “SkewDex tells market participants how expensive out-of-the-money options are in relation to at-the-money options and thus, how risk-averse investors are.”

On the call side, the story is similar; selling volatility blindly is not a good trade. 

To explain, incentive schemes drove “people to be much more willing to pay and chase upside,” and this is, in part, evidenced by historically low skew. There is also stock replacement, among other things, due to the opportunity cost of buying stock being higher in the current interest rate environment (i.e., “higher call options premium when interest rates are high is the ‘opportunity cost’ of forgone interest”).

Graphic: Retrieved from Charles Schwab Corporation (NYSE: SCHW).

In the interest of brevity, this environment has resulted in a smile-shaped volatility skew pattern, rather than the typical smirk-shaped reverse volatility skew pattern. 

Graphic: Retrieved from Interactive Brokers (NASDAQ: IBKR). Nasdaq 100 (INDEX: NDX) volatility skew resembles the so-called smile.

Skew has steepened on the call side – a result of traders positioning for an upside move – and we can use the richness of out-of-the-money calls to reduce the cost of our bets on the market upside.

Graphic: Retrieved from the Charles Schwab Corporation-owned (NYSE: SCHW) thinkorswim platform. Nasdaq 100 options prices.

For instance, low-cost 500-1000 points wide call ratio spreads (buy the closer leg, sell two of the farther legs) expiring in fifteen days may work well.

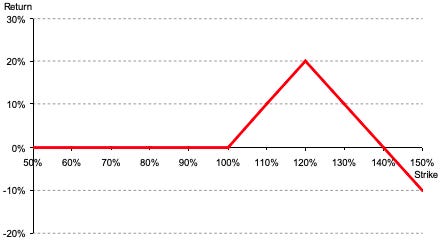
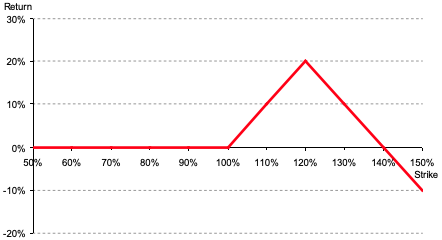
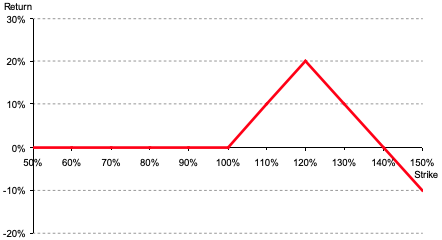
Graphic: Via Banco Santander SA (NYSE: SAN) research. The return profile, at expiry, of a 1×2 (long 1, short 2 further away) ratio spread.

A concern with these strategies is the width and time to expiry. Should either of those be wrong, then spreads initially positive gamma turn negative, meaning upside market movement hurts the position and losses are amplified.

Technical

As of 6:45 AM ET, Tuesday’s regular session (9:30 AM – 4:00 PM ET), in the S&P 500, is likely to open in the middle part of a positively skewed overnight inventory, inside of prior-range and -value, suggesting a limited potential for immediate directional opportunity.

Our S&P 500 pivot for today is $4,997.00. 

Key levels to the upside include $4,024.00, $4,051.00, and $4,069.25. 

Key levels to the downside include $3,965.25, $3,923.00, and $3,909.25.

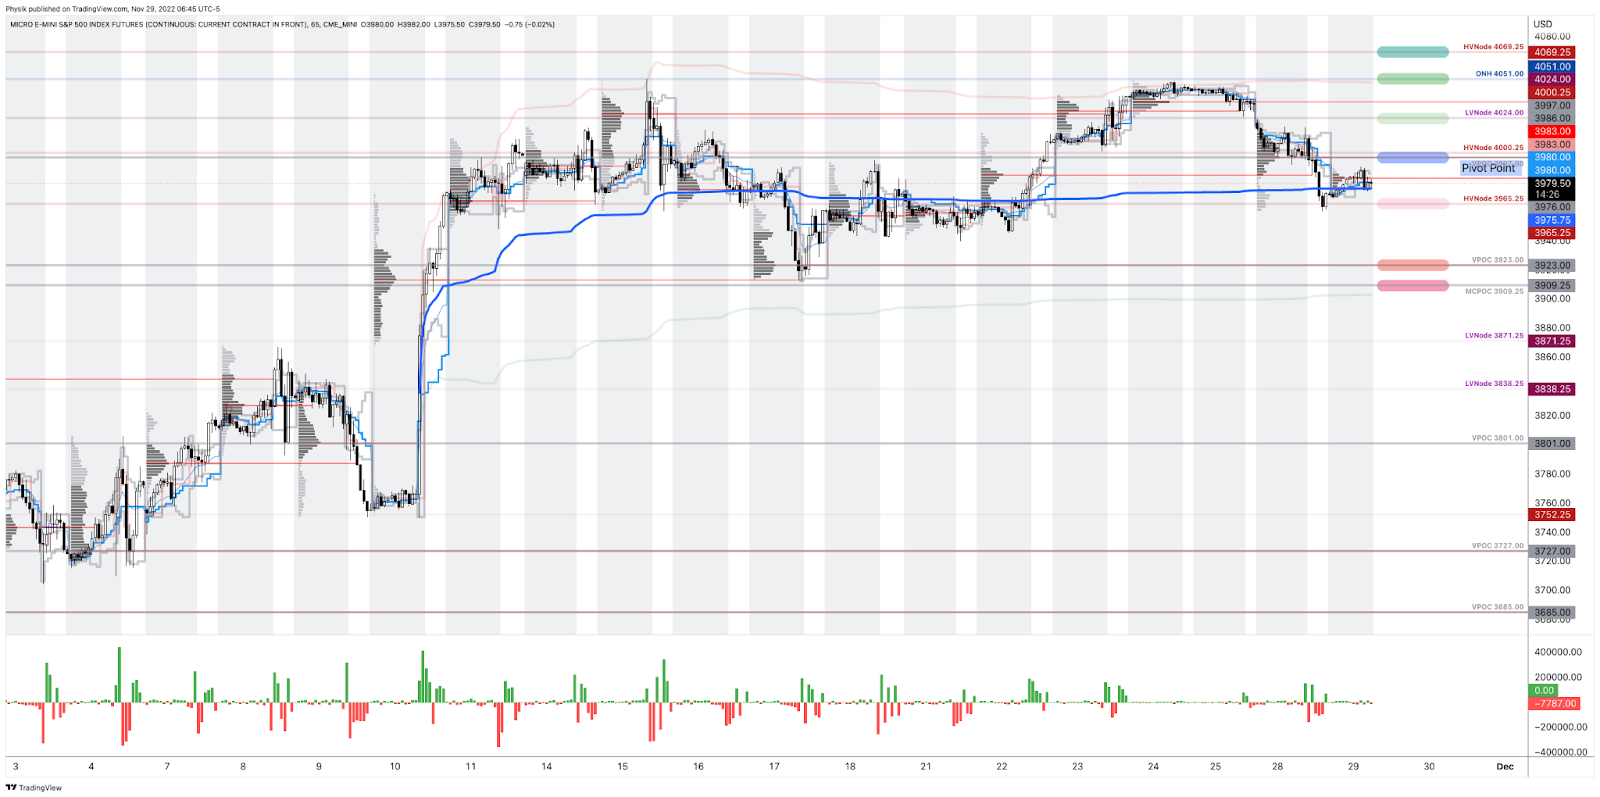
Click here to load today’s key levels into the web-based TradingView platform. All levels are derived using the 65-minute timeframe. New links are produced, daily.

Graphic: 65-minute profile chart of the Micro E-mini S&P 500 Futures.

About

After years of self-education, strategy development, mentorship, and trial-and-error, Renato Leonard Capelj began trading full-time and founded Physik Invest to detail his methods, research, and performance in the markets. 

Capelj also writes options market analyses at SpotGamma and is a Benzinga journalist. 

His past works include private discussions with ARK Invest’s Catherine Wood, investors Kevin O’Leary and John Chambers, the infamous Sam Bankman-Fried of FTX, former Bridgewater Associate Andy Constan, Kai Volatility’s Cem Karsan, The Ambrus Group’s Kris Sidial, the Lithuanian Delegation’s Aušrinė Armonaitė, among many others.

Contact

Direct queries to renato@physikinvest.com or Renato Capelj#8625 on Discord.

Disclaimer

Do not construe this newsletter as advice. All content is for informational purposes.
Categories
Commentary

Daily Brief For March 21, 2022

Editor’s Note: The Daily Brief is a free glimpse into the prevailing fundamental and technical drivers of U.S. equity market products. Join the 200+ that read this report daily, below!

What Happened

Overnight, equity index futures auctioned sideways to lower with commodities and bonds.

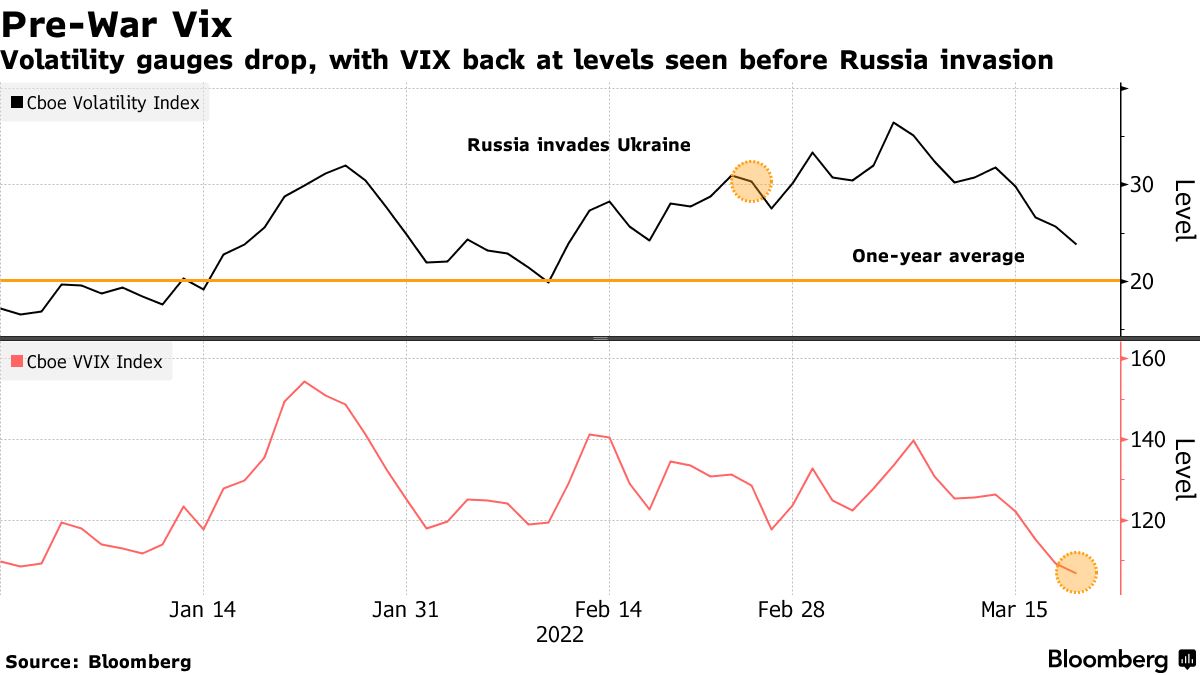
There are no overnight fundamental catalysts to make note of. However, it bears mentioning that implied volatility metrics – via the Cboe Volatility Index (INDEX: VIX) – are back to levels seen before Russia’s invasion of Ukraine. One may conclude that concerns are easing.

Ahead is data on the Chicago Fed national activity index (8:30 AM ET) and Fed-speak by Chair Jerome Powell (12:00 PM ET).

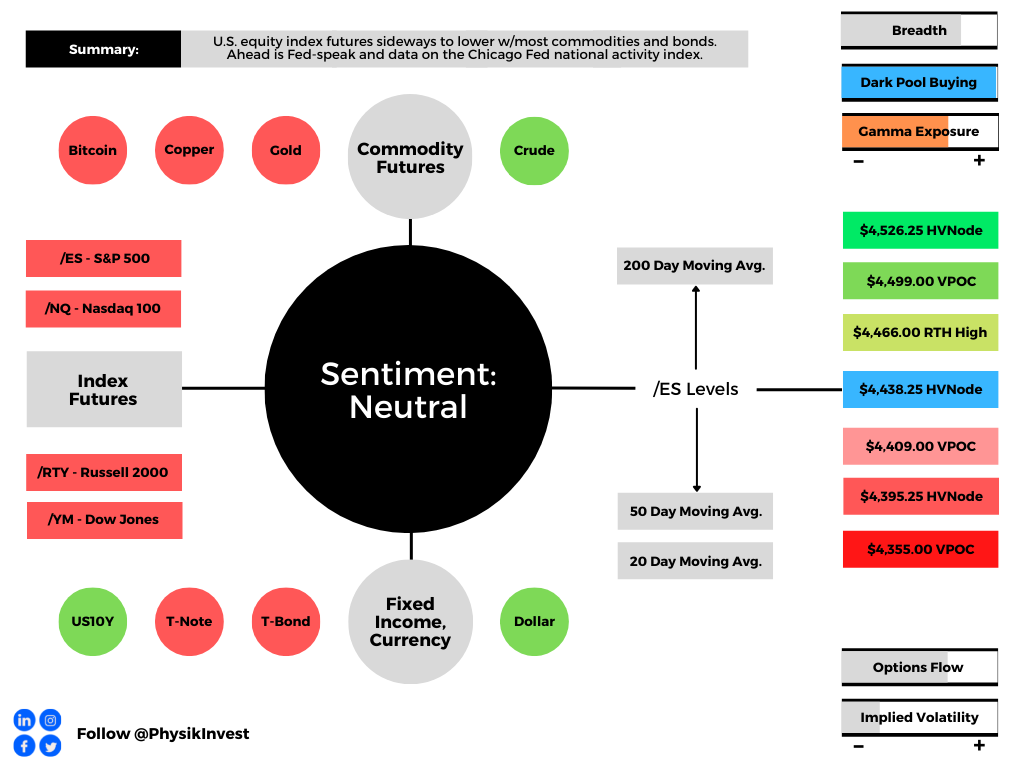
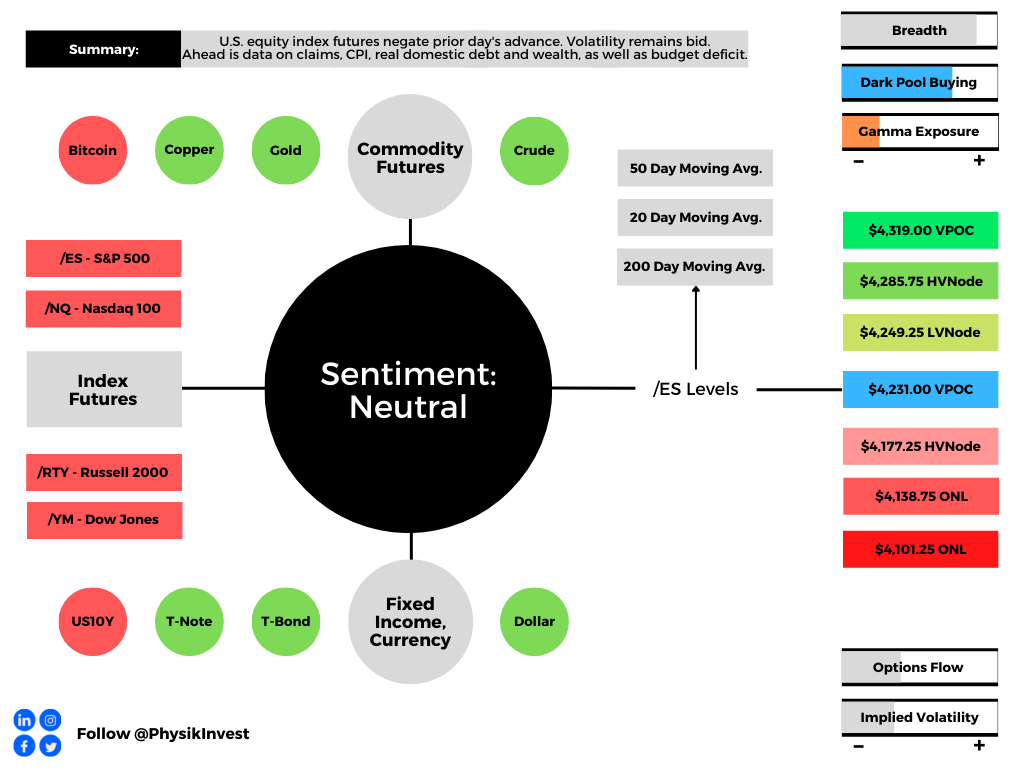
Graphic updated 6:30 AM ET. Sentiment Neutral if expected /ES open is inside of the prior day’s range. /ES levels are derived from the profile graphic at the bottom of the following section. Levels may have changed since initially quoted; click here for the latest levels. SqueezeMetrics Dark Pool Index (DIX) and Gamma (GEX) calculations are based on where the prior day’s reading falls with respect to the MAX and MIN of all occurrences available. A higher DIX is bullish. At the same time, the lower the GEX, the more (expected) volatility. Learn the implications of volatility, direction, and moneyness. SHIFT data used for S&P 500 (INDEX: SPX) options activity. Note that options flow is sorted by the call premium spent; if more positive, then more was spent on call options. Breadth reflects a reading of the prior day’s NYSE Advance/Decline indicator. VIX reflects a current reading of the CBOE Volatility Index (INDEX: VIX) from 0-100.

What To Expect

Fundamental: In spite of uncertainties with respect to economic growth and the implications of tighter monetary policy to rein in inflation, as well as geopolitical conflicts abroad, the pricing of equity market risk – via the VIX – is back at levels before Russia’s invasion of Ukraine.

Graphic: Via Bloomberg.

That leads us to question whether the de-rate (or pricing in of uncertainties) has played out? 

Potentially. With greater clarity on the Federal Reserve’s commitment to raising borrowing costs (as discussed March 17 in detail), strategists like JPMorgan Chase & Co’s (NYSE: JPM) Marko Kolanovic suggest it is time to add risk in beaten-down, high-beta positions

“While the commodity supercycle will persist,” Kolanovic said, “the correction in bubble sectors is now likely finished, and geopolitical risk will likely start abating in a few weeks’ time (while a comprehensive resolution may take a few months).”

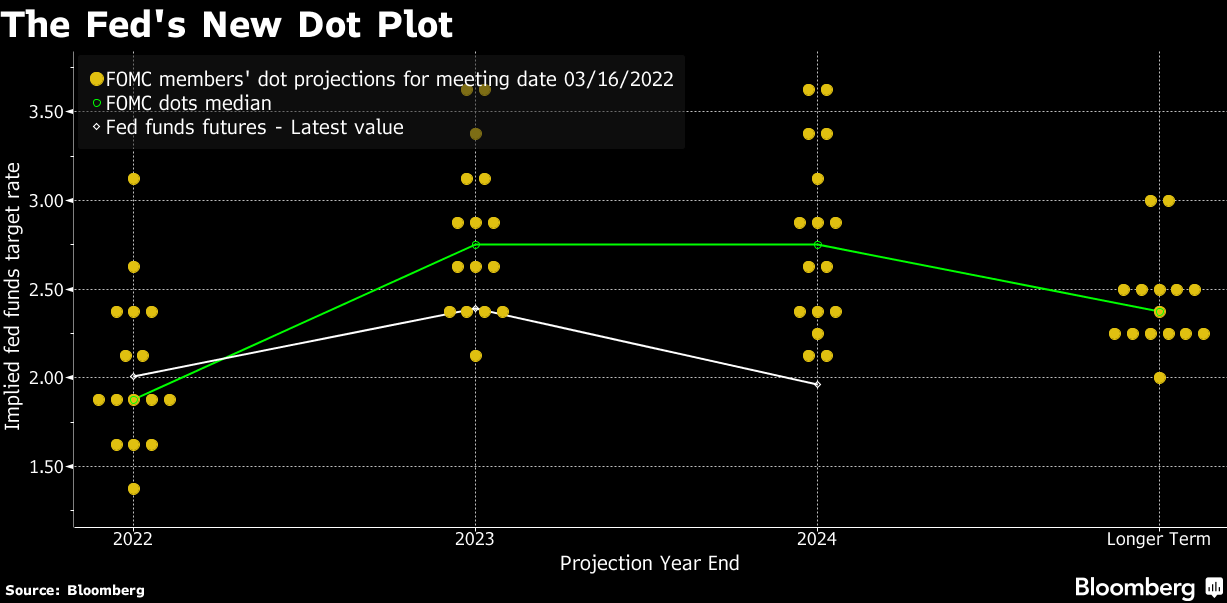
Graphic: Via Bloomberg. “Officials on the Federal Open Market Committee voted 8-1 [] to lift the target range for their main policy rate to 0.25%-0.5% and forecast a sequence of increases that would raise it to 1.75%-2% by year-end. The projections, known as the dot plot, also showed that almost half of the 16 current policymakers wanted to move faster.”

Complicating Kolanovic’s outlook is uncertainty with respect to the Fed’s decision to hike and taper asset purchases faster, as some Fed members say they are “very open to.”

At a high level, higher rates make borrowing more costly (i.e., higher rates on mortgages and business loans, as well as credit cards, among other things, disincentivize borrowing, and this funnels into less growth and inflation).

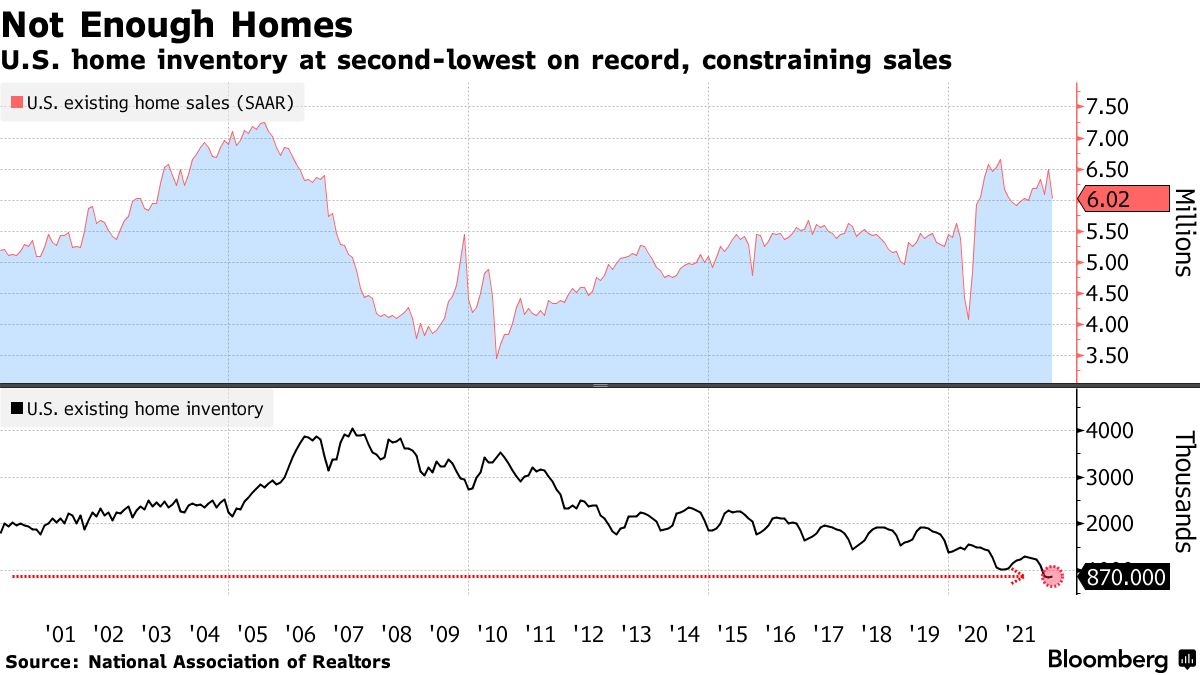
These higher rates compound the challenges of limited supply, for instance, in housing.

Graphic: Via Bloomberg. “The slide in sales reflects a market still constrained by a lack of inventory, which in February was the second-lowest on record. Buyers are bidding up prices on the few homes available. Meantime, affordability is showing signs of worsening, especially among first-time buyers … [which] accounted for 29% of sales last month, down from 31% a year earlier. [A]t current rates, monthly mortgage payments are up 28% from February last year.”

There’s also the topic of using quantitative tightening (QT) to fight inflation, too. 

Recall that quantitative easing (QE) is a policy to expand the Federal Reserve’s balance sheet “to provide monetary accommodation, typically when interest rates are at a zero-lower bound (when nominal interest rates are at, or near, zero),” as JH Investment Management explains.

With QT, central banks remove assets (e.g., government bonds they bought from the private sector) from their balance sheet “either through the sale of assets they had purchased or deciding against reinvesting the principal sum of maturing securities.”

With that, we note that when bonds rise in value, their yields decline; “when the Fed embarks on bond-buying program[s] to support the U.S. economy, … [it nudges] the prices of these assets higher while pushing yields lower, which also has the effect of driving yield-hungry investors into relatively riskier asset categories that promise high returns.”

As a result, participants’ demand for risk assets prompts their divergence from fundamentals. As liquidity is removed and funding costs increase, this may prompt risk assets to converge with fundamentals.

This is as, for investors to take on additional risk for return, they must receive in excess of the risk-free rate (as provided by the Treasury). This excess is the risk premium.

At present, according to commentary by Damped Spring’s Andy Constan, “Additional risk premium expansion pressures from these levels is not likely from news emanating from” Fed meetings.

“However, if, in the unlikely event, details of QT do emerge suggesting a start of QT before June and at a greater size than expected, we would no longer be willing to hold [risk] assets as that would cause an end to any risk premium contraction possibilities.”

Positioning: According to Morgan Stanley’s (NYSE: MS) trade desk, institutions (e.g., volatility targeting funds and trend following commodity-trading advisers) dumped nearly $200 billion in global equities over the first two months of 2022. 

Hedge funds’ net leverage, too, “fell 7.5 percentage points over the two weeks through March 11, the largest decrease over any comparable period since at least January 2016,” according to Goldman Sachs Group Inc (NYSE: GS). 

“Institutional traders, major money managers, asset managers, and hedge funds, their moves have to do with the current market conditions — a lot of volatility, a lot of uncertainty, inflation concerns, geopolitical concerns,” says Bloomberg’s Jackson Gutenplan. 

“As the market continues to downtrend, institutions selling out of positions are overwhelming any retail buying pressure.”

Given this, as mentioned in the prior fundamentals section, strategists like JPM’s Kolanovic suggest these are some of the reasons to boost risk. 

“Current risk positioning is very light. This is a result of high and persistent volatility, and risk aversion caused by global geopolitical developments,” Kolanovic says. “And for this reason, risks are skewed to the upside.”

And so, alongside the buying of futures and stock to offset the decay of counterparty positive delta (post-FOMC and through OPEX), retail investor buying remained undeterred last week.

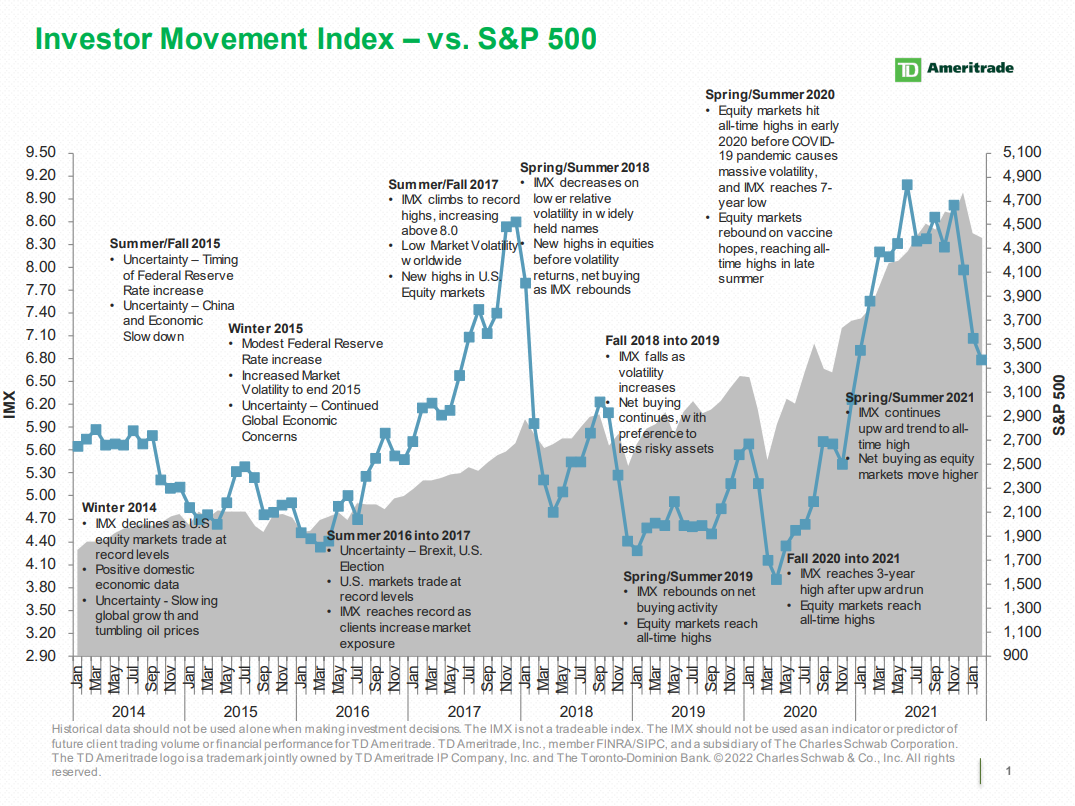
But, as Zephyr’s Ryan Nauman says, “even though retail has gained a lot of momentum over the past two years, institutional money still outweighs the retail money, and it’s still going to move markets.”

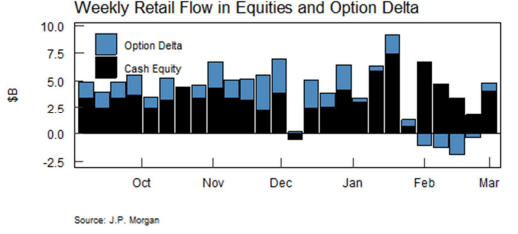
Graphic: Via TD Ameritrade. Taken from Bloomberg. “There’s a little bit of what I think is a retrenchment going on, where they weren’t just buying everything across the board,” Shawn Cruz, senior market strategist at TD Ameritrade Inc said. “As much as there is some pulling back, and there’s a lot of volatility going on, you’re seeing some selling in the more highly valued areas and the buying is very targeted.”

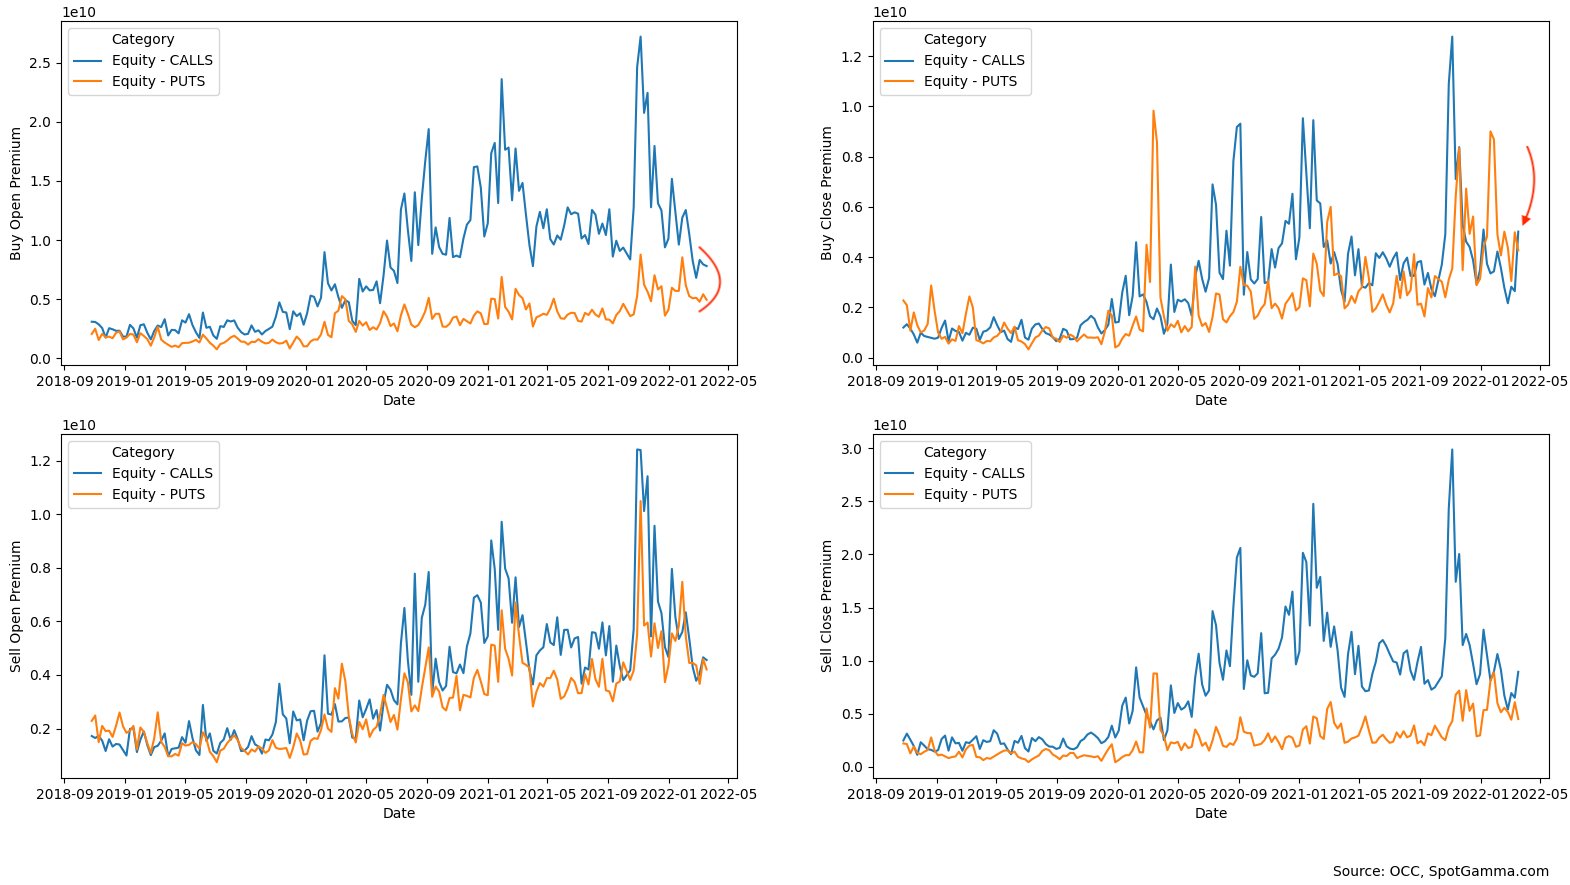
That is in the face of lackluster options activity. According to SpotGamma, call-buying, a feature of sustained bull markets “was at lows going back to 2020,” last week. 

Graphic: Via SpotGamma. “Here’s options data from the OCC. These plots show the premium per trade aggregated each week, with calls in blue and puts in orange. This is only customer flow (i.e. retail, hedge funds). Starting with equities, call buying this past week was at LOWS going back to ’20 (top right).”

Maybe you get to an extreme bearishness, and that’s usually where you bottom out,” adds Liz Young of SoFi Technologies Inc (NASDAQ: SOFI) in a statement on mom-and-pop investors eventually following institutional selling trends.

As this commentary has said before, a way to participate in the upside (while lowering debit risk) is through complex options structures, such as the ratio spread. Note, ratio spreads may carry margin risk, depending on the structure, resulting in undefined losses, potentially.

Graphic: Via Banco Santander SA (NYSE: SAN) research, the return profile, at expiry, of a classic 1×2 (long 1, short 2 further away) ratio spread.

Technical: As of 6:30 AM ET, Monday’s regular session (9:30 AM – 4:00 PM ET), in the S&P 500, will likely open in the middle part of a negatively skewed overnight inventory, inside of prior-range and -value, suggesting a limited potential for immediate directional opportunity.

In the best case, the S&P 500 trades higher; activity above the $4,438.25 high volume area (HVNode) puts in play the $4,466.00 regular trade high (RTH High). Initiative trade beyond the RTH High could reach as high as the $4,499.00 untested point of control (VPOC) and $4,526.25 HVNode, or higher.

In the worst case, the S&P 500 trades lower; activity below the $4,438.25 HVNode puts in play the $4,409.00 VPOC. Initiative trade beyond the VPOC could reach as low as the $4,395.25 HVNode and $4,355.00 VPOC, or lower.

Considerations: Push-and-pull, as well as responsiveness near key-technical areas (that are discernable visually on a chart), suggests technically-driven traders with short time horizons are very active. 

Such traders often lack the wherewithal to defend retests and, additionally, the type of trade may be indicative of the other time frame participants waiting for more information to initiate trades.

Click here to load today’s key levels into the web-based TradingView charting platform. Note that all levels are derived using the 65-minute timeframe. New links are produced, daily.
Graphic: 65-minute profile chart of the Micro E-mini S&P 500 Futures.

Definitions

Volume Areas: A structurally sound market will build on areas of high volume (HVNodes). Should the market trend for long periods of time, it will lack sound structure, identified as low volume areas (LVNodes). LVNodes denote directional conviction and ought to offer support on any test. 

If participants were to auction and find acceptance into areas of prior low volume (LVNodes), then future discovery ought to be volatile and quick as participants look to HVNodes for favorable entry or exit.

POCs: POCs are valuable as they denote areas where two-sided trade was most prevalent in a prior day session. Participants will respond to future tests of value as they offer favorable entry and exit.

About

After years of self-education, strategy development, mentorship, and trial-and-error, Renato Leonard Capelj began trading full-time and founded Physik Invest to detail his methods, research, and performance in the markets.

Capelj also develops insights around impactful options market dynamics at SpotGamma and is a Benzinga reporter.

Some of his works include conversations with ARK Invest’s Catherine Wood, investors Kevin O’Leary and John Chambers, FTX’s Sam Bankman-Fried, Kai Volatility’s Cem Karsan, The Ambrus Group’s Kris Sidial, among many others.

Disclaimer

In no way should the materials herein be construed as advice. Derivatives carry a substantial risk of loss. All content is for informational purposes only.

Categories
Commentary

Daily Brief For March 10, 2022

Editor’s Note: The Daily Brief is a free glimpse into the prevailing fundamental and technical drivers of U.S. equity market products. Join the 200+ that read this report daily, below!

What Happened

Overnight, equity index futures auctioned lower practically negating the prior day’s advance. Per the news, Ukraine and Russia failed in their efforts to end the war.

Adding, similar to days prior, areas where there are key technical nuances served as supports and resistances. One may construe this as short-term traders’ dominance in the smaller time horizons while the other time frames are positioning for expansive moves (yet to happen).

To note, key metrics under the hood (SpotGamma’s HIRO, among other things) yesterday, further validated the status quo and short-covering.

Moreover, ahead is data on jobless claims and the consumer price index (8:30 AM ET). Later, participants get data on real domestic nonfinancial debt and wealth (1:00 PM ET), as well as the budget deficit (2:00 PM ET).

Graphic updated 6:40 AM ET. Sentiment Neutral if expected /ES open is inside of the prior day’s range. /ES levels are derived from the profile graphic at the bottom of the following section. Levels may have changed since initially quoted; click here for the latest levels. SqueezeMetrics Dark Pool Index (DIX) and Gamma (GEX) calculations are based on where the prior day’s reading falls with respect to the MAX and MIN of all occurrences available. A higher DIX is bullish. At the same time, the lower the GEX, the more (expected) volatility. Learn the implications of volatility, direction, and moneyness. SHIFT data used for S&P 500 (INDEX: SPX) options activity. Note that options flow is sorted by the call premium spent; if more positive, then more was spent on call options. Breadth reflects a reading of the prior day’s NYSE Advance/Decline indicator. VIX reflects a current reading of the CBOE Volatility Index (INDEX: VIX) from 0-100.

What To Expect

Fundamental: The consumer price index (CPI) is to likely accelerate to 7.8% from a year ago.

This forecast varies widely, however, based on economic analysis with respect to the implications of Russia’s invasion of Ukraine and the sanction that resulted after.  

“There’s going to be a lot of noise in the next six months that’s going to be extremely difficult to disentangle,” said Omair Sharif of Inflation Insights LLC. 

“If you thought it was difficult to figure out what used car prices were doing and whether that was transitory, multiply that by a thousand.”

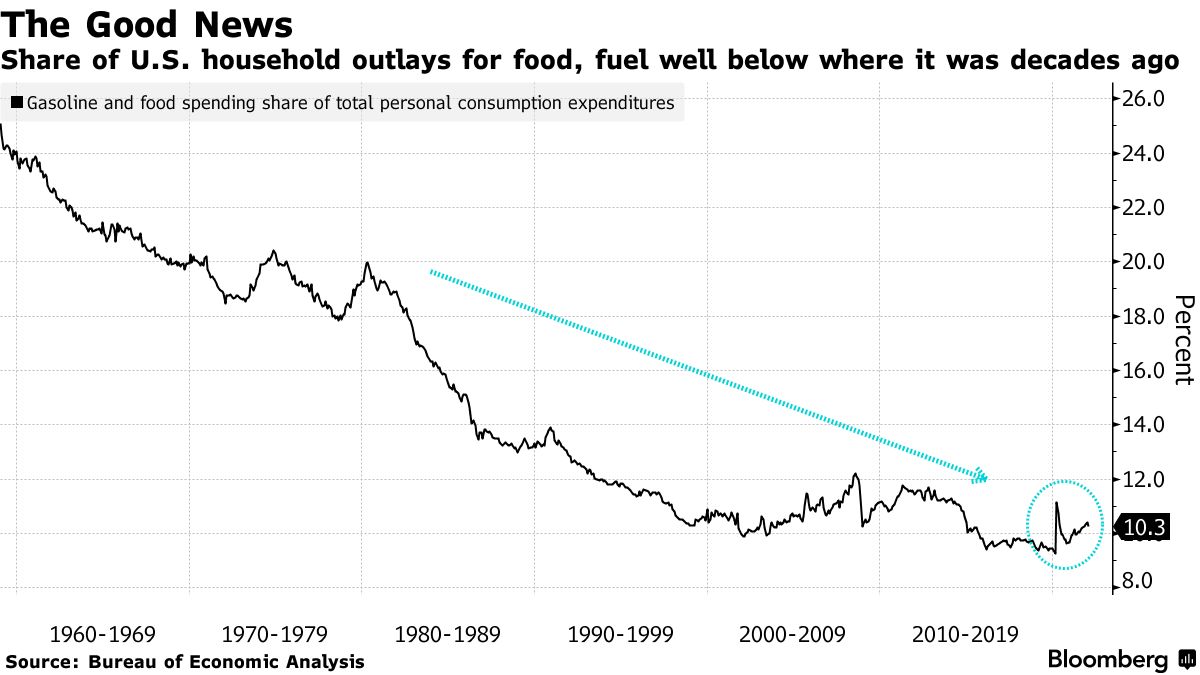
In a mention on energy market volatility, while today’s economy is less dependent on oil (i.e., less likely to kill the expansion), the action in that market (and the responses it may solicit from policymakers, later) is noteworthy.

Graphic: Via Bloomberg. “When families have to spend more money on necessities, they have less to spend on discretionary items and services. Economists at Barclays Plc expect the spike in energy prices to subtract an annualized 0.3 percentage point from consumption growth on average per quarter through the end of 2023.”

Despite a deterioration in the relationship between prices of crude and inflation, oil is “a major input in the economy – it is used in critical activities such as fueling transportation and heating homes – and if input costs rise, so should the cost of end products,” Investopedia says well.

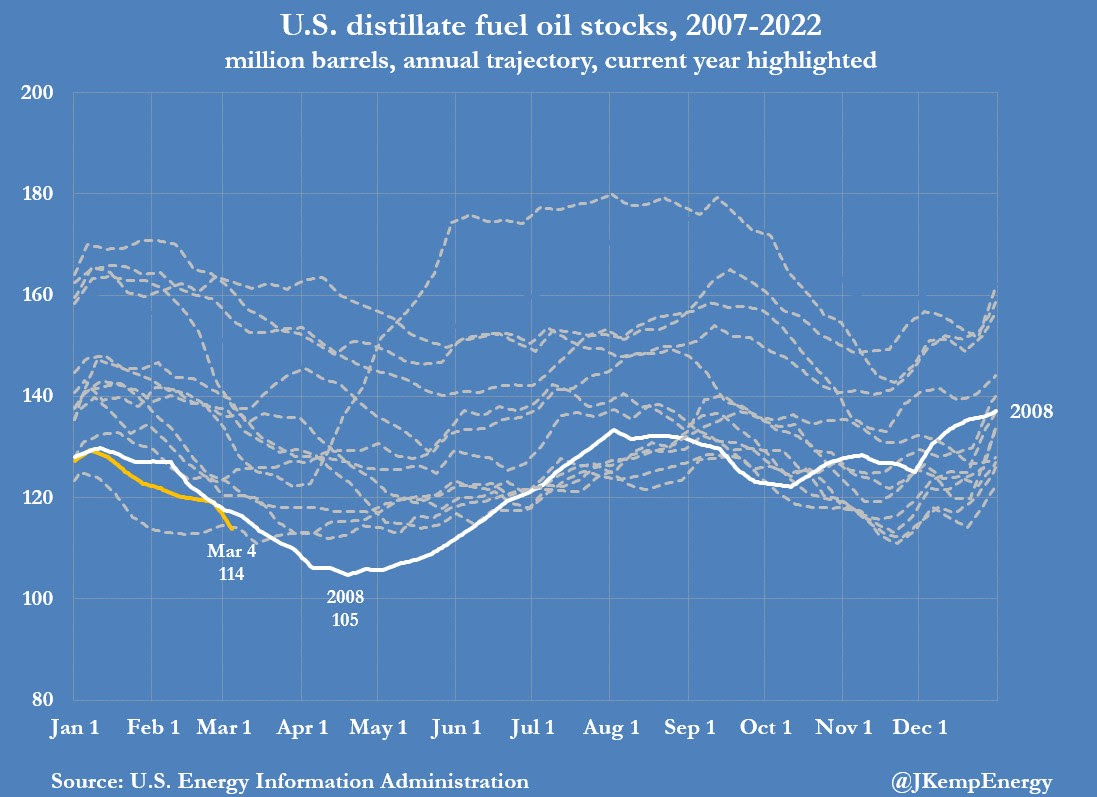
Further, according to Reuters’ John Kemp, fuel oil inventories fell last week to the lowest seasonal level in more than 15 years.

Graphic: Via John Kemp’s “Best in Energy” note. “Distillate stocks were already looking tight and are now on track to become exceptionally tight before mid-year. Distillate inventories are on course for an expected first-half low of 103 million barrels (with a range of 92-114 million).”

“Stocks are on track to hit an even lower seasonal level than 2008 when the distillate shortages helped propel crude oil prices to a record high at the middle of the year,” Kemp says.

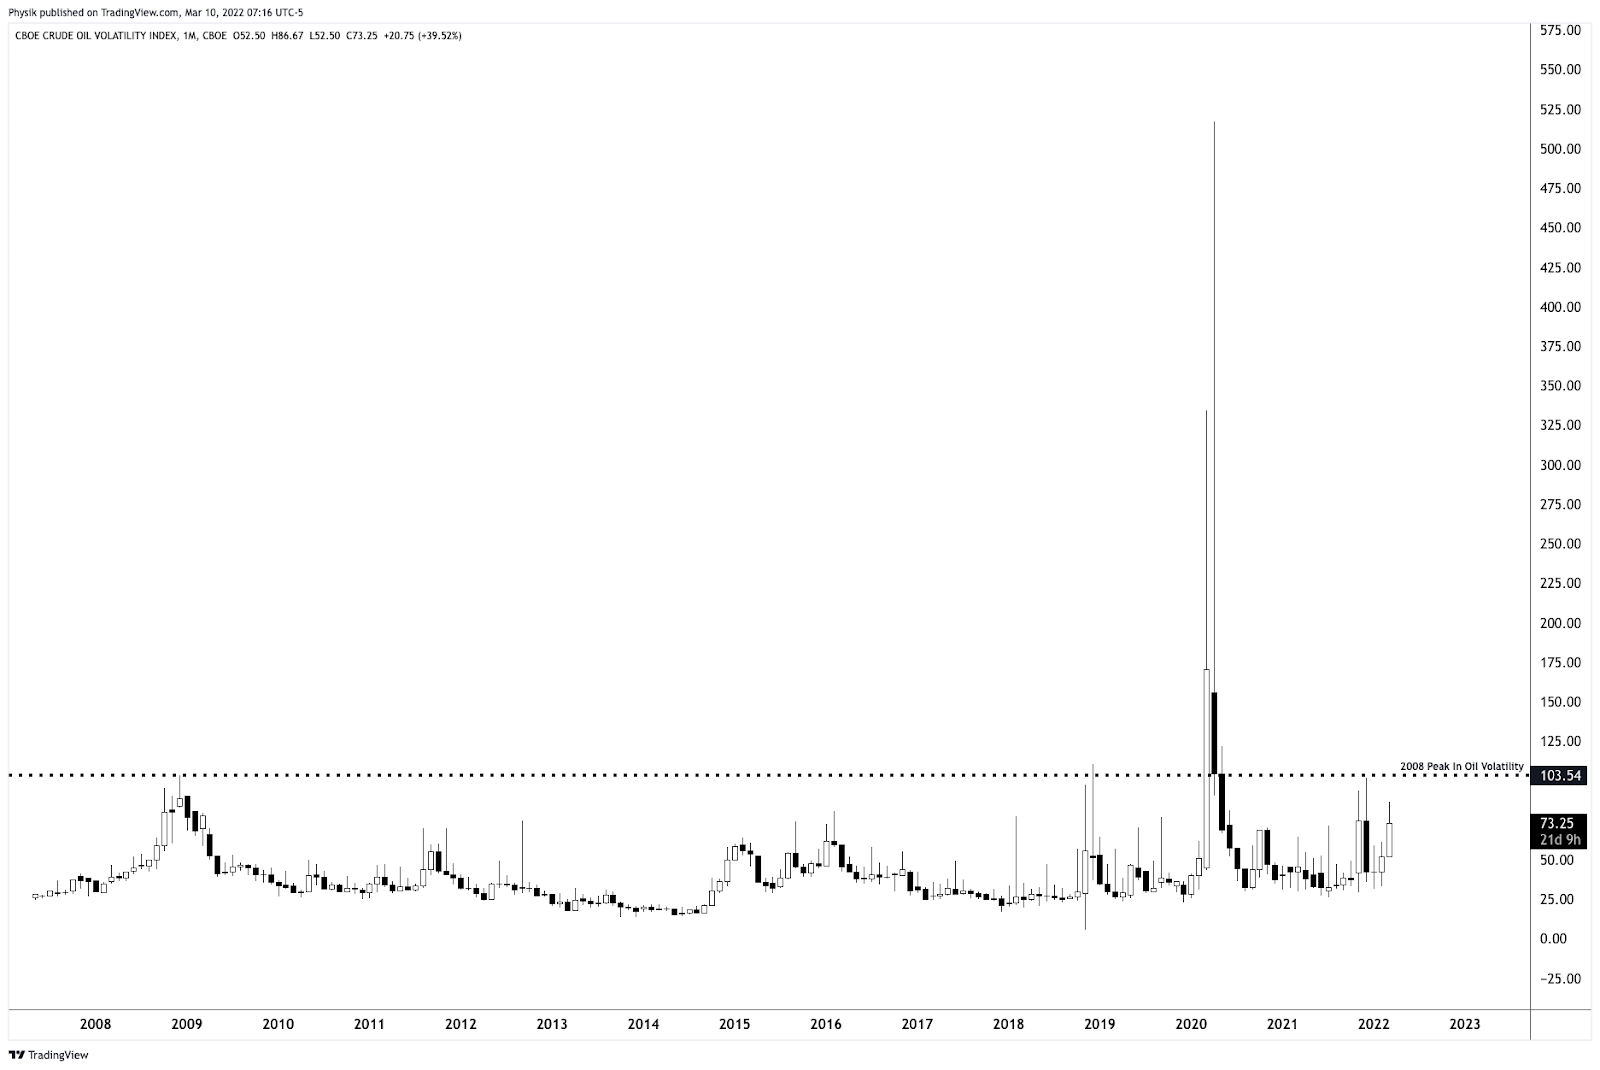
Graphic: Via Physik Invest. The CBOE Crude Oil Volatility Index (INDEX: OVX) reveals signs of peaking.

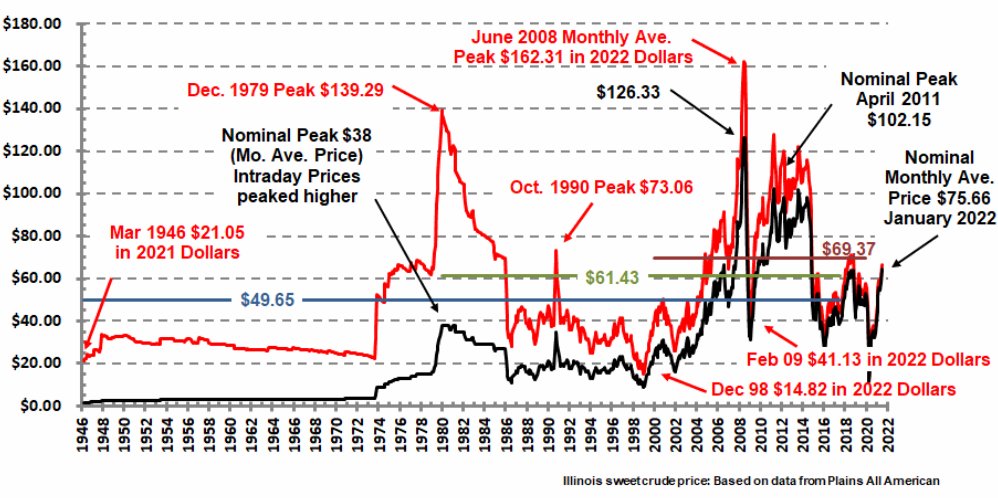
The highest oil prices ~$150/bbl had printed in 2008. As Alfonso Peccatiello of The Macro Compass hypothesizes, “Oil is denominated in fiat currency, and there has been A LOT of spendable money printing over the last 15 years. If you think the market gets as extreme as 2008, the equivalent oil price in today’s USD would be above $250/bbl.”

Given wage growth and the like, consumers likely start “to feel the heat way below $250.”

Graphic: Via Alfonso Peccatiello. “The red line shows the inflation-adjusted crude price: if you expect a proper tight oil environment, >$150-160 is your number. Also, anything above $120 in today’s prices and sustained for a few quarters would likely hit the demand side. 2013-2014 a good example, with the private sector turning defensive in 2015-2016 and China forced to ease big times to shore up the global economy.”

Why mention any of this? Fast moves higher in some of these commodity markets may impact end-consumer prices and behavior, quickly. In a bid to rein inflation – ”very high CPI in 2022, [and] still high in 2023 – central bankers will tighten. 

“The path of least resistance is for the Fed to hike rates from 0% to at least 2% relatively quickly,” Peccatiello explains in a recent post. 

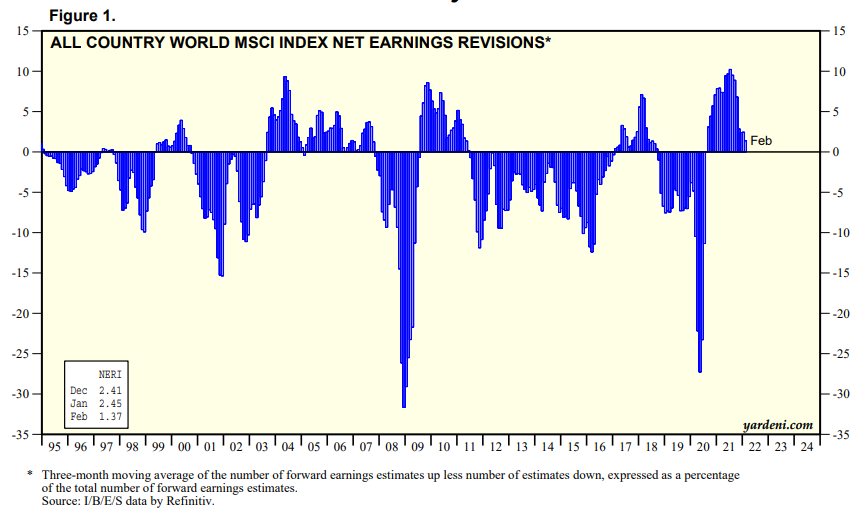
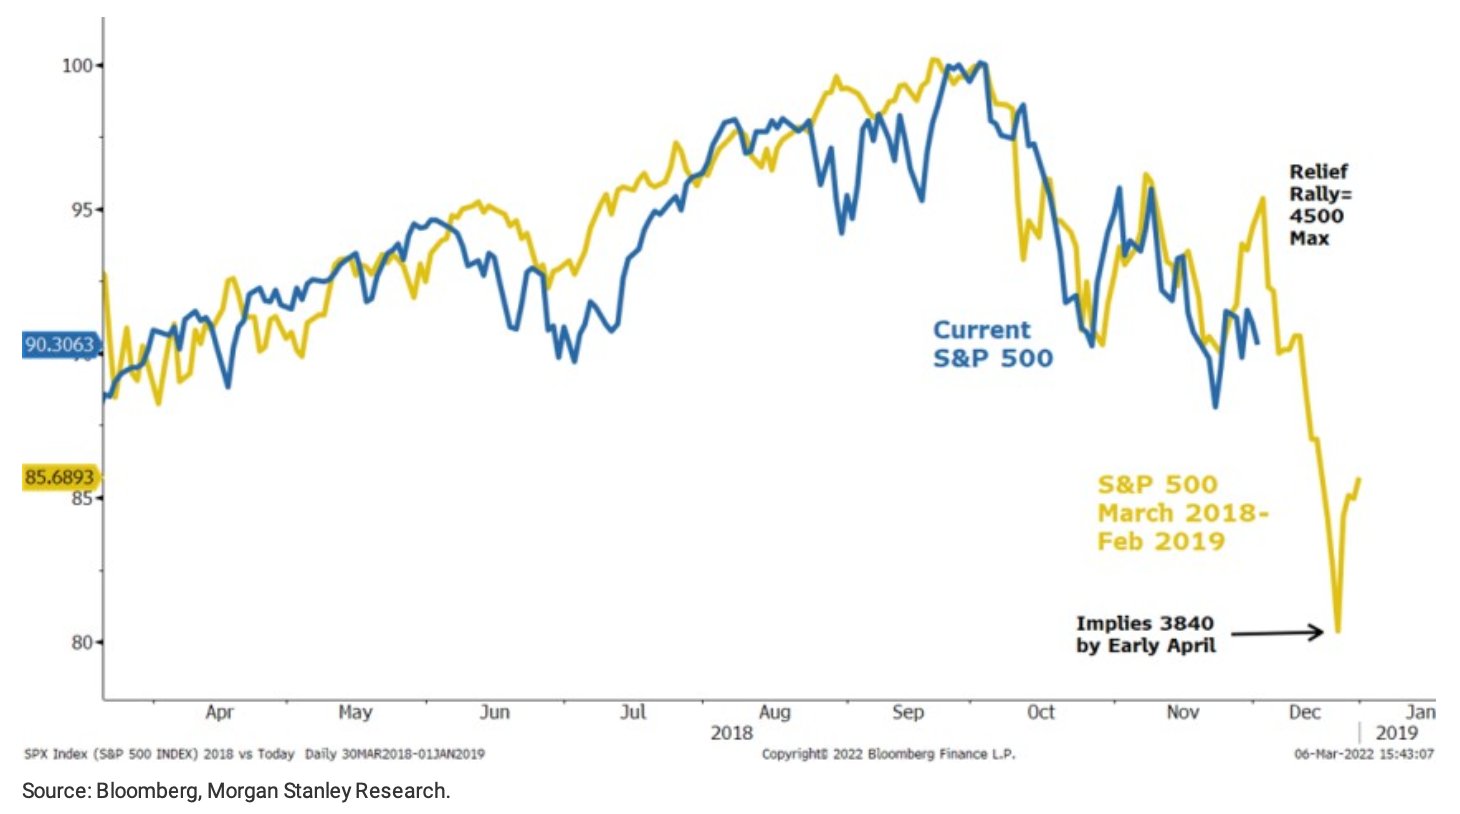
However, the “Last time companies were revising their forward earnings estimates down on a net basis while Central Banks were attempting to tighten monetary policy was mid-2018,” when the markets sold nearly 20%.

Graphic: Via Yardeni Research. Taken from The Macro Compass. “The chart above shows the 3-months average of the MSCI World net earnings revisions: essentially, this metric measures the difference between the number of companies revisiting their forward earnings estimate up versus down.”

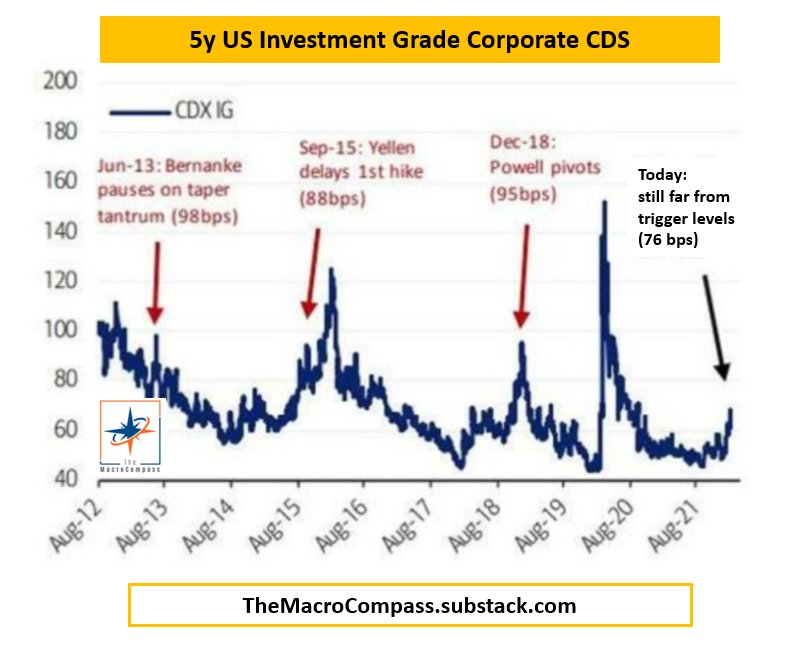
With financial conditions tightening, Peccatiello posits the Fed will be receptive to that.

Graphic: Via The Macro Compass. “Credit-default swaps on 5-year US Investment Grade Corporate Bonds are trading at 76 bps at the time of writing: Fed puts (or pivots) became more visible in the past when this measure of credit spreads approached 100 bps.”

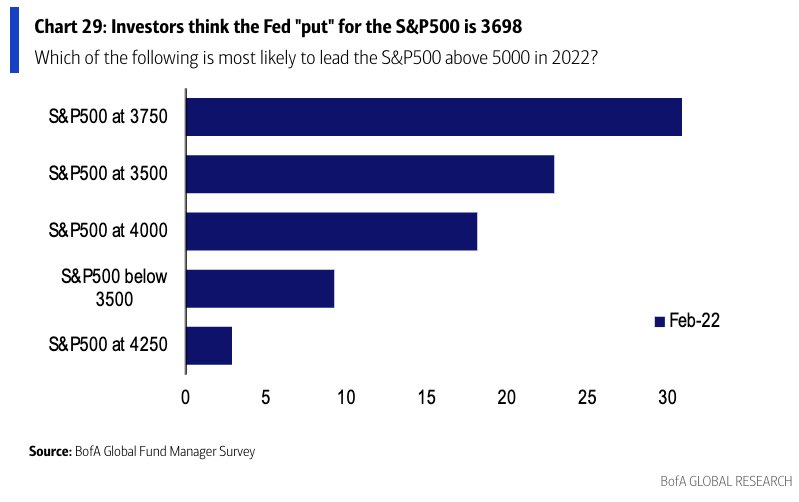
Basically, if selling were to continue, the Fed would reassess tightening. At such level of reassessment is the Fed Put, a dynamic we’ve discussed in the past.

Graphic: Via Bank of America Corporation (NYSE: BAC). Retrieved from Callum Thomas.

Chamath Palihapitiya recently posted about this, too. He said: “In 2018, the Fed was concerned about inflation. They were wrong and within a quarter or so, the risk shifted to recession. This chart shows how the equity markets reacted… seems eerily similar.”

“Value then faded and Growth ripped.”

Graphic: Via Morgan Stanley (NYSE: MS).

Positioning: Based on a comparison of present options positioning and buying metrics, the returns distribution is skewed positive, albeit less so than before. 

Graphic: Via JPMorgan, from Bloomberg.

Obviously, the fundamental picture and the market’s responsiveness to news events – given the negative gamma environment – has us discounting these metrics. It’s noteworthy, nonetheless.

For instance, in the face of some positive developments abroad, fundamentally, markets diverged from what participants in the options complex were doing.

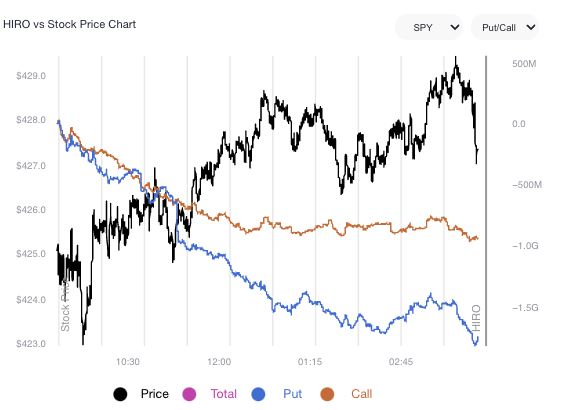
Graphic: SpotGamma’s Hedging Impact of Real-Time Options (HIRO) indicator reveals strong put buying and call selling (a bearish negative delta trade) in the context of Wednesday’s rise.

This divergence resolved itself, some, overnight in the broader market (even in the face of a ~7% price rise of Amazon Inc (NASDAQ: AMZN) large index constituent).

I’d be remiss if I did not point out growing bets on drops in the equity market’s pricing of risk (via the CBOE Volatility Index [INDEX: VIXI]). That would occur if indexes likely rebounded.

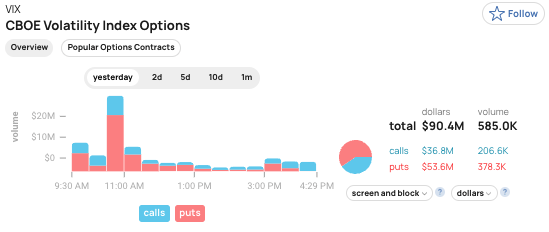
Graphic: Via SHIFT. There was heavy buying of the 26 VIX put.

Taken together, it’s difficult to get a grasp of where the market wants to head, in the near term. 

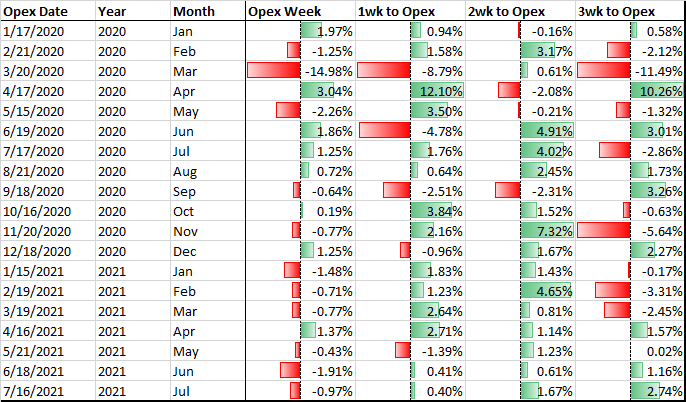
What is for certain: the compression of volatility (via passage of FOMC) or removal of counterparty negative exposure (via OPEX) may serve to alleviate some of this pressure. 

Until then, participants can expect the options landscape to add to market volatility.

Graphic: @pat_hennessy breaks down returns for the S&P 500, categorized by the week relative to OPEX. 

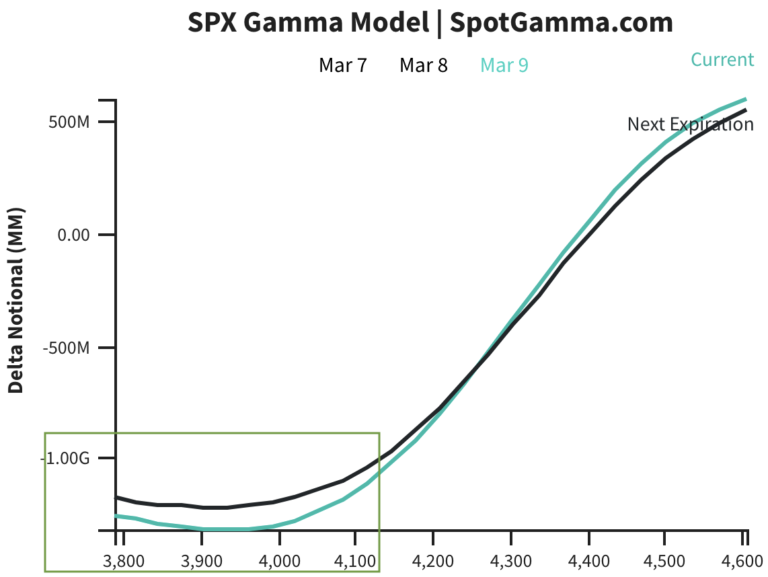
In case of lower prices, according to SpotGamma, the rate at which options counterparties increasingly add pressure on underlying SPX, so to speak, tapers off in the $4,100.00 to $4,000.00 area. Caution.

Graphic: Gamma profile flattens out near the $4,100-4,000 range suggesting less pressure and more counterparty support.

A way to take advantage of this volatility, while lowering the cost of bets, is options spreads. For instance, the Call Ratio (buy 1 call, sell 2 or more further out) can lower the cost of bets on the upside while providing exposure to asymmetric payouts.

Time and volatility are two factors, however, to be mindful of when initiating such spreads. Risk is undefined and if the time to expiry is too long (e.g., in excess of 1-2 weeks), fast moves and increases in volatility may result in large losses. 
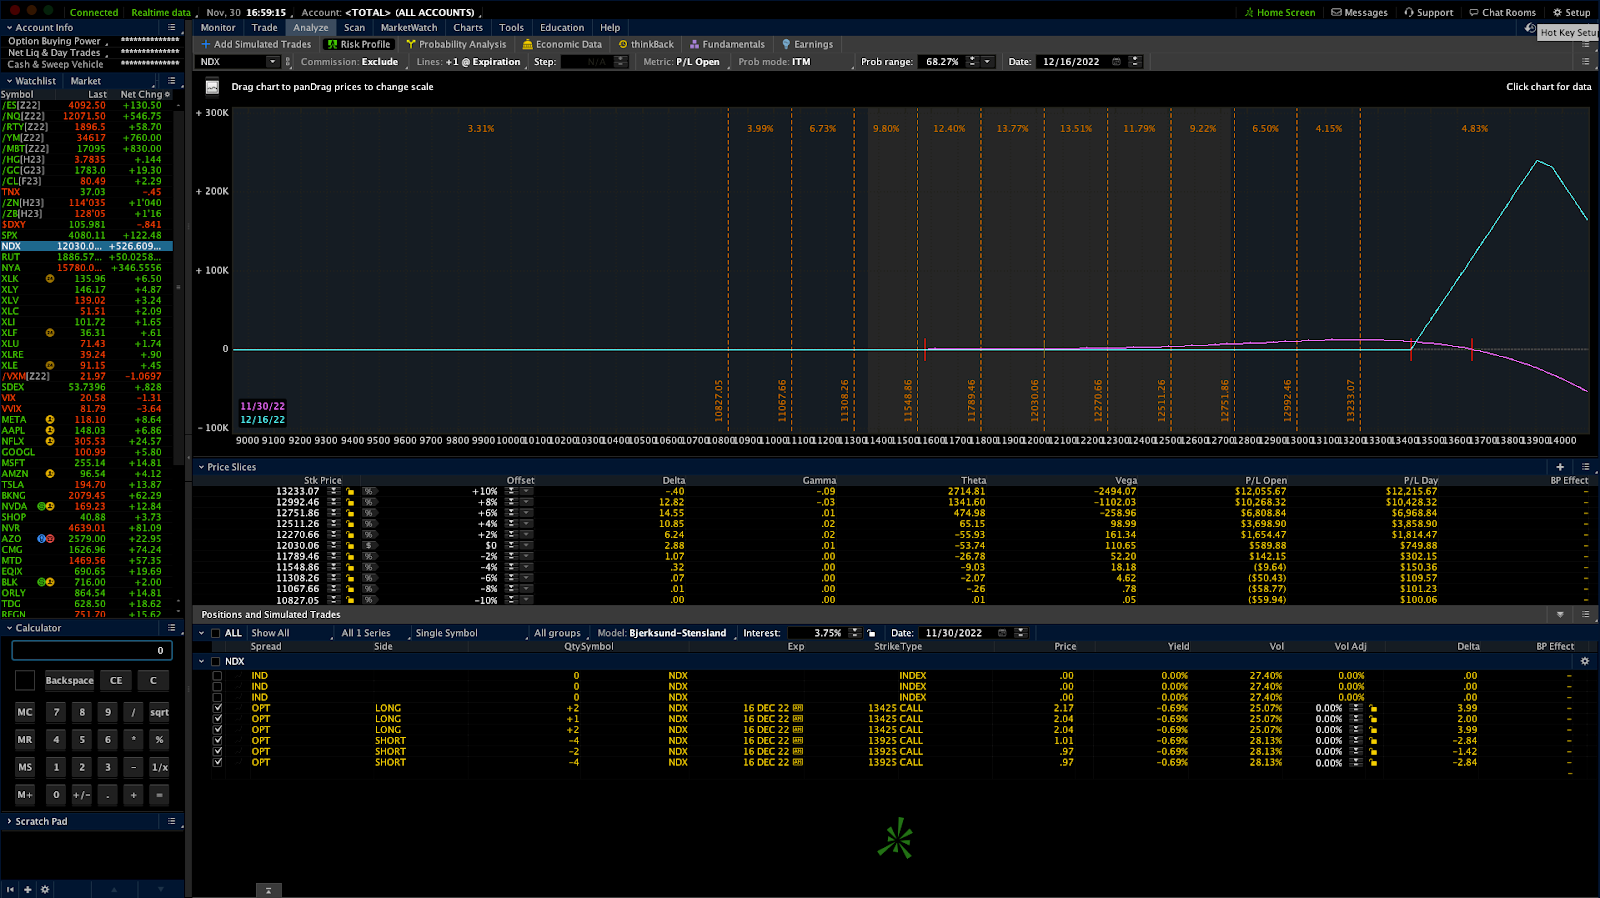
For that reason, also, one must be extremely careful with Put Ratio spreads. Consider adding protection far away from your short strikes to cap risk and turn the spreads into Butterflies.
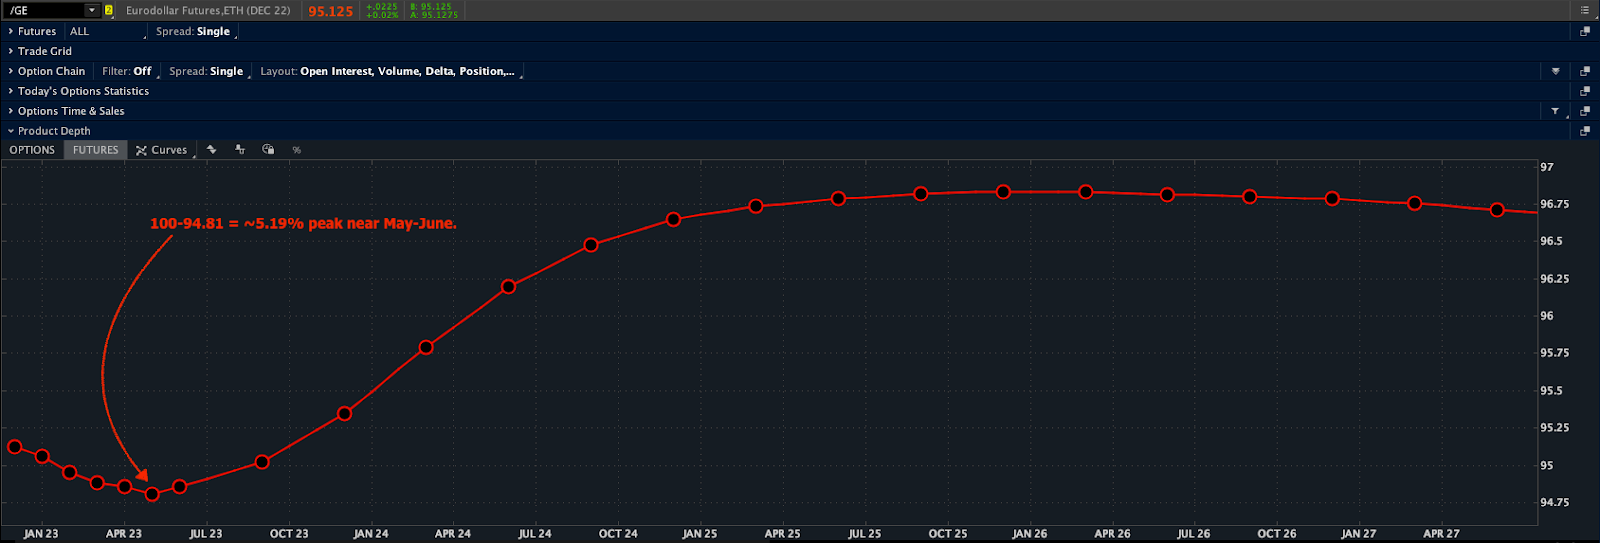
Graphic: Via Banco Santander SA (NYSE: SAN) research, the return profile, at expiry, of a classic 1×2 (long 1, short 2 further away) ratio spread.

Technical: As of 6:30 AM ET, Thursday’s regular session (9:30 AM – 4:00 PM ET), in the S&P 500, will likely open in the lower part of a negatively skewed overnight inventory, inside of prior-range and -value, suggesting a limited potential for immediate directional opportunity.

Gap Scenarios Potentially In Play: Gaps ought to fill quickly. Should they not, that’s a signal of strength; do not fade. Leaving value behind on a gap-fill or failing to fill a gap (i.e., remaining outside of the prior session’s range) is a go-with indicator.

Auctioning and spending at least 1-hour of trade back in the prior range suggests a lack of conviction; in such a case, do not follow the direction of the most recent initiative activity.

In the best case, the S&P 500 trades higher; activity above the $4,231.00 regular trade low (RTH Low) puts in play the $4,249.25 low volume area (LVNode). Initiative trade beyond the LVNode could reach as high as the $4,285.75 high volume area (HVNode) and $4,319.00 untested point of control (VPOC), or higher.

In the worst case, the S&P 500 trades lower; activity below the $4,231.00 RTH Low puts in play the $4,177.25 HVNode. Initiative trade beyond the HVNode could reach as low as the $4,138.75 and $4,101.25 overnight low (ONL), or lower.

Considerations: Push-and-pull, as well as responsiveness near key-technical areas (that are discernable visually on a chart), suggests technically-driven traders with short time horizons are very active. 

Such traders often lack the wherewithal to defend retests and, additionally, the type of trade may be indicative of the other time frame participants waiting for more information to initiate trades.
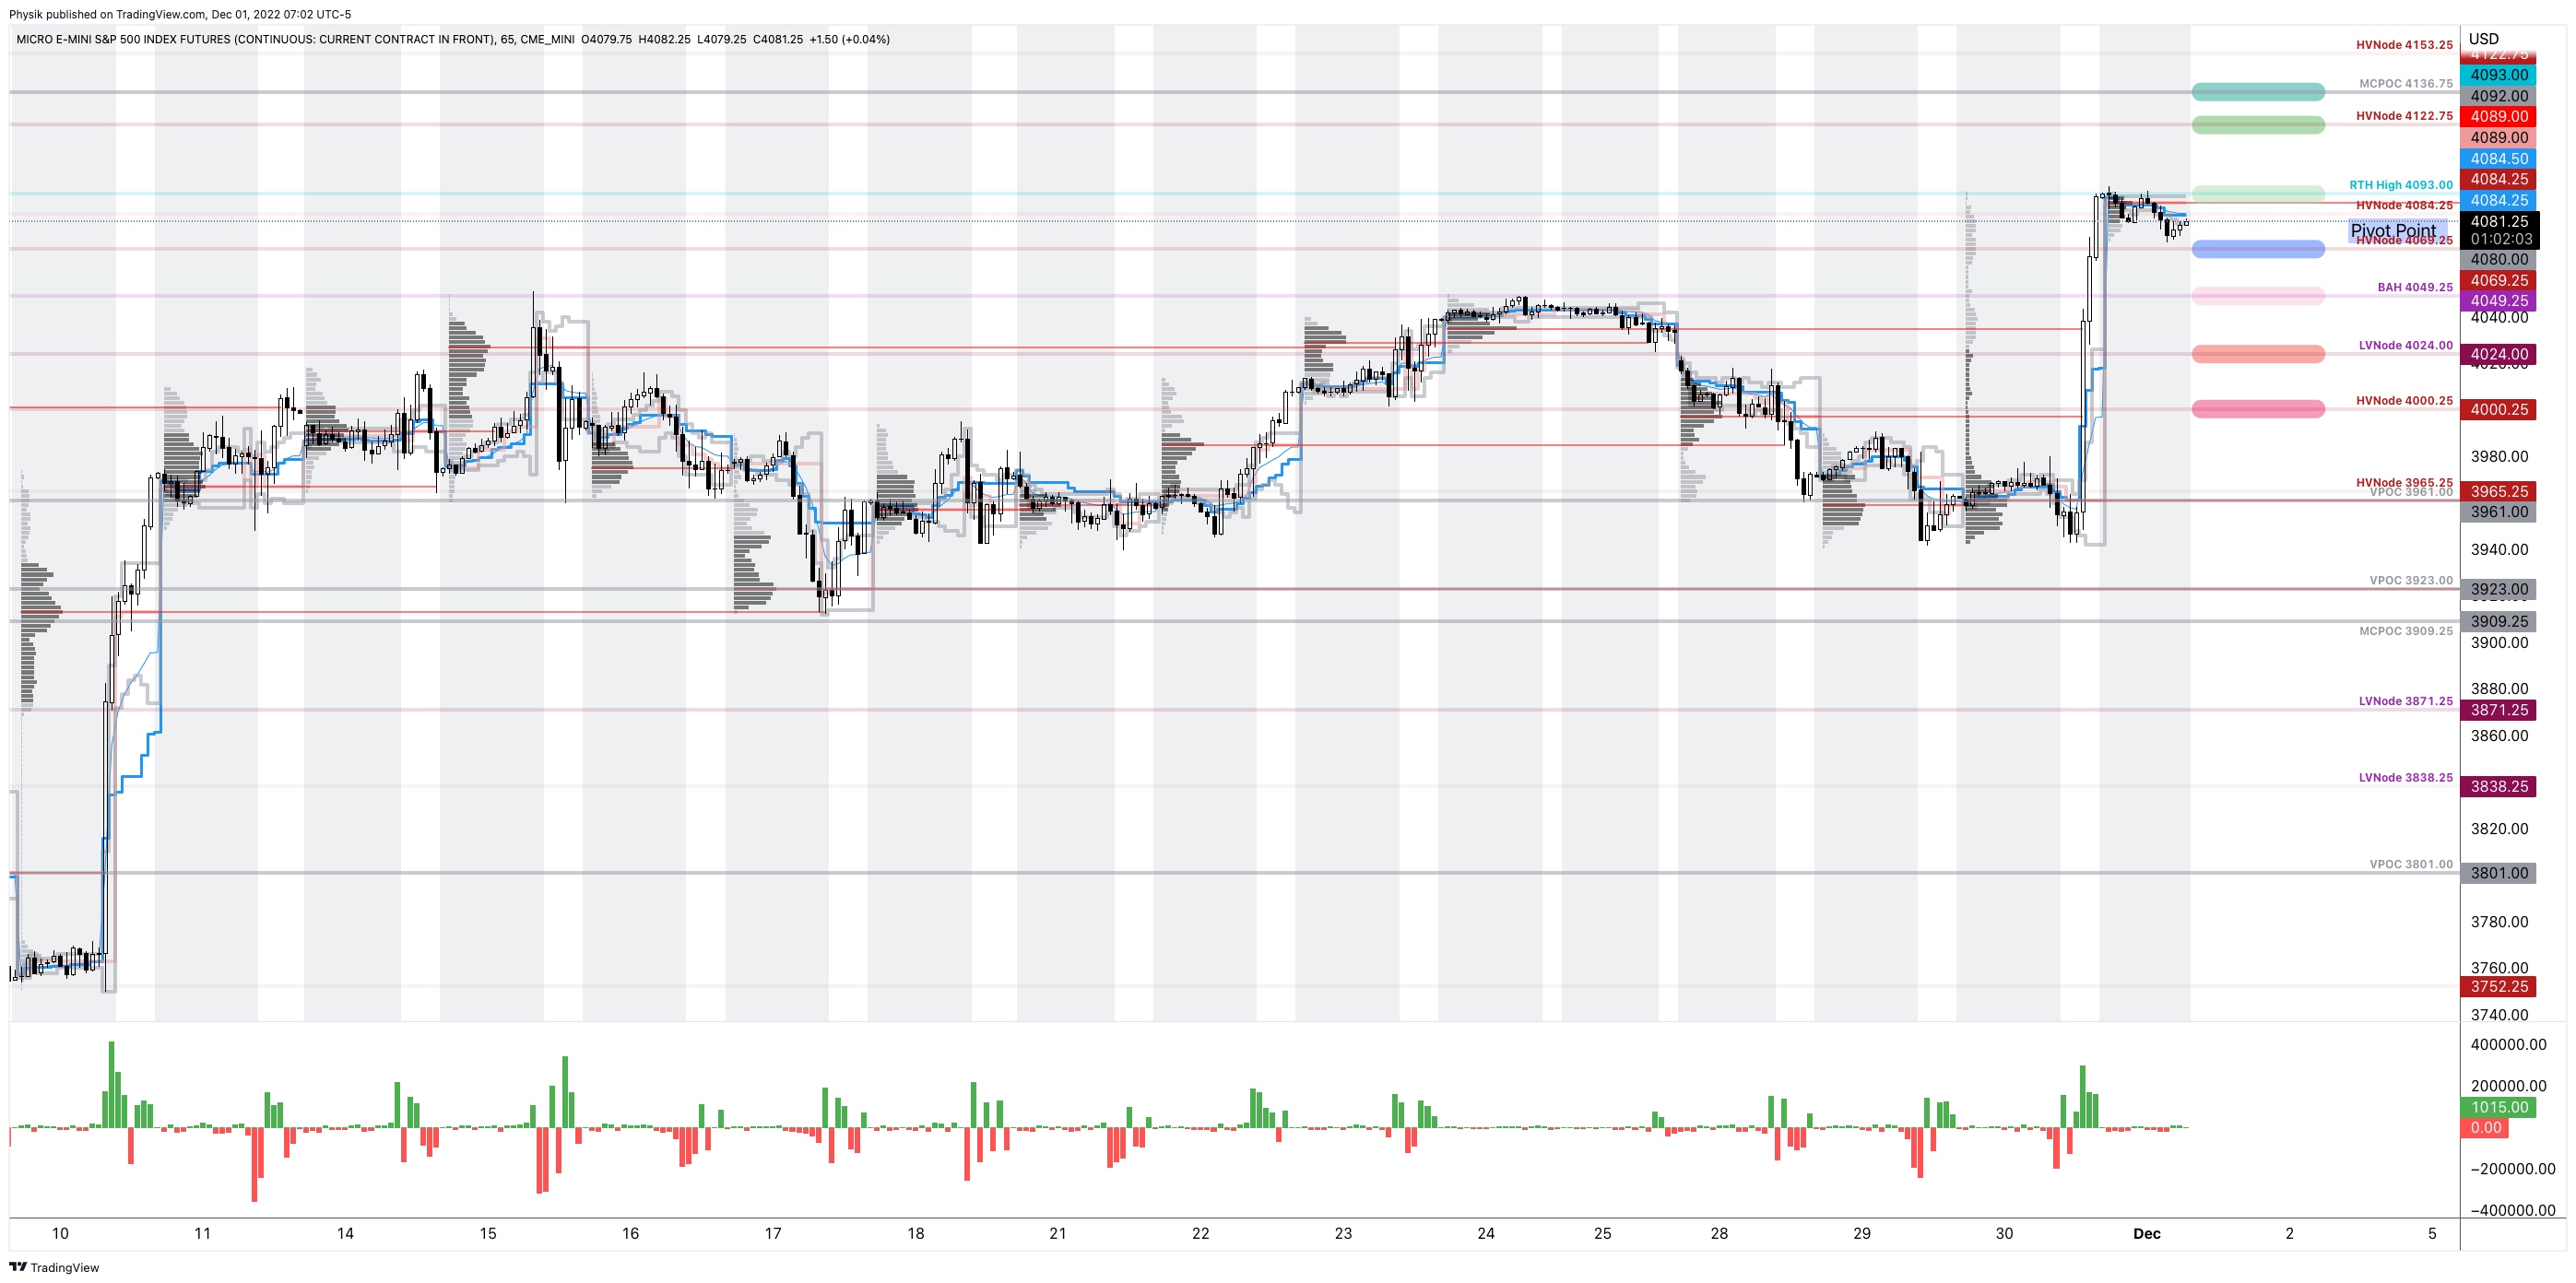
Click here to load today’s key levels into the web-based TradingView charting platform. Note that all levels are derived using the 65-minute timeframe. New links are produced, daily.
Graphic: 65-minute profile chart of the Micro E-mini S&P 500 Futures.

Definitions

Overnight Rally Highs (Lows): Typically, there is a low historical probability associated with overnight rally-highs (lows) ending the upside (downside) discovery process.

Volume Areas: A structurally sound market will build on areas of high volume (HVNodes). Should the market trend for long periods of time, it will lack sound structure, identified as low volume areas (LVNodes). LVNodes denote directional conviction and ought to offer support on any test. 

If participants were to auction and find acceptance into areas of prior low volume (LVNodes), then future discovery ought to be volatile and quick as participants look to HVNodes for favorable entry or exit.

POCs: POCs are valuable as they denote areas where two-sided trade was most prevalent in a prior day session. Participants will respond to future tests of value as they offer favorable entry and exit.

About

After years of self-education, strategy development, mentorship, and trial-and-error, Renato Leonard Capelj began trading full-time and founded Physik Invest to detail his methods, research, and performance in the markets.

Capelj is also a Benzinga finance and technology reporter interviewing the likes of Shark Tank’s Kevin O’Leary, JC2 Ventures’ John Chambers, FTX’s Sam Bankman-Fried, and ARK Invest’s Catherine Wood, as well as a SpotGamma contributor developing insights around impactful options market dynamics.

Disclaimer

Physik Invest does not carry the right to provide advice.

In no way should the materials herein be construed as advice. Derivatives carry a substantial risk of loss. All content is for informational purposes only.

Categories
Methodology

LIVE: How To Navigate Market Volatility

Today, Physik Invest’s Renato Leonard Capelj joined Benzinga’s Spencer Israel and Aaron Bry live.

Topics discussed include Capelj’s thoughts on the current market environment, as well as how he goes about structuring trades around his opinion.

Tune in, below!