Categories
Commentary

Daily Brief For November 3, 2021

Abstract

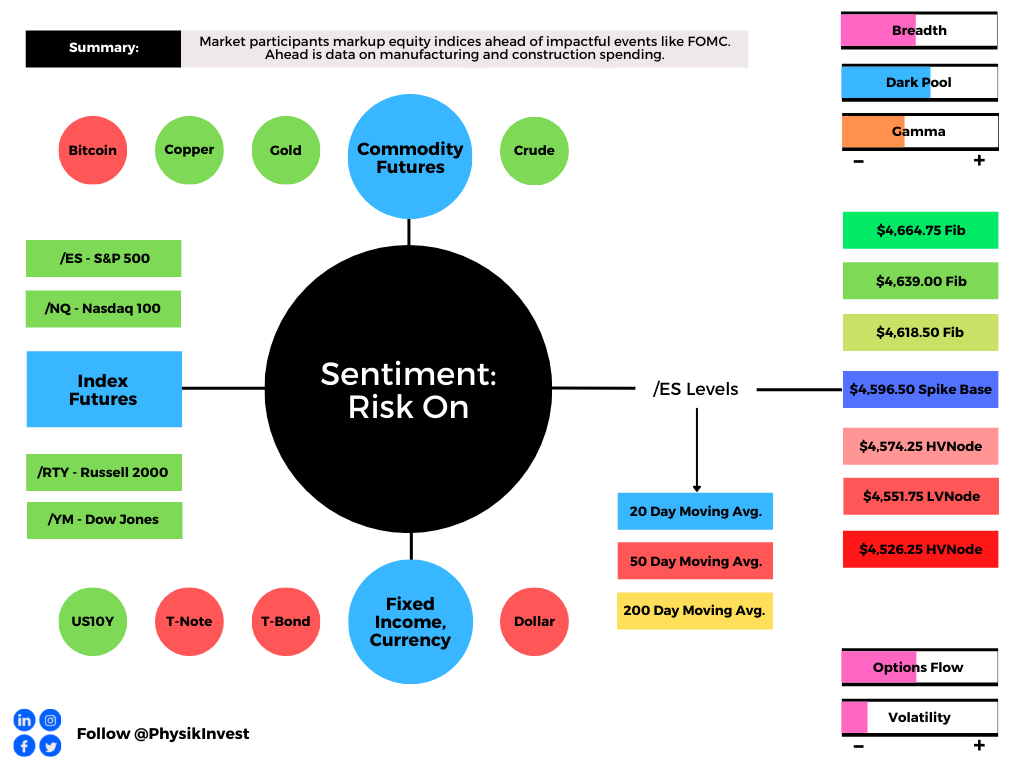
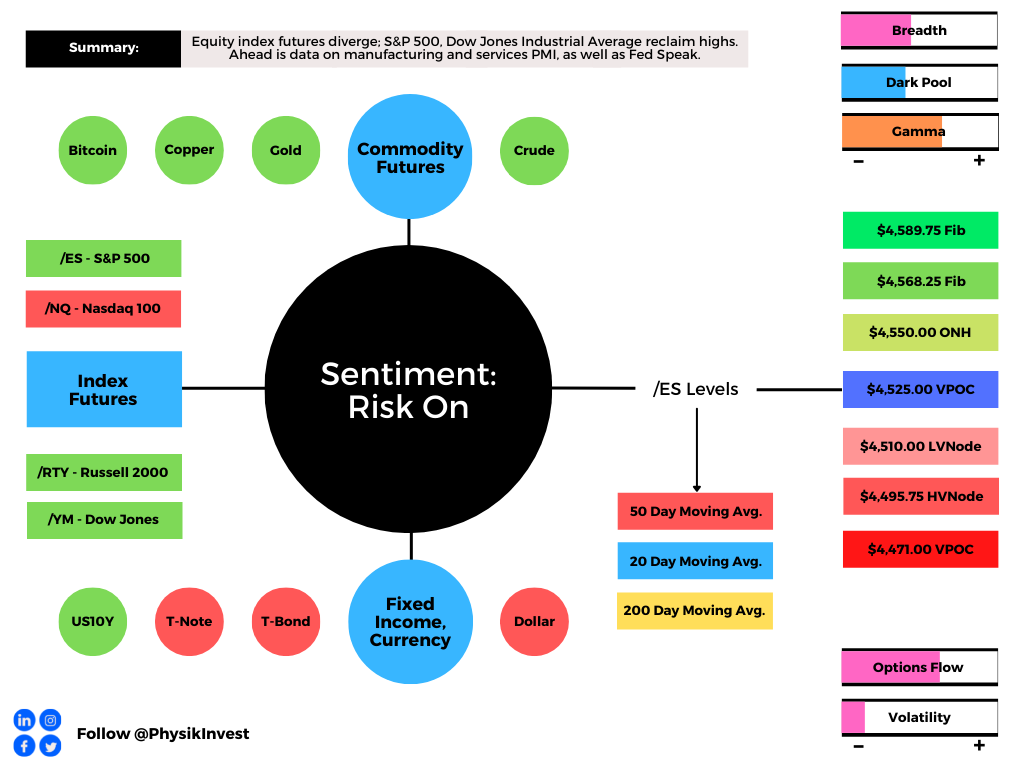
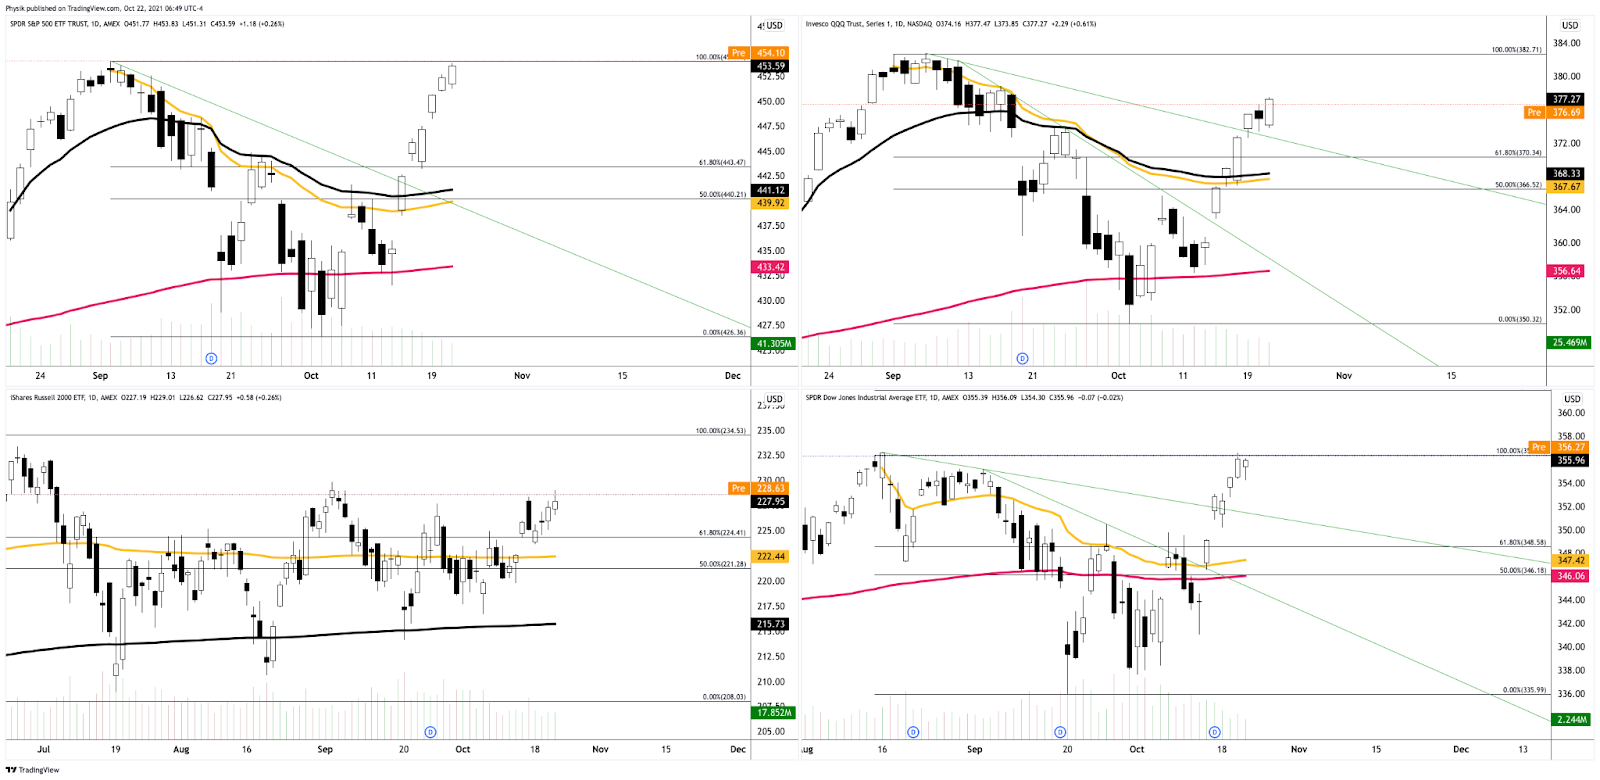
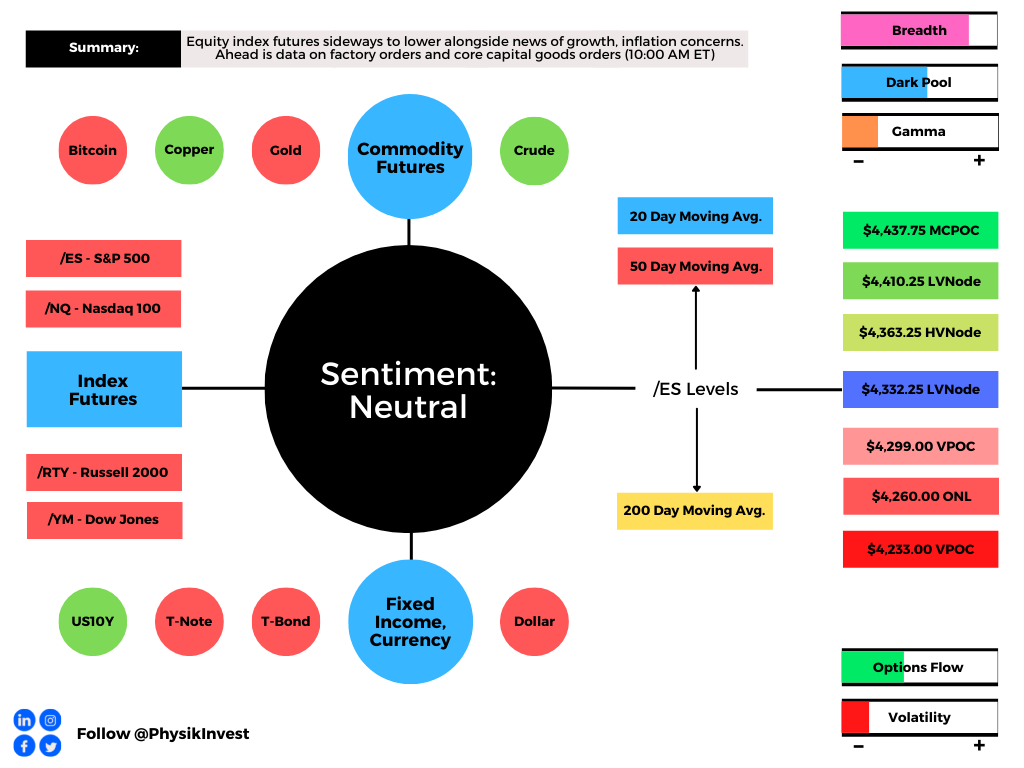
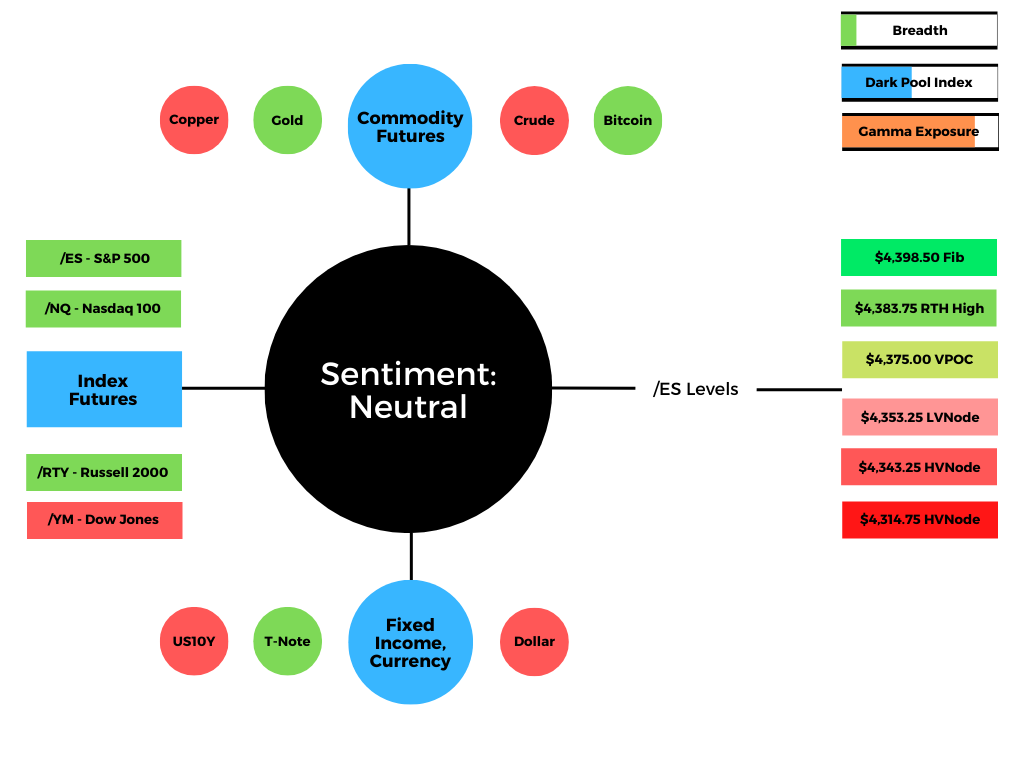
Equity index futures and commodities were mixed. Bonds sideways to higher. Volatility bid.

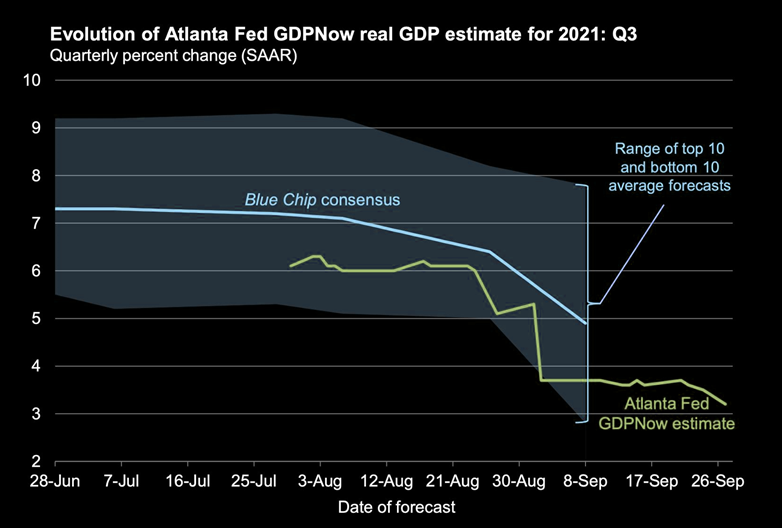
Ahead is a heavy day of economic releases, in the face of fundamental narratives and positioning metrics that may later support directional resolve.

What Happened

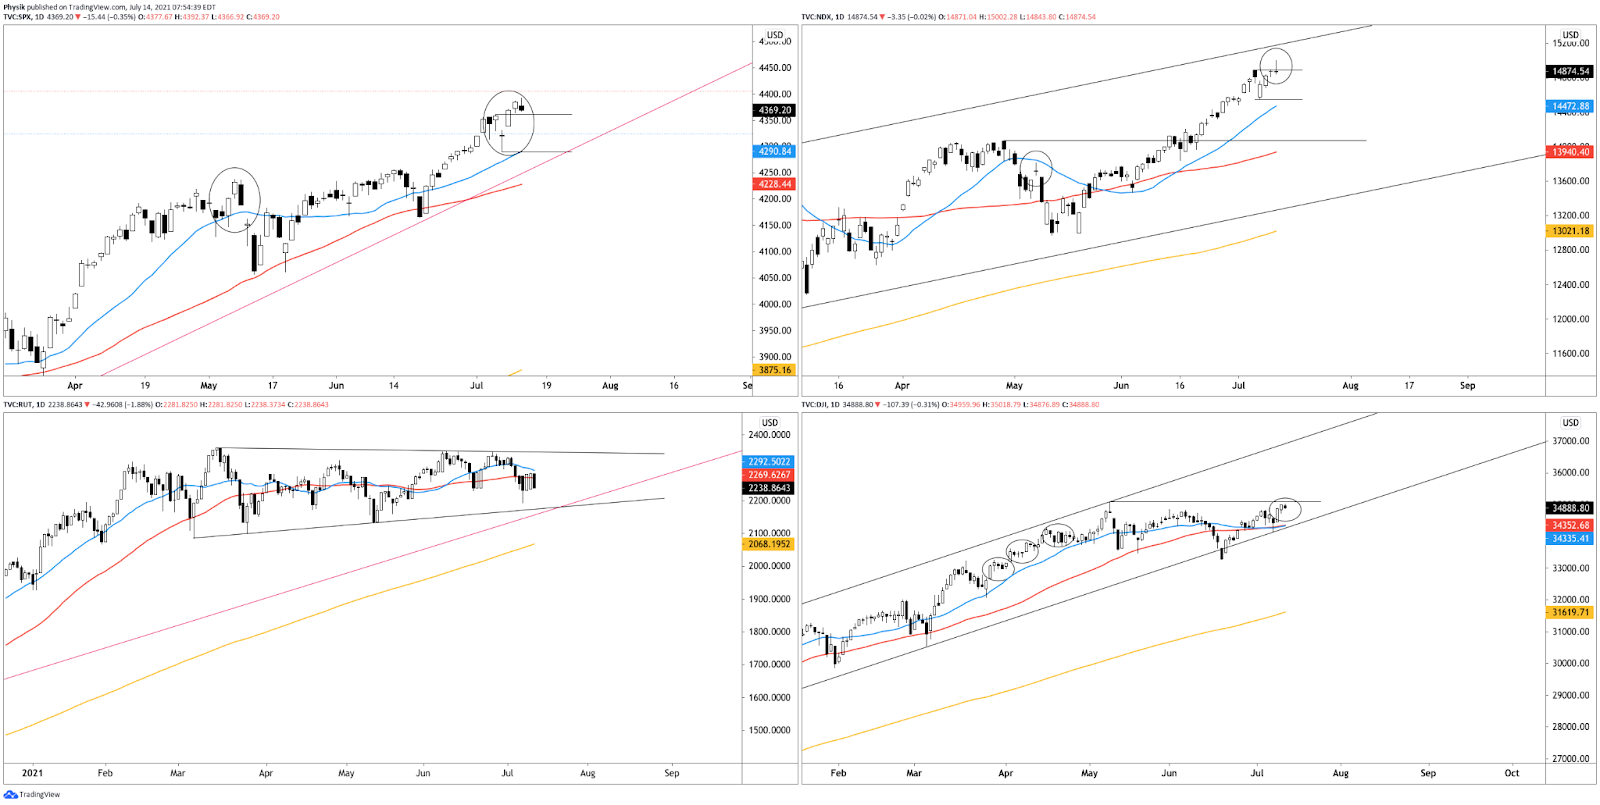
Overnight, equity index futures were flat as participants wait to initiate the next leg – higher or lower – until they are provided clarity on monetary policy frameworks, the pace of the economic recovery, and the like.

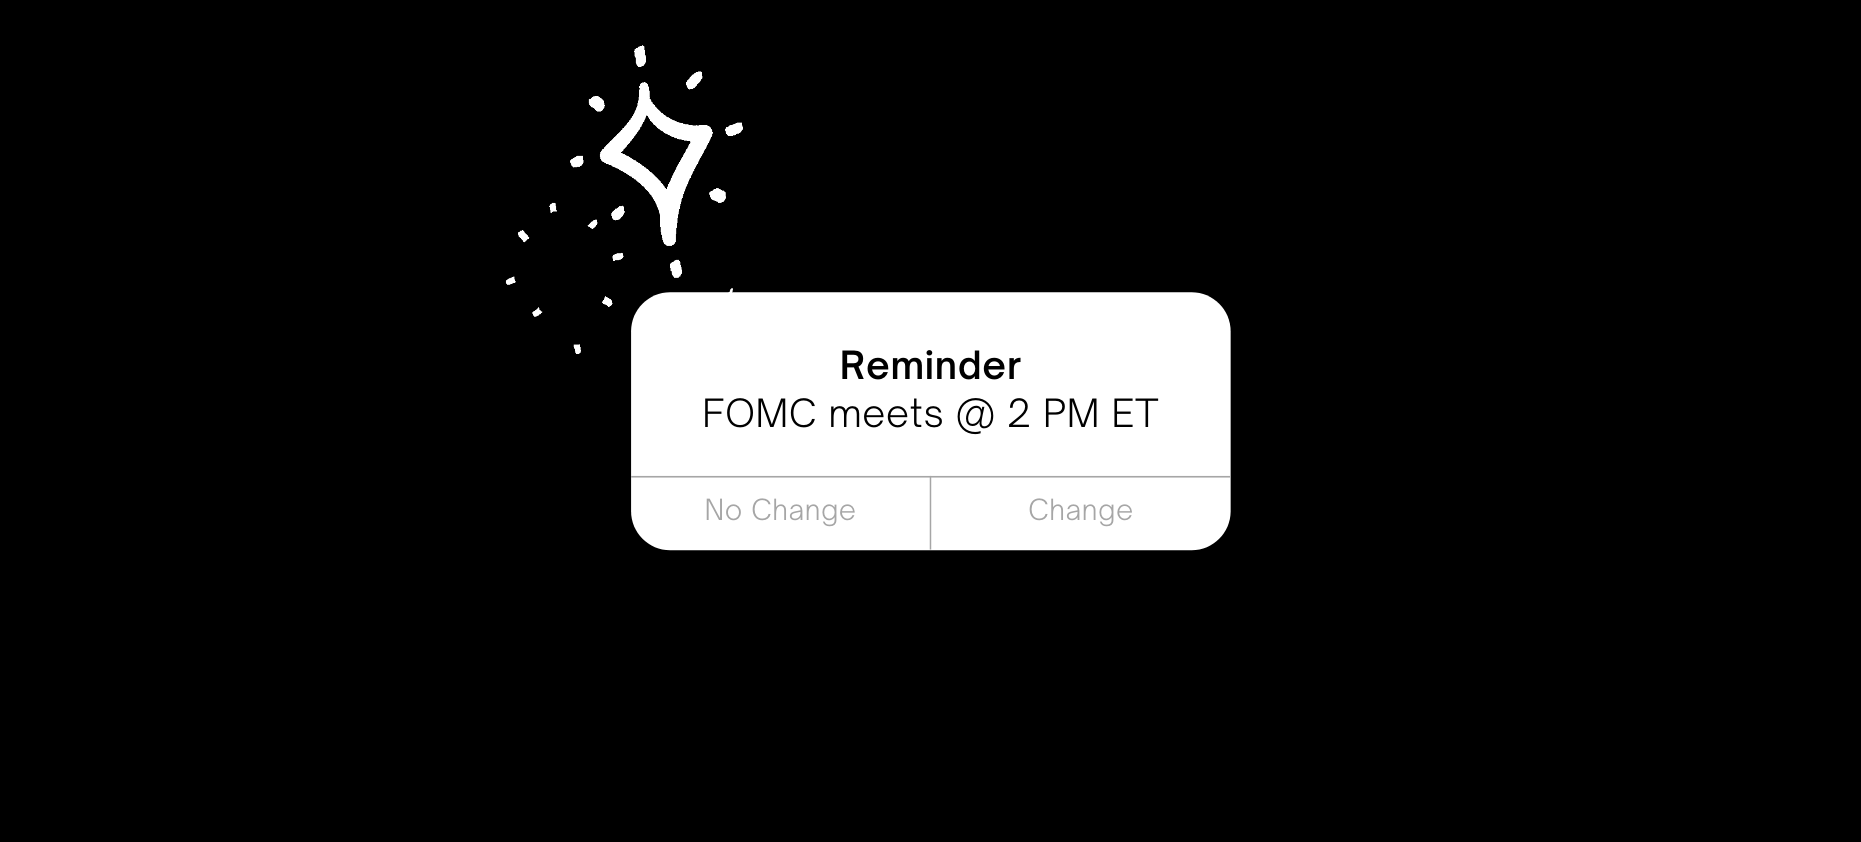
Ahead is ADP employment (8:15 AM ET), Markit services PMI (9:45 AM ET), ISM services index and factory orders (10:00 AM ET), as well as Federal Reserve statements (2:00 PM ET).

Graphic updated 6:30 AM ET. Sentiment Neutral if expected /ES open is inside of the prior day’s range. /ES levels are derived from the profile graphic at the bottom of the following section. Levels may have changed since initially quoted; click here for the latest levels. SqueezeMetrics Dark Pool Index (DIX) and Gamma (GEX) calculations are based on where the prior day’s reading falls with respect to the MAX and MIN of all occurrences available. A higher DIX is bullish. At the same time, the lower the GEX, the more (expected) volatility. Learn the implications of volatility, direction, and moneyness. SHIFT data used for S&P 500 (INDEX: SPX) options activity. Note that options flow is sorted by the call premium spent; if more positive then more was spent on call options. Breadth reflects a reading of the prior day’s NYSE Advance/Decline indicator. VIX reflects a current reading of the CBOE Volatility Index (INDEX: VIX) from 0-100.

What To Expect

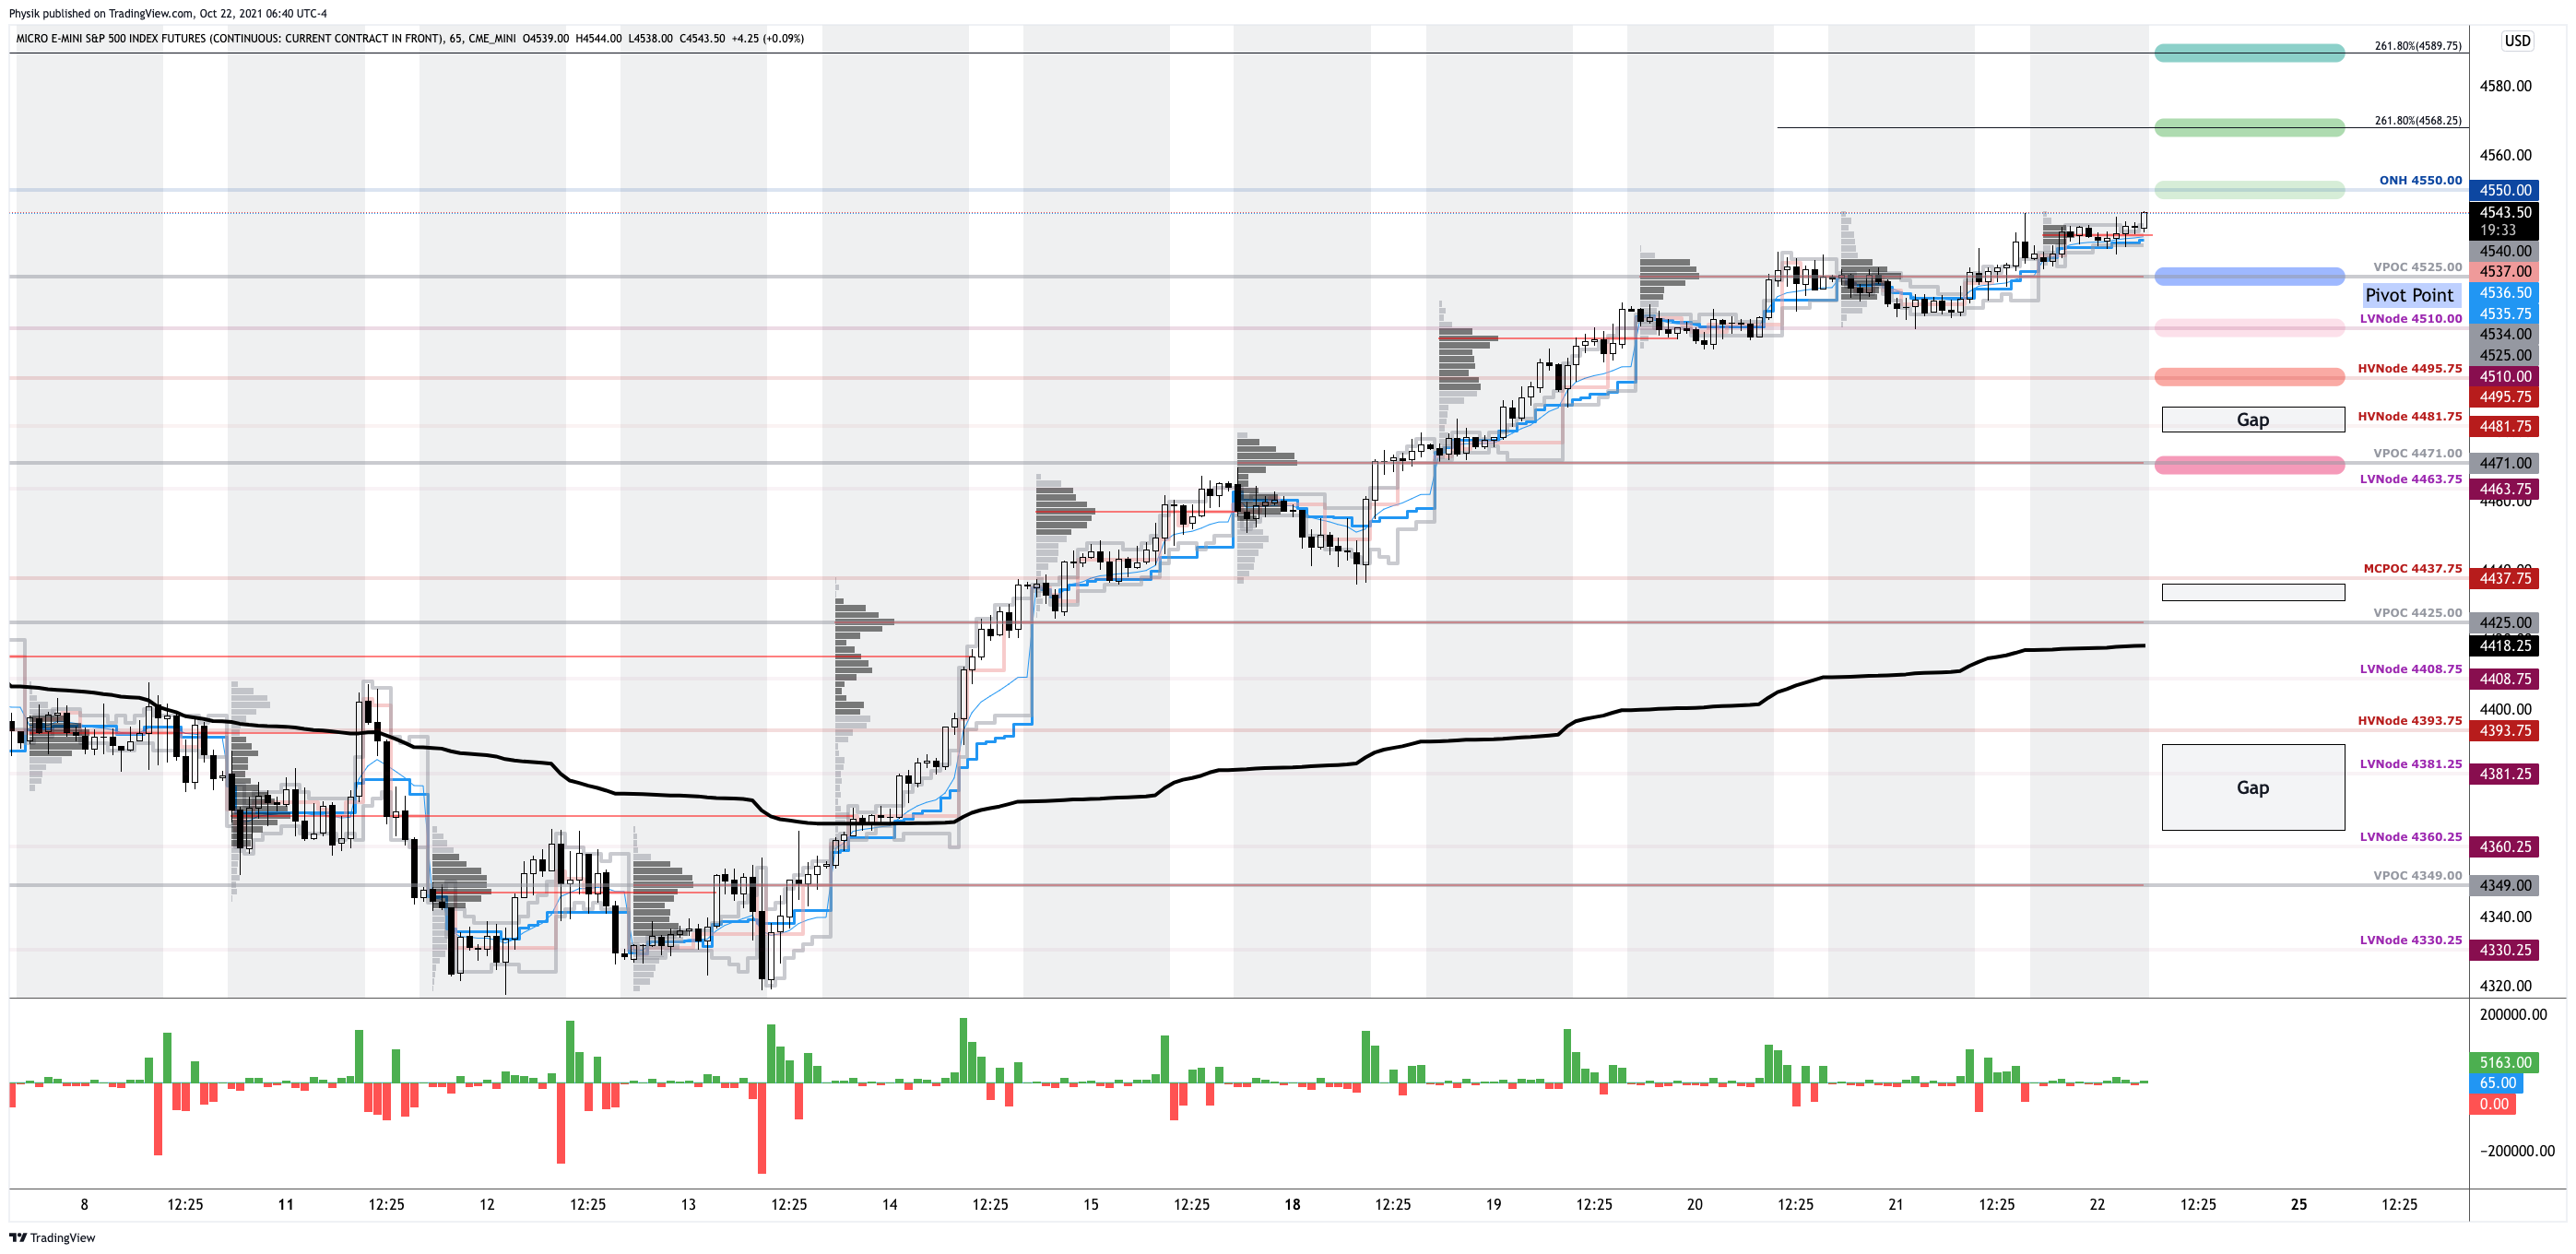
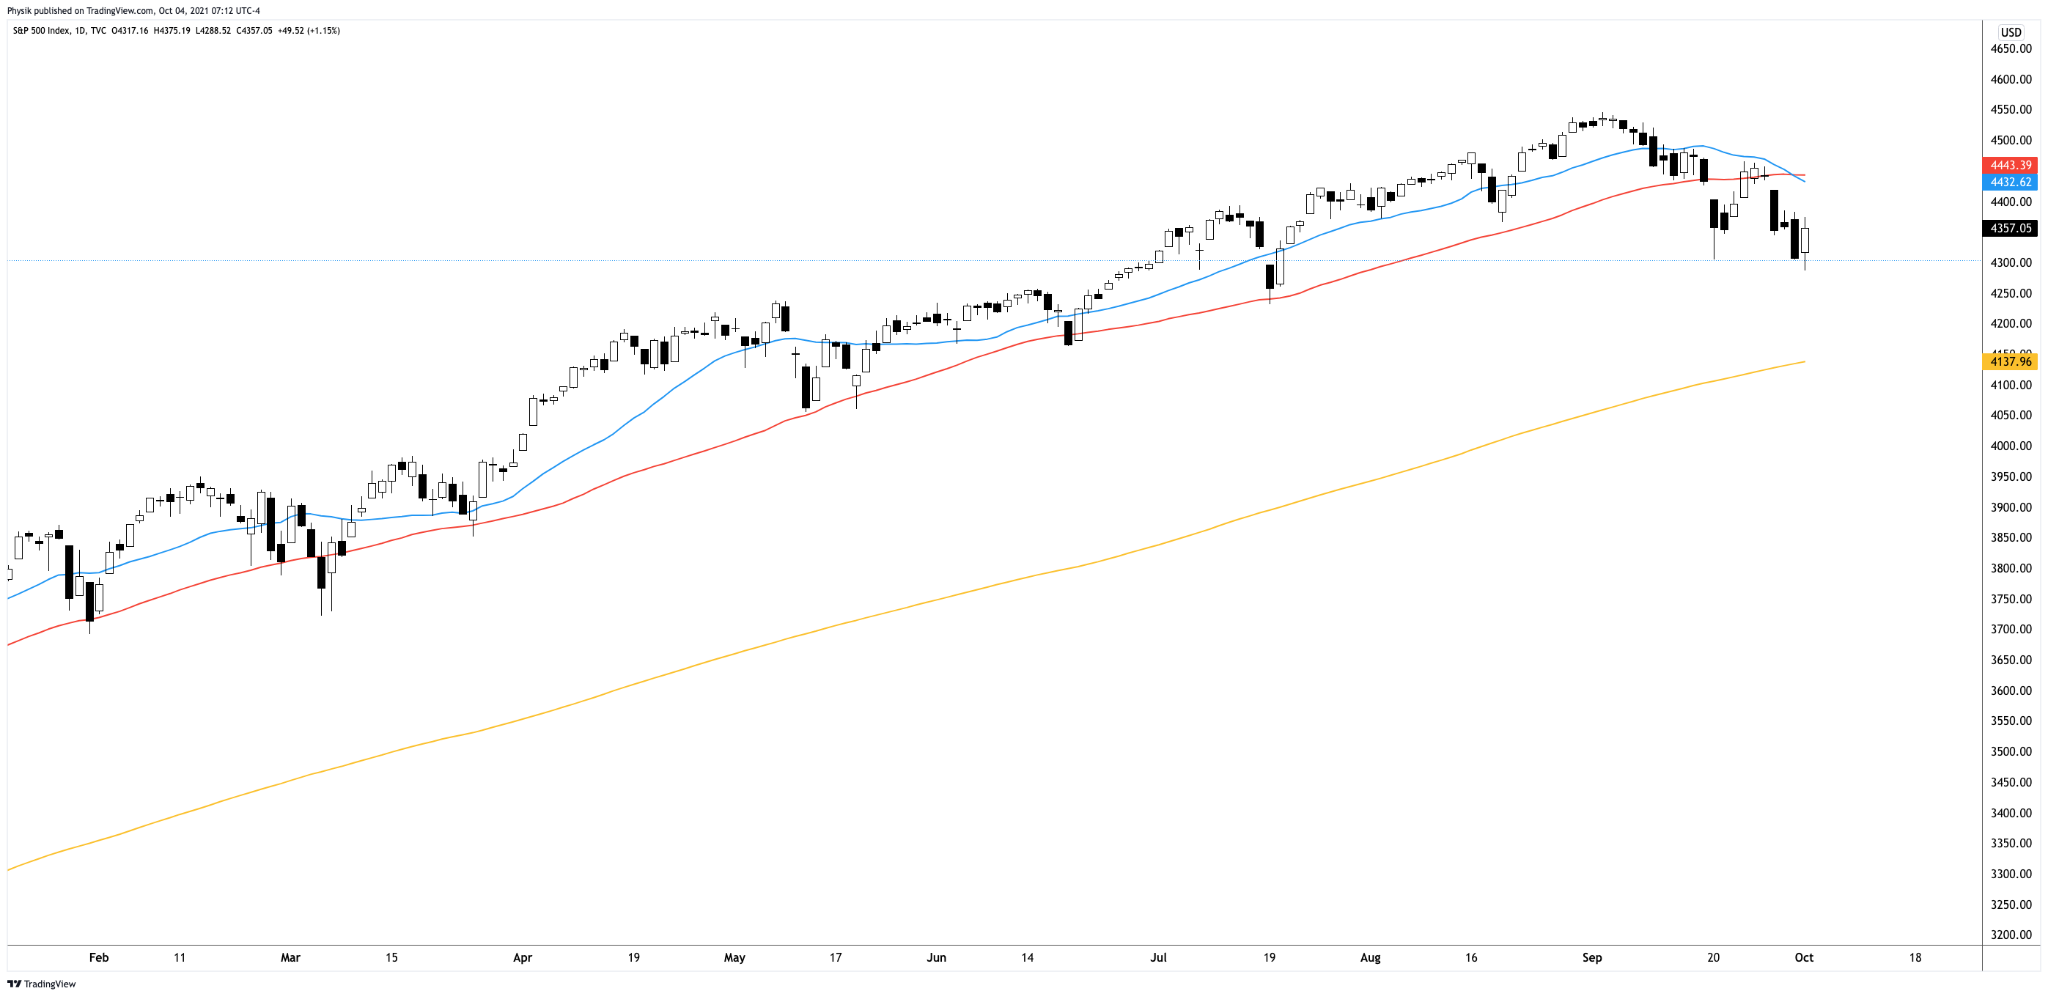
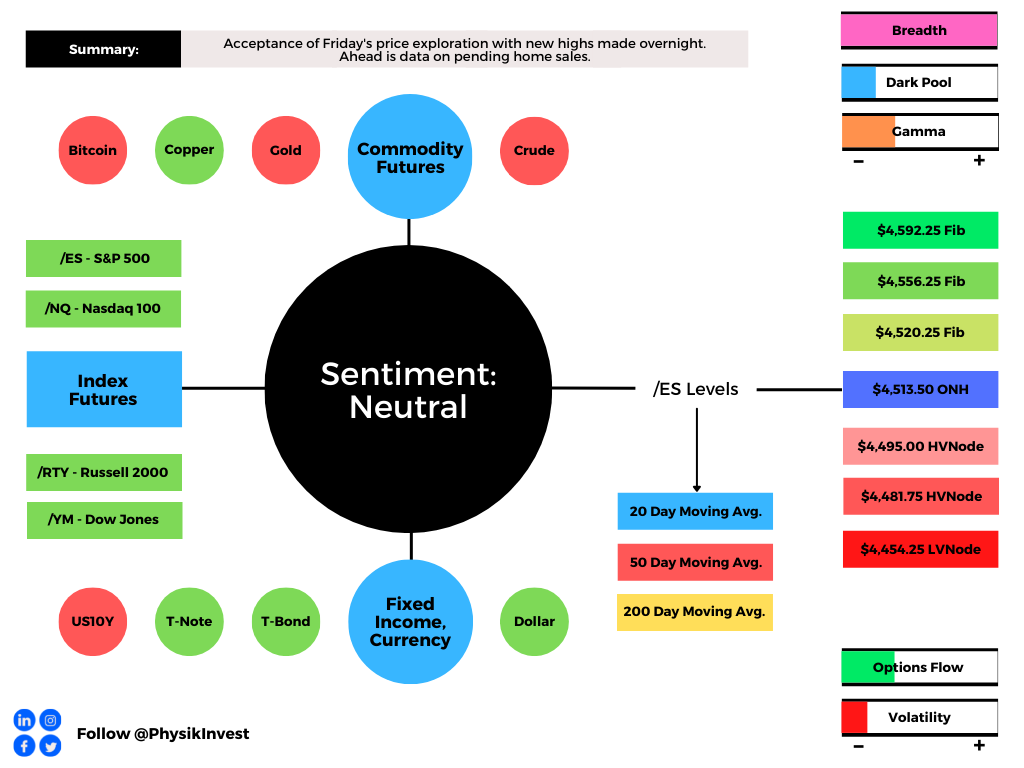
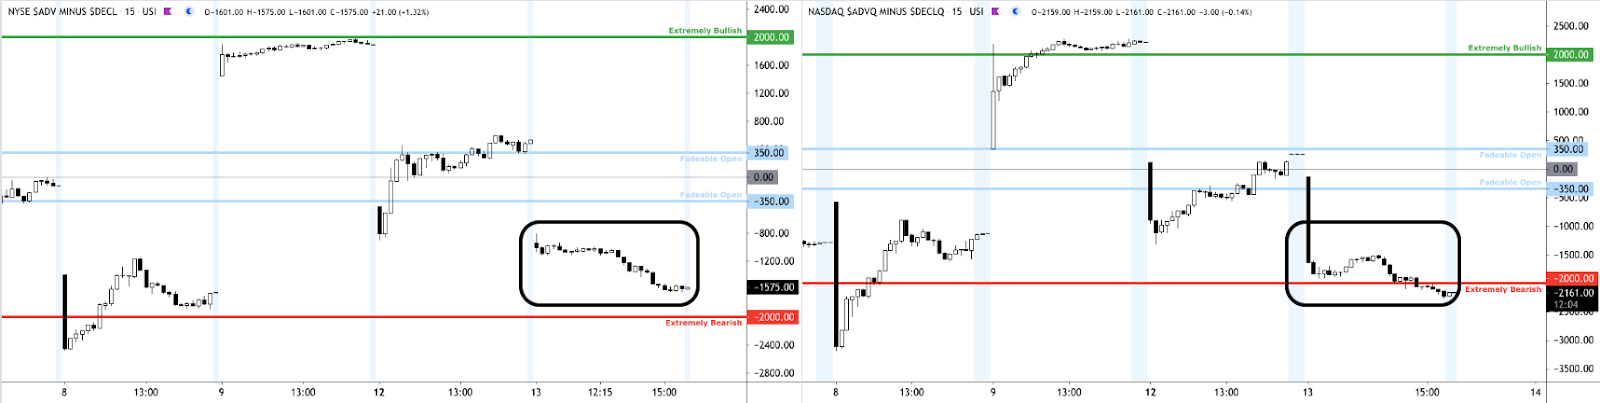
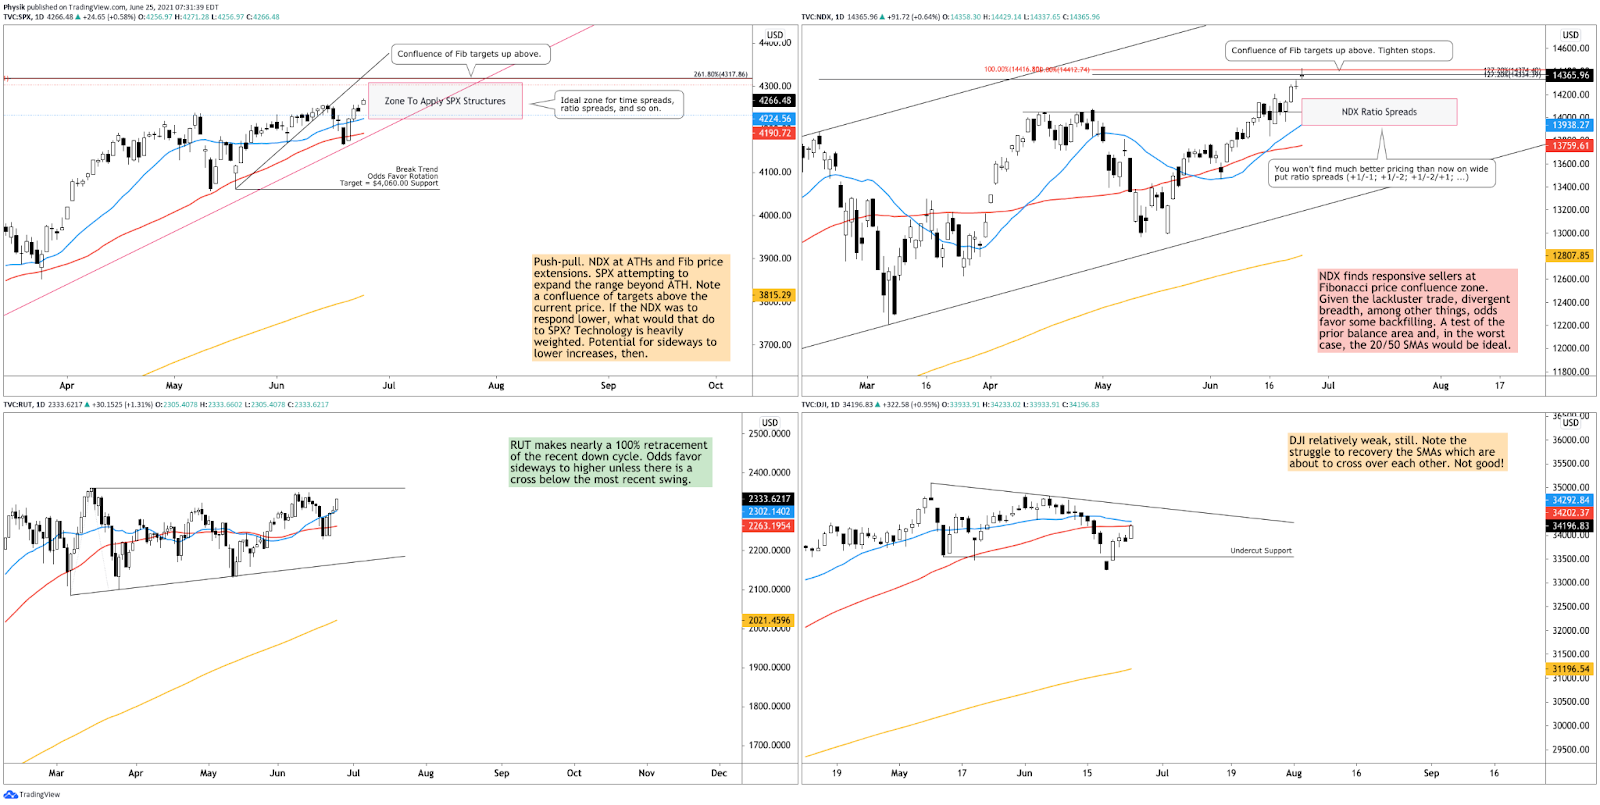
Action: On lackluster breadth and market liquidity metrics, the best case outcome occurred, evidenced by participants’ exploration of new prices in the S&P 500.

Intent: The intraday excess high marks potential exhaustion (or willingness to end trend). Also, the rounding of the composite profile (i.e., developing ledge) suggests participants are either painting themselves into a corner or there is a lack of conviction to take price higher.

Validation: Sideways trade, above the $4,590.00 balance area high (BAH), and overlapping value areas, validates the market’s intent to pause ahead of new information.

Consideration: Poor structure left behind prior initiative trade (as evidenced by the presence of numerous gaps and p-shaped emotional, multiple-distribution profile structures which denote short-covering and a lack of material, new-money buying) adds to technical instability.

Should the market crack, participants will likely look to check old value (i.e., revisit, repair, and strengthen) these pockets of low-volume. This is called the “cave-fill” process, in volume profile terms.

Graphic: Flat delta (i.e., non-committed buying as measured by volume delta or buying and selling power as calculated by the difference in volume traded at the bid and offer) in SPDR S&P 500 ETF Trust (NYSE: SPY), one of the largest ETFs that track the S&P 500 index, via Bookmap. The readings are supportive of responsive trade (i.e., rotational trade that suggests current prices offer favorable entry and exit; the market is in balance).

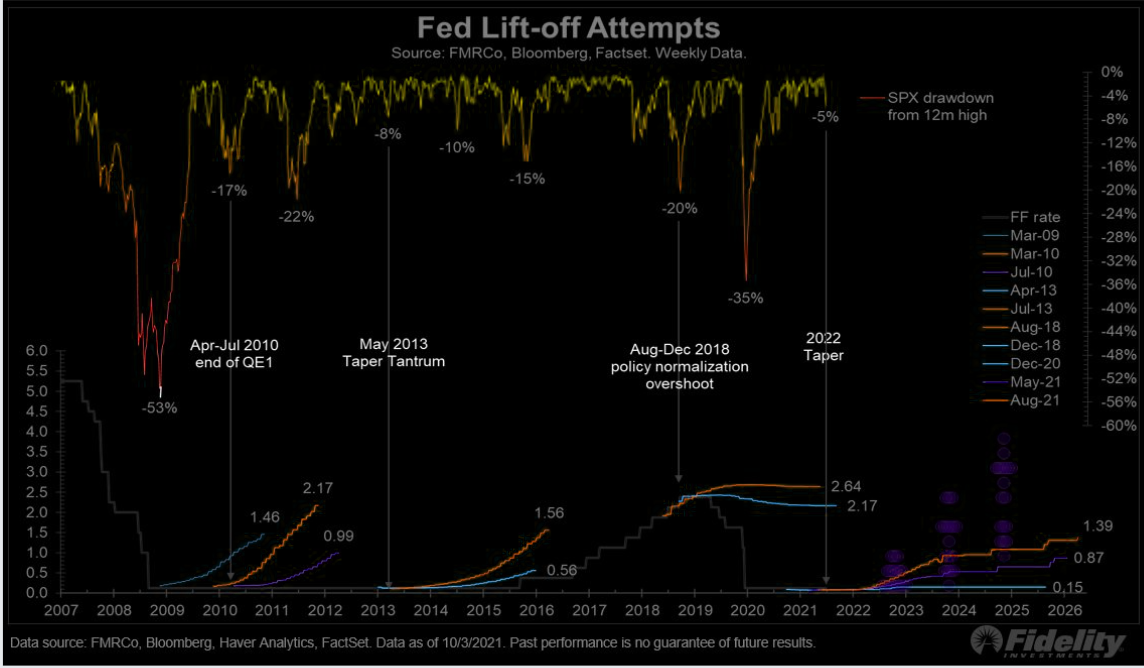
Context: Federal Open Market Committee (FOMC) announcement later today.

The announcement will provide participants with color on the economic recovery and the Federal Reserve’s intent to continue supporting the economy, at the rate it has. 

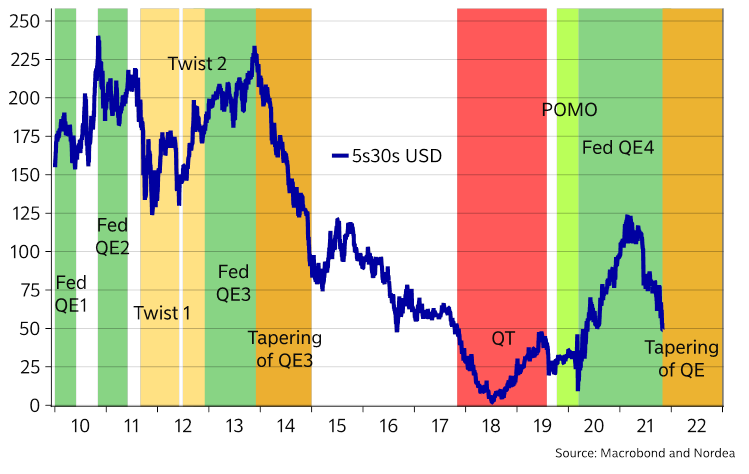
Nordea’s Andreas Steno Larsen states: “Jay Powell will have to walk on eggshells to prevent an acceleration of the front-end of the USD yield curve. Arguments for the Fed to tighten policy keep piling up and hence we see a swift tapering process (30B a meeting) and a first hike in June.” 

“The combination of 1) even higher inflation prints during Q4 (with several extremely volatile base effects), 2) a removal of USD liquidity, 3) a historically weak credit impulse into 2022 (due to a massive credit expansion 20/21) sounds like the perfect flattener setup to us,” which may weigh on sentiment and long term investments.

Graphic: “Keep flattening the yield curve during tapering,” via Nordea.

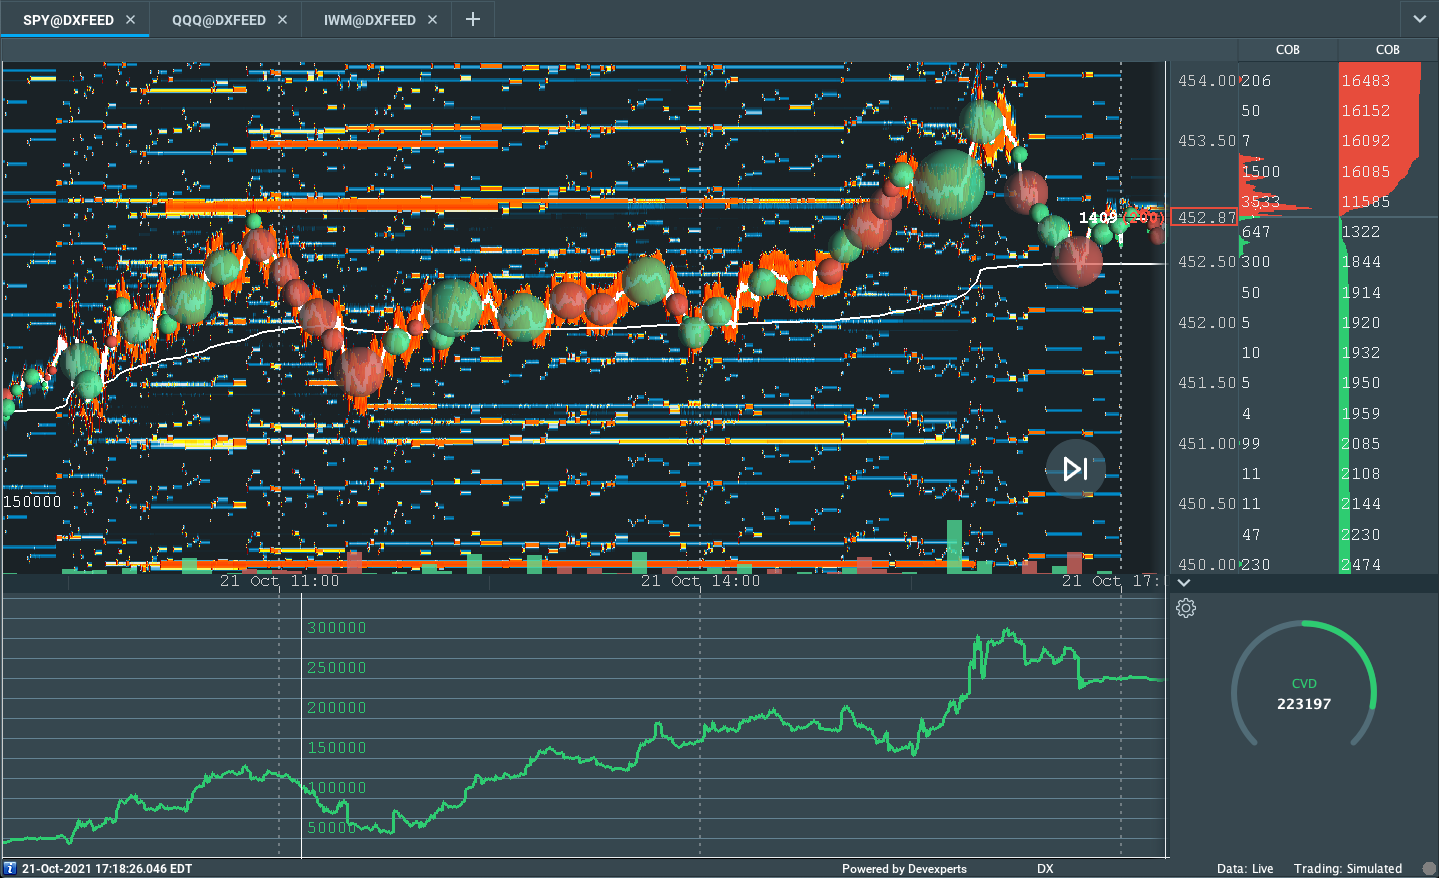
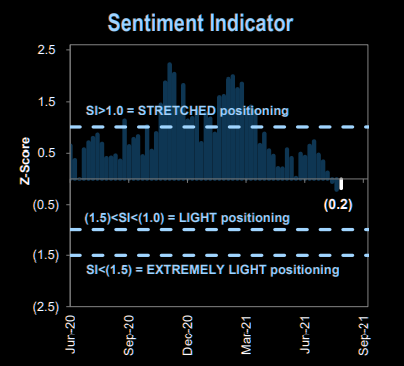
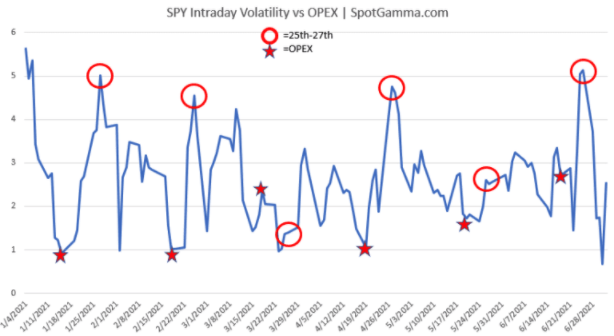
In terms of positioning, the CBOE Volatility Index (INDEX: VIX) was a touch higher, while spreads across the VIX futures term structure widened with demand coming in at the front.

Such a situation, as touched on yesterday, in addition to the long-gamma environment (in which counterparties hedge their warehoused options risk by buying underlying into weakness and selling into strength), has the effect of making it difficult to resolve directionally.

The reasons are: (1) options will slide down their term structure (vanna) and (2) skew decays (charm). When this happens, we expect to see supportive flows as dealers cover their short equity/futures hedges. 

With volatility bid, the effect of vanna and charm is dulled. As a result, it is likely that participants see more movement after the FOMC announcement.

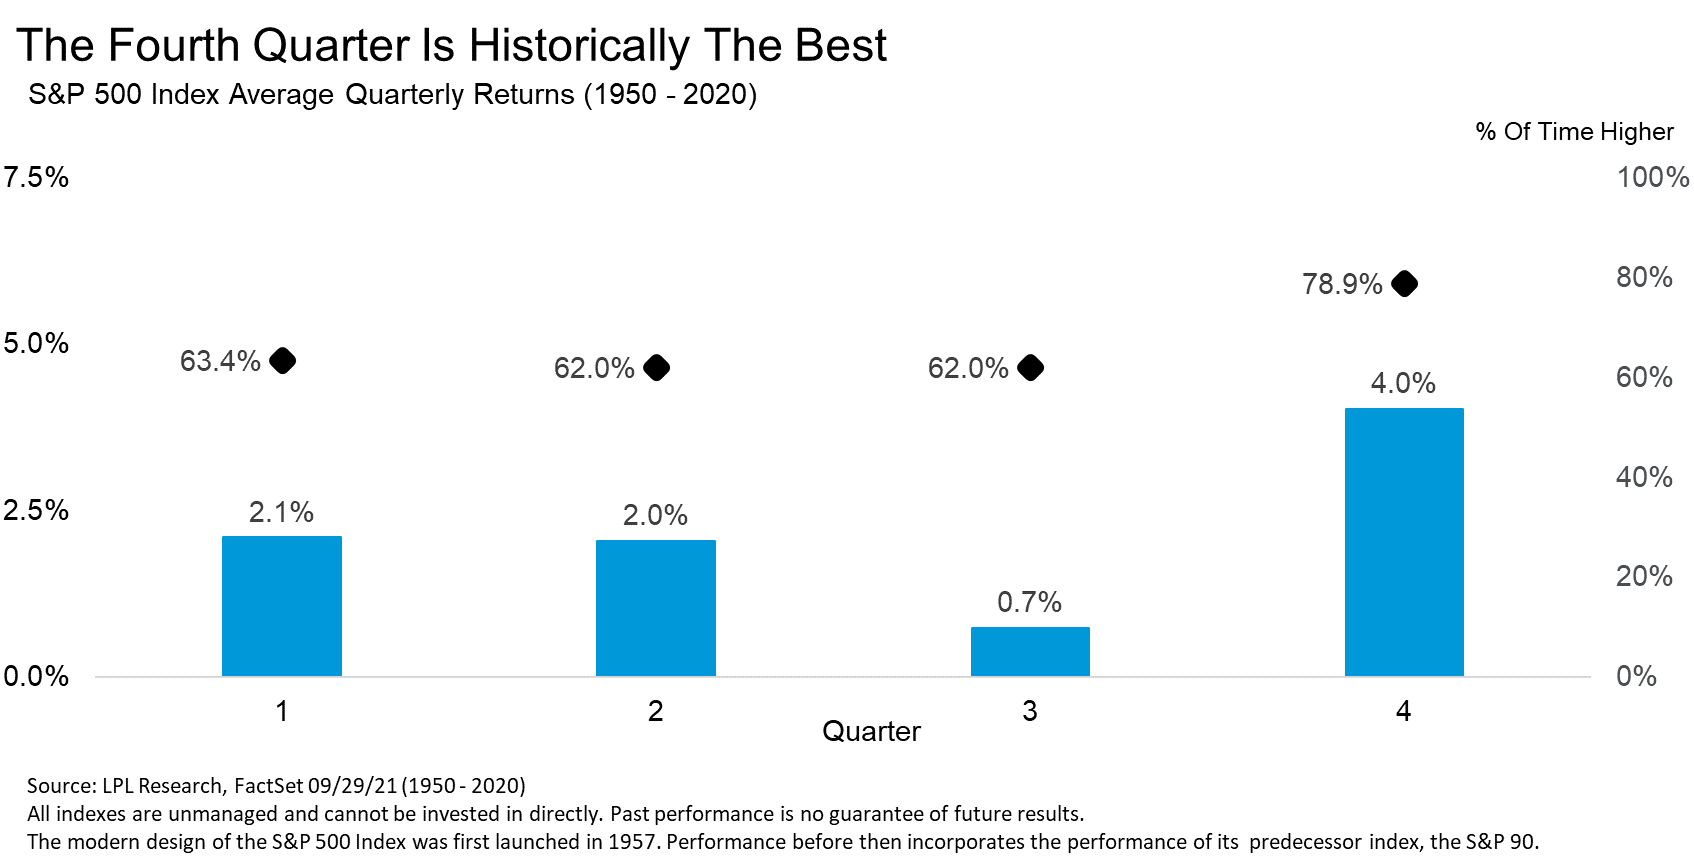
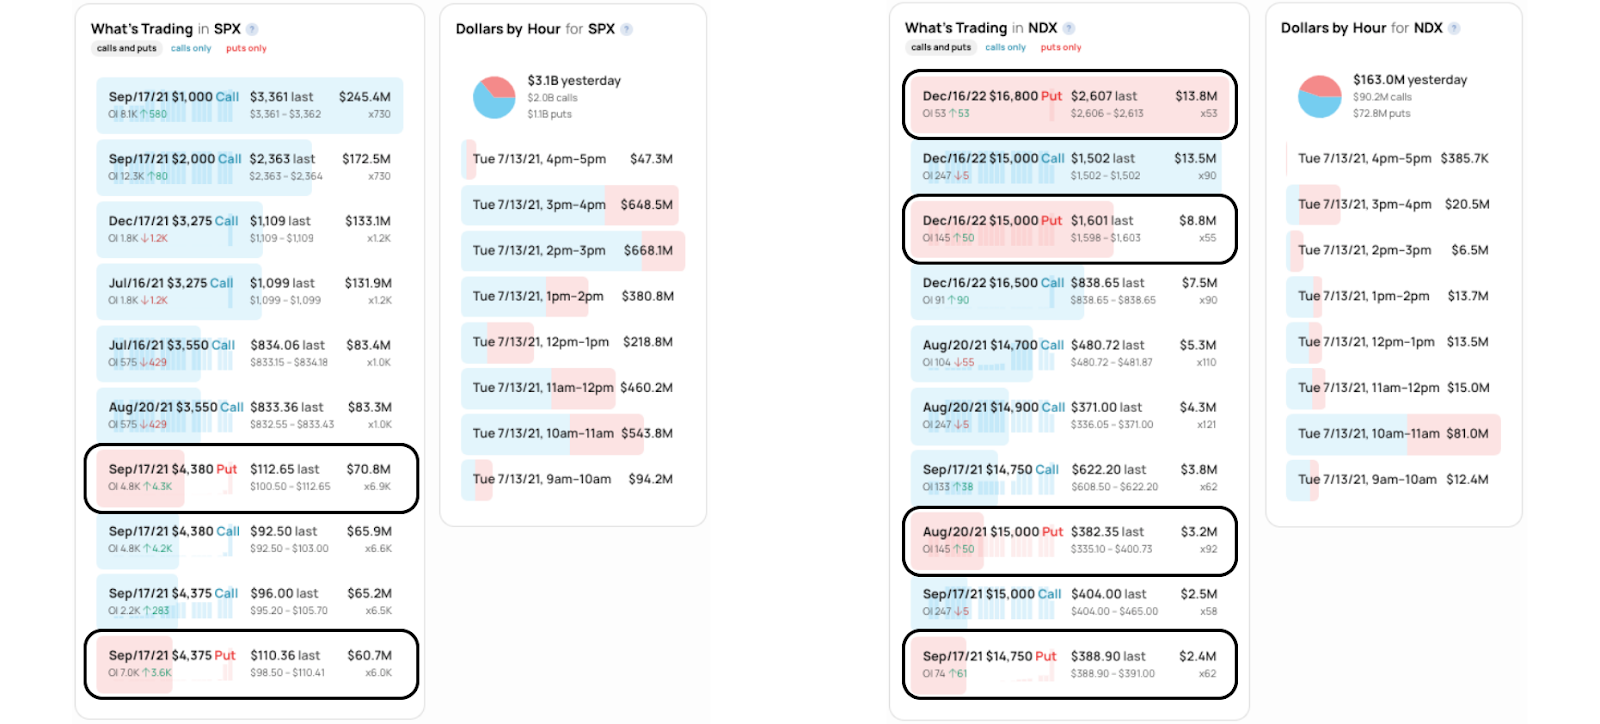
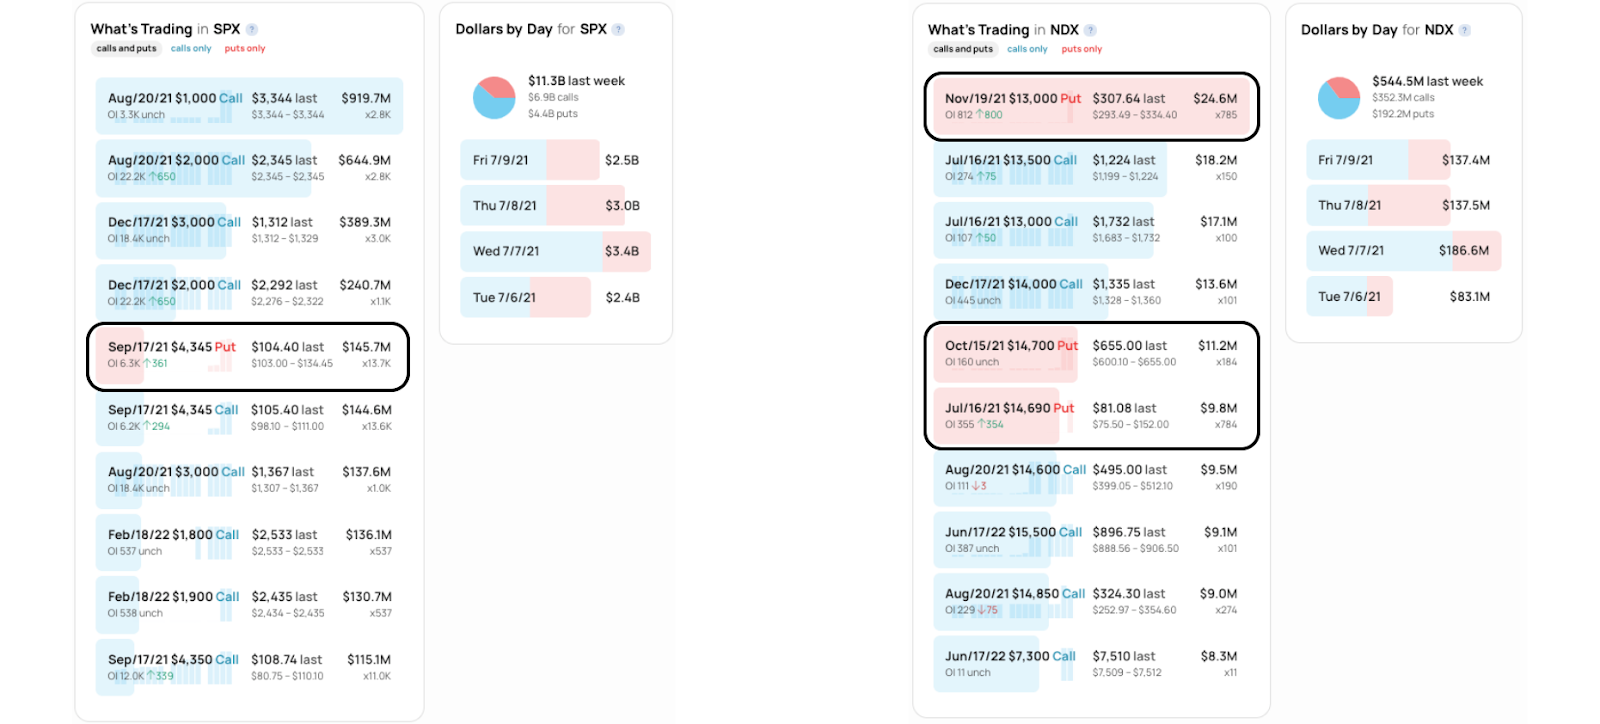
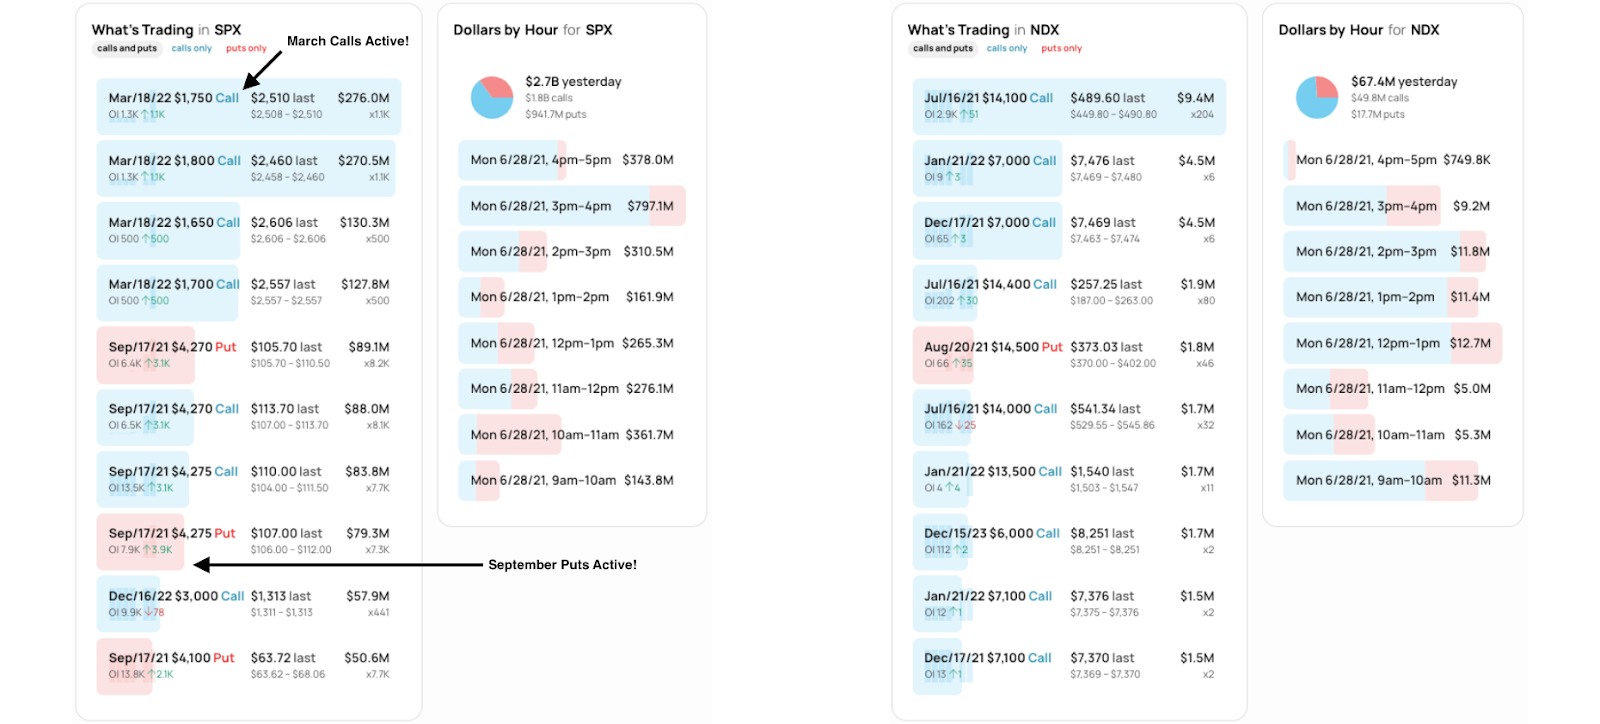
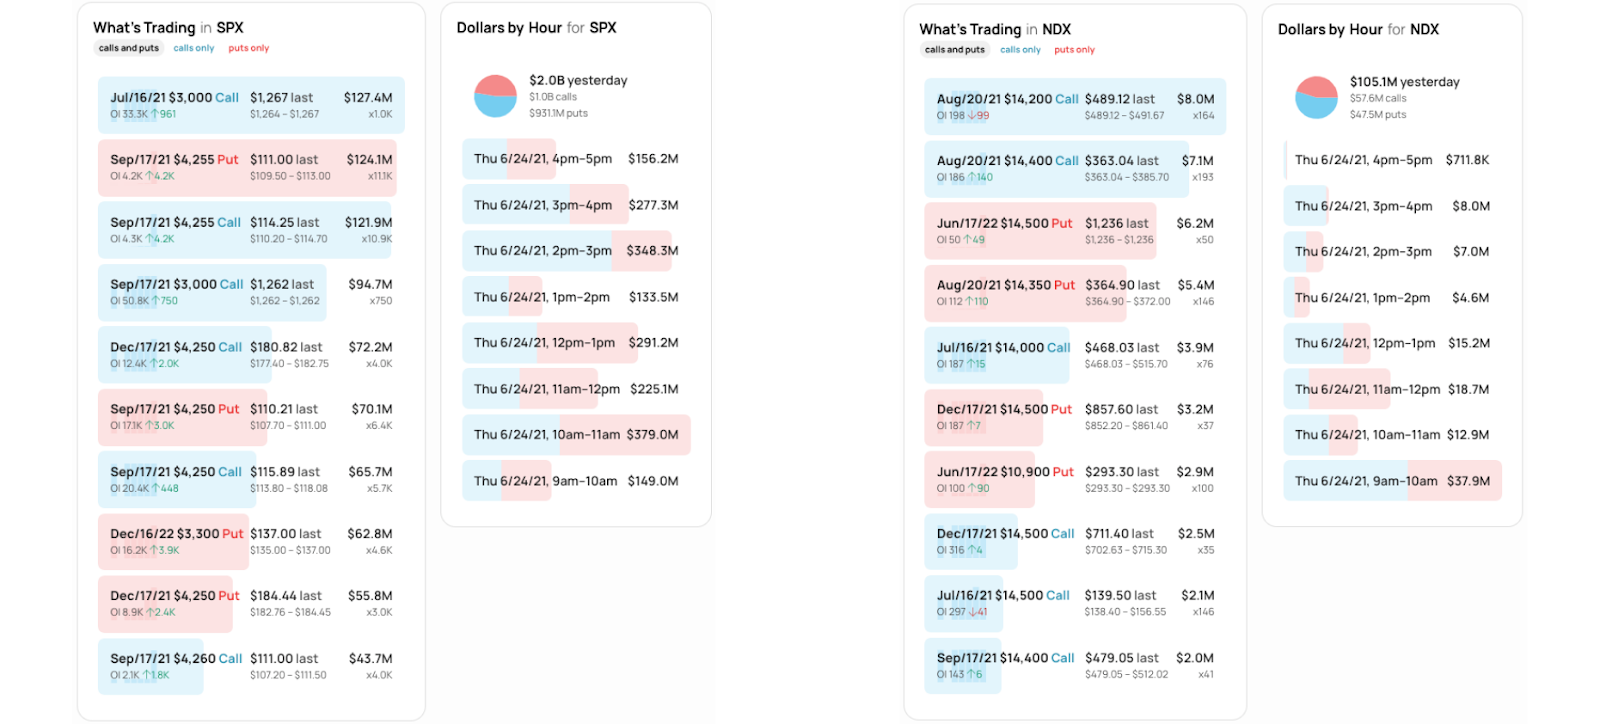
To note, the potential for upside resolve comes down to how participants take the FOMC announcement. We know that, according to SpotGamma, there is increased capital being committed to higher and higher options strikes, a development often seen as bullish.

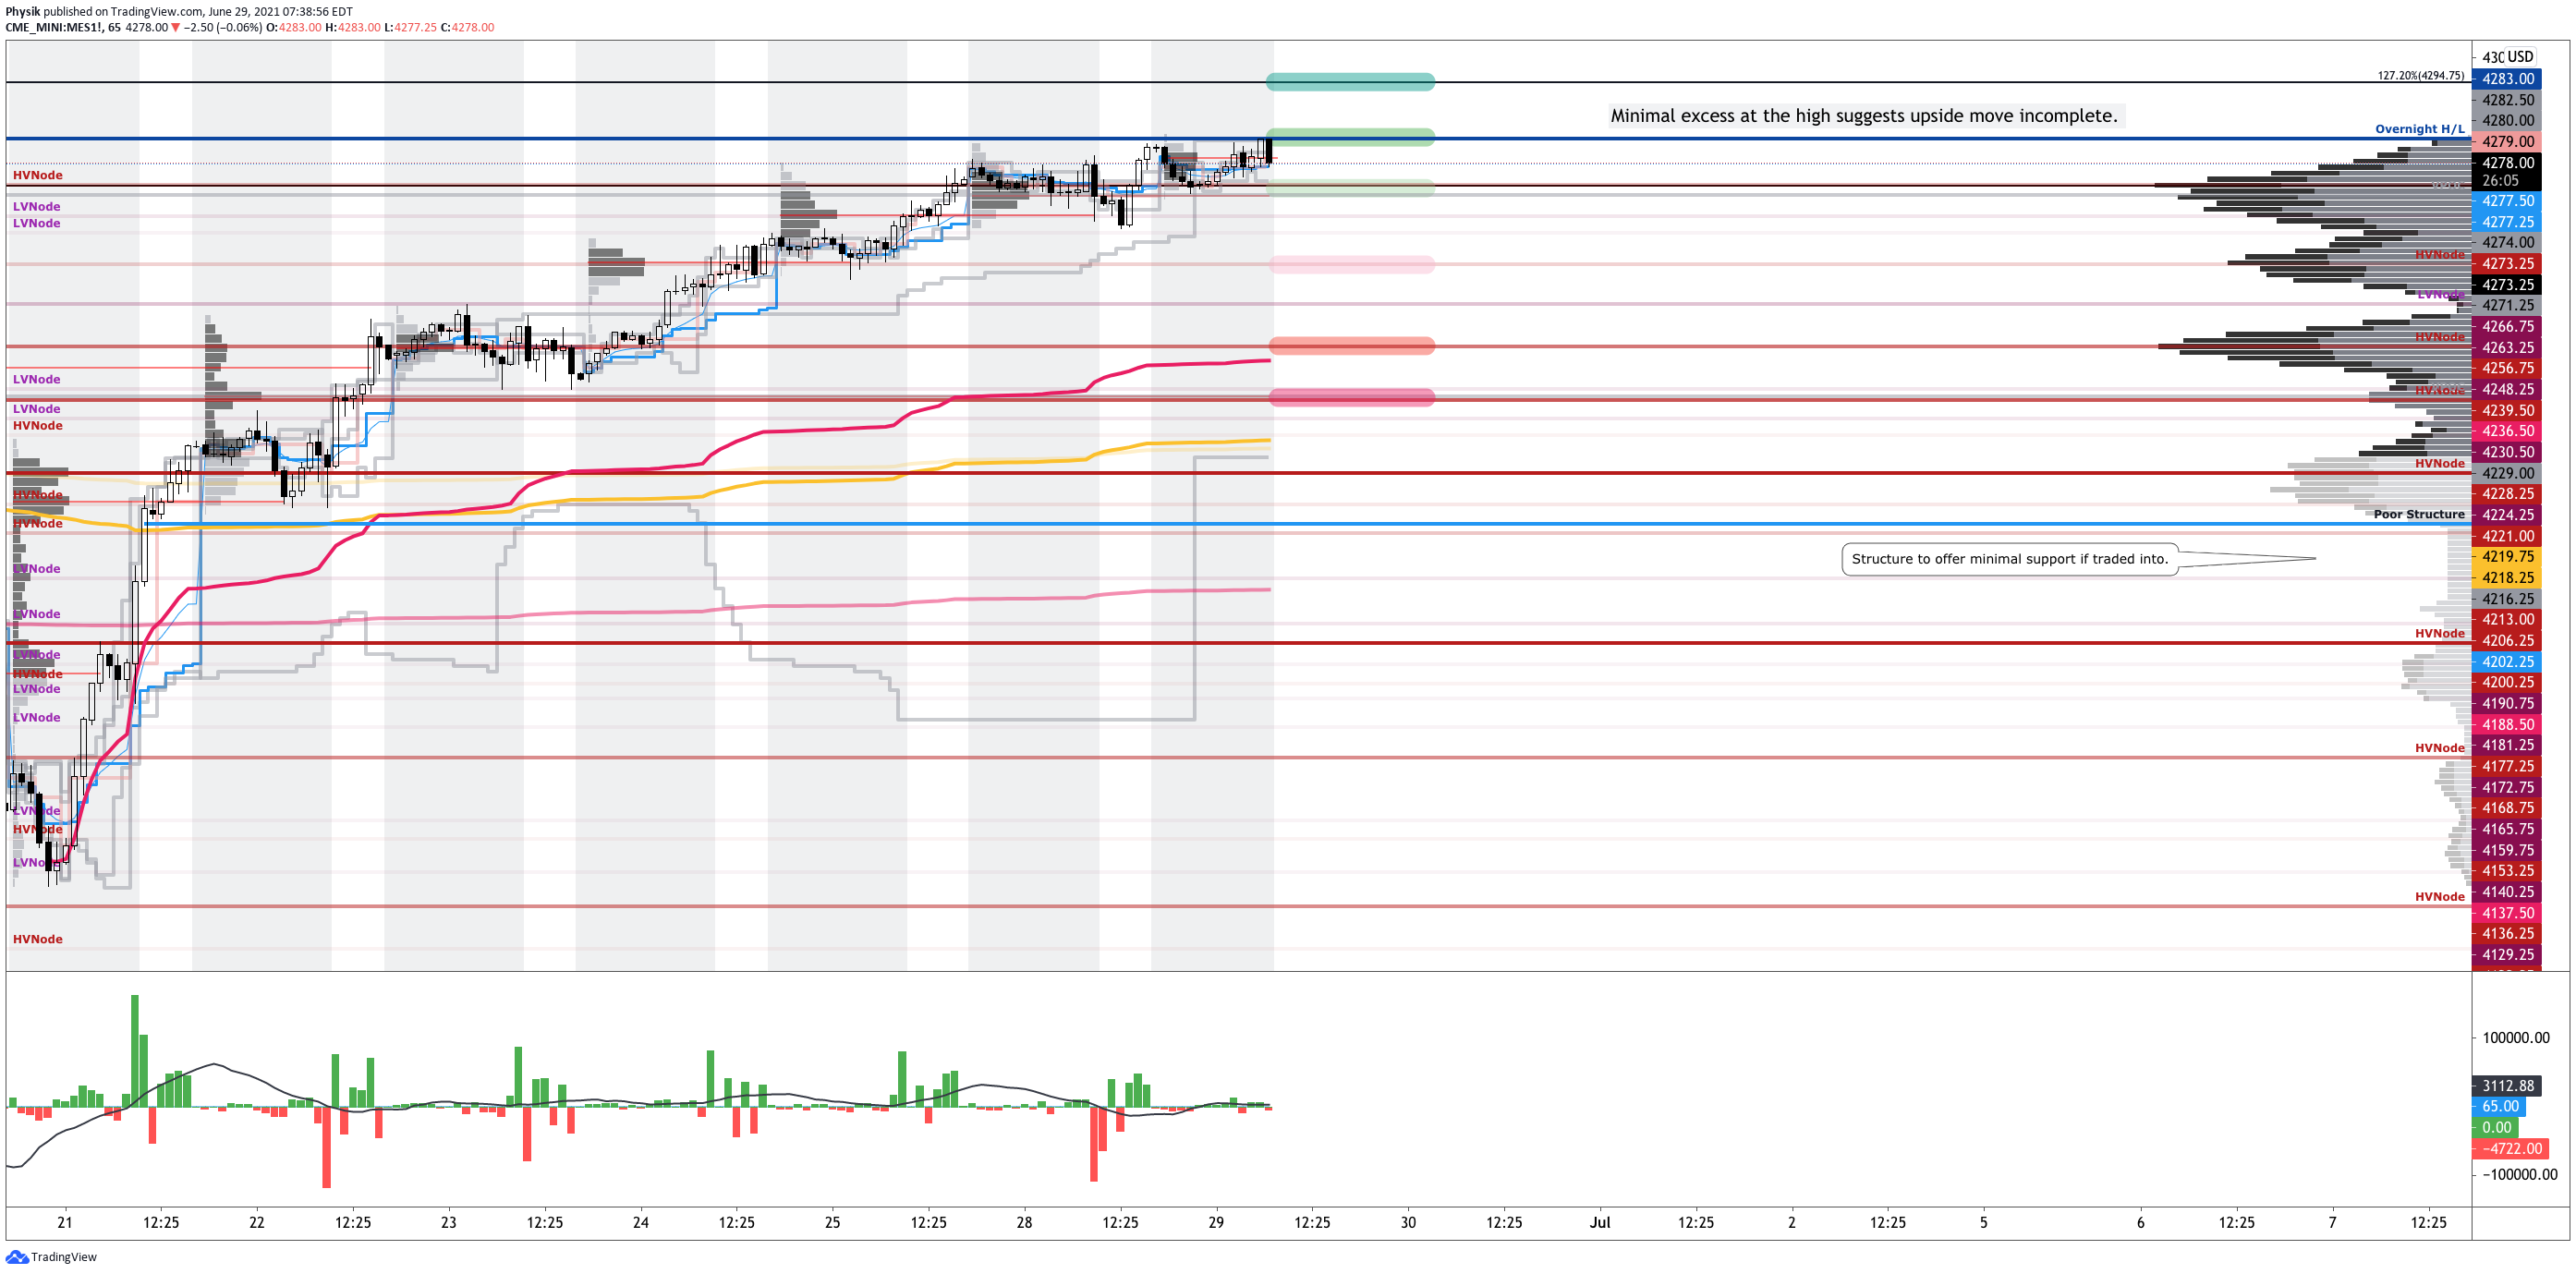
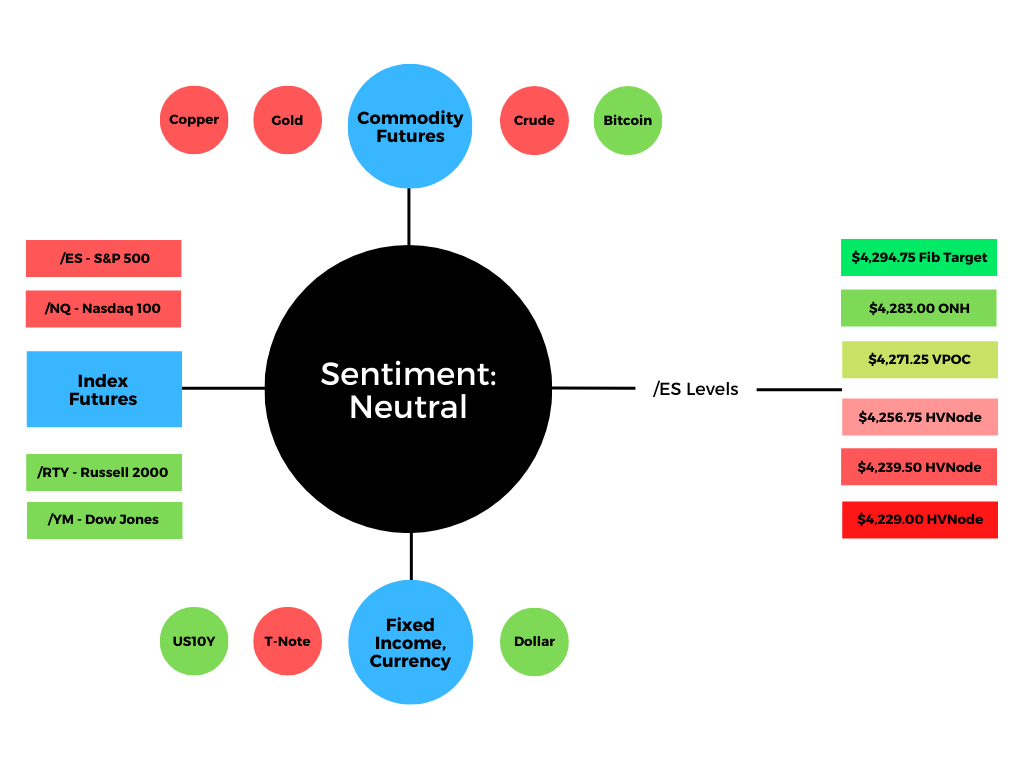
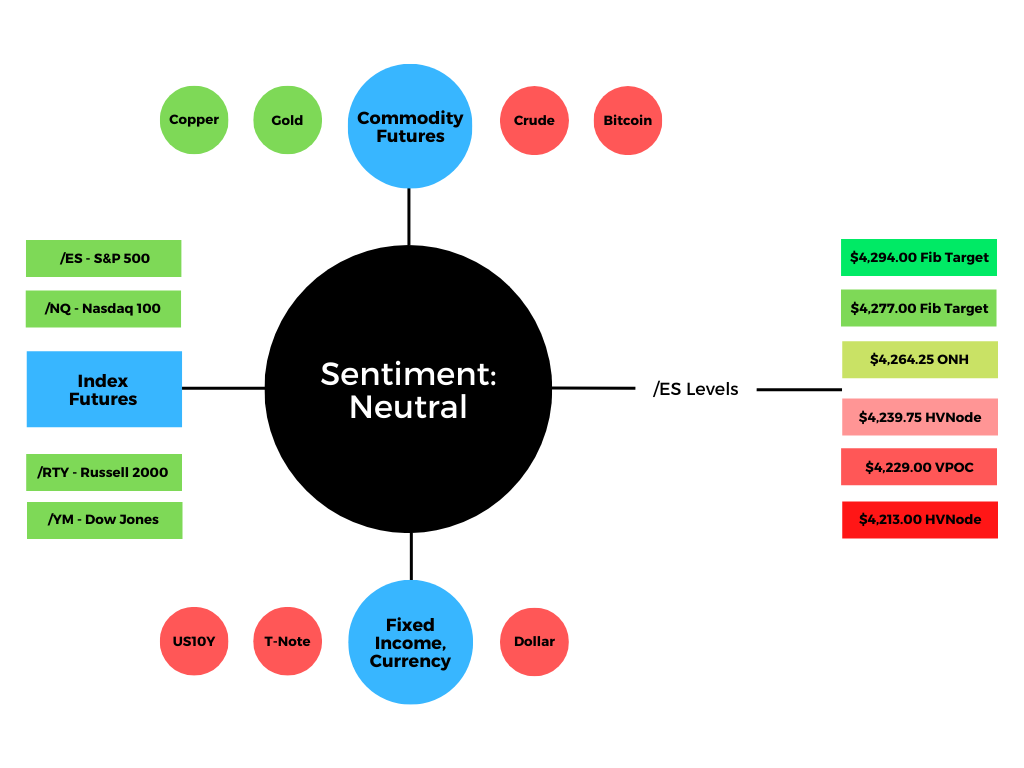
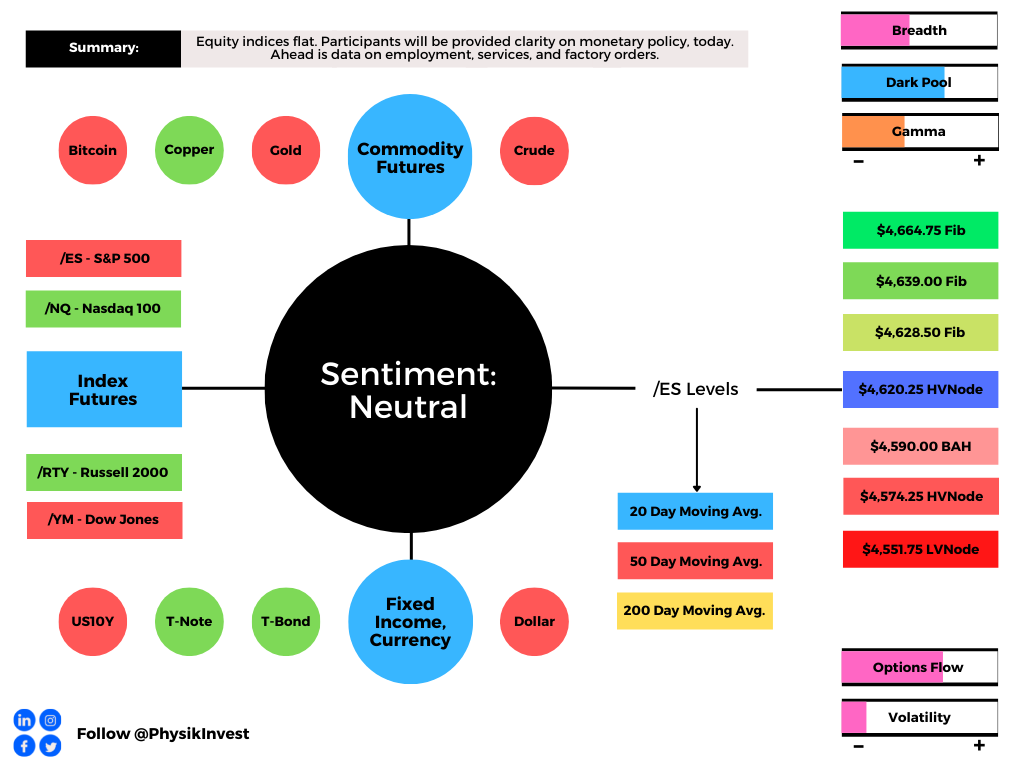
Expectations: As of 6:30 AM ET, Wednesday’s regular session (9:30 AM – 4:00 PM ET), in the S&P 500, will likely open in the middle part of a neutral overnight inventory, inside of prior-range and -value, suggesting a limited potential for immediate directional opportunity.

Balance (Two-Timeframe Or Bracket) Is The Status Quo: Rotational trade that denotes current prices offer favorable entry and exit. Modus operandi is responsive trade (i.e., fade the edges), rather than initiative trade (i.e., play the break).

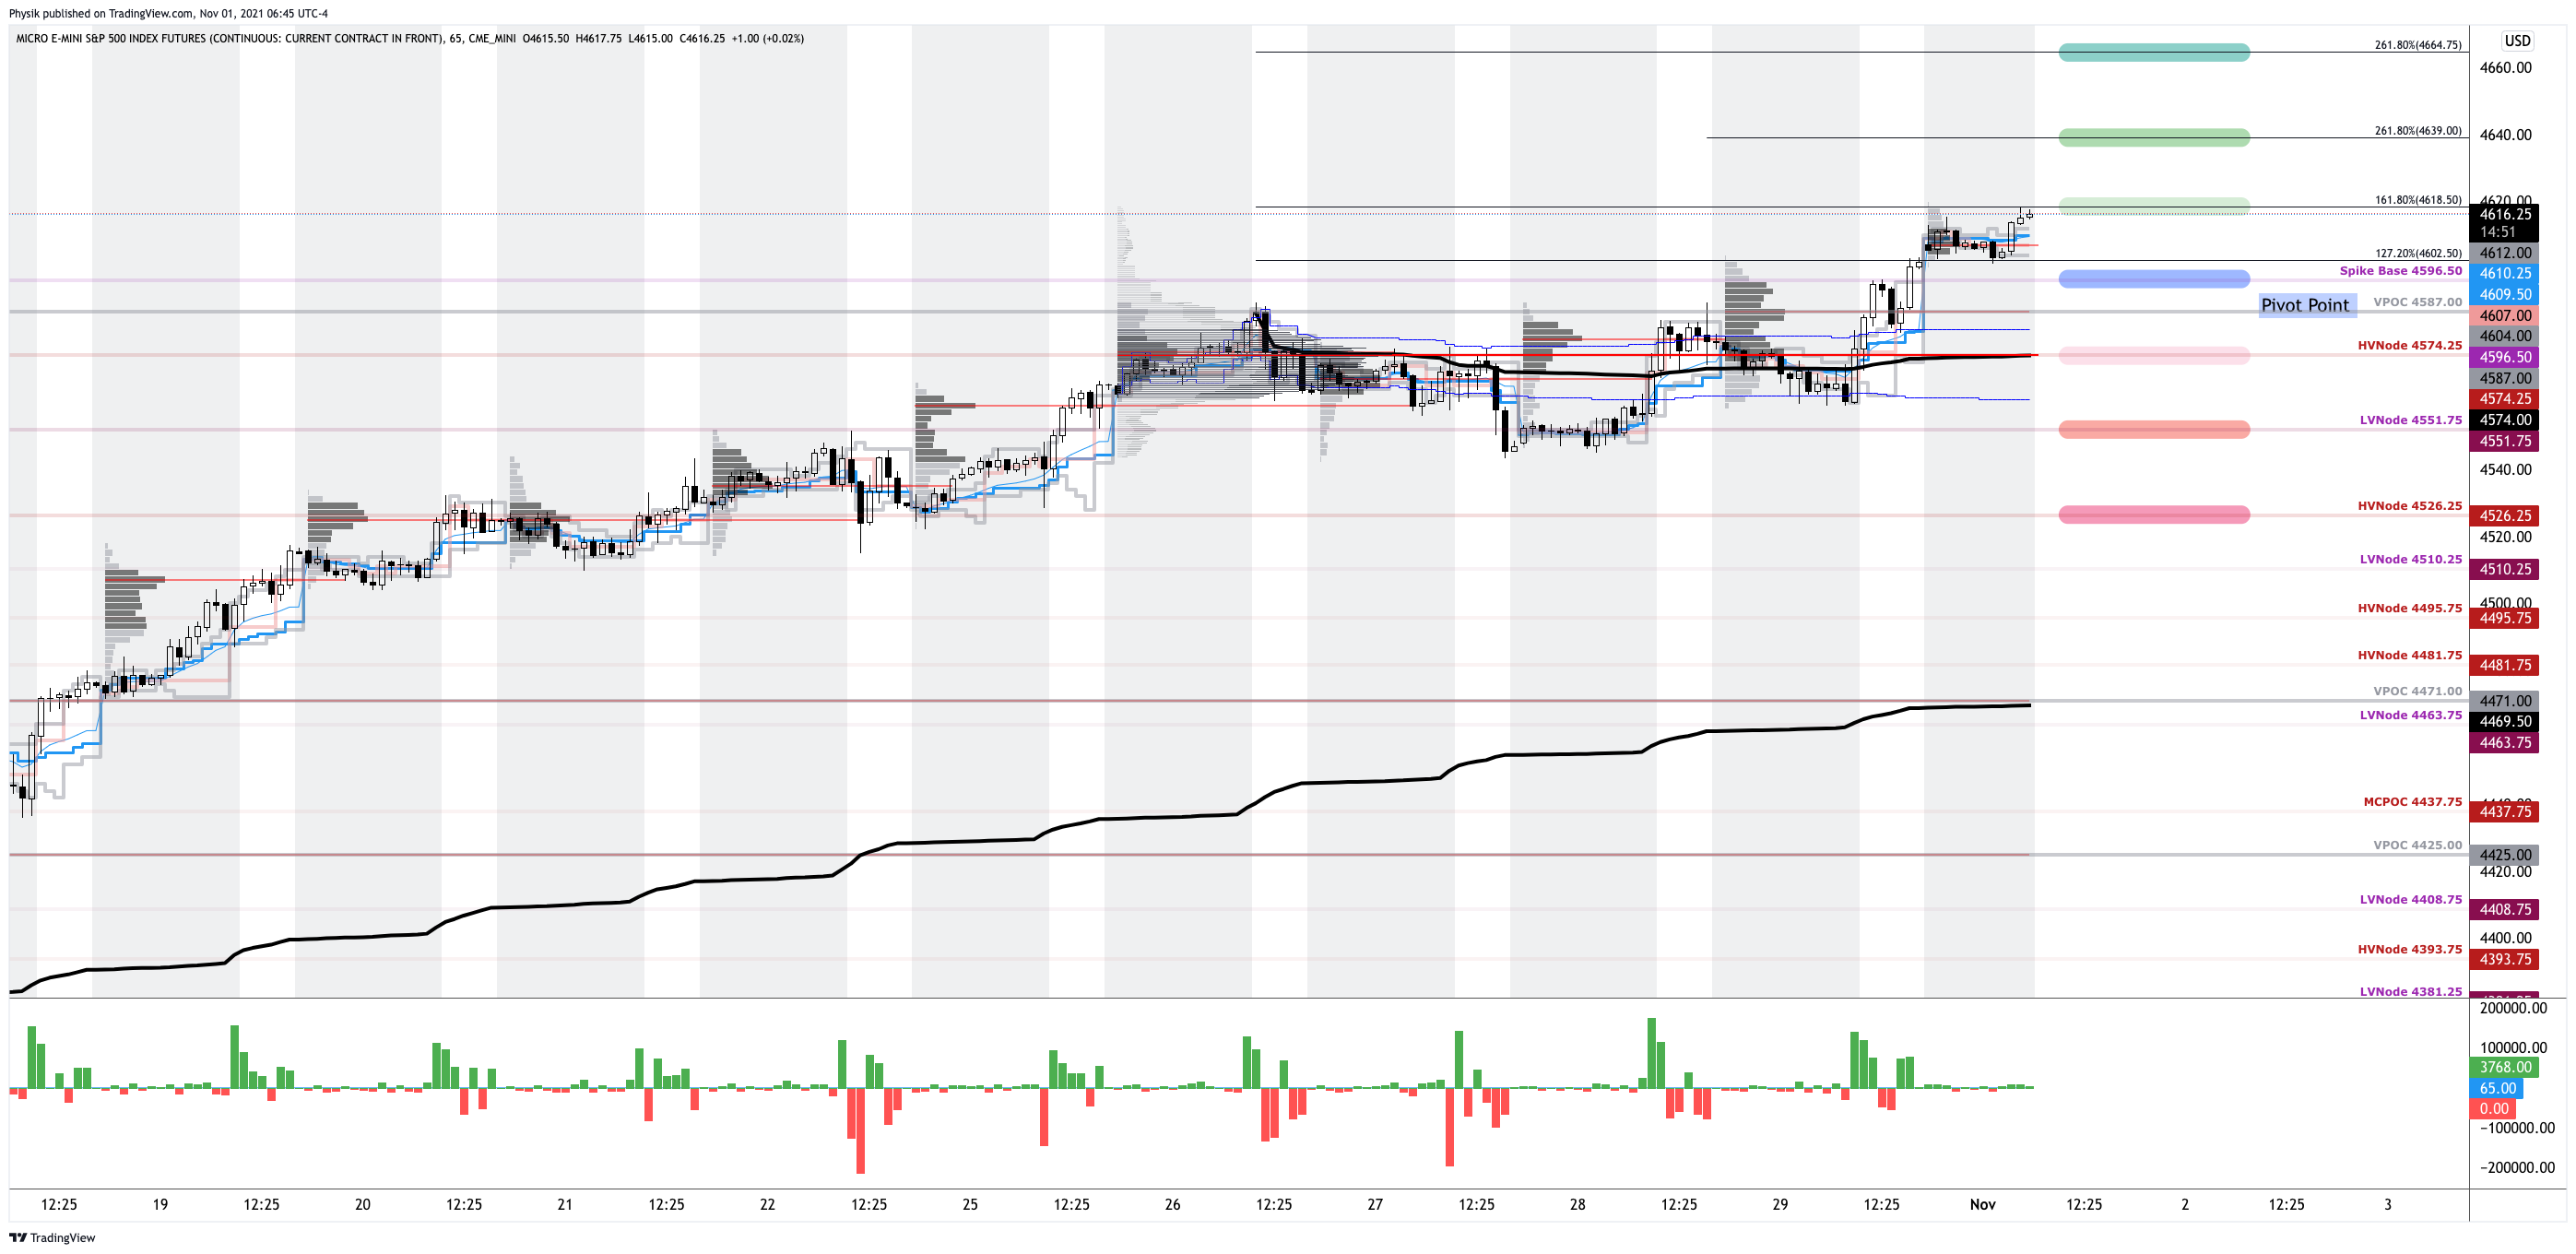
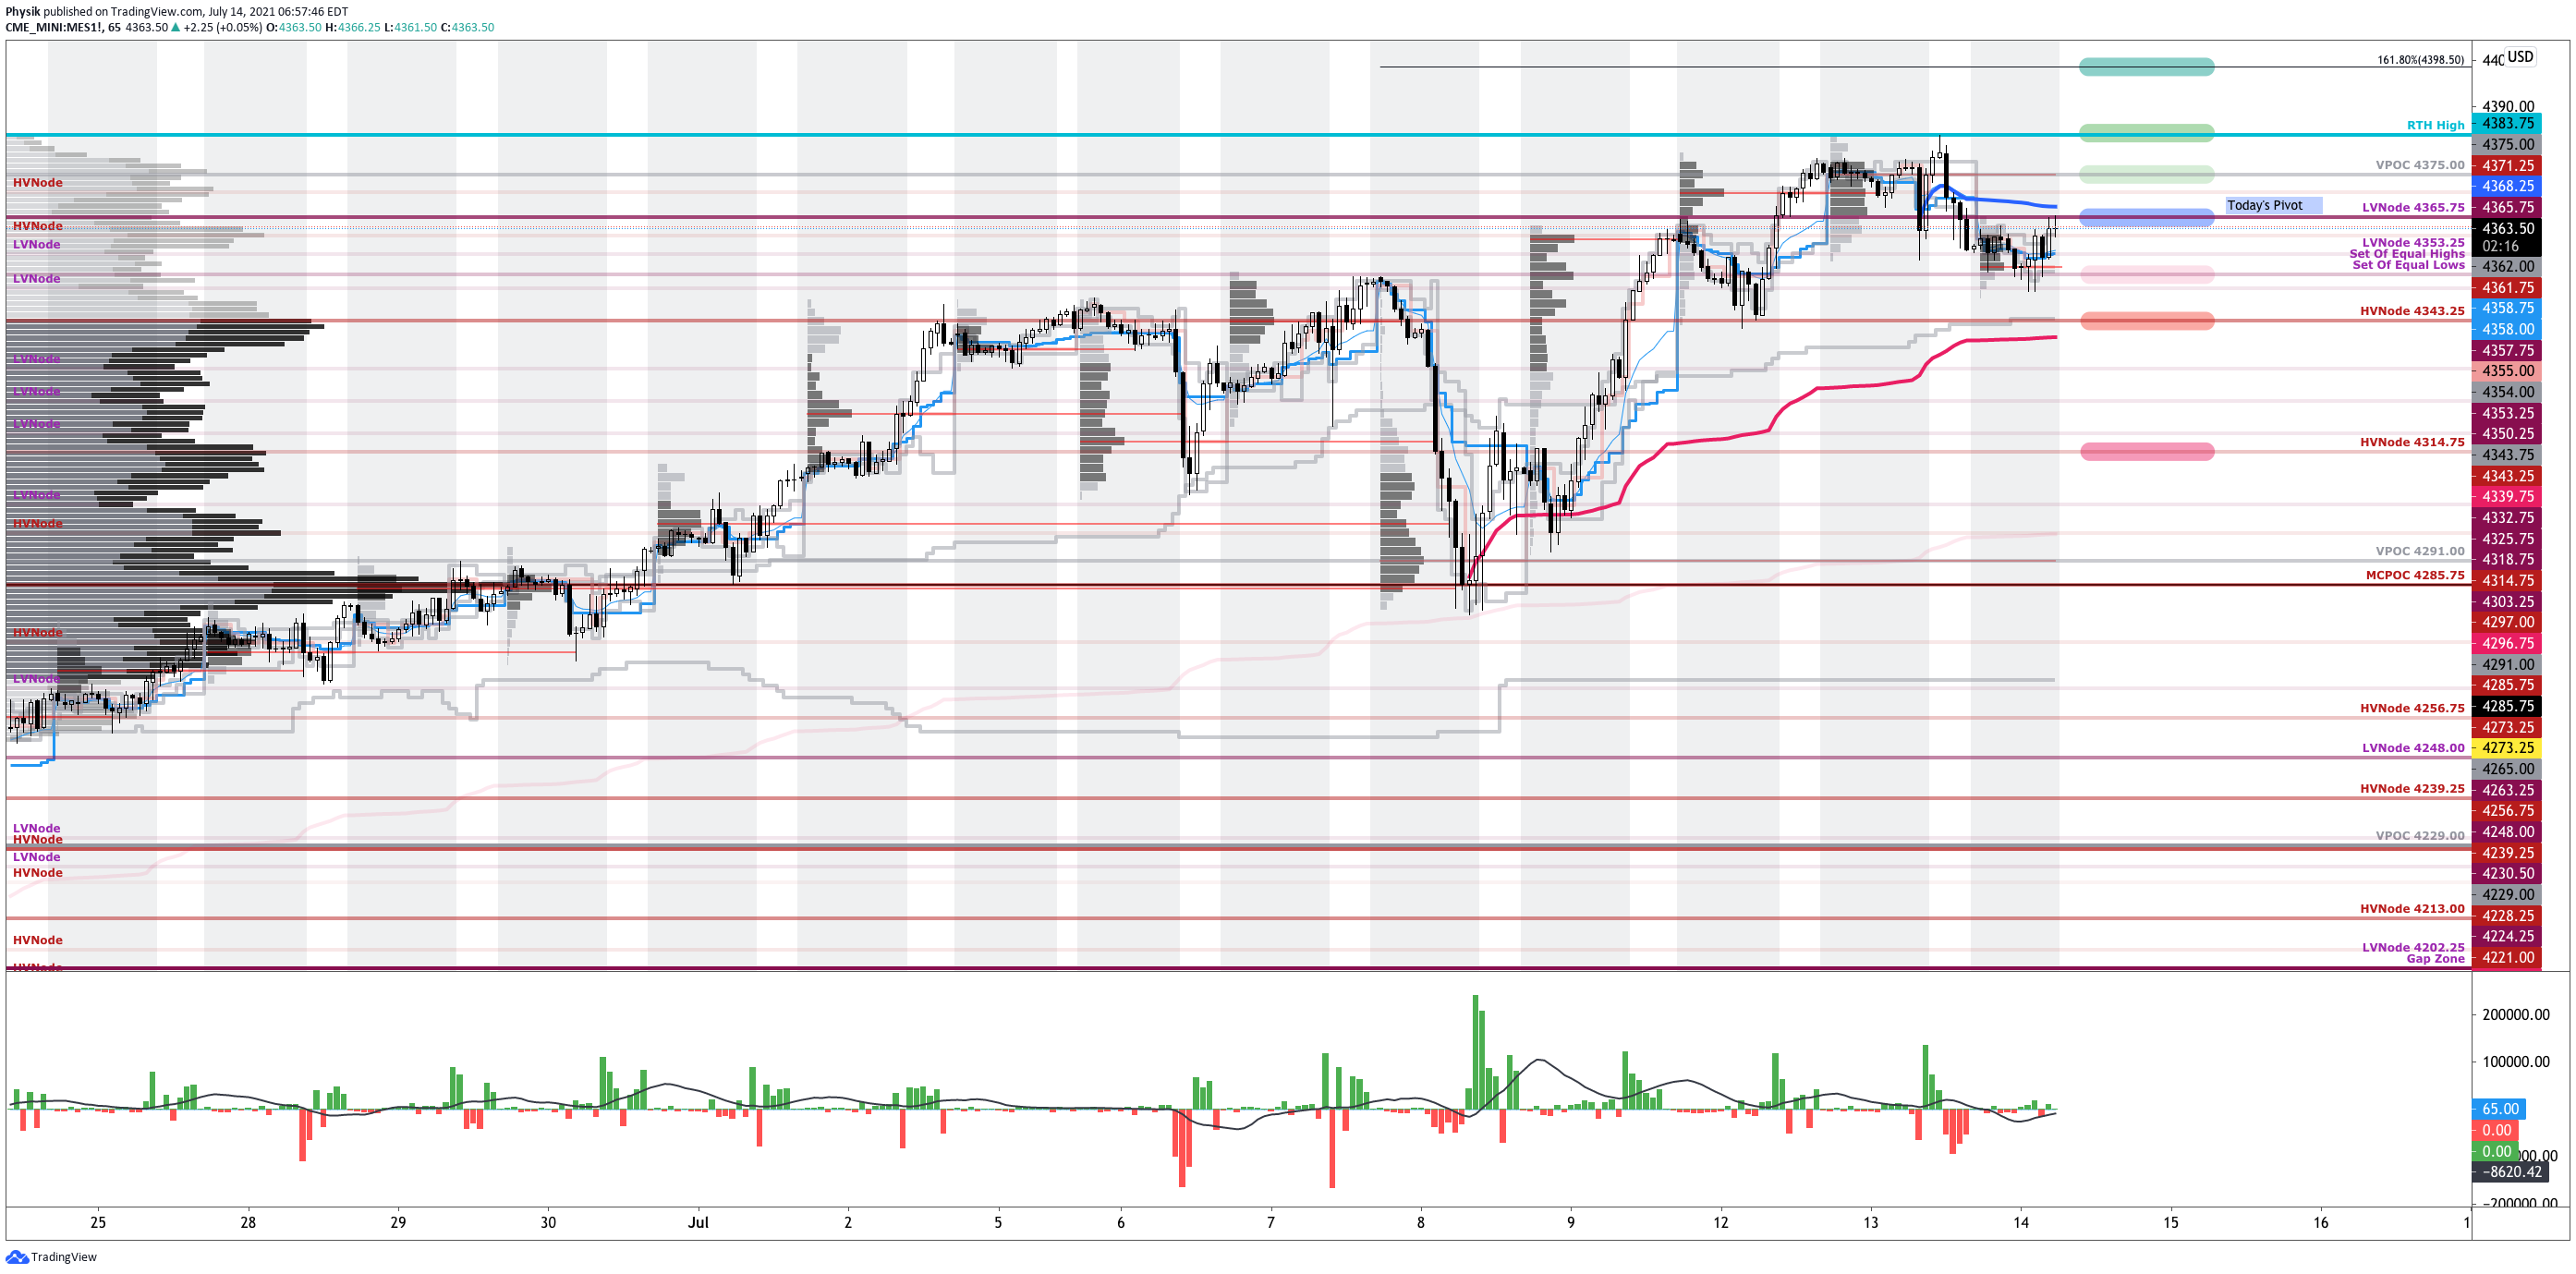
In the best case, the S&P 500 trades sideways or higher; activity above the $4,620.25 high volume area (HVNode) pivot puts in play the $4,628.50 Fibonacci extension. Initiative trade beyond $4,628.50 could reach the $4,639.00 and $4,664.75 Fibonacci levels, or higher.

In the worst case, the S&P 500 trades lower; activity below the $4,620.25 HVNode puts in play the $4,590.00 balance area high (BAH). Initiative trade beyond the BAH could reach as low as the $4,574.25 HVNode and $4,551.75 low volume area (LVNode), or lower.

Click here to load today’s updated key levels into the web-based TradingView charting platform. Note that all levels are derived using the 65-minute timeframe. New links are produced, daily.
Graphic: 65-minute profile chart of the Micro E-mini S&P 500 Futures. Learn about the profile.

What People Are Saying

Definitions

Cave-Fill Process: Widened the area deemed favorable to transact at by an increased share of participants. This is a good development.

Volume Areas: A structurally sound market will build on areas of high volume (HVNodes). Should the market trend for long periods of time, it will lack sound structure, identified as low volume areas (LVNodes). LVNodes denote directional conviction and ought to offer support on any test. 

If participants were to auction and find acceptance into areas of prior low volume (LVNodes), then future discovery ought to be volatile and quick as participants look to HVNodes for favorable entry or exit.

Excess: A proper end to price discovery; the market travels too far while advertising prices. Responsive, other-timeframe (OTF) participants aggressively enter the market, leaving tails or gaps which denote unfair prices.

Ledges: Flattened area on the profile which suggests responsive participants are in control, or initiative participants lack the confidence to continue the discovery process. The ledge will either hold and force participants to liquidate (cover) their positions, or crack and offer support (resistance).

Value-Area Placement: Perception of value unchanged if value overlapping (i.e., inside day). Perception of value has changed if value not overlapping (i.e., outside day). Delay trade in the former case.

About

After years of self-education, strategy development, and trial-and-error, Renato Leonard Capelj began trading full-time and founded Physik Invest to detail his methods, research, and performance in the markets.

Additionally, Capelj is a Benzinga finance and technology reporter interviewing the likes of Shark Tank’s Kevin O’Leary, JC2 Ventures’ John Chambers, and ARK Invest’s Catherine Wood, as well as a SpotGamma contributor, developing insights around impactful options market dynamics.

Disclaimer

At this time, Physik Invest does not manage outside capital and is not licensed. In no way should the materials herein be construed as advice. Derivatives carry a substantial risk of loss. All content is for informational purposes only.

Categories
Commentary

Daily Brief For November 1, 2021

Abstract

Equity index futures higher. Commodities mixed. Bonds lower. Volatility expanded.

Ahead is a light day of economic releases, in the face of fundamental narratives and positioning metrics that promote less intraday volatility into FOMC.

What Happened

Overnight, equity index futures auctioned sideways to higher as participants seek clarity on the Federal Reserve’s intent to taper asset purchases and hike interest rates.

Ahead is data on Markit manufacturing PMI (9:45 AM ET), as well as the ISM manufacturing index and construction spending (10:00 AM ET).

Graphic updated 6:30 AM ET. Sentiment Risk-On if expected /ES open is above the prior day’s range. /ES levels are derived from the profile graphic at the bottom of the following section. Levels may have changed since initially quoted; click here for the latest levels. SqueezeMetrics Dark Pool Index (DIX) and Gamma (GEX) calculations are based on where the prior day’s reading falls with respect to the MAX and MIN of all occurrences available. A higher DIX is bullish. At the same time, the lower the GEX, the more (expected) volatility. Learn the implications of volatility, direction, and moneyness. SHIFT data used for S&P 500 (INDEX: SPX) options activity. Note that options flow is sorted by the call premium spent; if more positive then more was spent on call options. Breadth reflects a reading of the prior day’s NYSE Advance/Decline indicator. VIX reflects a current reading of the CBOE Volatility Index (INDEX: VIX) from 0-100.

What To Expect

Action: On divergent intraday breadth and market liquidity metrics, the best case outcome occurred, evidenced by a spike away from value in the S&P 500 (INDEX: SPX) (ETF: SPY) (FUTURE: /ES).

Intent: The spike (and overnight gap, out of balance) mark a willingness to continue the trend.

Validation: Sideways to higher trade (above the $4,596.50 spike base) validates the market’s prevailing intent to markup prices ahead of impactful events like this week’s meeting of the Federal Open Market Committee (FOMC).

Consideration: Poor structure left behind prior initiative trade adds to technical instability.

Graphic: Divergent delta (i.e., non-committed buying as measured by volume delta or buying and selling power as calculated by the difference in volume traded at the bid and offer) in SPDR S&P 500 ETF Trust (NYSE: SPY), one of the largest ETFs that track the S&P 500 index, via Bookmap.

Context: On no substantial change in volume and expansion of range, we see the Nasdaq 100 (INDEX: NDX) (ETF: QQQ) (FUTURE: /NQ) trading strong, relative to its peers.

Given where the S&P 500’s price is in relation to the yellow volume-weighted average price (VWAP) anchored from 9/2/2021, the average buyer, since that date, is in a winning position.

Generally speaking, sideways to higher trade, above the yellow VWAP, puts in play the Fibonacci resistances overhead.

Graphic: SPDR S&P 500 ETF (NYSE: SPY) top left, Invesco QQQ Trust Series 1 (NASDAQ: QQQ) top right, iShares Russell 2000 ETF (NYSE: IWM) bottom left, SPDR Dow Jones Industrial Average ETF Trust (NYSE: DIA) bottom right. The S&P 500, in particular, is out of balance on the daily, weekly, and monthly. Key levels – SPY (S~442.00, R~461.58), QQQ (S~369.66, R~391.52), IWM (S~222.58, R~234.53) where S is support and R is resistance.

Further, the aforementioned trade is happening in the context of peak growth, in the face of inflation, uncertainty around fiscal policy (with respect to dynamics like the debt ceiling), and increased prospects of tapering to Federal Reserve (Fed) asset purchases.

The implications of these themes on price are contradictory

To elaborate, Moody’s expects the Fed to taper its asset purchases in December by $15 billion. 

Every single month after, the Fed will continue to reduce purchases by $15 billion with the tapering process expected to be done by mid-2022. Proceeds from maturing assets will be reinvested to prevent balance sheet contraction and rate hikes ought to start in early 2023.

Moody’s notes: “Tapering won’t impact inflation. Though tapering won’t be disinflationary, it could help keep market-based measures of inflation expectations anchored, since tapering is the preamble to the Fed beginning to tighten monetary policy either by allowing its balance sheet to decline and/or by increasing the target range for the fed funds rate.”

In terms of positioning, according to SqueezeMetrics, “middling dark pool sentiment and middling gamma exposure [portends] … 1-month negative returns.”

At the same time, SpotGamma models forecast hedging (by dealers who warehouse options risk) may promote tighter ranges as dealers sell into strength, increasingly. Until event volatility leaves the market, post-FOMC, odds of directional resolve will continue to be limited as higher implied volatility takes away from important dynamics that bolster movement.

Couple that with the intent to normalize policy, the environment “creates a little bit of a challenge for [the] equity market because it does change the drivers of equity performance,” says HSBC Holdings Plc’s (NYSE: HSBC) Joseph Little.

Graphic: A “gentle reminder of the fact tapering matters,” via The Market Ear.

Expectations: As of 6:30 AM ET, Monday’s regular session (9:30 AM – 4:00 PM ET), in the S&P 500, will likely open in the upper part of a positively skewed overnight inventory, outside of prior-range and -value. This suggests a potential for immediate directional opportunity.

Gap Scenarios: Gaps ought to fill quickly. Should they not, that’s a signal of strength; do not fade. Leaving value behind on a gap-fill or failing to fill a gap (i.e., remaining outside of the prior session’s range) is a go-with indicator.

Auctioning and spending at least 1-hour of trade back in the prior range suggests a lack of conviction; in such a case, do not follow the direction of the most recent initiative activity.

In the best case, the S&P 500 trades sideways or higher; activity above the $4,596.50 spike base puts in play the $4,618.50 Fibonacci resistance. Initiative trade beyond $4,618.50 could reach as high as the $4,639.00 and $4,664.75 Fibonacci resistances, or higher.

In the worst case, the S&P 500 trades lower; activity below the $4,596.50 spike base puts in play the $4,574.25 high volume area (HVNode). Initiative trade beyond the HVNode could reach as low as the $4,551.75 low volume area (LVNode) and $4,526.25 HVNode, or lower.

Click here to load today’s updated key levels into the web-based TradingView charting platform. Note that all levels are derived using the 65-minute timeframe. New links are produced, daily.
Graphic: 65-minute profile chart of the Micro E-mini S&P 500 Futures. Learn about the profile.

What People Are Saying

Definitions

Spikes: Spike’s mark the beginning of a break from value. Spikes higher (lower) are validated by trade at or above (below) the spike base (i.e., the origin of the spike).

Volume Areas: A structurally sound market will build on areas of high volume (HVNodes). Should the market trend for long periods of time, it will lack sound structure, identified as low volume areas (LVNodes). LVNodes denote directional conviction and ought to offer support on any test. 

If participants were to auction and find acceptance into areas of prior low volume (LVNodes), then future discovery ought to be volatile and quick as participants look to HVNodes for favorable entry or exit.

Gamma: Gamma is the sensitivity of an option to changes in the underlying price. Dealers that take the other side of options trades hedge their exposure to risk by buying and selling the underlying. When dealers are short-gamma, they hedge by buying into strength and selling into weakness. When dealers are long-gamma, they hedge by selling into strength and buying into weakness. The former exacerbates volatility. The latter calms volatility.

Balance-Break Scenarios: A change in the market (i.e., the transition from two-time frame trade, or balance, to one-time frame trade, or trend) is occurring.

Monitor for acceptance (i.e., more than 1-hour of trade) outside of the balance area. Rejection (i.e., return inside of balance) portends a move to the opposite end of the balance.

Volume-Weighted Average Prices (VWAPs): A metric highly regarded by chief investment officers, among other participants, for quality of trade. Additionally, liquidity algorithms are benchmarked and programmed to buy and sell around VWAPs.

About

After years of self-education, strategy development, and trial-and-error, Renato Leonard Capelj began trading full-time and founded Physik Invest to detail his methods, research, and performance in the markets.

Additionally, Capelj is a Benzinga finance and technology reporter interviewing the likes of Shark Tank’s Kevin O’Leary, JC2 Ventures’ John Chambers, and ARK Invest’s Catherine Wood, as well as a SpotGamma contributor, developing insights around impactful options market dynamics.

Disclaimer

At this time, Physik Invest does not manage outside capital and is not licensed. In no way should the materials herein be construed as advice. Derivatives carry a substantial risk of loss. All content is for informational purposes only.

Categories
Commentary

Daily Brief For October 22, 2021

Editor’s Note: Due to travel commitments, the Daily Brief will not be sent 10/25-10/27.

Apologies and have a great weekend!

Market Commentary

Out of sync with bonds, equity index futures were mostly sideways to higher. Commodities were higher. Volatility compressed.

  • Ahead is manufacturing, services PMI.
  • Participants discover uncharted prices.
  • Options positioning presented tailwind.

What Happened: U.S. stock index futures, less the Nasdaq 100, auctioned sideways to higher overnight as participants looked to discover new prices.

Ahead is data on manufacturing and services PMI (9:45 AM ET), as well as Fed-speak (10:00 and 11:00 AM ET).

Graphic updated 6:40 AM ET. Sentiment Risk-On if expected /ES open is above the prior day’s range. /ES levels are derived from the profile graphic at the bottom of the following section. Levels may have changed since initially quoted; click here for the latest levels. SqueezeMetrics Dark Pool Index (DIX) and Gamma (GEX) calculations are based on where the prior day’s reading falls with respect to the MAX and MIN of all occurrences available. A higher DIX is bullish. At the same time, the lower the GEX, the more (expected) volatility. SHIFT data used for S&P 500 (INDEX: SPX) options activity. Note that options flow is sorted by the call premium spent; if more positive then more was spent on call options. Breadth reflects a reading of the prior day’s NYSE Advance/Decline indicator. VIX reflects a current reading of the CBOE Volatility Index (INDEX: VIX) from 0-100.

What To Expect: As of 6:30 AM ET, Friday’s regular session (9:30 AM – 4:00 PM EST) in the S&P 500 will likely open on a small gap, just outside of prior-range and -value, suggesting a potential for immediate directional opportunity.

Gap Scenarios: Gaps ought to fill quickly. Should they not, that’s a signal of strength; do not fade. Leaving value behind on a gap-fill or failing to fill a gap (i.e., remaining outside of the prior session’s range) is a go-with indicator.

Auctioning and spending at least 1-hour of trade back in the prior range suggests a lack of conviction; in such a case, do not follow the direction of the most recent initiative activity.

During the prior day’s regular trade, on light volume, nonparticipatory intraday breadth, and supportive market liquidity metrics, the best case outcome occurred, evidenced by upside resolve, above flattened day timeframe profile structures, or ledges.

This activity comes after prior sessions left behind numerous gaps and emotional, multiple-distribution profile structures.

Further, Thursday’s overnight gap in range, below value, set indices up for what is called the cave-fill process (characterized by repair and strengthening of low volume areas).

The day timeframe activity rejected lower prices; participants auctioned to new highs in both regular and overnight trade, putting in play a recovery of the un-adjusted overnight high (ONH) at $4,550.00.

Graphic: Supportive delta (i.e., committed buying as measured by volume delta or buying and selling power as calculated by the difference in volume traded at the bid and offer) in SPDR S&P 500 ETF Trust (NYSE: SPY), one of the largest ETFs that track the S&P 500 index, via Bookmap. The readings are supportive of initiative trade.

Zooming out, we see that though the Nasdaq 100 firmed this week, it did not recover as much ground as its peers, the S&P 500 and Dow Jones Industrial Average, both of which are trading at or above their all-time high figures. 

Graphic: SPDR S&P 500 ETF (NYSE: SPY) top left, Invesco QQQ Trust Series 1 (NASDAQ: QQQ) top right, iShares Russell 2000 ETF (NYSE: IWM) bottom left, SPDR Dow Jones Industrial Average ETF Trust (NYSE: DIA) bottom right.

This recovery has been swift and built on relatively poor – low volume – structures that ought to offer minimal support; what this simply means is that higher prices need validation.

Note: Value is defined by where 70% of the day’s trade happened, the bulk of where volume is. 

Think of the absence of high volume structures, on the way up, leaving no value to base off of. If prices are followed by value, that means that they are supported. If there is an open above (below) value, a market will auction lower (higher) in search of buyers (sellers). After auctioning too far from value, the response by higher timeframe participants will introduce single-print buying and selling tails as those participants look to take advantage of higher (lower) prices to sell (buy). 

Please read this excerpt from Mind Over Markets, for additional context.

Further, the aforementioned trade is happening in the context of improving breadth amidst a seasonally bullish cycle of contributions, rebalancing, and earnings, as well as the risks associated with a taper in asset purchases and a hike in rates.

In terms of positioning, the CBOE Volatility Index (INDEX: VIX) was lower, while the VIX futures term structure settled in contango; supply at the front end of the curve, alongside the long-gamma environment, signals a potential for near-term equity market stability.

According to SpotGamma analyses, this is where the so-called vanna (i.e., inflows as a result of options sliding down their term structure) dynamic comes to dominate. Adding, we look for increased interest in options strikes that are higher in price and further out in time.

Moreover, for today, participants may make use of the following frameworks.

In the best case, the S&P 500 trades sideways or higher; activity above the $4,525.00 untested point of control (VPOC) puts in play the $4,550.00 overnight high (ONH). Initiative trade beyond the ONH could reach as high as the $4,568.25 and $4,589.75 Fibonacci extensions, or higher.

In the worst case, the S&P 500 trades lower; activity below the $4,525.00 VPOC puts in play the $4,510.00 low volume area (LVNode). Initiative trade beyond the LVNode could reach as low as the $4,495.75 high volume area (HVNode) and $4,471.00 VPOC, or lower.

Click here to load today’s updated real-time key levels into the web-based TradingView charting platform. Please note that all levels are derived using the 65-minute timeframe.
Graphic: 65-minute profile chart of the Micro E-mini S&P 500 Futures updated 6:30 AM ET.

Definitions

Cave-Fill Process: Widened the area deemed favorable to transact at by an increased share of participants. This is a good development.

Overnight Rally Highs (Lows): Typically, there is a low historical probability associated with overnight rally-highs (lows) ending the upside (downside) discovery process.

Volume Areas: A structurally sound market will build on areas of high volume (HVNodes). Should the market trend for long periods of time, it will lack sound structure, identified as low volume areas (LVNodes). LVNodes denote directional conviction and ought to offer support on any test. 

If participants were to auction and find acceptance into areas of prior low volume (LVNodes), then future discovery ought to be volatile and quick as participants look to HVNodes for favorable entry or exit.

POCs: POCs are valuable as they denote areas where two-sided trade was most prevalent in a prior day session. Participants will respond to future tests of value as they offer favorable entry and exit.

Excess: A proper end to price discovery; the market travels too far while advertising prices. Responsive, other-timeframe (OTF) participants aggressively enter the market, leaving tails or gaps which denote unfair prices.

Ledges: Flattened area on the profile which suggests responsive participants are in control, or initiative participants lack the confidence to continue the discovery process. The ledge will either hold and force participants to liquidate (cover) their positions, or crack and offer support (resistance).

Volume-Weighted Average Prices (VWAPs): A metric highly regarded by chief investment officers, among other participants, for quality of trade. Additionally, liquidity algorithms are benchmarked and programmed to buy and sell around VWAPs.

News And Analysis

U.K. consumer confidence falls amidst cheerless news.

Growth digitalization of finance intensifying competition.

Supply issues could haunt the holidays after sales rise.

Substantial progress toward Fed’s mandates. Tapering?

Think everything’s expensive now? Wait there is more.

Big jump in home sales – impressive considering supply.

Biden: U.S. would defend Taiwan from attack by China.

Online wager, engagement key to sports betting growth.

What People Are Saying

About

After years of self-education, strategy development, and trial-and-error, Renato Leonard Capelj began trading full-time and founded Physik Invest to detail his methods, research, and performance in the markets. 

Additionally, Capelj is a finance and technology reporter. Some of his biggest works include interviews with leaders such as John Chambers, founder and CEO, JC2 Ventures, Kevin O’Leary, businessman and Shark Tank host, Catherine Wood, CEO and CIO, ARK Invest, among others.

Disclaimer

At this time, Physik Invest does not manage outside capital and is not licensed. In no way should the materials herein be construed as advice. Derivatives carry a substantial risk of loss. All content is for informational purposes only.

Categories
Commentary

Daily Brief For October 4, 2021

Market Commentary

Equity index futures were sideways to lower with bonds and the dollar.

  • Nordea: Macro backdrop worsens.
  • Ahead is a relatively light calendar.
  • October is volatile while Q4 bullish.

What Happened: U.S. stock index futures auctioned sideways to lower overnight alongside reports that China was showing little interest in a direct bailout of Evergrande and U.S. political leaders remain at odds on the debt limit.

Ahead is data on factory orders and core capital goods orders (10:00 AM ET).

Graphic updated 6:30 AM ET. Sentiment Neutral if expected /ES open is inside of the prior day’s range. /ES levels are derived from the profile graphic at the bottom of the following section. SqueezeMetrics Dark Pool Index (DIX) and Gamma (GEX) calculations are based on where the prior day’s reading falls with respect to the MAX and MIN of all occurrences available. A higher DIX is bullish. At the same time, the lower the GEX, the more (expected) volatility. SHIFT data used for S&P 500 (INDEX: SPX) options activity. Note that options flow is sorted by the call premium spent; if more positive then more was spent on call options. Breadth reflects a reading of the prior day’s NYSE Advance/Decline indicator. VIX reflects a current reading of the CBOE Volatility Index (INDEX: VIX) from 0-100.

What To Expect: As of 6:30 AM ET, Monday’s regular session (9:30 AM – 4:00 PM EST) in the S&P 500 will likely open inside of prior-range and -value, suggesting a limited potential for immediate directional opportunity.

Adding, during the prior day’s regular trade, on a strengthening of intraday breadth, among other metrics including positioning measures, the best case outcome occurred, evidenced by a recovery of Thursday’s $4,365.00 untested point of control (VPOC). 

Given the overnight response at the top of Friday’s value area – the bulk of where trade was conducted – it looks as though participants are interested in slowing the pace of downside discovery. 

Still, the S&P 500 is well below its 20- and 50-day simple moving averages and multiple distribution profile structures denote emotion, as well as a lack of commitment

Graphic: S&P 500 daily chart with 20-, 50-, and 200-day simple moving average.

Further, the aforementioned trade is happening in the context of a traditionally volatile October and a fraying in the buy-the-dip psychology.

According to Nordea, despite a calm, upward-sloping term structure, there has been “a slightly upward tilting trend” in futures tracking the S&P 500 volatility index, likely warranted by several macro reasons including a worsening in liquidity, a slowdown in growth, cost/margin problems, and risks to the Fed put.

Graphic: Fed’s GDPNow estimate lowers expectations for U.S. economic growth, via The Market Ear

LPL Research adds that aside from October, no other month has seen more 1% moves, and the fourth quarter is “historically the best for stocks, with the third quarter the worst.”

Graphic: LPL Research unpacks S&P 500 seasonality. 

Moreover, for today, given expectations of heightened volatility, participants may make use of the following frameworks.

In the best case, the S&P 500 trades sideways or higher; activity above the $4,332.25 low volume area (LVNode) puts in play the $4,363.25 high volume area (HVNode). Initiative trade beyond the HVNode could reach as high as the $4,410.25 LVNode and $4,437.75 micro composite point of control (MCPOC), or higher.

In the worst case, the S&P 500 trades lower; activity below the $4,332.25 LVNode puts in play the $4,299.00 VPOC. Initiative trade beyond the VPOC could reach as low as $4,260.00 overnight low (ONL) and $4,233.00 VPOC, or lower.

Graphic: 65-minute profile chart of the Micro E-mini S&P 500 Futures updated 6:30 AM ET.

Definitions

Overnight Rally Highs (Lows): Typically, there is a low historical probability associated with overnight rally-highs (lows) ending the upside (downside) discovery process.

Volume Areas: A structurally sound market will build on areas of high volume (HVNodes). Should the market trend for long periods of time, it will lack sound structure, identified as low volume areas (LVNodes). LVNodes denote directional conviction and ought to offer support on any test. 

If participants were to auction and find acceptance into areas of prior low volume (LVNodes), then future discovery ought to be volatile and quick as participants look to HVNodes for favorable entry or exit.

POCs: POCs are valuable as they denote areas where two-sided trade was most prevalent in a prior day session. Participants will respond to future tests of value as they offer favorable entry and exit.

MCPOCs: POCs are valuable as they denote areas where two-sided trade was most prevalent over numerous day sessions. Participants will respond to future tests of value as they offer favorable entry and exit.

Responsive Buying (Selling): Buying (selling) in response to prices below (above) an area of recent price acceptance.

Price Discovery (One-Timeframe Or Trend): Elongation and range expansion denotes a market seeking new prices to establish value, or acceptance (i.e., more than 30-minutes of trade at a particular price level).

News And Analysis

EM bond markets continue to grow, as do vulnerabilities.

There’s is no inflation without income; there’s no income.

Action on Evergrande to avoid financial, social instability.

Global growth steady as delta spurs big regional swings.

Doomsday clock for U.S. debt ticks on political clashings.

Global Credit Conditions Q4: supply strain, inflation pain.

What People Are Saying

About

After years of self-education, strategy development, and trial-and-error, Renato Leonard Capelj began trading full-time and founded Physik Invest to detail his methods, research, and performance in the markets. 

Additionally, Capelj is a finance and technology reporter. Some of his biggest works include interviews with leaders such as John Chambers, founder and CEO, JC2 Ventures, Kevin O’Leary, businessman and Shark Tank host, Catherine Wood, CEO and CIO, ARK Invest, among others.

Disclaimer

At this time, Physik Invest does not manage outside capital and is not licensed. In no way should the materials herein be construed as advice. Derivatives carry a substantial risk of loss. All content is for informational purposes only.

Categories
Commentary

Daily Brief For August 30, 2021

Market Commentary

Equity index futures, bonds, dollar, VIX sideways to higher. Commodities were mixed.

  • Positioning lightened. Ample liquidity.
  • Ahead: Data on pending home sales.

What Happened: U.S. stock index futures auctioned sideways to higher overnight alongside news that the Federal Reserve would not make changes to its policy.

Ahead is data on pending home sales (10:00 AM ET).

Graphic updated 6:30 AM ET. Sentiment Neutral if expected /ES open is inside of the prior day’s range. SqueezeMetrics Dark Pool Index (DIX) and Gamma (GEX) calculations are based on where the prior day’s reading falls with respect to the MAX and MIN of all occurrences available. A higher DIX is bullish. At the same time, the lower the GEX, the more (expected) volatility. SHIFT data used for S&P 500 (INDEX: SPX) options activity approximation. Note that options flow is sorted by the call premium spent; if more positive then more was spent on call options. Breadth reflects a reading of the prior day’s NYSE Advance/Decline indicator. VIX reflects a current reading of the CBOE Volatility Index (INDEX: VIX) from 0-100.

What To Expect: As of 6:30 AM ET, Monday’s regular session (9:30 AM – 4:00 PM EST) in the S&P 500 will likely open near prior-range and -value, suggesting a more limited potential for immediate directional opportunity.

Adding, during the prior day’s regular trade, on strong intraday breadth and lackluster market liquidity metrics, the best case outcome occurred, evidenced by new all-time highs in the S&P 500 and Nasdaq 100. This is significant because it suggests continued bullishness after a v-pattern recovery.

V-Pattern: A pattern that forms after a market establishes a high, retests some support, and then breaks above said high. In most cases, this pattern portends continuation.

Further, the aforementioned trade is happening in the context of the Federal Reserve’s commitment to stay the course with respect to monetary policy. This theme’s implications on price are supportive; to elaborate, the absence of a rate hike or taper, alongside low bond and equity market volatility, among other things, suggests liquidity will remain ample.

The key for this week is U.S. jobs data later; those metrics will allow participants to better contextualize the taper timeline. At the same time, there’s been a cooling amongst some positioning metrics, also.

Graphic: Goldman Sachs Group Inc (NYSE: GS) Sentiment Indicator. According to The Market Ear, the “indicator measures stock positioning across retail, institutional, and foreign investors versus the past 12 months. Readings below -1.0 or above +1.0 indicate extreme positions that are significant in predicting future returns.”

Moreover, for today, given poor structure, a divergent volume delta Friday, as well as a decline in metrics like DIX and GEX, the odds of significant upside volatility are lower. Still, participants may make use of the following objective frameworks for today’s trade.

In the best case, the S&P 500 trades sideways or higher; activity above the $4,513.50 overnight high (ONH) puts in play the $4,520.25 Fibonacci extension. Initiative trade beyond the Fibonacci level could reach as high as $4,556.25 and $4,592.25, two other key Fibonacci extensions.

In the worst case, the S&P 500 trades lower; activity below the $4,513.50 ONH puts in play the $4,495.00 high volume area (HVNode). Initiative trade beyond the $4,495.00 HVNode could reach as low as the $4,481.75 HVNode and $4,454.25 LVNode, or lower. 

To note, the $4,454.25 LVNode corresponds with an anchored volume-weighted average price (VWAP), a metric highly regarded by chief investment officers, among other participants, for quality of trade. Additionally, liquidity algorithms are benchmarked and programmed to buy and sell around VWAPs.

Overnight Rally Highs (Lows): Typically, there is a low historical probability associated with overnight rally-highs (lows) ending the upside (downside) discovery process.

Volume Areas: A structurally sound market will build on past areas of high volume. Should the market trend for long periods of time, it will lack sound structure (identified as a low volume area which denotes directional conviction and ought to offer support on any test). 

If participants were to auction and find acceptance into areas of prior low volume, then future discovery ought to be volatile and quick as participants look to areas of high volume for favorable entry or exit.

Volume Delta: Buying and selling power as calculated by the difference in volume traded at the bid and offer.

DIX: For every buyer is a seller (usually a market maker). Using DIX — which is derived from short sales (i.e., liquidity provision on the market-making side) — we can measure buying pressure.

Gamma: Gamma is the sensitivity of an option to changes in the underlying price. Dealers that take the other side of options trades hedge their exposure to risk by buying and selling the underlying. When dealers are short-gamma, they hedge by buying into strength and selling into weakness. When dealers are long-gamma, they hedge by selling into strength and buying into weakness. The former exacerbates volatility. The latter calms volatility.
Graphic: 65-minute profile chart of the Micro E-mini S&P 500 Futures updated 6:30 AM ET.

News And Analysis

Banks are effectively sterilizing central bank liquidity.

Morgan Stanley eyes mid-cycle transition, correction.

An options turn upheavals into mid-month sure thing.

Ida made landfall in Louisiana, stronger than Katrina.

Sustained vaccine demand to support pharma growth.

Billionaire Paulson is calling cryptocurrency a bubble.

Crypto nomads – surfing the world for risk and profit.

Cadano’s Ada is the latest cryptocurrency surging up.

What People Are Saying

About

After years of self-education, strategy development, and trial-and-error, Renato Leonard Capelj began trading full-time and founded Physik Invest to detail his methods, research, and performance in the markets. 

Additionally, Capelj is a finance and technology reporter. Some of his biggest works include interviews with leaders such as John Chambers, founder and CEO, JC2 Ventures, Kevin O’Leary, businessman and Shark Tank host, Catherine Wood, CEO and CIO, ARK Invest, among others.

Disclaimer

At this time, Physik Invest does not manage outside capital and is not licensed. In no way should the materials herein be construed as advice. Derivatives carry a substantial risk of loss. All content is for informational purposes only.

Categories
Commentary

Daily Brief For July 27, 2021

Market Commentary

Led by the Russell 2000, U.S. equity index futures explored lower overnight.

  • Risk-off everything China-related.
  • Ahead: Data dump and earnings.
  • S&P stuck in range, VWAP pinch.

What Happened: U.S. stock index futures auctioned sideways to lower as equity weakness in China deepened. Chinese government bonds and the yuan fell also, alongside fears that U.S. funds are selling Hong Kong and China assets aggressively.

In light of the volatility, Crescat Capital portfolio manager Otavio Costa tweeted: “A yuan devaluation is one of the main deflationary risks today. I know you heard this over and over again… but something is indeed unraveling. Chinese banks and ADRs are in big trouble. PBOC will be forced to act.”

A devaluation is indeed something to fear. The People’s Bank of China (PBOC) roiled global equity markets after its 2015 yuan devaluation.

In addition to this context, ahead, participants will receive data on durable and nondefense capital good orders, the S&P Case-Shiller home price index, consumer confidence, housing vacancies, as well as Apple Inc (NASDAQ: AAPL), Microsoft Corporation (NASDAQ: MSFT), and Alphabet Inc (NASDAQ: GOOGL) earnings.

Graphic updated 6:40 AM ET. Sentiment Neutral if expected /ES open is inside of the prior day’s range. See here for more on the Dark Pool Index and Gamma. A positive Dark Pool Index reading is bullish. At the same time, the higher (lower) the gamma, the less (more) volatility. SHIFT Search data used for options activity. Note that options flow is sorted by the call premium spent; if green and more (less) positive then more (less) was spent on call options. Breadth reflects a reading of the prior day’s Advance/Decline indicator.

What To Expect: As of 6:40 AM ET, Tuesday’s regular session (9:30 AM – 4:00 PM EST) in the S&P 500 will likely open inside of prior-range and -value, suggesting a limited potential for immediate directional opportunity.

After establishing a new high – $4,416.75 – overnight, weakness in China spilled over; U.S. equity index futures, led by the Russell 2000, traded lower in conjunction with yields, a boost to the tech- and growth-heavy Nasdaq 100.

Rates: Low rates have to potential to increase the present value of future earnings making stocks, especially those that are high growth, more attractive. To note, inflation and rates move inversely to each other. Low rates stimulate demand for loans (i.e., borrowing money is more attractive). In conjunction with the rapid recovery, lower rates may solicit hawkish commentary as policymakers look to inhibit inflation.

To note, Monday’s trade happened on positive, albeit weak breadth, similar to Friday’s session. At the same time, a Volume Weighted Average Price pinch developed.

Volume Weighted Average Price (VWAP): A metric highly regarded by chief investment officers, among other participants, for quality of trade. Additionally, liquidity algorithms are benchmarked and programmed to buy and sell around VWAPs. ​​

Look to buy above a flat/rising VWAP pinch. Sell below a flat/declining VWAP pinch.

All that said, similar to Monday, a key thing to watch for is an auction failure and subsequent liquidation break, confirmed by trade below the $4,372.50 regular trade low (RTH Low).

Liquidation Breaks: The profile shape suggests participants were “too” long and had poor location.

Moreover, for today, participants can trade from the following frameworks. 

In the best case, the S&P 500 trades sideways or higher; activity above the $4,398.75 high volume area (HVNode) pivot puts in play the $4,408.75 low volume area (LVNode). Initiative trade beyond the LVNode could reach as high as the $4,416.75 overnight high (ONH) and $4,428.25 Fibonacci extension.

In the worst case, the S&P 500 trades lower; activity below the $4,398.75 HVNode pivot puts in play the $4,390.50 minimal excess low. Initiative trade beyond the $4,390.50 low could reach as low as the $4,374.25 HVNode and $4,353.00 untested Point of Control (VPOC).

Volume Areas: A structurally sound market will build on past areas of high volume. Should the market trend for long periods of time, it will lack sound structure (identified as a low volume area which denotes directional conviction and ought to offer support on any test). 

If participants were to auction and find acceptance into areas of prior low volume, then future discovery ought to be volatile and quick as participants look to areas of high volume for favorable entry or exit.

Overnight Rally Highs (Lows): Typically, there is a low historical probability associated with overnight rally-highs (lows) ending the upside (downside) discovery process.

Excess: A proper end to price discovery; the market travels too far while advertising prices. Responsive, other-timeframe (OTF) participants aggressively enter the market, leaving tails or gaps which denote unfair prices.

POCs: POCs are valuable as they denote areas where two-sided trade was most prevalent. Participants will respond to future tests of value as they offer favorable entry and exit.
Graphic: 65-minute profile chart of the Micro E-mini S&P 500 Futures. Graphic updated 6:40 AM ET.

News And Analysis

China’s yuan, bonds tank amid fears of foreign selling.

U.S. infrastructure talks are encountering some snags.

Bitcoin steady below $40,000 on Amazon speculation.

Hypothetical look at 35 years of SPX option strategies.

The Federal Reserve meeting starts today. Watch this.

What People Are Saying

About

After years of self-education, strategy development, and trial-and-error, Renato Leonard Capelj began trading full-time and founded Physik Invest to detail his methods, research, and performance in the markets. Additionally, Capelj is a finance and technology reporter. Some of his biggest works include interviews with leaders such as John Chambers, founder and CEO, JC2 Ventures, Kevin O’Leary, businessman and Shark Tank host, Catherine Wood, CEO and CIO, ARK Invest, among others.

Disclaimer

At this time, Physik Invest does not manage outside capital and is not licensed. In no way should the materials herein be construed as advice. Derivatives carry a substantial risk of loss. All content is for informational purposes only.

Categories
Commentary

Daily Brief For July 14, 2021

Market Commentary

U.S. equity index futures sideways overnight.

  • Dems agree to $3.5T tax, spending plan.
  • Fed Chair Powell semi-annual testimony.
  • Earnings begin with a bang and continue.
  • Equity indexes mixed; sideways to lower.

What Happened: U.S. stock index futures resolved lower after underlying breadth metrics failed to support the post-CPI recovery.

Thereafter, indices traded sideways overnight alongside news Senate Democrats on the Budget Committee agreed to a $3.5 trillion spending bill. The bill would carry President Biden’s economic agenda without Republican support. 

Ahead, participants are expecting testimony by Federal Reserve Chair Jerome Powell, earnings releases from heavily weighted index constituents, as well as the latest Fed Beige Book.

Graphic updated 6:44 AM ET.

What To Expect: Wednesday’s regular session (9:30 AM – 4:00 PM EST) in the S&P 500 will likely open just inside of prior-range and -value, suggesting a limited potential for immediate directional opportunity.

Adding, during the prior day’s regular trade, the worst-case outcome occurred, evidenced by an intraday liquidation break and the subsequent acceptance below a Volume Weighted Average Price (VWAP) anchored from the CPI release (blue in color on the below profile graphic).

Liquidation Breaks: The profile shape suggests participants were “too” long and had poor location. Such dynamic offers responsive buyers (initiative sellers) favorable entry (exit).

Volume-Weighted Average Prices (VWAPs): A metric highly regarded by chief investment officers, among other participants, for quality of trade. Additionally, liquidity algorithms are benchmarked and programmed to buy and sell around VWAPs.

Prior to the liquidation, breadth metrics were firmly negative. Despite what appeared to be a strong recovery post-CPI, internal divergences via breadth metrics became more pronounced, while profile dynamics revealed weak commitment at higher prices and an abundance of poor structures (e.g., low-volume areas). 

Graphic: Equity index leaders rose in price as internal divergences – like the ratio of advancers to decliners – grew. Noting a bigger divergence in internals tracking Nasdaq issues. 

This push-pull and divergence comes ahead of the options expiration (OPEX) cycle which starts on the third Friday of each month (July 16). Associated hedging forces make it so there’s more liquidity and less movement. In other words, the market tends to pin.

Options Expiration (OPEX): Option expiries mark an end to pinning (i.e, the theory that market makers and institutions short options move stocks to the point where the greatest dollar value of contracts will expire worthless) and the reduction dealer gamma exposure.

Gamma: Gamma is the sensitivity of an option to changes in the underlying price. Dealers that take the other side of options trades hedge their exposure to risk by buying and selling the underlying. When dealers are short-gamma, they hedge by buying into strength and selling into weakness. When dealers are long-gamma, they hedge by selling into strength and buying into weakness. The former exacerbates volatility. The latter calms volatility.

Thereafter, according to SpotGamma, “[t]he week after expiration the market tends to experience its largest intraday volatility which corresponds to the reduction in large options positions, and the hedging associated with them.”

Graphic: Volatility before and after OPEX, via SpotGamma.

For today, participants can trade from the following frameworks. 

In the best case, the S&P 500 trades sideways or higher; activity above the $4,365.75 low volume area (LVNode) pivot puts in play the $4,375.00 untested Point of Control (POC), first. Then, the $4,383.75 regular trade high (RTH High) and $4,398.50 Fibonacci extension come into play.

In the worst case, the S&P 500 trades lower; activity below the $4,365.75 LVNode pivot puts in play the $4,353.25 LVNode. Trade beyond that figure puts in play the high volume areas (HVNodes) at $4,343.25 and $4,314.75.

Significance Of Prior ATHs, ATLs: Prices often encounter resistance (support) at prior highs (lows) due to the supply (demand) of old business. These areas take time to resolve. Breaking and establishing value (i.e., trading more than 30-minutes beyond this level) portends continuation.

POCs: POCs are valuable as they denote areas where two-sided trade was most prevalent. Participants will respond to future tests of value as they offer favorable entry and exit.

Volume Areas: A structurally sound market will build on past areas of high volume. Should the market trend for long periods of time, it will lack sound structure (identified as a low volume area which denotes directional conviction and ought to offer support on any test). 

If participants were to auction and find acceptance into areas of prior low volume, then future discovery ought to be volatile and quick as participants look to areas of high volume for favorable entry or exit.
Graphic: 65-minute profile chart of the Micro E-mini S&P 500 Futures.
Graphic: Daily candlestick charts of the S&P 500 (top left), Nasdaq 100 (top right), Russell 2000 (bottom left), and Dow Jones Industrial Average (bottom right).
Graphic: SHIFT search suggests participants were most interested in call strikes at and below the price in the cash-settled S&P 500 (INDEX: SPX) and Nasdaq 100 (INDEX: NDX), yesterday. Noting, yesterday and over the past few weeks, there’s been increased activity in long-dated put options. 

News And Analysis

Politics | Senate Democrats Agree to $3.5T tax, spending plan. (BBG)

Markets | ‘A free put on the market’: CIO on volatility dislocation. (BZ)

Energy | OPEC reaches agreement with UAE over oil production. (WSJ)

Economy | Weekly mortgage refinances spike 20% on rate drop. (CNBC)

Mobility | EU set to call time on combustion engine in decades. (REU)

Economy | Broker says NYC’s real estate market is heating up. (CNBC)

Markets | Delta posts first profit since 2019 on aid, better revenue. (CNBC)

Economy | China’s GDP and the five things to keep an eye on. (FT)

Economy | Inflation climbs higher than expected; CPI up 5.4%. (CNBC)

Markets | Goldman, JPM pivot to M&A amid fading trade boom. (FT)

Mobility | Norwegian Cruise Line sues on vaccine passport ban. (CNBC)

Politics | China deals another blow to its cryptocurrency miners. (BBG)

Markets | Wood sells China tech stocks, warns of valuation reset. (BBG)

Economy | JPMorgan Chase CEO uber bullish on U.S. consumers. (Axios)

What People Are Saying

About

Renato founded Physik Invest after going through years of self-education, strategy development, and trial-and-error. His work reporting in the finance and technology space, interviewing leaders such as John Chambers, founder, and CEO, JC2 Ventures, Kevin O’Leary, businessman and Shark Tank host, Catherine Wood, CEO and CIO, ARK Invest, among others, afforded him the perspective and know-how very few come by.

Having worked in engineering and majored in economics, Renato is very detailed and analytical. His approach to the markets isn’t built on hope or guessing. Instead, he leverages the unique dynamics of time and volatility to efficiently act on opportunity.

Disclaimer

At this time, Physik Invest does not manage outside capital and is not licensed. In no way should the materials herein be construed as advice. Derivatives carry a substantial risk of loss. All content is for informational purposes only.

Categories
Commentary

Daily Brief For July 12, 2021

Market Commentary

U.S. equity index futures sideways overnight.

  • PBOC cut RRR, tax talk, and virus.
  • Ahead: WASDE, Fed speak, G20.
  • SPX, RUT, DJI weak. NDX firmed.

What Happened: U.S. stock index futures auctioned within prior range alongside news the ECB would revise forward guidance and maintain asset purchases until “at least” March of 2022. 

Additionally, the People’s Bank of China made a 50 basis-point cut to the reserve ratio at most banks given a weakened economic outlook. At the same time, G20 finance ministers are meeting over a global tax agreement and some concerns were raised over the spread of COVID-19 variants.

Ahead is the WASDE crop report for July and Fed speak by Neel Kashkari. Later, Janet Yellen will meet with finance ministers in Brussels. 

Graphic updated 6:55 AM ET.

What To Expect: Monday’s regular session (9:30 AM – 4:00 PM EST) in the S&P 500 will likely open inside of prior-range and -value, suggesting a limited potential for immediate directional opportunity.

Adding, last week, U.S. stock index futures auctioned sideways to higher, only after enduring a brief liquidation alongside anxieties surrounding the spread of COVID-19 variants, as well as an evolution in monetary policy. 

Expectations into the middle of July call for a supported S&P 500; thereafter, the window for fundamental dynamics to take over is opened

According to SpotGamma, “[t]he week after [options] expiration the market tends to experience its largest intraday volatility which corresponds to the reduction in large options positions, and the hedging associated with them.”

Graphic: Volatility before and after OPEX, via SpotGamma.

These expectations of increased volatility line up with the busy earnings season, kicked off by banks reporting second-quarter results this week. Additionally, a focus for participants in the coming days are some releases on consumer, producer, and import prices, as well as industrial production, consumer sentiment, and retail sales.

For today, participants can trade from the following frameworks. 

In the best case, the S&P 500 trades sideways or higher; activity above the high volume area (HVNode) pivot at $4,341.75 puts in play the $4,353.25 low volume area (LVNode). Trade beyond that signpost could reach as high as the $4,365.50 overnight high (ONH) and $4,373.00 Fibonacci extension.

In the worst case, the S&P 500 trades lower; activity below $4,341.75 puts in play the $4,314.75 HVNode. Initiative trade beyond that signpost could reach as low as the $4,291.00 untested Point of Control (POC) and $4,256.75 HVNode.

Volume Areas: A structurally sound market will build on past areas of high volume. Should the market trend for long periods of time, it will lack sound structure (identified as a low volume area which denotes directional conviction and ought to offer support on any test). 

If participants were to auction and find acceptance into areas of prior low volume, then future discovery ought to be volatile and quick as participants look to areas of high volume for favorable entry or exit.

Overnight Rally Highs (Lows): Typically, there is a low historical probability associated with overnight rally-highs (lows) ending the upside (downside) discovery process.

POCs: POCs are valuable as they denote areas where two-sided trade was most prevalent. Participants will respond to future tests of value as they offer favorable entry and exit.
Graphic: 65-minute profile chart of the Micro E-mini S&P 500 Futures.
Graphic: Weekly candlestick charts of the S&P 500 (top left), Nasdaq 100 (top right), Russell 2000 (bottom left), and Dow Jones Industrial Average (bottom right).
Graphic: SHIFT search suggests participants were most interested in call strikes at and below the price in the cash-settled S&P 500 (INDEX: SPX) and Nasdaq 100 (INDEX: NDX), last week. Noting, over the past few weeks, there’s been increased activity in long-dated put options.

News And Analysis

Economy | Global tax overhaul gains steam as G20 backs new levies. (NYT)

FinTech | Once Robinhood ‘house money’ gone, trading to lose allure. (NI)

FinTech | On crypto exchanges, the trades do not always add up right. (BBG)

Markets | Dealmakers see M&A rush, then chills, on antitrust progress. (REU)

Economy | China’s rate cut points to weaker than expected economy. (BBG)

FinTech | Square CEO doubles down on crypto, adds hardware wallet. (FL)

Economy | Recovery diminishes risks for reducing pandemic support. (Moody’s)

Energy | Oil prices loom over Biden’s bid to throttle drilling right sales. (BBG)

Economy | ECB’s Lagarde foresees a July policy shift, 2022 transition. (BBG)

What People Are Saying

About

Renato founded Physik Invest after going through years of self-education, strategy development, and trial-and-error. His work reporting in the finance and technology space, interviewing leaders such as John Chambers, founder, and CEO, JC2 Ventures, Kevin O’Leary, businessman and Shark Tank host, Catherine Wood, CEO and CIO, ARK Invest, among others, afforded him the perspective and know-how very few come by.

Having worked in engineering and majored in economics, Renato is very detailed and analytical. His approach to the markets isn’t built on hope or guessing. Instead, he leverages the unique dynamics of time and volatility to efficiently act on opportunity.

 Disclaimer

At this time, Physik Invest does not manage outside capital and is not licensed. In no way should the materials herein be construed as advice. Derivatives carry a substantial risk of loss. All content is for informational purposes only.

Categories
Commentary

Daily Brief For June 29, 2021

Market Commentary

Equity index futures diverge, trade sideways.

  • COVID variants cause lockdowns.
  • Ahead are some economic reports.
  • RUT, DJI firming. SPX, NDX weak.

What Happened: U.S. stock index futures auctioned sideways ahead of some key releases. The Russell 2000 and Dow Jones Industrial Average firmed up relative to their peers, the S&P 500 and Nasdaq 100, the group leader.

This activity comes as banks boosted their dividends and uncertainties surrounding the COVID-19 delta-variant. Some reports suggest nearly half of Australia’s population is in lockdown, while Asian countries are looking to reduce the spread with mobility restrictions. Still, not all news is bad; some European countries are lifting restrictions on travel and OPEC may increase the supply of oil.

Of interest today is data around home prices, consumer confidence, and Fed speak.

Graphic updated 7:20 AM ET.

What To Expect: Tuesday’s regular session (9:30 AM – 4:00 PM EST) in the S&P 500 will likely open inside of prior-range and -value, suggesting a limited potential for immediate directional opportunity.

Adding, during the prior day’s regular trade, the best case outcome occurred, evidenced by initiative trade above the $4,257.00 Point of Control (POC), up to a new overnight high (ONH) at $4,283.00.

POCs: POCs are valuable as they denote areas where two-sided trade was most prevalent. Participants will respond to future tests of value as they offer favorable entry and exit.

Overnight Rally Highs (Lows): Typically, there is a low historical probability associated with overnight rally-highs (lows) ending the upside (downside) discovery process.

Prior to getting onto what’s expected for today’s trade, it is important to note some ongoing activity in the options market. Specifically, participants, despite their commitment to higher prices (as evidenced by longer-dated call activity), are likely hedging against near-term risks, like the Jackson Hole Economic symposium used in the past to signal monetary policy changes (see the graphic below for more detail). This hedging, in conjunction with lackluster breadth and poor expansion of range, cautions participants on increased volatility; a focus should be made on relatively strong issues.

Further, for today, participants can trade from the following frameworks. 

In the best case, the S&P 500 trades sideways or higher; activity above the $4,271.00 POC puts in play the $4,283.00 ONH. Initiative trade beyond the ONH could reach as high as the $4,294.75 Fibonacci-derived price target. 

In the worst case, the S&P 500 trades lower; activity below $4,271.00 puts in play the HVNodes at $4,256.75, $4,239.50, and $4,229.00.

Volume Areas: A structurally sound market will build on past areas of high volume. Should the market trend for long periods of time, it will lack sound structure (identified as a low volume area which denotes directional conviction and ought to offer support on any test). 

If participants were to auction and find acceptance into areas of prior low volume, then future discovery ought to be volatile and quick as participants look to areas of high volume for favorable entry or exit.
Graphic: 65-minute profile chart of the Micro E-mini S&P 500 Futures. Notice (1) increased churn at higher prices, (2) minimal excess on composite profile, (3) poor expansion of range, as well as (4) poor, and rather unsupportive, low volume structures beneath current price. 
Graphic: Daily candlestick charts of the S&P 500 (top left), Nasdaq 100 (top right), Russell 2000 (bottom left), and Dow Jones Industrial Average (bottom right). 
Graphic: SHIFT search suggests participants were committing the most capital to call strikes at and below current prices in the cash-settled S&P 500 Index (INDEX: SPX) and Nasdaq 100 (INDEX: NDX), last week. This activity may denote (1) stock replacement, (2) hedges for underlying short positions, or (3) speculation on the upside. Also, there was a meaningful bid in September puts on the S&P 500. This dynamic suggests participants, despite their commitment to higher prices, are hedging against near-term risks, like the Jackson Hole Economic Symposium.

News And Analysis

Economy | The Bank of Japan cuts some bond purchase targets. (BBG)

Markets | BlackRock warns U.S. stocks at risk from higher taxes. (BBG)

Markets | United Airlines confirmed 270 Boeing, Airbus jet order. (REU)

Markets | Wall Street funnels cash to investors post-stress-tests. (BBG)

Markets | FTC Facebook ruling slams brakes on tech’s legal foes. (Axios)

What People Are Saying

Innovation And Emerging Trends

FinTech | State Street is building out data and digital experiences. (BZ)

FinTech | Robinhood CEO backs SEC market modernization vision. (MI)

FinTech | ICAP launching crypto platform with Fidelity, StanChart. (BBG)

FinTech | JPMorgan buys an ESG investing platform, OpenInvest. (CNBC)

Markets | Cathie Wood’s ARK Invest to create bitcoin ETF, ‘ARKB’. (CNBC)

FinTech | Deutsche Boerse is buying Swiss fintech Crypto Finance. (REU)

About

Renato founded Physik Invest after going through years of self-education, strategy development, and trial-and-error. His work reporting in the finance and technology space, interviewing leaders such as John Chambers, founder, and CEO, JC2 Ventures, Kevin O’Leary, businessman and Shark Tank host, Catherine Wood, CEO and CIO, ARK Invest, among others, afforded him the perspective and know-how very few come by.

Having worked in engineering and majored in economics, Renato is very detailed and analytical. His approach to the markets isn’t built on hope or guessing. Instead, he leverages the unique dynamics of time and volatility to efficiently act on opportunity.

Disclaimer

At this time, Physik Invest does not manage outside capital and is not licensed. In no way should the materials herein be construed as advice. Derivatives carry a substantial risk of loss. All content is for informational purposes only.

Categories
Commentary

Daily Brief For June 25, 2021

Market Commentary

Equity index futures balance, struggle in discovering higher prices.

  • Bipartisan agreement on infrastructure.
  • Ahead is income, spending, sentiment.
  • SPX struggles. NDX weak at key level.

What Happened: U.S. stock index futures auctioned sideways to higher alongside some positive economic and political developments.

President Biden announced an agreement on infrastructure which still faces opposition in Congress. Additionally, Federal Reserve bank stress tests went well, a boon for financials. 

Today, participants will receive data on U.S. personal income and spending, Core PCE, as well as University of Michigan sentiment. Also, please be aware that Fed’s Mester, Rosengren, and Williams will speak later today.

Graphic updated 7:30 AM ET.

What To Expect: Friday’s regular session (9:30 AM – 4:00 PM EST) in the S&P 500 will likely open inside of prior-range and -value, suggesting a limited potential for immediate directional opportunity.

Adding, during the prior day’s regular trade, the best case outcome occurred, evidenced by sideways trade above the $4,251.25 high volume area (HVNode), up to the prior overnight high (ONH) at $4,258.00.

Volume Areas: A structurally sound market will build on past areas of high volume. Should the market trend for long periods of time, it will lack sound structure (identified as a low volume area which denotes directional conviction and ought to offer support on any test). 

If participants were to auction and find acceptance into areas of prior low volume, then future discovery ought to be volatile and quick as participants look to areas of high volume for favorable entry or exit.

Overnight Highs (Lows): Typically, there is a low historical probability associated with overnight rally-highs (lows) ending the upside (downside) discovery process.

Further, earlier in the week, participants saw strong initiative activity to the upside. Later, the S&P 500 took out its all-time-high (ATH) at $4,258.00, and the Nasdaq 100 found responsive sellers at a zone of overlapping Fibonacci-derived price targets. 

That said, this price action comes alongside narrow breadth; according to Bloomberg, while the broader market is near ATHs, the “[l]owest % of stocks above 50-dma since 1999, when S&P hits record.”

With those dynamics in mind, in conjunction with potentially unsupportive market liquidity metrics and trade in the options market, participants can expect more of the same: pinning, or sideways chop.

Moreover, for today, participants can trade from the following frameworks. 

In the best case, the S&P 500 trades sideways or higher; activity above $4,257.25 – yesterday’s fairest price, or Point Of Control (POC) – puts in play the $4,264.25 ONH. Initiative trade beyond the ONH could reach as high as the $4,277.00 and $4,294.75 Fibonacci-derived price targets. 

Point of Control (POCs): POCs are valuable as they denote areas where two-sided trade was most prevalent. Participants will respond to future tests of value as they offer favorable entry and exit.

In the worst case, the S&P 500 trades lower; activity below $4,257.25 puts in play the $4,239.75 HVNode. Thereafter, if lower, participants ought to look for a response near the untested POC at $4,229.00. Below that level, caution. Odds could favor a move as low as the HVNode at $4,213.00.

Graphic: 65-minute profile chart of the Micro E-mini S&P 500 Futures. Updated 7:20 AM ET.
Graphic: Daily candlestick charts of the S&P 500 (top left), Nasdaq 100 (top right), Russell 2000 (bottom left), and Dow Jones Industrial Average (bottom right). Nasdaq’s relative strength weakens. Updated 7:30 AM ET.
Graphic: SHIFT search suggests participants were committing the most capital to call strikes at and below current prices in the cash-settled S&P 500 Index (INDEX: SPX) and Nasdaq 100 (INDEX: NDX), yesterday. This activity may denote (1) stock replacement, (2) hedges for underlying short positions, or (3) speculation on the upside. Noting, similar to the two days prior, there was increased interest in farther-dated put strikes at and above current prices. This may denote opportunistic hedging or speculation on the downside.

News And Analysis

Economy | Biden infrastructure win ramps fight on economic agenda. (BBG)

Markets | Major European banks’ 2H21 earnings: structural challenges. (Fitch)

Markets | U.S. banks gear up for buyback bonanza after passing tests. (FT)

Travel | The U.K. expands ‘Green’ list as German urges more caution. (BBG)

Politics | Senior NATO officer warns of China’s ‘shocking’ military moves. (FT)

Markets | Visa to acquire open banking platform Tink for more than $2B. (TC)

Markets | Virgin Galactic cleared by FAA to fly customers into space. (BBG)

Markets | SCOTUS has decided not to light the housing market on fire. (Vox)

Markets | U.S. ban to have only limited impact on China’s solar industry. (BBG)

Trade | More container ships score ‘astronomical’ $100,000/day rates. (FW)

Markets | SpotGamma: Finding your next gamma squeeze candidate. (SG)

What People Are Saying

Innovation And Emerging Trends

FinTech | China crushed Jack Ma, and his fintech rivals are up next. (BBG)

Markets | Citi: Global investment is becoming less reliant on China. (BBG)

Politics | Polls unpack America’s continued move toward socialism. (Axios)

Economy | Hyun Song Shin on CBDCs and future of central banking. (BBG)

Mobility | Apple’s car obsession is all about taking eyes off the road. (BBG)

About

Renato founded Physik Invest after going through years of self-education, strategy development, and trial-and-error. His work reporting in the finance and technology space, interviewing leaders such as John Chambers, founder, and CEO, JC2 Ventures, Kevin O’Leary, businessman and Shark Tank host, Catherine Wood, CEO and CIO, ARK Invest, among others, afforded him the perspective and know-how very few come by.

Having worked in engineering and majored in economics, Renato is very detailed and analytical. His approach to the markets isn’t built on hope or guessing. Instead, he leverages the unique dynamics of time and volatility to efficiently act on opportunity.

Disclaimer

At this time, Physik Invest does not manage outside capital and is not licensed. In no way should the materials herein be construed as advice. Derivatives carry a substantial risk of loss. All content is for informational purposes only.