
Market Commentary
Equity index futures, bonds, dollar, VIX sideways to higher. Commodities were mixed.
- Positioning lightened. Ample liquidity.
- Ahead: Data on pending home sales.
What Happened: U.S. stock index futures auctioned sideways to higher overnight alongside news that the Federal Reserve would not make changes to its policy.
Ahead is data on pending home sales (10:00 AM ET).
What To Expect: As of 6:30 AM ET, Monday’s regular session (9:30 AM – 4:00 PM EST) in the S&P 500 will likely open near prior-range and -value, suggesting a more limited potential for immediate directional opportunity.
Adding, during the prior day’s regular trade, on strong intraday breadth and lackluster market liquidity metrics, the best case outcome occurred, evidenced by new all-time highs in the S&P 500 and Nasdaq 100. This is significant because it suggests continued bullishness after a v-pattern recovery.
V-Pattern: A pattern that forms after a market establishes a high, retests some support, and then breaks above said high. In most cases, this pattern portends continuation.
Further, the aforementioned trade is happening in the context of the Federal Reserve’s commitment to stay the course with respect to monetary policy. This theme’s implications on price are supportive; to elaborate, the absence of a rate hike or taper, alongside low bond and equity market volatility, among other things, suggests liquidity will remain ample.
The key for this week is U.S. jobs data later; those metrics will allow participants to better contextualize the taper timeline. At the same time, there’s been a cooling amongst some positioning metrics, also.
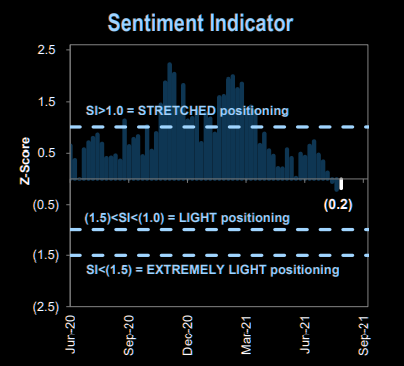
Moreover, for today, given poor structure, a divergent volume delta Friday, as well as a decline in metrics like DIX and GEX, the odds of significant upside volatility are lower. Still, participants may make use of the following objective frameworks for today’s trade.
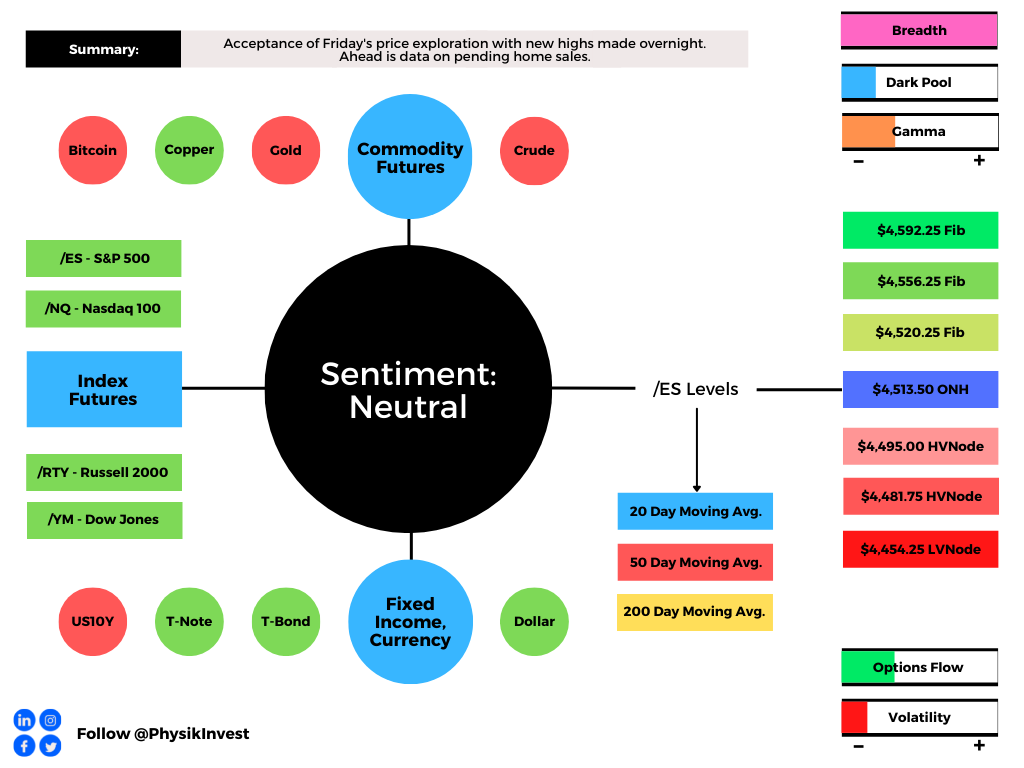
In the best case, the S&P 500 trades sideways or higher; activity above the $4,513.50 overnight high (ONH) puts in play the $4,520.25 Fibonacci extension. Initiative trade beyond the Fibonacci level could reach as high as $4,556.25 and $4,592.25, two other key Fibonacci extensions.
In the worst case, the S&P 500 trades lower; activity below the $4,513.50 ONH puts in play the $4,495.00 high volume area (HVNode). Initiative trade beyond the $4,495.00 HVNode could reach as low as the $4,481.75 HVNode and $4,454.25 LVNode, or lower.
To note, the $4,454.25 LVNode corresponds with an anchored volume-weighted average price (VWAP), a metric highly regarded by chief investment officers, among other participants, for quality of trade. Additionally, liquidity algorithms are benchmarked and programmed to buy and sell around VWAPs.
Overnight Rally Highs (Lows): Typically, there is a low historical probability associated with overnight rally-highs (lows) ending the upside (downside) discovery process.

Volume Areas: A structurally sound market will build on past areas of high volume. Should the market trend for long periods of time, it will lack sound structure (identified as a low volume area which denotes directional conviction and ought to offer support on any test).

If participants were to auction and find acceptance into areas of prior low volume, then future discovery ought to be volatile and quick as participants look to areas of high volume for favorable entry or exit.

Volume Delta: Buying and selling power as calculated by the difference in volume traded at the bid and offer.

DIX: For every buyer is a seller (usually a market maker). Using DIX — which is derived from short sales (i.e., liquidity provision on the market-making side) — we can measure buying pressure.

Gamma: Gamma is the sensitivity of an option to changes in the underlying price. Dealers that take the other side of options trades hedge their exposure to risk by buying and selling the underlying. When dealers are short-gamma, they hedge by buying into strength and selling into weakness. When dealers are long-gamma, they hedge by selling into strength and buying into weakness. The former exacerbates volatility. The latter calms volatility.

News And Analysis
Banks are effectively sterilizing central bank liquidity.
Morgan Stanley eyes mid-cycle transition, correction.
An options turn upheavals into mid-month sure thing.
Ida made landfall in Louisiana, stronger than Katrina.
Sustained vaccine demand to support pharma growth.
Billionaire Paulson is calling cryptocurrency a bubble.
Crypto nomads – surfing the world for risk and profit.
Cadano’s Ada is the latest cryptocurrency surging up.
What People Are Saying
About
After years of self-education, strategy development, and trial-and-error, Renato Leonard Capelj began trading full-time and founded Physik Invest to detail his methods, research, and performance in the markets.
Additionally, Capelj is a finance and technology reporter. Some of his biggest works include interviews with leaders such as John Chambers, founder and CEO, JC2 Ventures, Kevin O’Leary, businessman and Shark Tank host, Catherine Wood, CEO and CIO, ARK Invest, among others.
Disclaimer
At this time, Physik Invest does not manage outside capital and is not licensed. In no way should the materials herein be construed as advice. Derivatives carry a substantial risk of loss. All content is for informational purposes only.