Market Commentary
U.S. equity index futures sideways overnight.
- Dems agree to $3.5T tax, spending plan.
- Fed Chair Powell semi-annual testimony.
- Earnings begin with a bang and continue.
- Equity indexes mixed; sideways to lower.
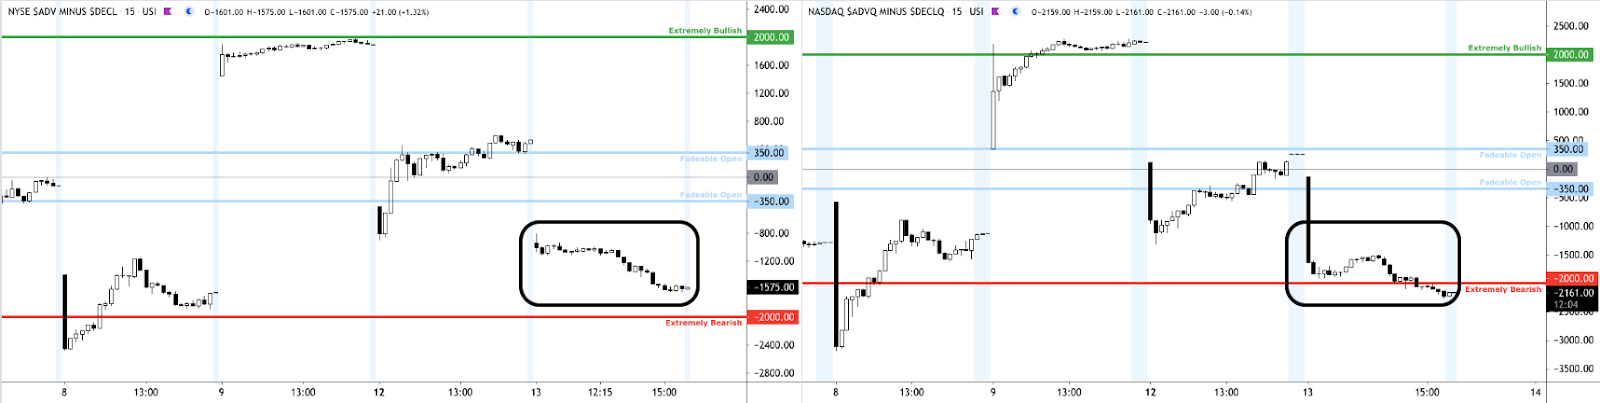
What Happened: U.S. stock index futures resolved lower after underlying breadth metrics failed to support the post-CPI recovery.
Thereafter, indices traded sideways overnight alongside news Senate Democrats on the Budget Committee agreed to a $3.5 trillion spending bill. The bill would carry President Biden’s economic agenda without Republican support.
Ahead, participants are expecting testimony by Federal Reserve Chair Jerome Powell, earnings releases from heavily weighted index constituents, as well as the latest Fed Beige Book.
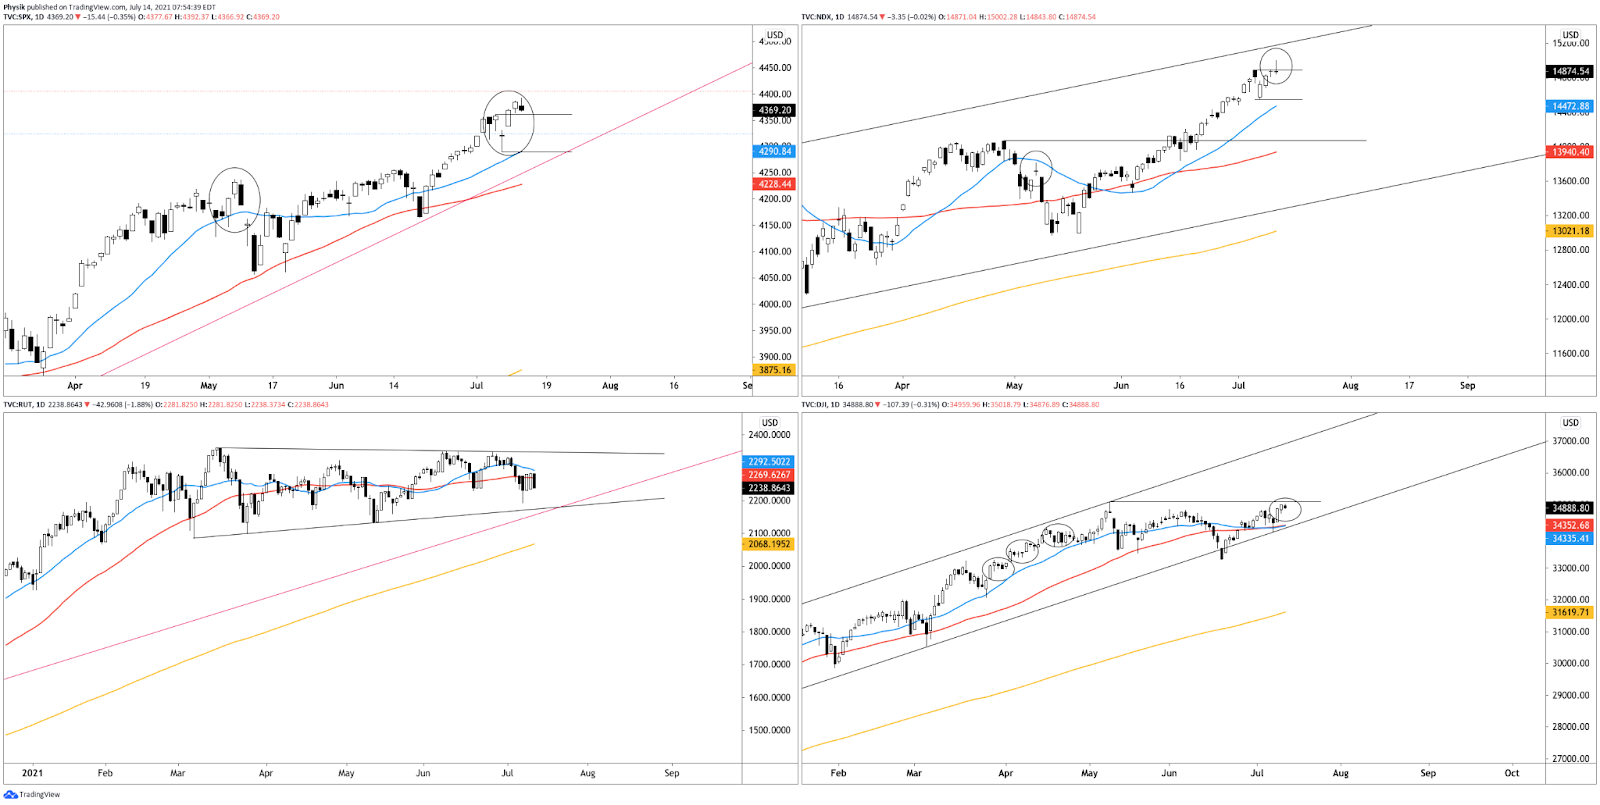
What To Expect: Wednesday’s regular session (9:30 AM – 4:00 PM EST) in the S&P 500 will likely open just inside of prior-range and -value, suggesting a limited potential for immediate directional opportunity.
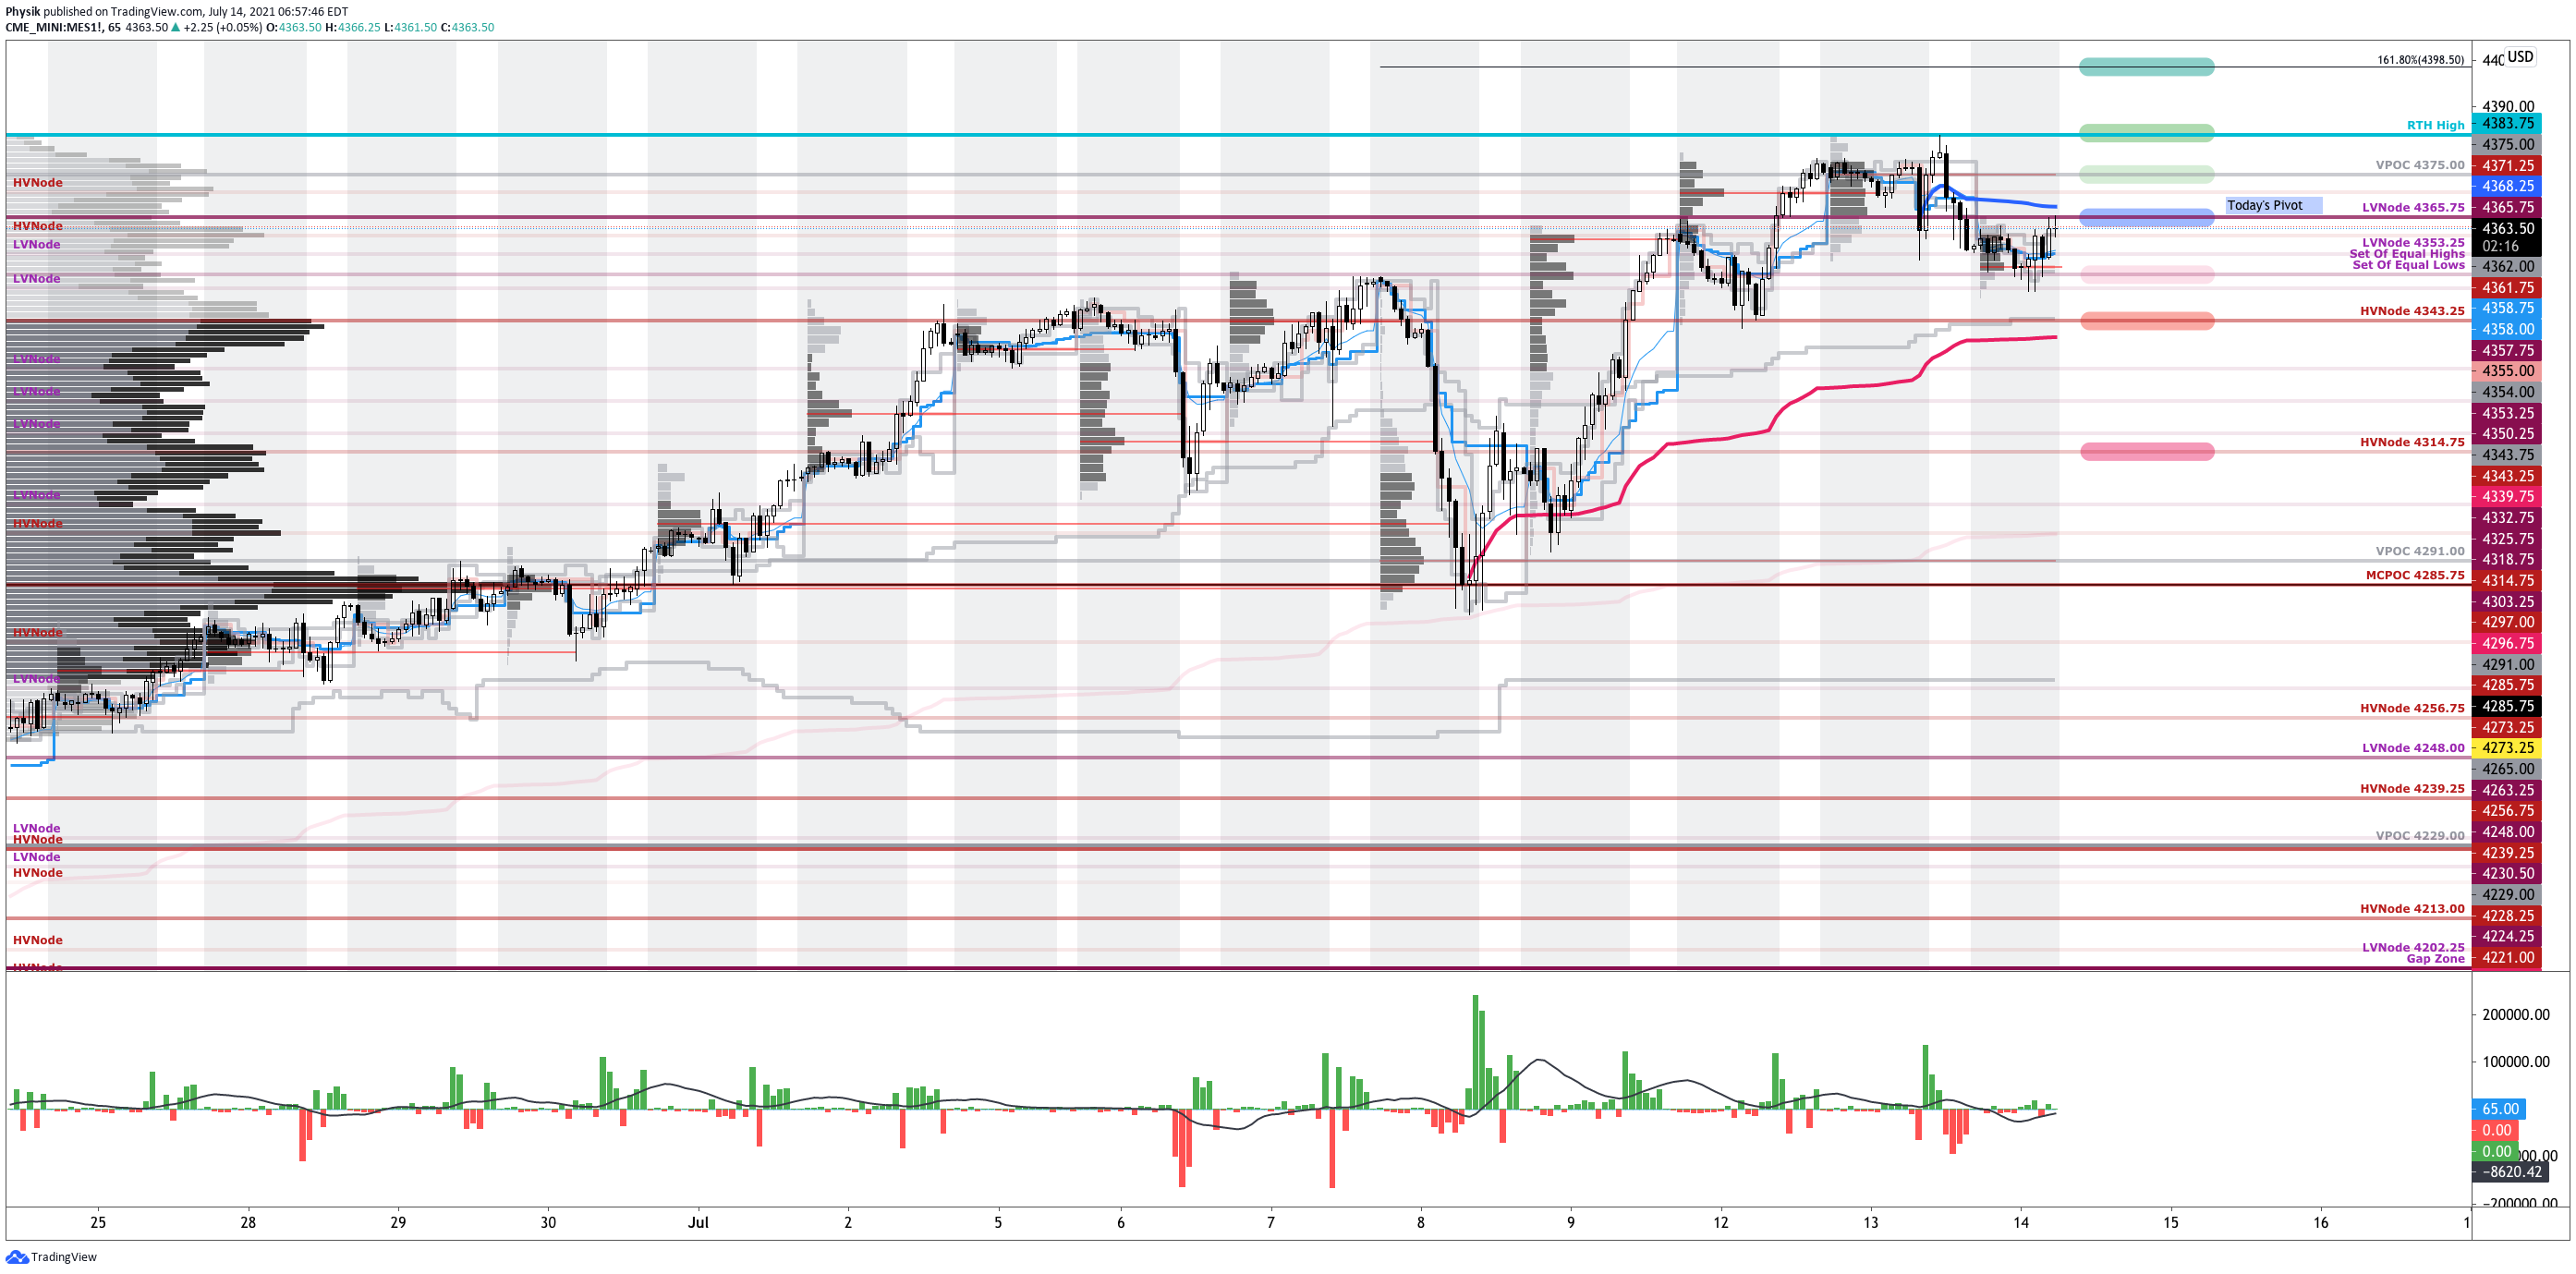
Adding, during the prior day’s regular trade, the worst-case outcome occurred, evidenced by an intraday liquidation break and the subsequent acceptance below a Volume Weighted Average Price (VWAP) anchored from the CPI release (blue in color on the below profile graphic).
Liquidation Breaks: The profile shape suggests participants were “too” long and had poor location. Such dynamic offers responsive buyers (initiative sellers) favorable entry (exit).

Volume-Weighted Average Prices (VWAPs): A metric highly regarded by chief investment officers, among other participants, for quality of trade. Additionally, liquidity algorithms are benchmarked and programmed to buy and sell around VWAPs.
Prior to the liquidation, breadth metrics were firmly negative. Despite what appeared to be a strong recovery post-CPI, internal divergences via breadth metrics became more pronounced, while profile dynamics revealed weak commitment at higher prices and an abundance of poor structures (e.g., low-volume areas).
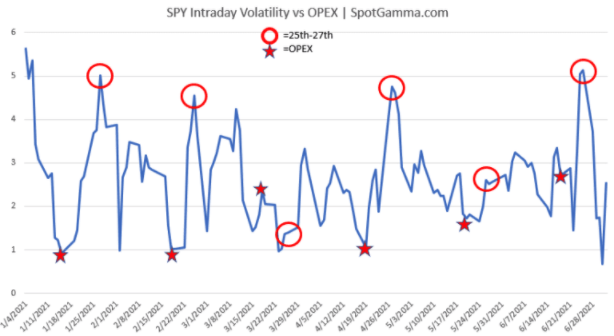
This push-pull and divergence comes ahead of the options expiration (OPEX) cycle which starts on the third Friday of each month (July 16). Associated hedging forces make it so there’s more liquidity and less movement. In other words, the market tends to pin.
Options Expiration (OPEX): Option expiries mark an end to pinning (i.e, the theory that market makers and institutions short options move stocks to the point where the greatest dollar value of contracts will expire worthless) and the reduction dealer gamma exposure.

Gamma: Gamma is the sensitivity of an option to changes in the underlying price. Dealers that take the other side of options trades hedge their exposure to risk by buying and selling the underlying. When dealers are short-gamma, they hedge by buying into strength and selling into weakness. When dealers are long-gamma, they hedge by selling into strength and buying into weakness. The former exacerbates volatility. The latter calms volatility.
Thereafter, according to SpotGamma, “[t]he week after expiration the market tends to experience its largest intraday volatility which corresponds to the reduction in large options positions, and the hedging associated with them.”
For today, participants can trade from the following frameworks.
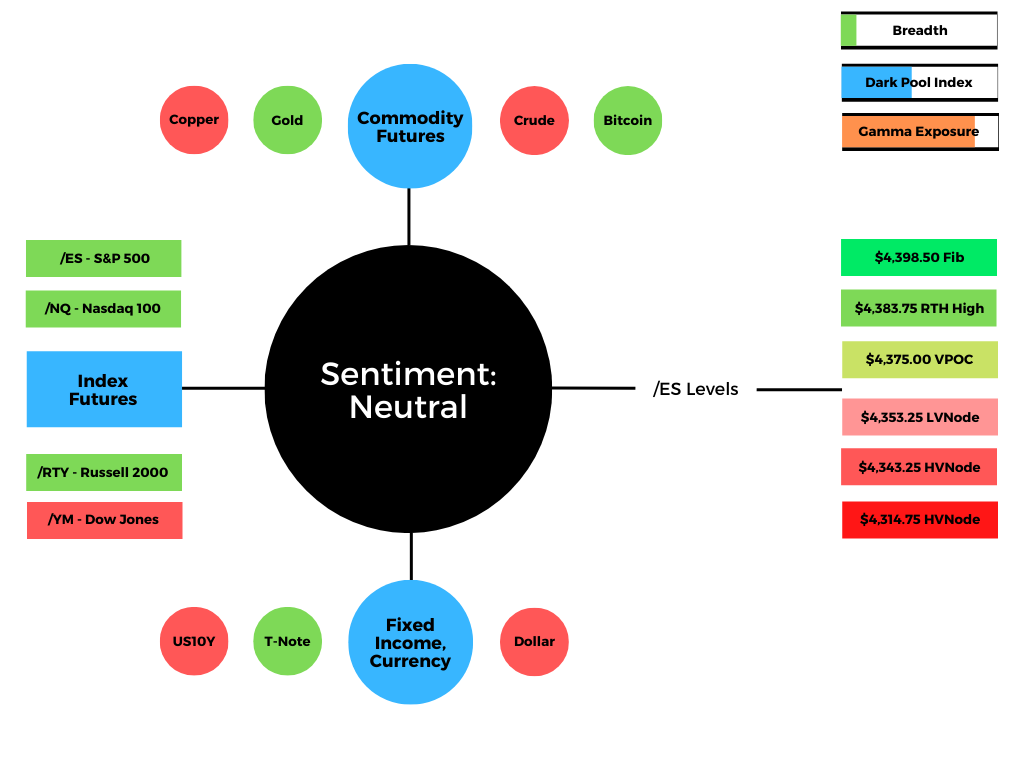
In the best case, the S&P 500 trades sideways or higher; activity above the $4,365.75 low volume area (LVNode) pivot puts in play the $4,375.00 untested Point of Control (POC), first. Then, the $4,383.75 regular trade high (RTH High) and $4,398.50 Fibonacci extension come into play.
In the worst case, the S&P 500 trades lower; activity below the $4,365.75 LVNode pivot puts in play the $4,353.25 LVNode. Trade beyond that figure puts in play the high volume areas (HVNodes) at $4,343.25 and $4,314.75.
Significance Of Prior ATHs, ATLs: Prices often encounter resistance (support) at prior highs (lows) due to the supply (demand) of old business. These areas take time to resolve. Breaking and establishing value (i.e., trading more than 30-minutes beyond this level) portends continuation.

POCs: POCs are valuable as they denote areas where two-sided trade was most prevalent. Participants will respond to future tests of value as they offer favorable entry and exit.

Volume Areas: A structurally sound market will build on past areas of high volume. Should the market trend for long periods of time, it will lack sound structure (identified as a low volume area which denotes directional conviction and ought to offer support on any test).

If participants were to auction and find acceptance into areas of prior low volume, then future discovery ought to be volatile and quick as participants look to areas of high volume for favorable entry or exit.

News And Analysis
Politics | Senate Democrats Agree to $3.5T tax, spending plan. (BBG)
Markets | ‘A free put on the market’: CIO on volatility dislocation. (BZ)
Energy | OPEC reaches agreement with UAE over oil production. (WSJ)
Economy | Weekly mortgage refinances spike 20% on rate drop. (CNBC)
Mobility | EU set to call time on combustion engine in decades. (REU)
Economy | Broker says NYC’s real estate market is heating up. (CNBC)
Markets | Delta posts first profit since 2019 on aid, better revenue. (CNBC)
Economy | China’s GDP and the five things to keep an eye on. (FT)
Economy | Inflation climbs higher than expected; CPI up 5.4%. (CNBC)
Markets | Goldman, JPM pivot to M&A amid fading trade boom. (FT)
Mobility | Norwegian Cruise Line sues on vaccine passport ban. (CNBC)
Politics | China deals another blow to its cryptocurrency miners. (BBG)
Markets | Wood sells China tech stocks, warns of valuation reset. (BBG)
Economy | JPMorgan Chase CEO uber bullish on U.S. consumers. (Axios)
What People Are Saying
About
Renato founded Physik Invest after going through years of self-education, strategy development, and trial-and-error. His work reporting in the finance and technology space, interviewing leaders such as John Chambers, founder, and CEO, JC2 Ventures, Kevin O’Leary, businessman and Shark Tank host, Catherine Wood, CEO and CIO, ARK Invest, among others, afforded him the perspective and know-how very few come by.
Having worked in engineering and majored in economics, Renato is very detailed and analytical. His approach to the markets isn’t built on hope or guessing. Instead, he leverages the unique dynamics of time and volatility to efficiently act on opportunity.
Disclaimer
At this time, Physik Invest does not manage outside capital and is not licensed. In no way should the materials herein be construed as advice. Derivatives carry a substantial risk of loss. All content is for informational purposes only.