
Physik Invest’s Daily Brief is read free by thousands of subscribers. Join this community to learn about the fundamental and technical drivers of markets.
Administrative
Pardon, the delay. Also, the levels in this letter are a little messy to the downside. Too many confluences. Will clear them up over the coming days. Have a great day!
Fundamental
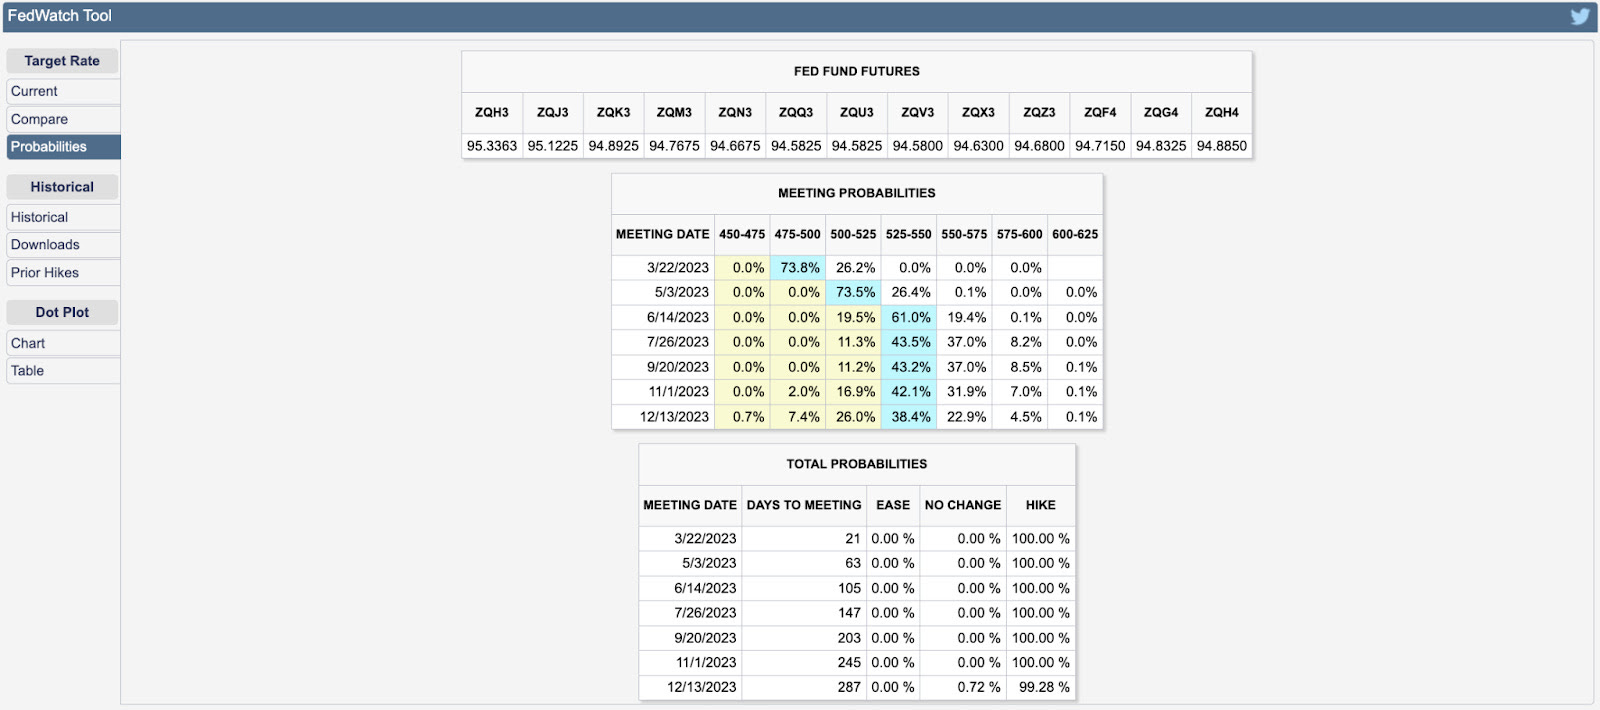
In the face of contrarian economic indications, based on CME Group Inc’s (NASDAQ: CME) FedWatch Tool, traders’ activity in the Fed Fund Futures shows the terminal rate peaking at 5.25-5.50%. Expectations for easing are pushed out to 2024, though at a less steep rate. This context, coupled with the prospects of slower economic growth, presents uninspiring realities for investors.
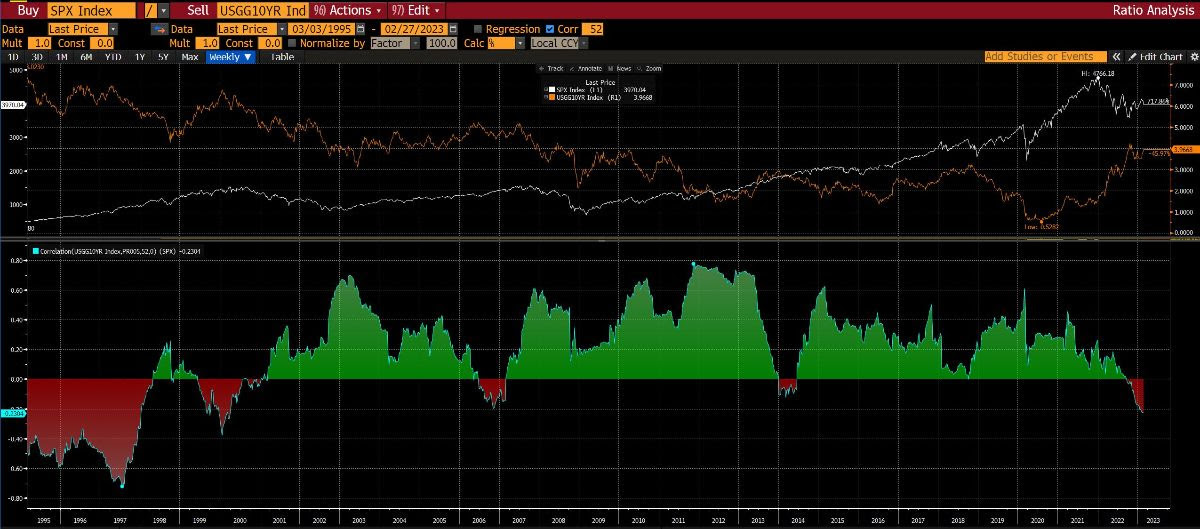
Consequently, the equity-bond correlation break is set to persist.

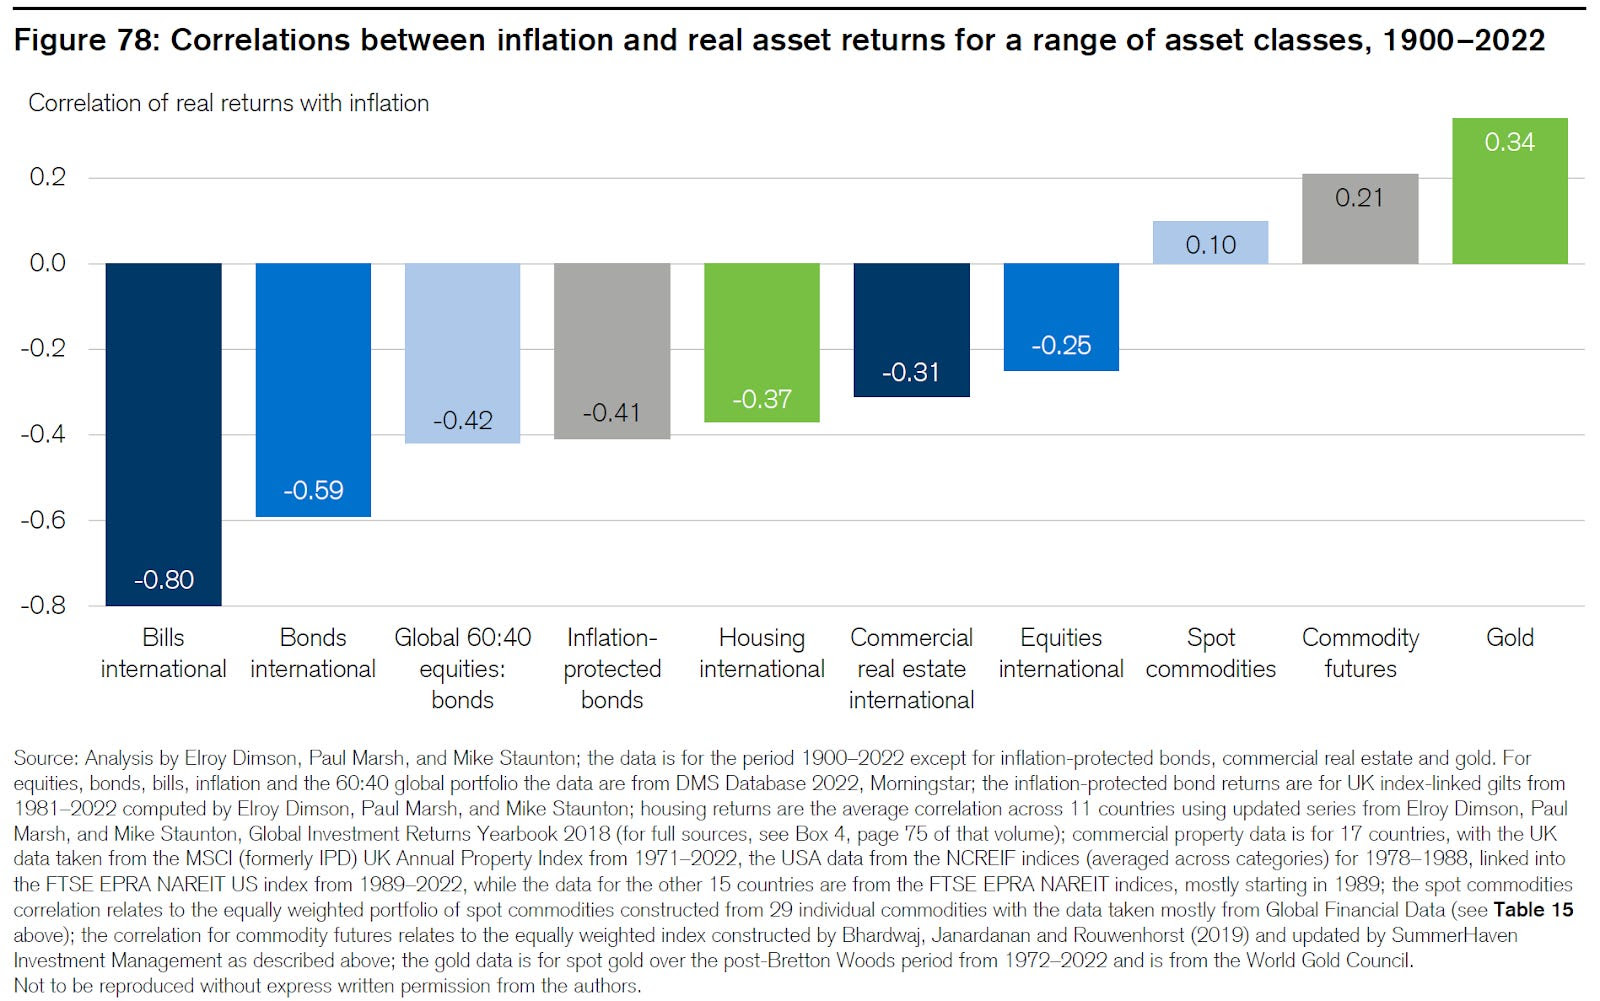
Quoting a Bloomberg analysis of Credit Suisse’s Global Investment Returns Yearbook, “[b]onds, equities and real estate tend to be negatively correlated with inflation,” while “only commodities had a positive correlation, making them the only true hedge.”
However, commodities are “often susceptible to deep and lengthy drawdowns … in periods of disinflation” and falling growth expectations. Though commodities are a hedge against inflation, they aren’t a hedge against (rising odds of) recession.
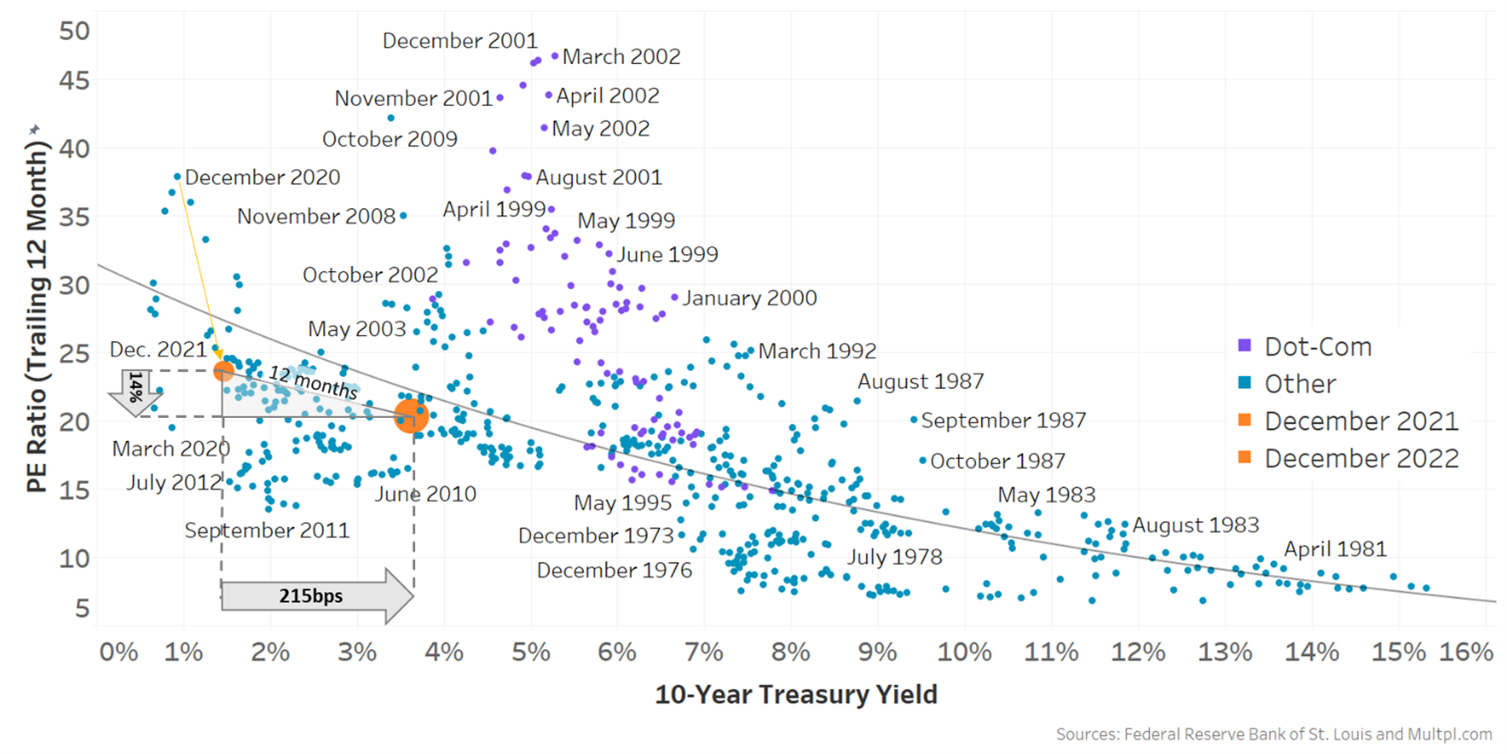
So, interest rates are likely to rise and stay higher for longer.
Equities, which are particularly sensitive to interest rates, are likely to weaken despite economic and earnings growth which is set to fall (i.e., close to zero earnings growth).
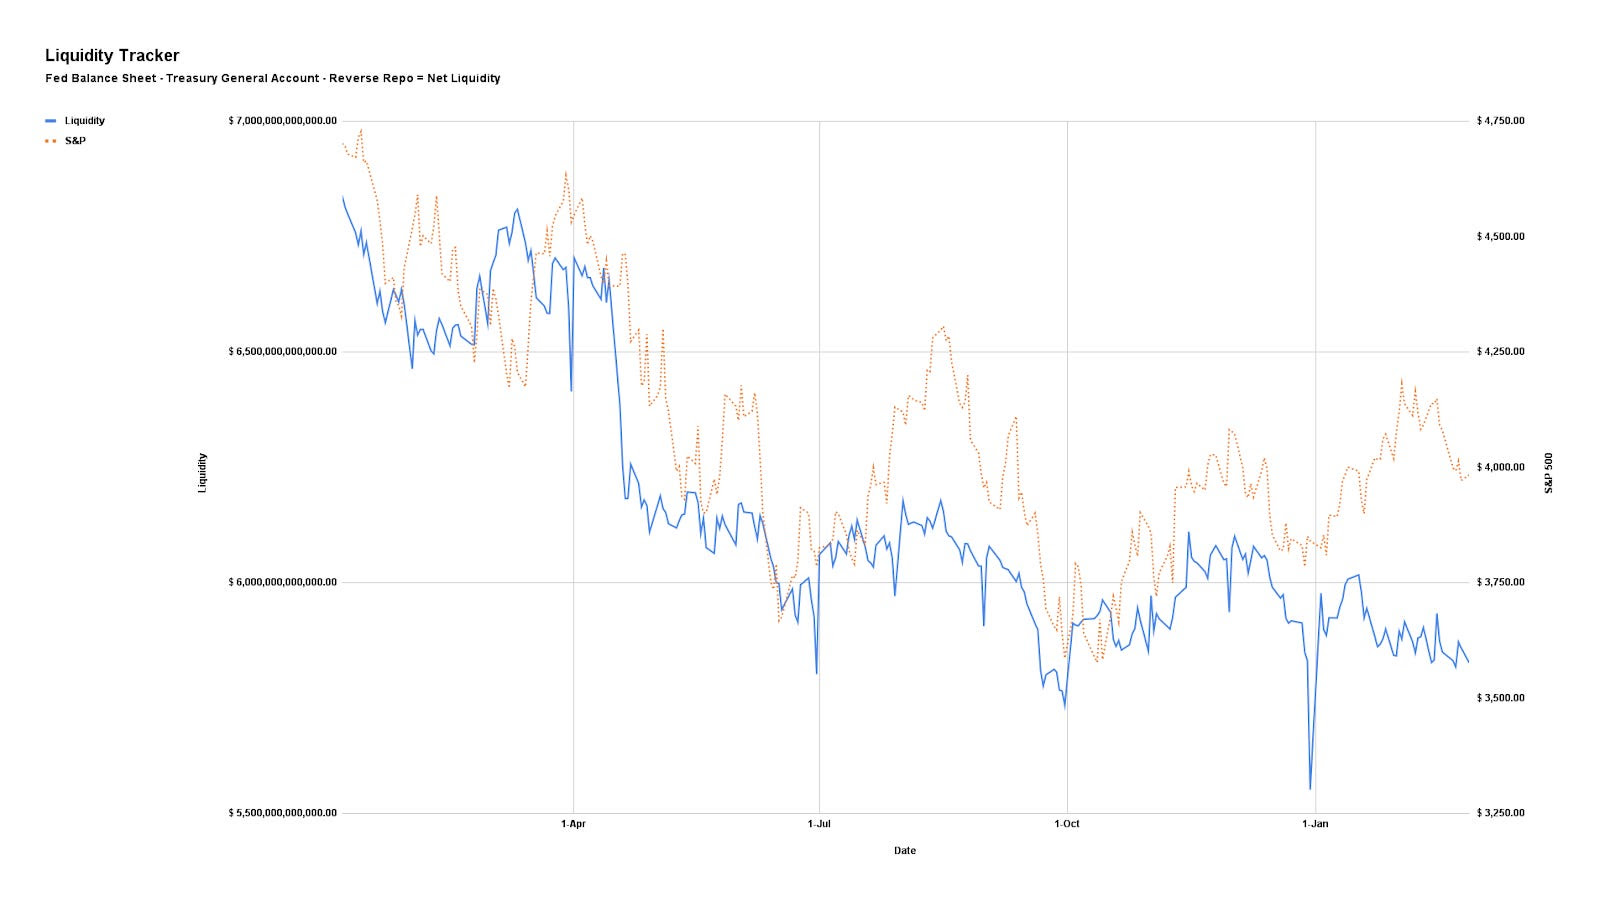
Quantitative tightening or QT (i.e., the flow of capital out of capital markets and an asset headwind), which has been offset by the running off of the Treasury General Account and injecting liquidity into markets (i.e., TGA runoff increases the room banks have to lend and finance trading activities) in the face of the debt ceiling issue, is set to accelerate and compound the rising rate impact.
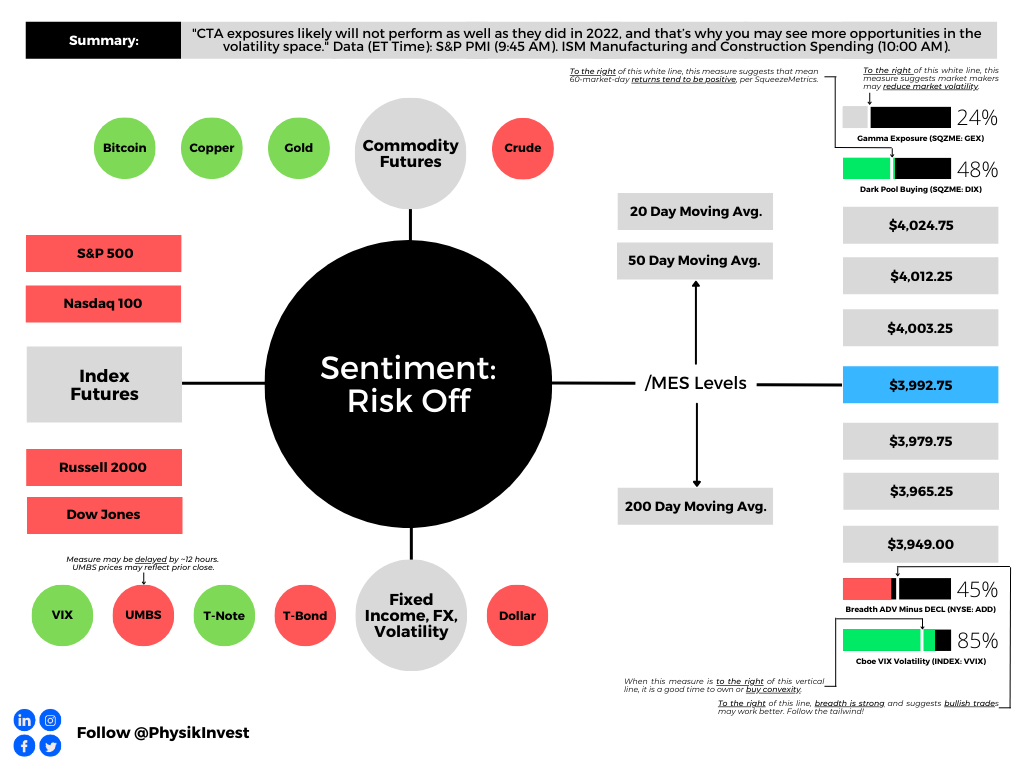
In light of rates and QT risk asset headwind, as well as slowing growth and inflation headwind to bonds and commodities, how does one protect their portfolio? As The Ambrus Group’s Kris Sidial explains, “[e]ven if inflation continues, the rate at which it rises won’t be the same. Due to this, CTA exposures likely will not perform as well as they did in 2022, and that’s why you may see more opportunities in the volatility space … [where] we can get cheap exposure to convexity.”
Please refer to past letters for trade examples. Though such trades may not be as attractive to enter now, they are attractive to keep on for longer.
If, as Bridgewater Associates put it, there is another stage to tightening “marked either by an economic downturn or failure to meet the inflation target, prompting more tightening,” risk assets will perform poorly and this letter’s trade examples are likely to protect portfolios well until assets appear attractive enough to buy again.
Positioning
SpotGamma explains that more of the same (i.e., back-and-forth consolidation and a grind higher or lower) can be expected until some macroeconomic catalysts solicit demand for upside or downside protection and, accordingly, counterparty hedging pressures catalyze a far-reaching movement.
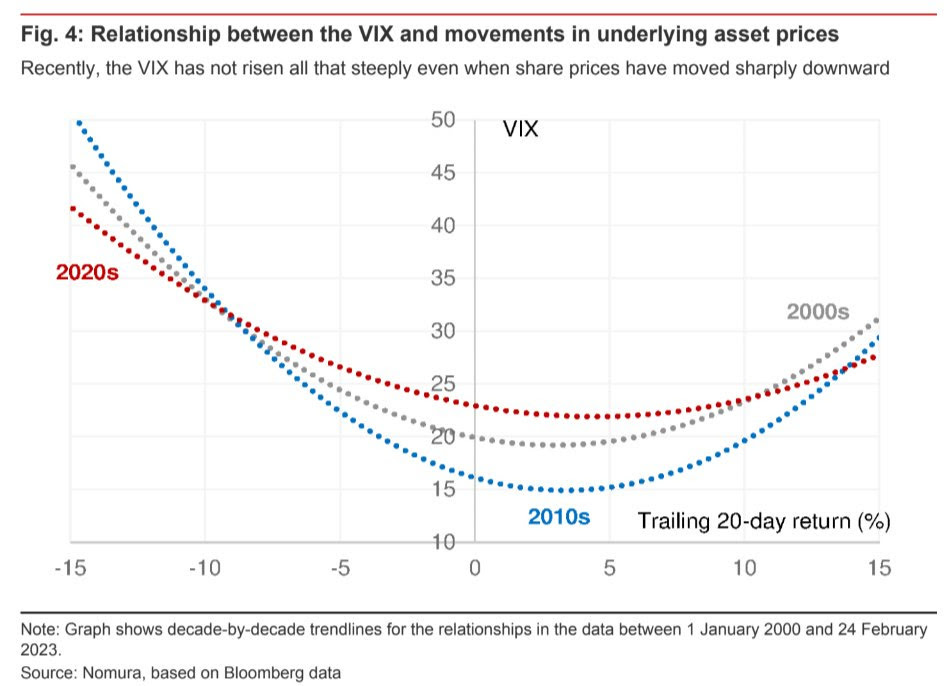
As an aside, “With IV at already low levels, the bullish impact of it falling further is weak, hence the SPX trending lower all the while IV measures (e.g., VIX term structure) have shifted markedly lower since last week. If IV was at a higher starting point, its falling would work to keep the market in a far more positive/bullish stance.”
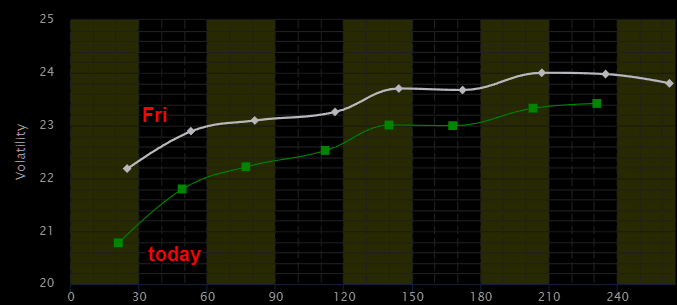
Consequently, “if traders enter the market and demand protection, particularly that which is farther-dated, the bearish effect of rising IV will far outweigh the bullish effect of it falling. This will add to the underlying/fundamental pressure we see building via weak price action.”
Technical
As of 9:20 AM ET, Wednesday’s regular session (9:30 AM – 4:00 PM ET), in the S&P 500, is likely to open in the lower part of a positively skewed overnight inventory, outside of the prior day’s range, suggesting a potential for immediate directional opportunity.
The S&P 500 pivot for today is $3,965.25.
Key levels to the upside include $3,979.75, $3,992.75, and $4,003.25.
Key levels to the downside include $3,949.00, $3,927.50, and $3,908.25.
Disclaimer: Click here to load the updated key levels via the web-based TradingView platform. New links are produced daily. Quoted levels likely hold barring an exogenous development.

Definitions
Volume Areas: Markets will build on areas of high-volume (HVNodes). Should the market trend for a period of time, this will be identified by a low-volume area (LVNodes). The LVNodes denote directional conviction and ought to offer support on any test.
If participants auction and find acceptance in an area of a prior LVNode, then future discovery ought to be volatile and quick as participants look to the nearest HVNodes for more favorable entry or exit.
POCs: Areas where two-sided trade was most prevalent in a prior day session. Participants will respond to future tests of value as they offer favorable entry and exit.
MCPOCs: Denote areas where two-sided trade was most prevalent over numerous sessions. Participants will respond to future tests of value as they offer favorable entry and exit.
About
The author, Renato Leonard Capelj, works in finance and journalism.
Capelj spends the bulk of his time at Physik Invest, an entity through which he invests and publishes free daily analyses to thousands of subscribers. The analyses offer him and his subscribers a way to stay on the right side of the market. Separately, Capelj is an options analyst at SpotGamma and an accredited journalist.
Capelj’s past works include conversations with investor Kevin O’Leary, ARK Invest’s Catherine Wood, FTX’s Sam Bankman-Fried, North Dakota Governor Doug Burgum, Lithuania’s Minister of Economy and Innovation Aušrinė Armonaitė, former Cisco chairman and CEO John Chambers, and persons at the Clinton Global Initiative.
Connect
Direct queries to renato@physikinvest.com. Find Physik Invest on Twitter, LinkedIn, Facebook, and Instagram. Find Capelj on Twitter, LinkedIn, and Instagram. Only follow the verified profiles.
Calendar
You may view this letter’s content calendar at this link.
Disclaimer
Do not construe this newsletter as advice. All content is for informational purposes. Capelj and Physik Invest manage their own capital and will not solicit others for it.


