Editor’s Note: Due to travel commitments, the Daily Brief will not be sent 10/25-10/27.
Apologies and have a great weekend!
Market Commentary
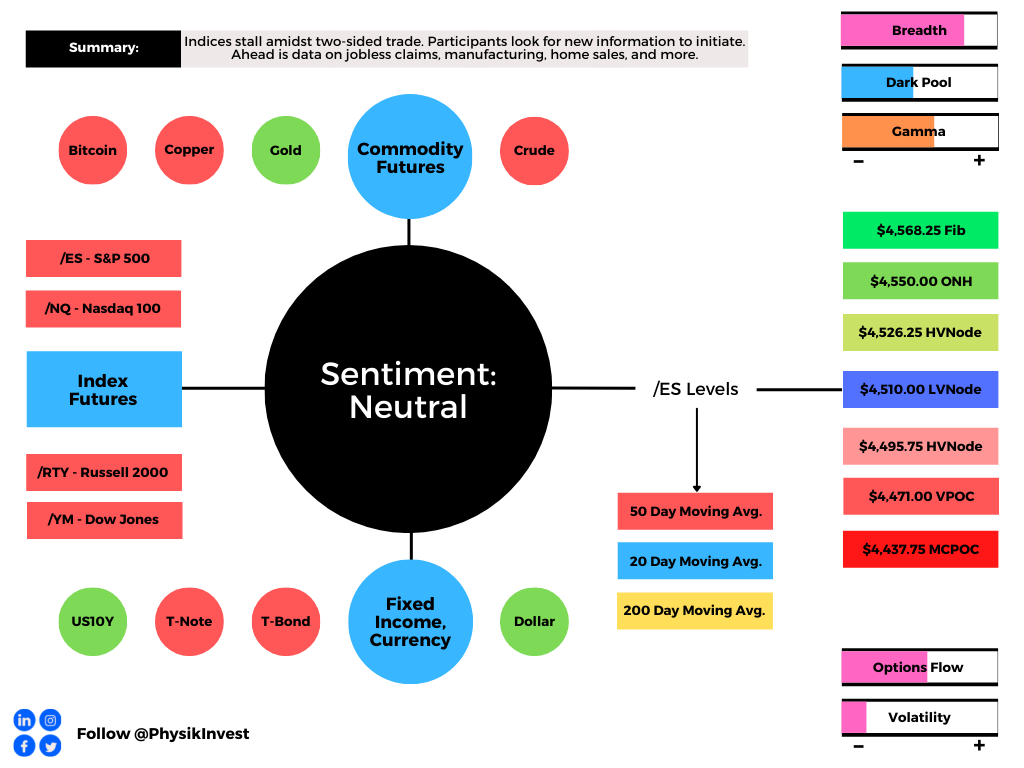
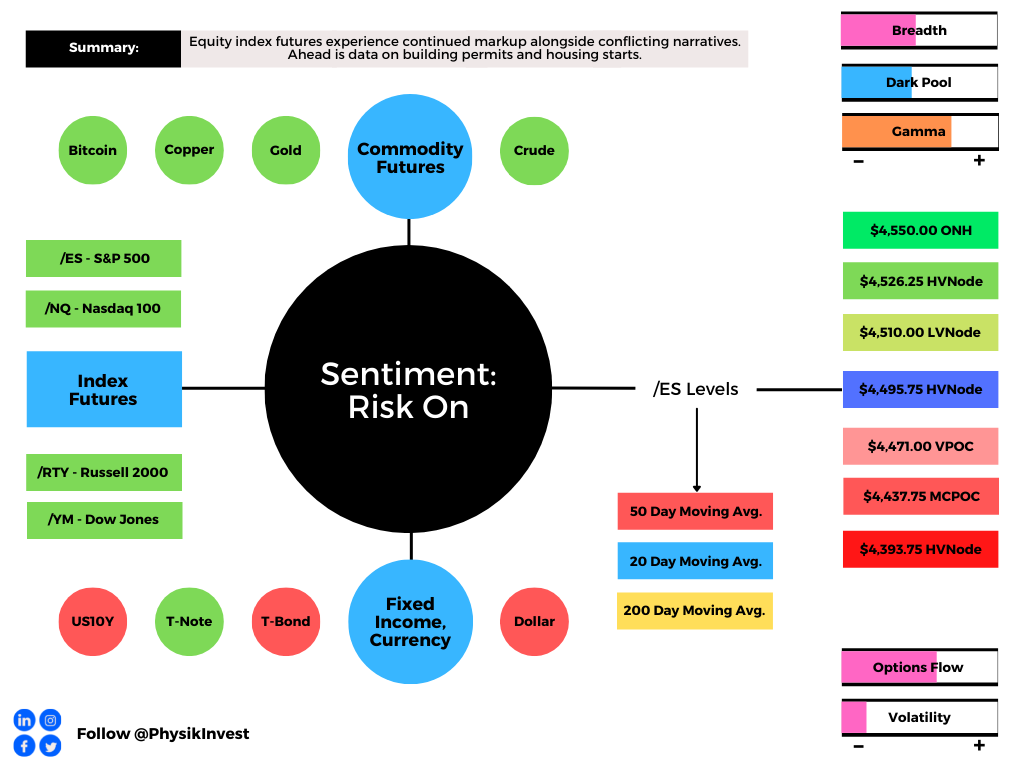
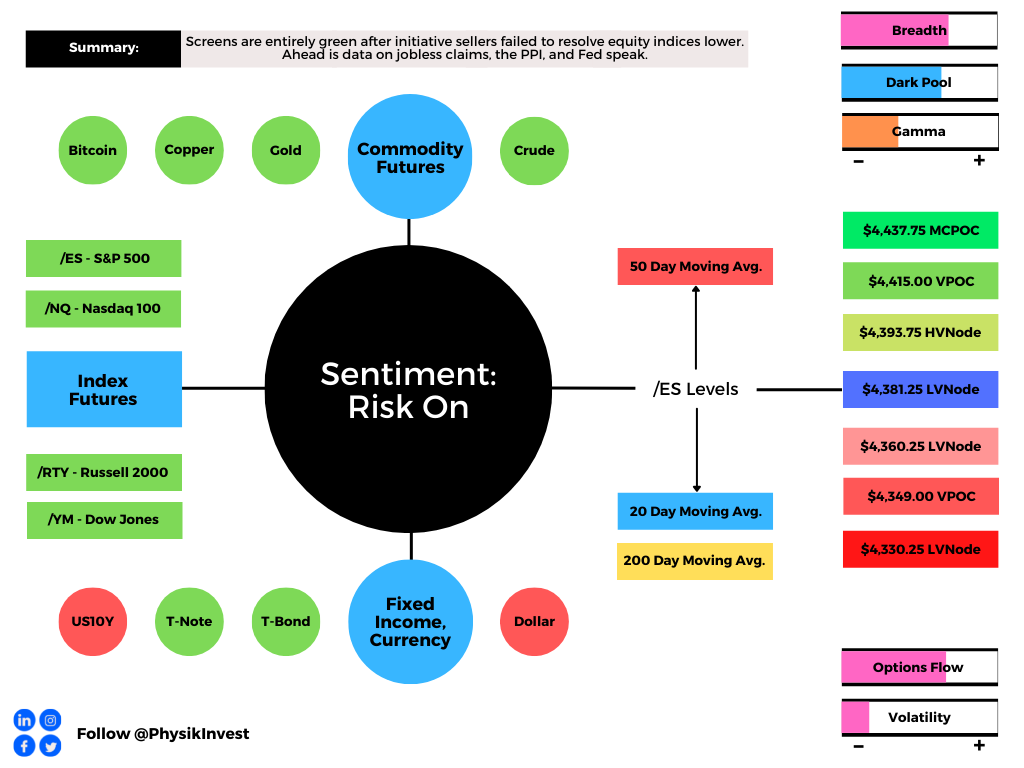
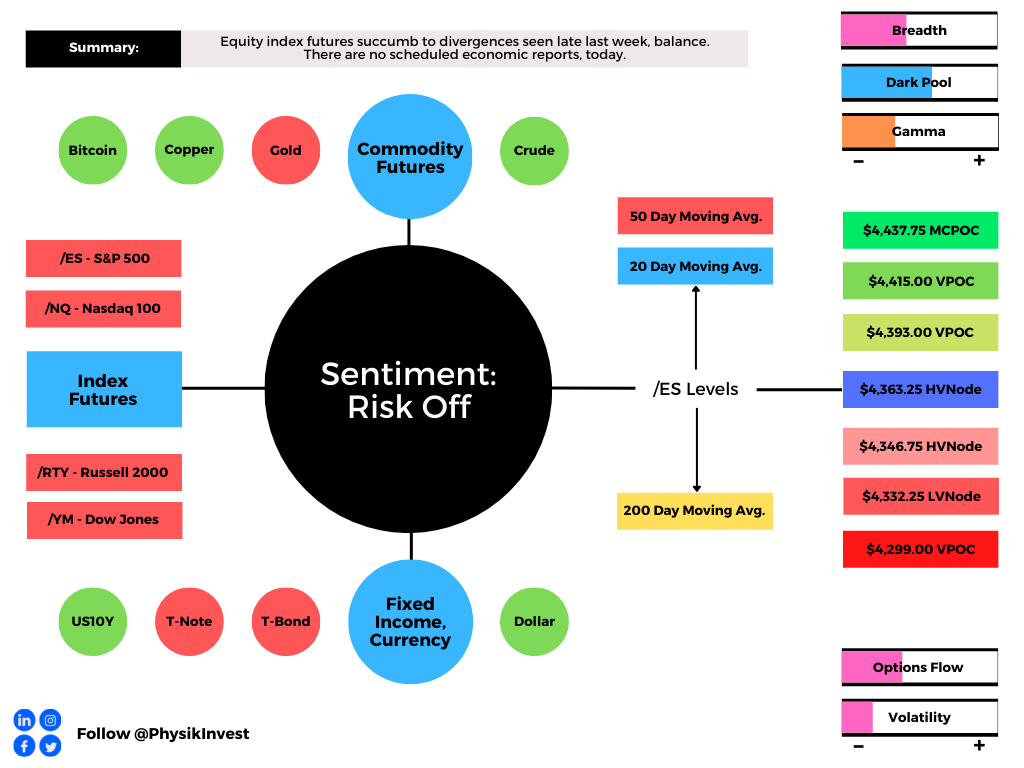
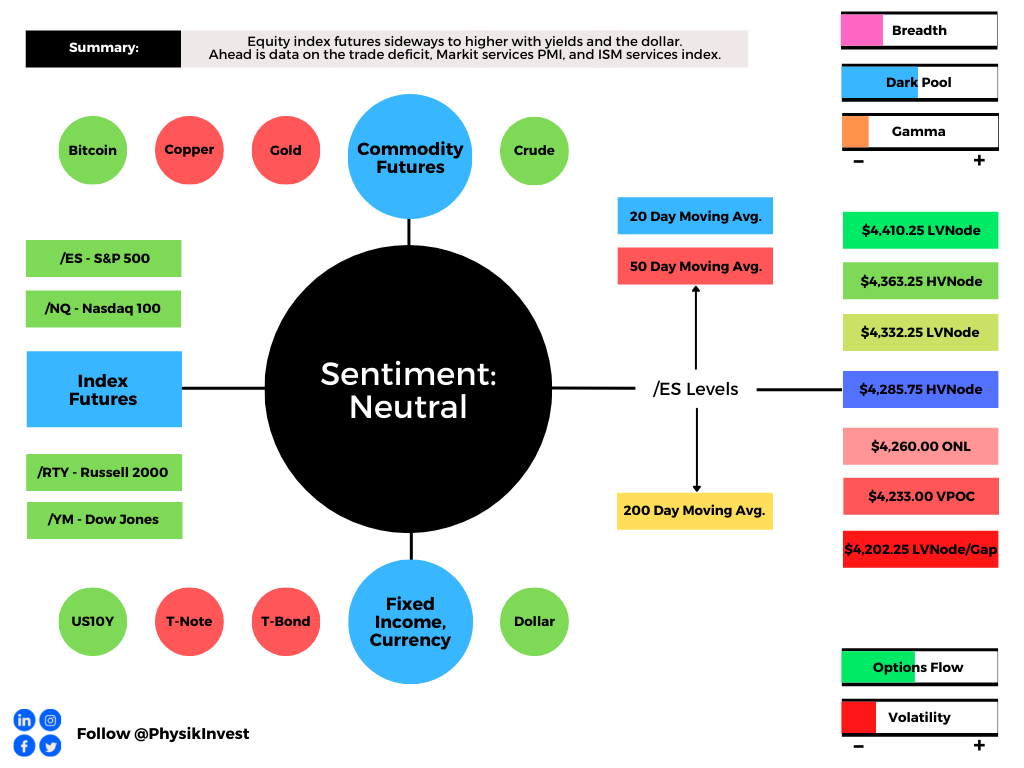
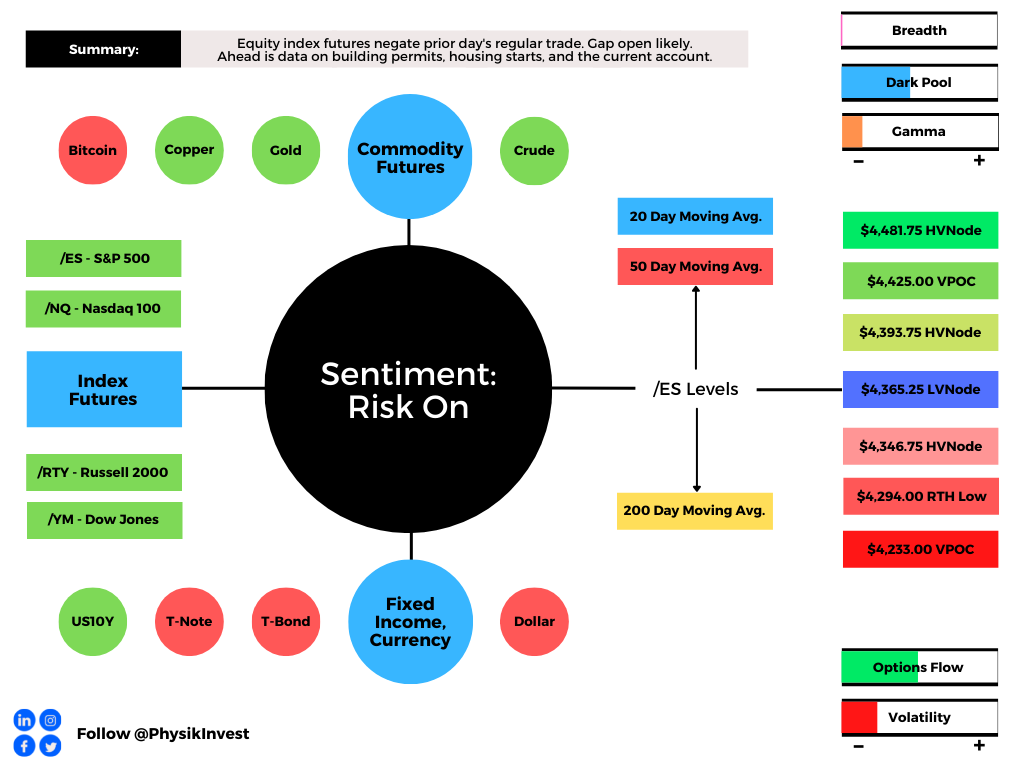
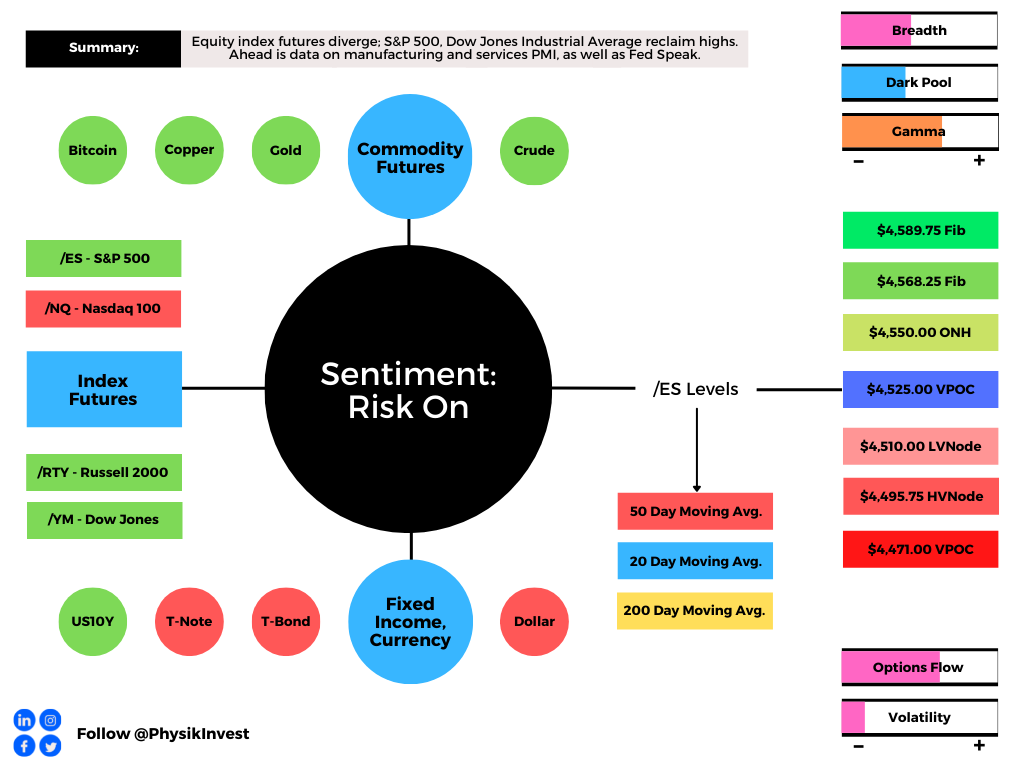
Out of sync with bonds, equity index futures were mostly sideways to higher. Commodities were higher. Volatility compressed.
- Ahead is manufacturing, services PMI.
- Participants discover uncharted prices.
- Options positioning presented tailwind.
What Happened: U.S. stock index futures, less the Nasdaq 100, auctioned sideways to higher overnight as participants looked to discover new prices.
Ahead is data on manufacturing and services PMI (9:45 AM ET), as well as Fed-speak (10:00 and 11:00 AM ET).
What To Expect: As of 6:30 AM ET, Friday’s regular session (9:30 AM – 4:00 PM EST) in the S&P 500 will likely open on a small gap, just outside of prior-range and -value, suggesting a potential for immediate directional opportunity.
Gap Scenarios: Gaps ought to fill quickly. Should they not, that’s a signal of strength; do not fade. Leaving value behind on a gap-fill or failing to fill a gap (i.e., remaining outside of the prior session’s range) is a go-with indicator.

Auctioning and spending at least 1-hour of trade back in the prior range suggests a lack of conviction; in such a case, do not follow the direction of the most recent initiative activity.
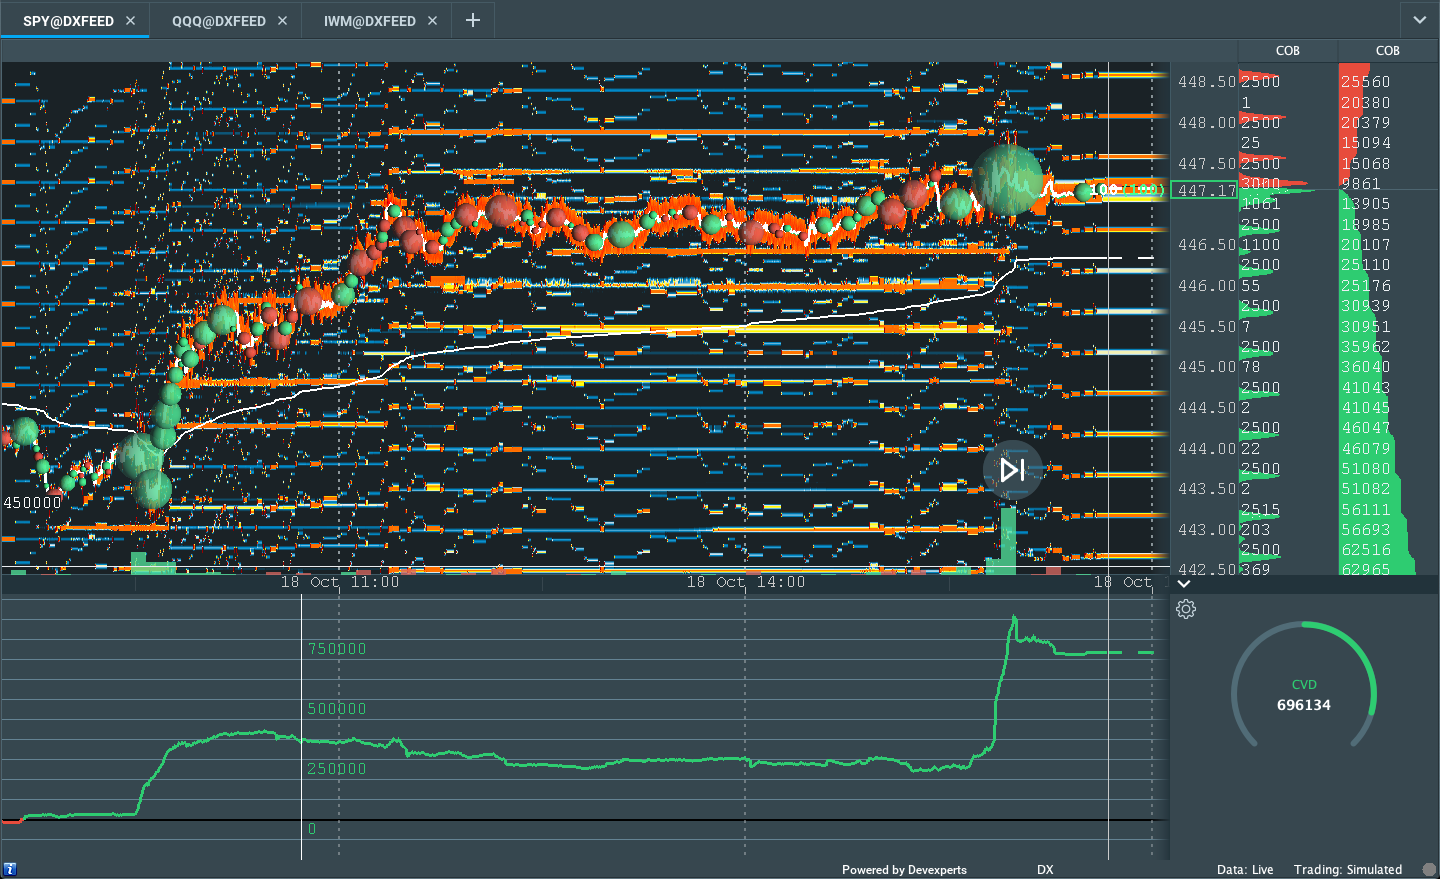
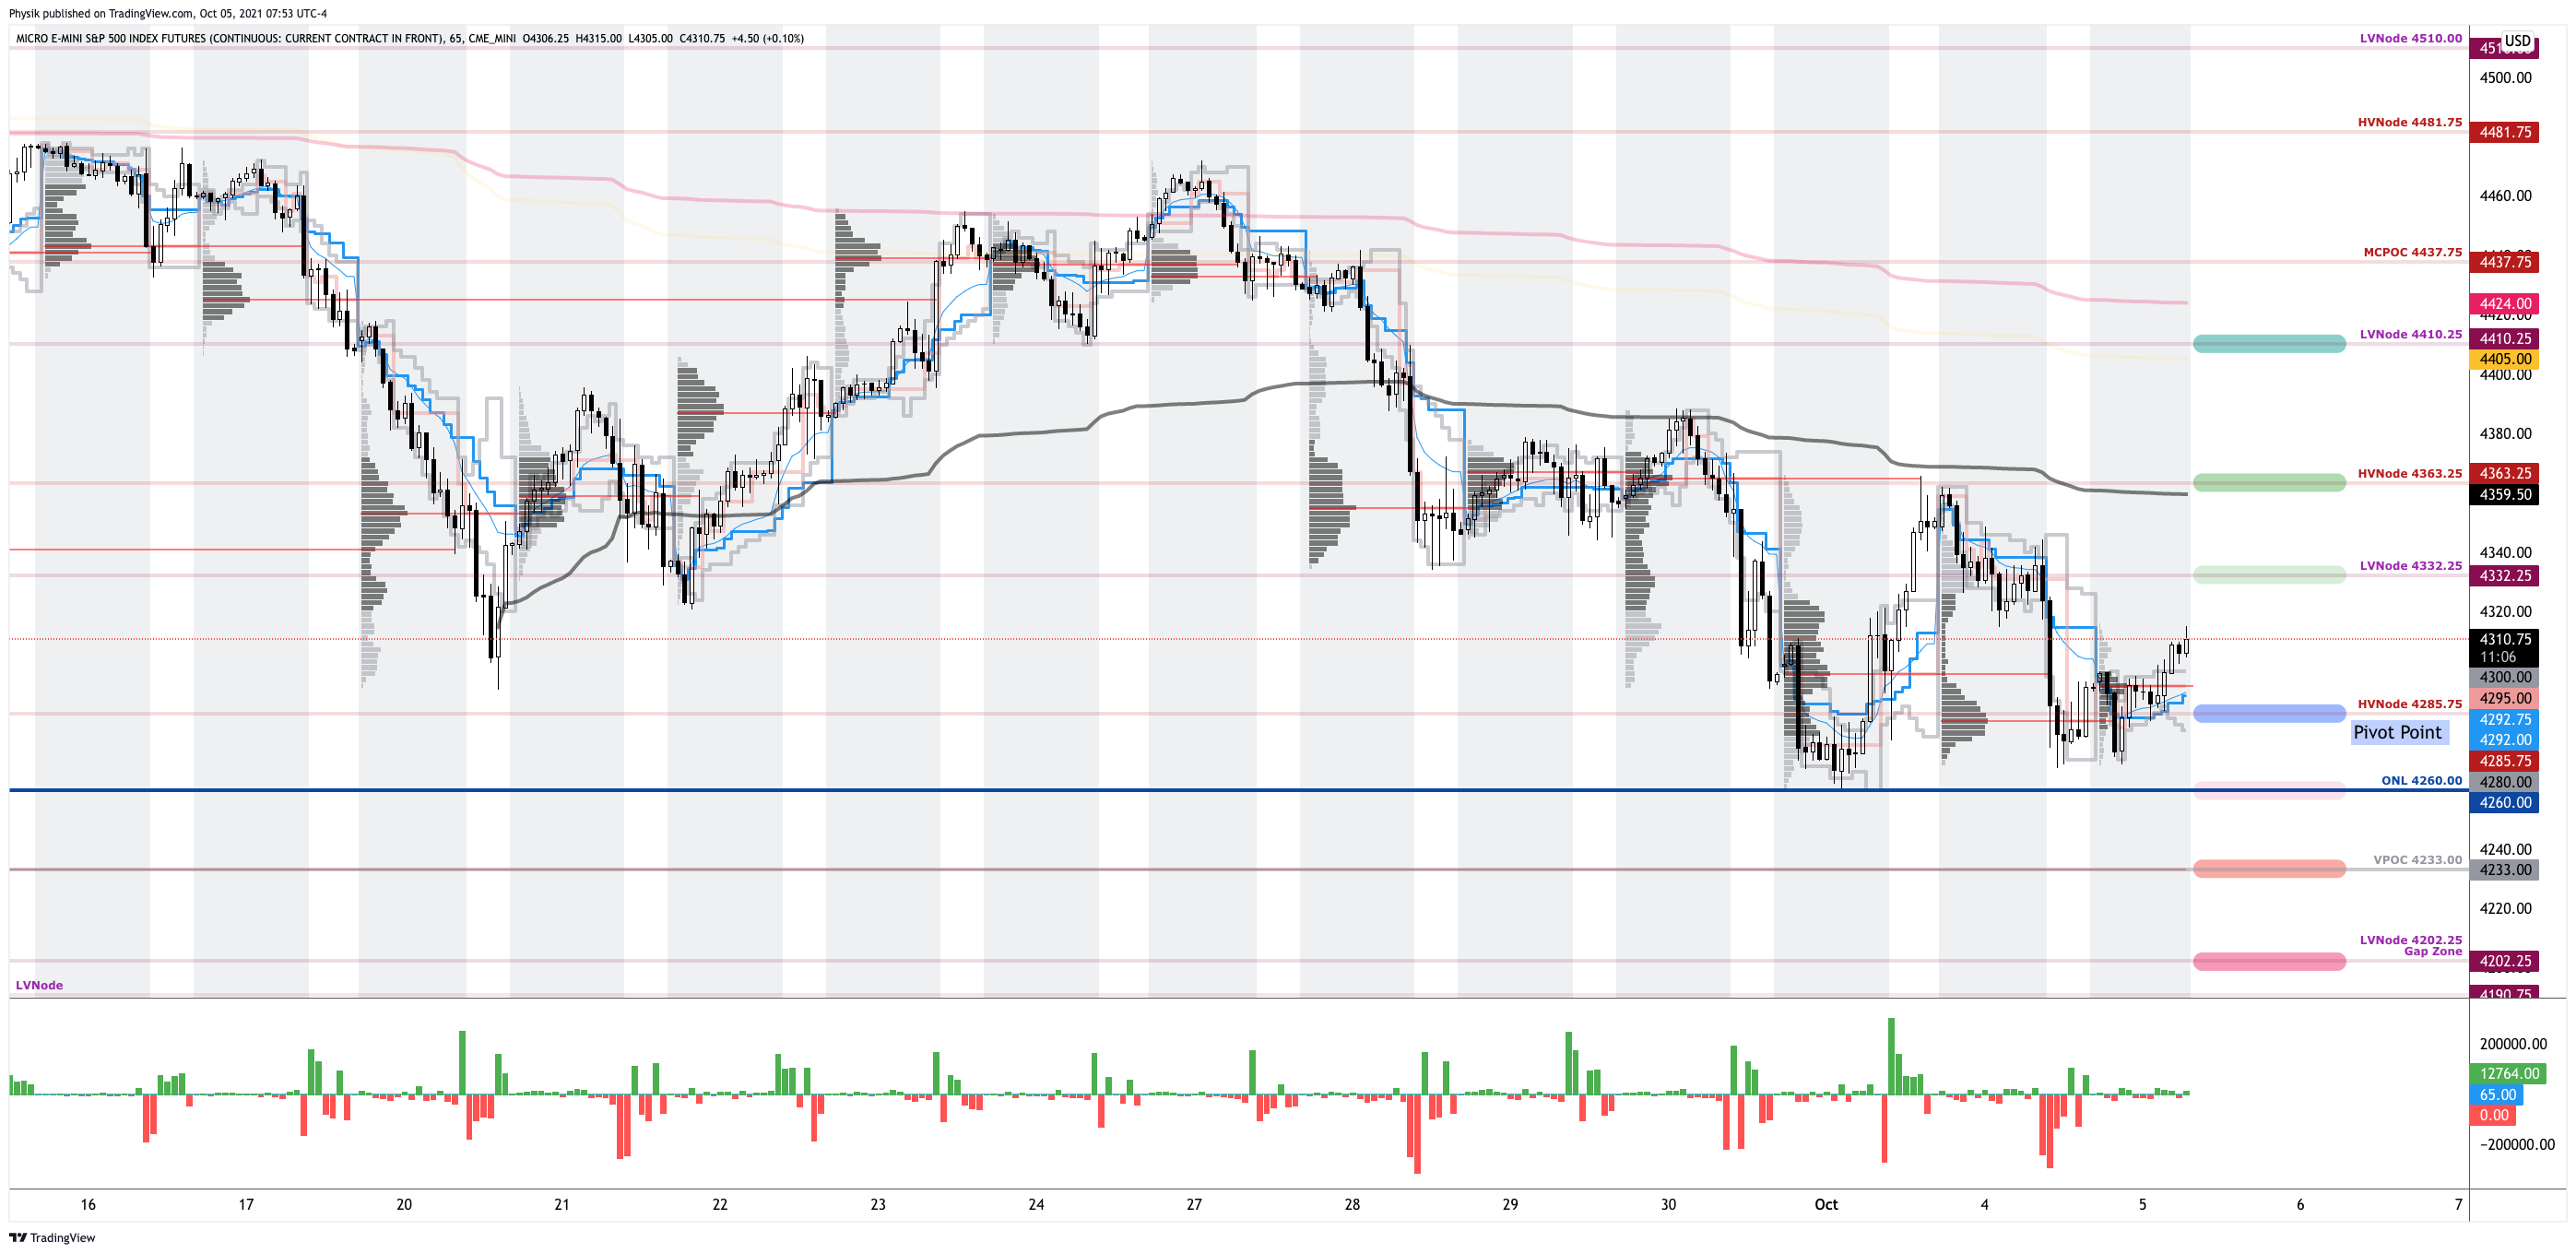
During the prior day’s regular trade, on light volume, nonparticipatory intraday breadth, and supportive market liquidity metrics, the best case outcome occurred, evidenced by upside resolve, above flattened day timeframe profile structures, or ledges.
This activity comes after prior sessions left behind numerous gaps and emotional, multiple-distribution profile structures.
Further, Thursday’s overnight gap in range, below value, set indices up for what is called the cave-fill process (characterized by repair and strengthening of low volume areas).
The day timeframe activity rejected lower prices; participants auctioned to new highs in both regular and overnight trade, putting in play a recovery of the un-adjusted overnight high (ONH) at $4,550.00.
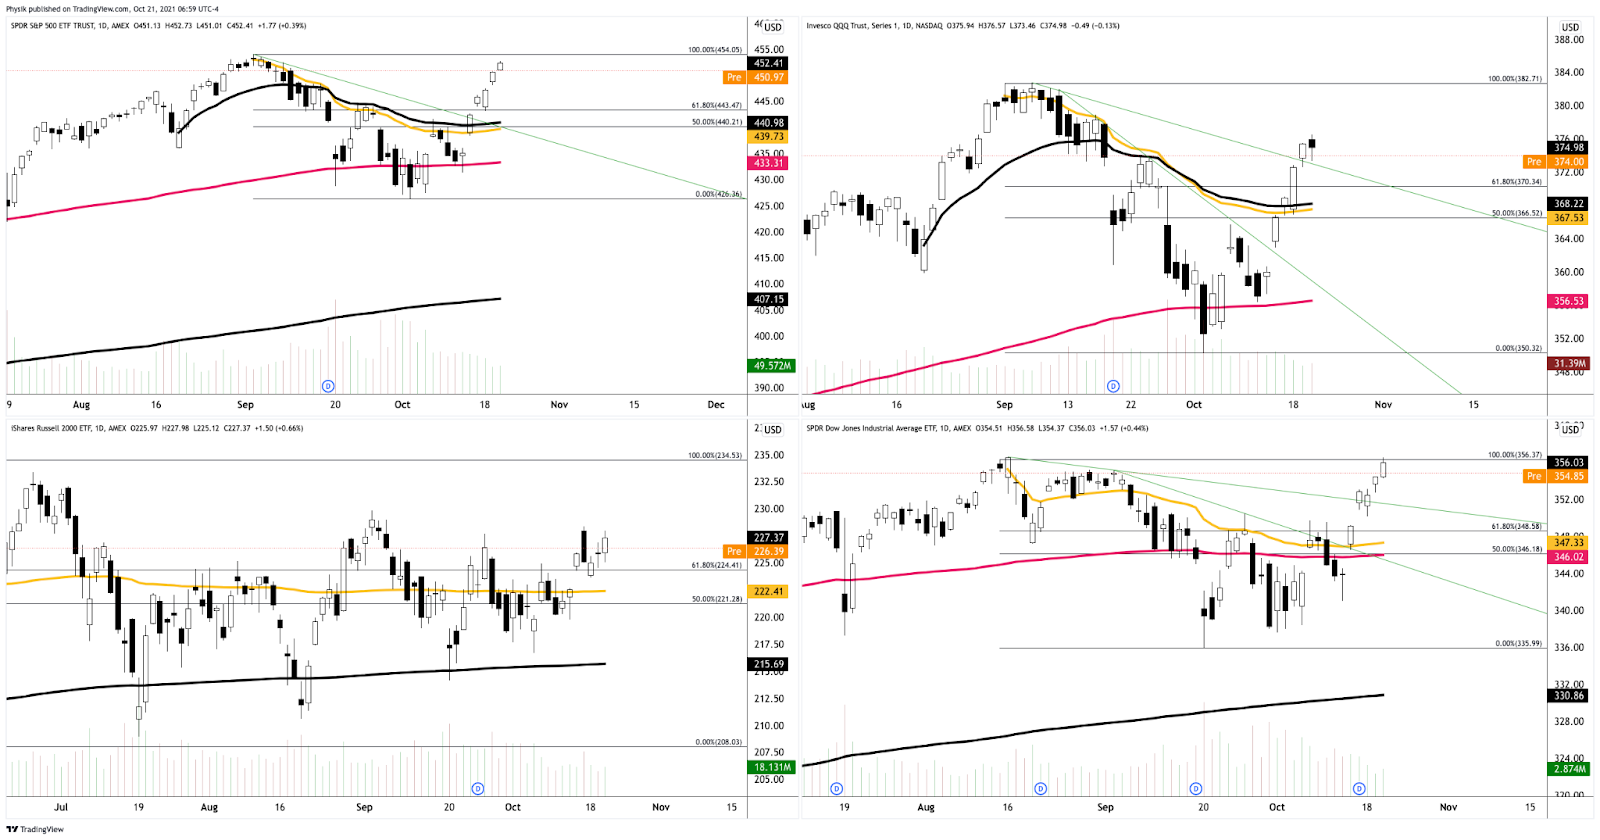
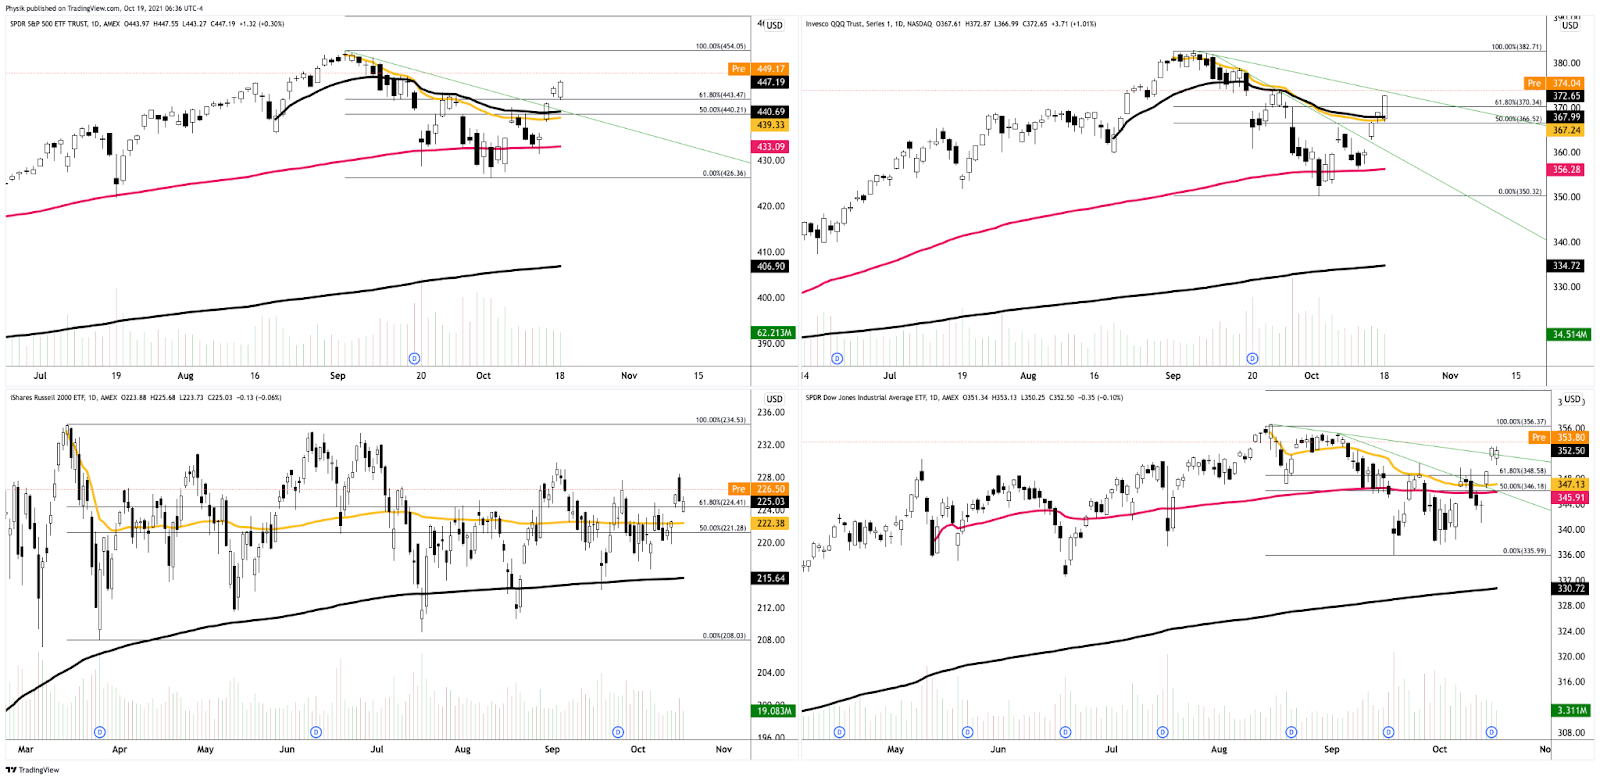
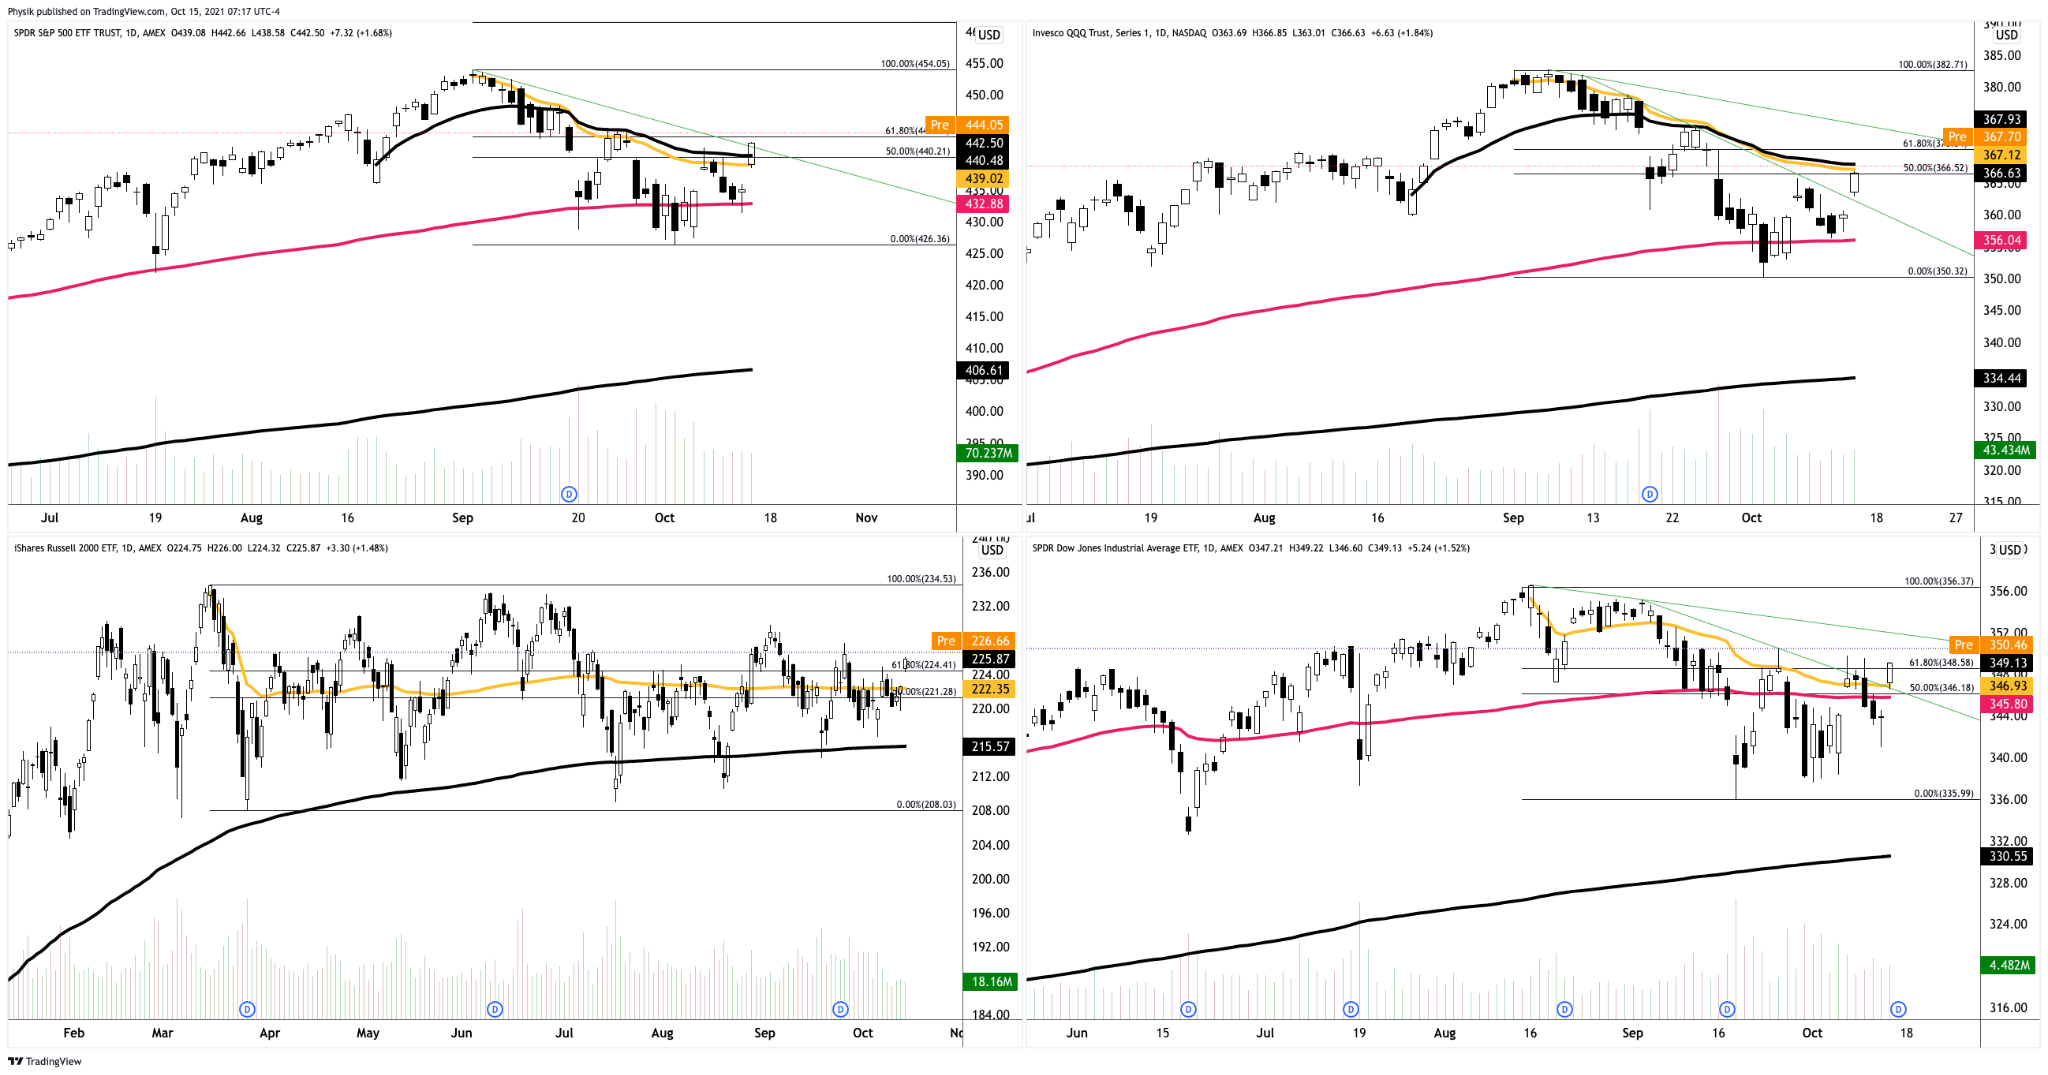
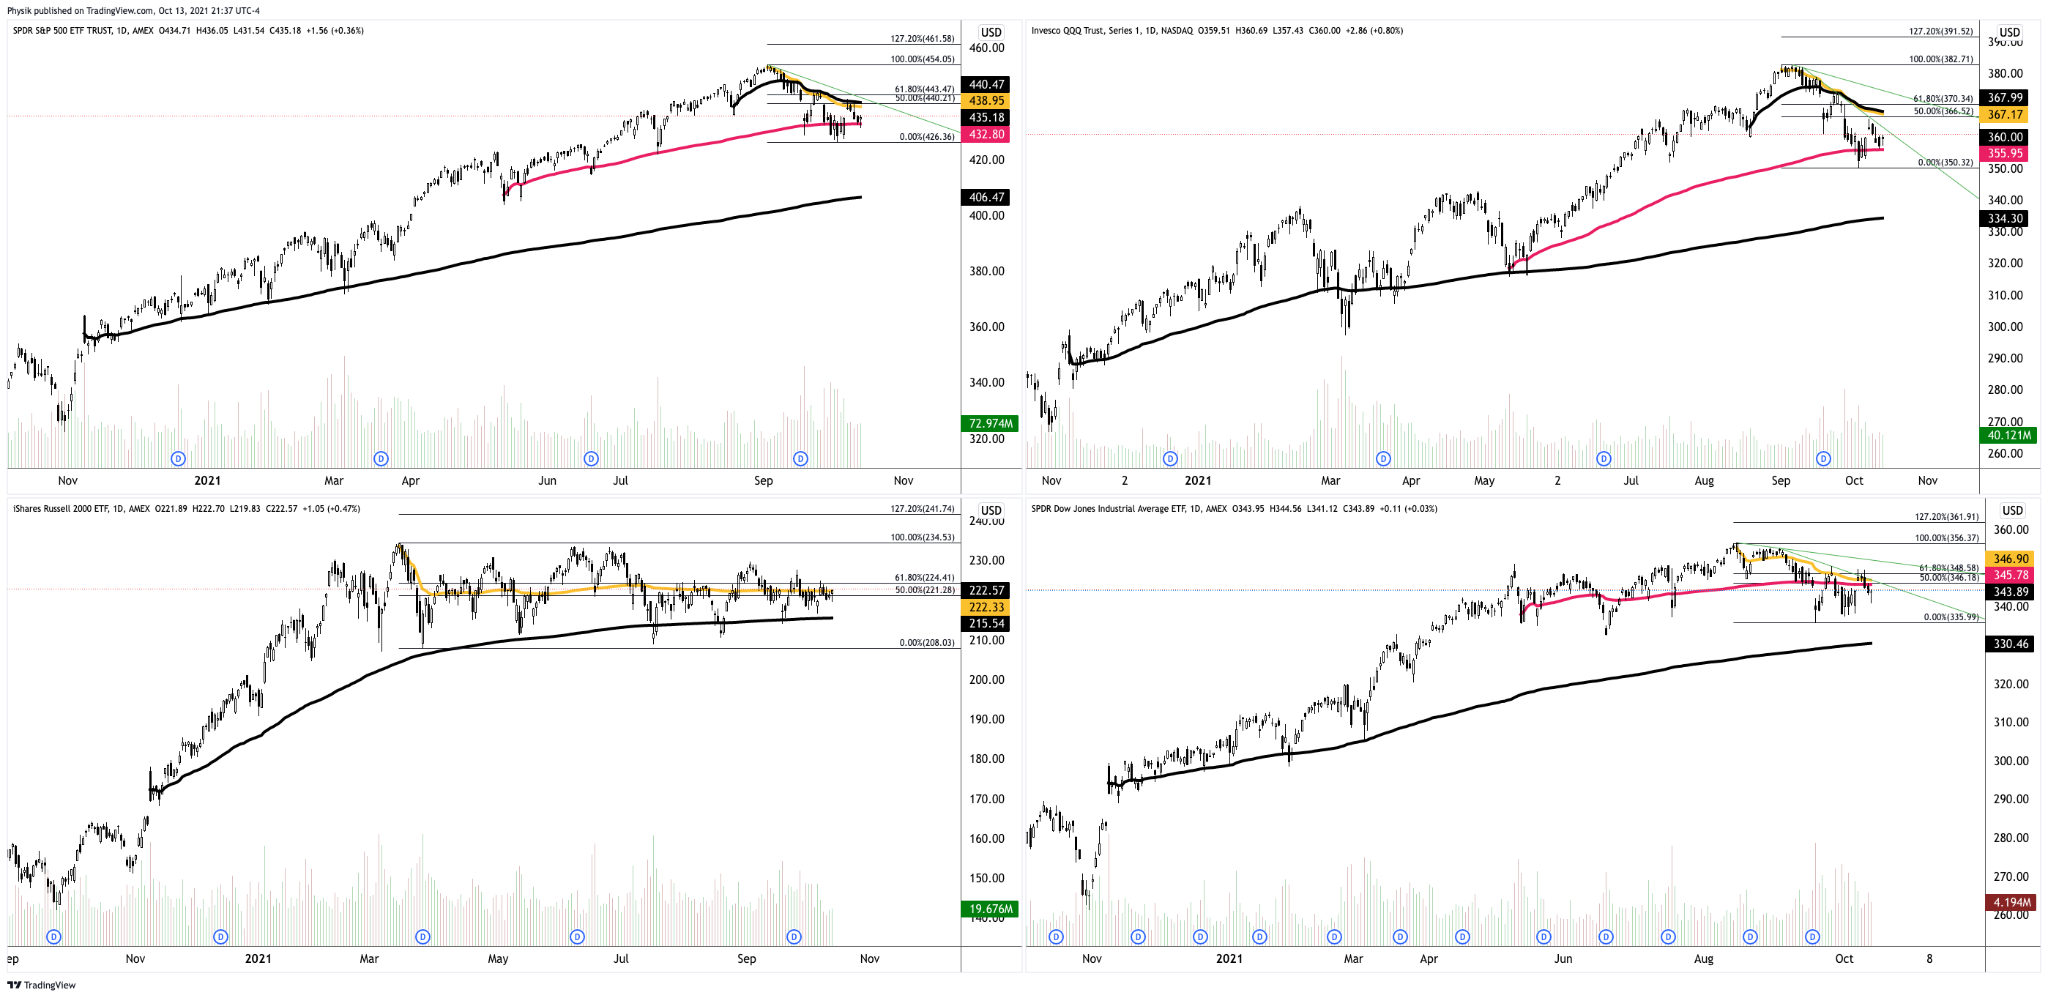
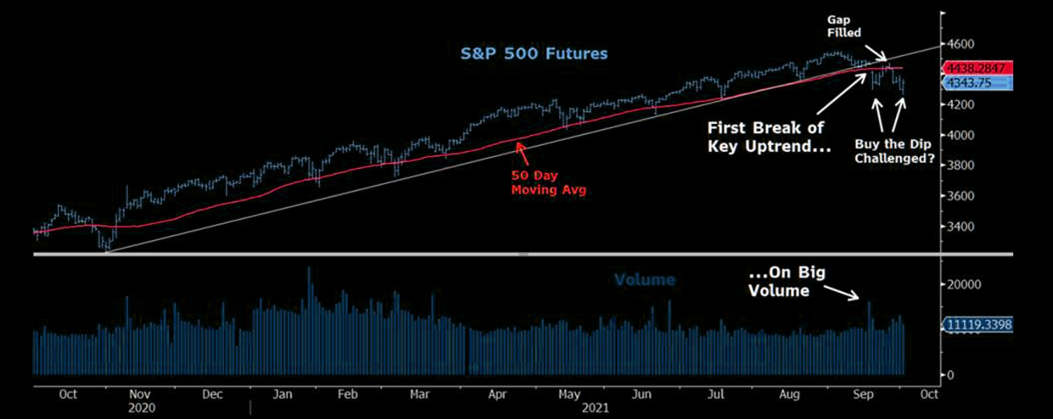
Zooming out, we see that though the Nasdaq 100 firmed this week, it did not recover as much ground as its peers, the S&P 500 and Dow Jones Industrial Average, both of which are trading at or above their all-time high figures.
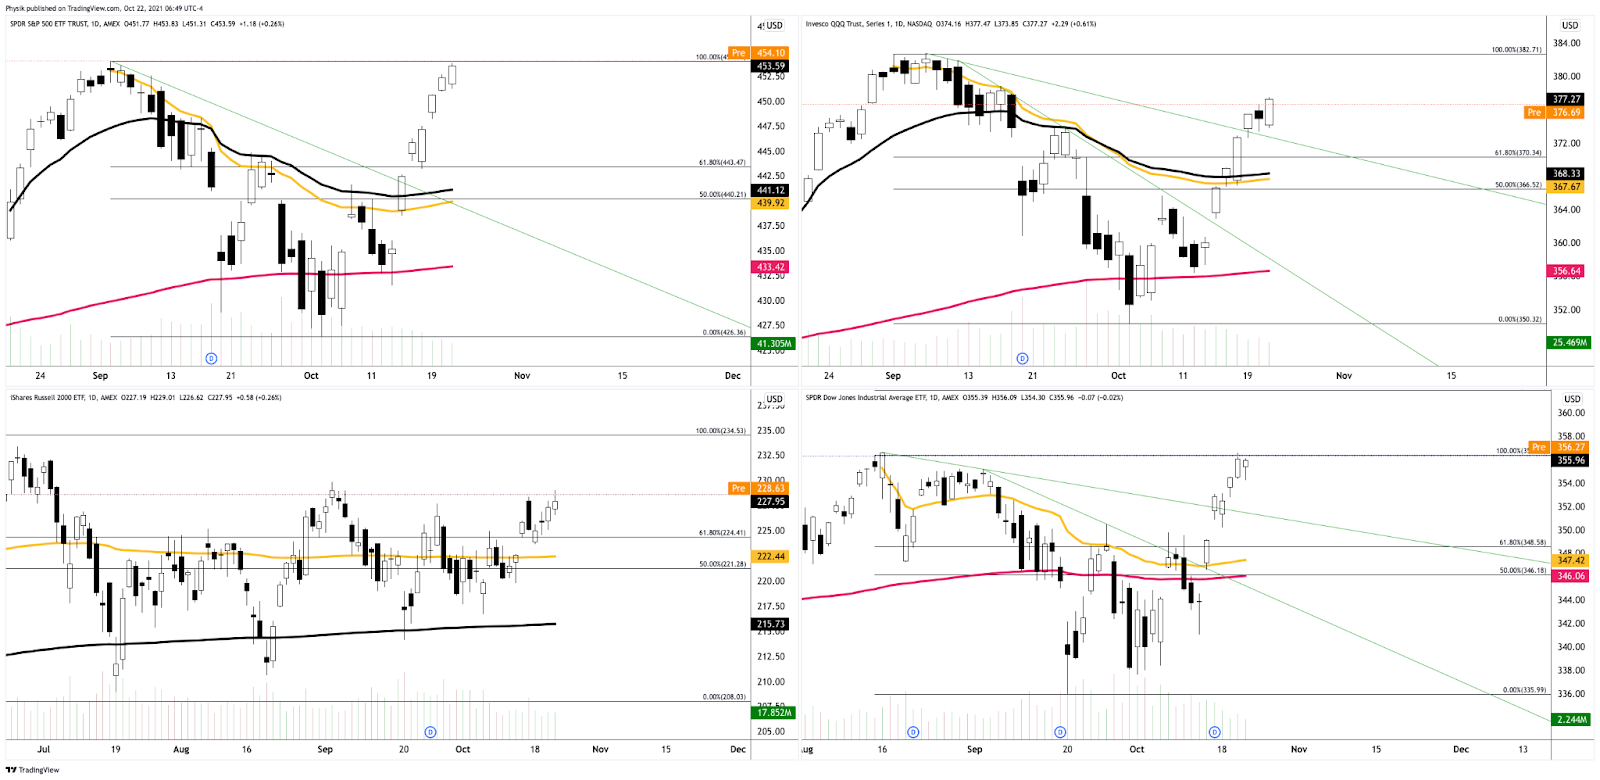
This recovery has been swift and built on relatively poor – low volume – structures that ought to offer minimal support; what this simply means is that higher prices need validation.
Note: Value is defined by where 70% of the day’s trade happened, the bulk of where volume is.

Think of the absence of high volume structures, on the way up, leaving no value to base off of. If prices are followed by value, that means that they are supported. If there is an open above (below) value, a market will auction lower (higher) in search of buyers (sellers). After auctioning too far from value, the response by higher timeframe participants will introduce single-print buying and selling tails as those participants look to take advantage of higher (lower) prices to sell (buy).

Please read this excerpt from Mind Over Markets, for additional context.
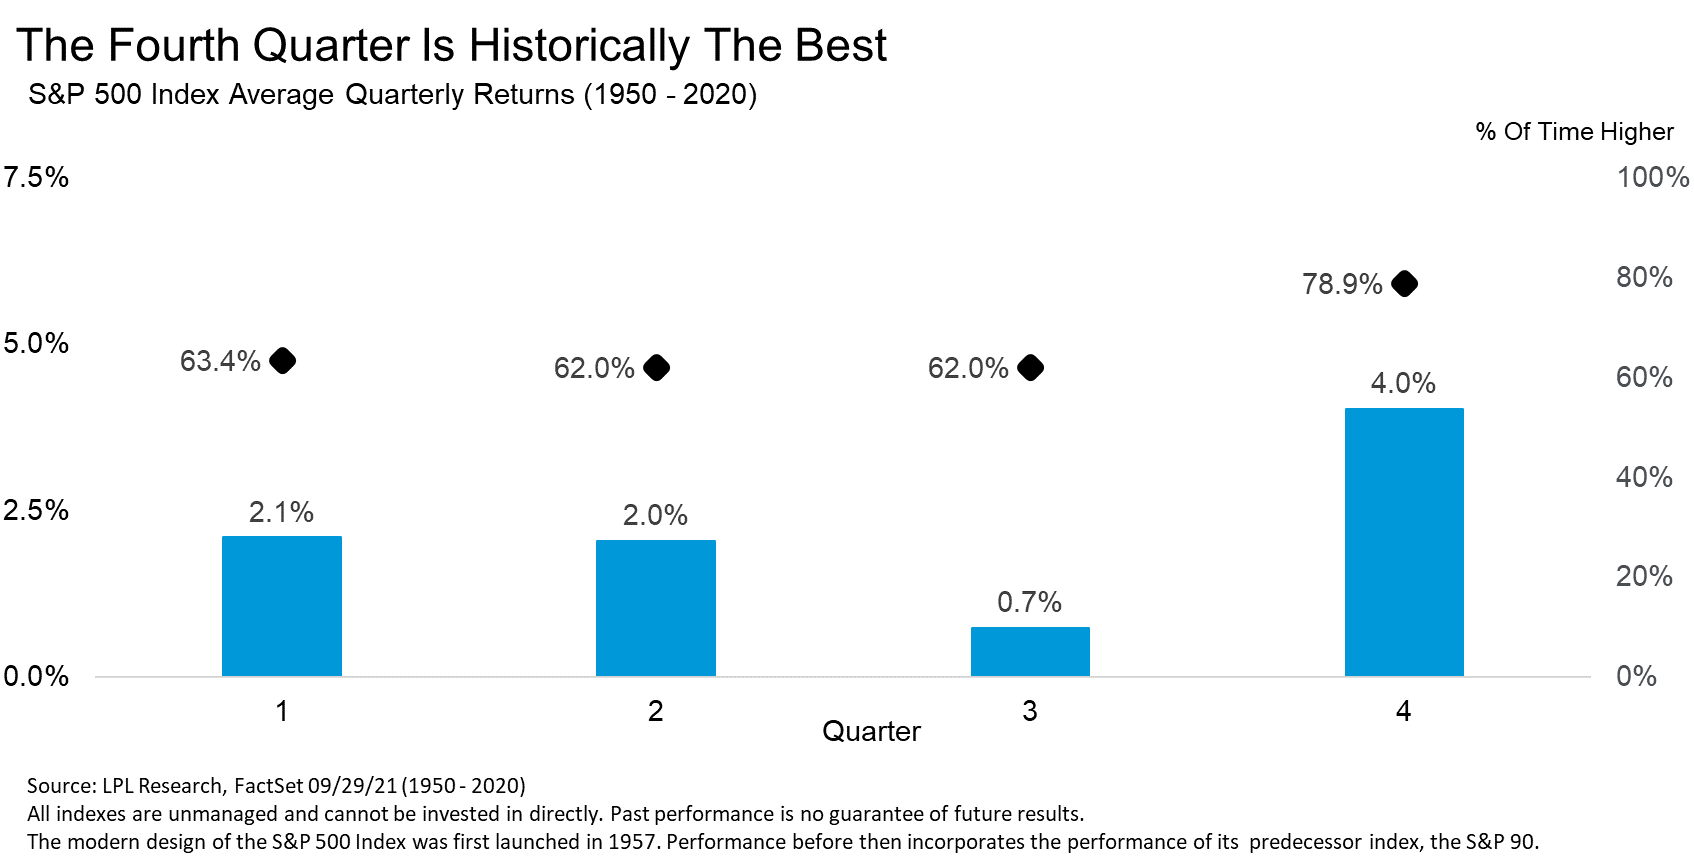
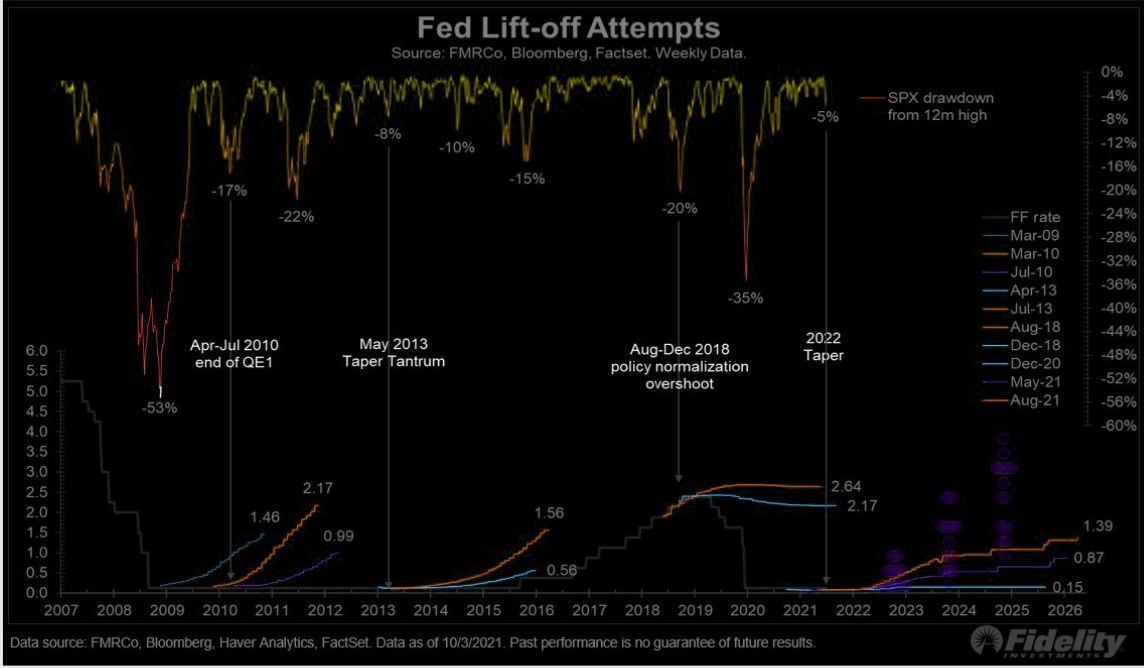
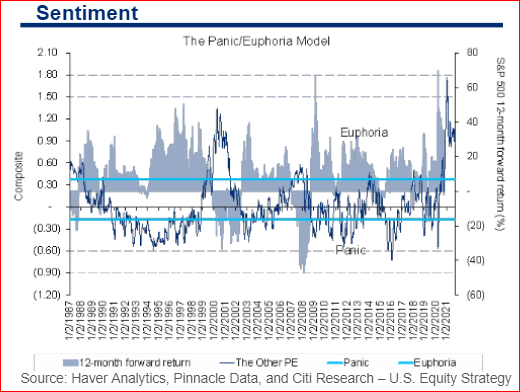
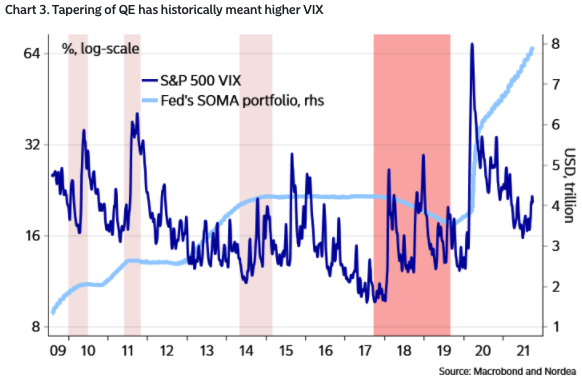
Further, the aforementioned trade is happening in the context of improving breadth amidst a seasonally bullish cycle of contributions, rebalancing, and earnings, as well as the risks associated with a taper in asset purchases and a hike in rates.
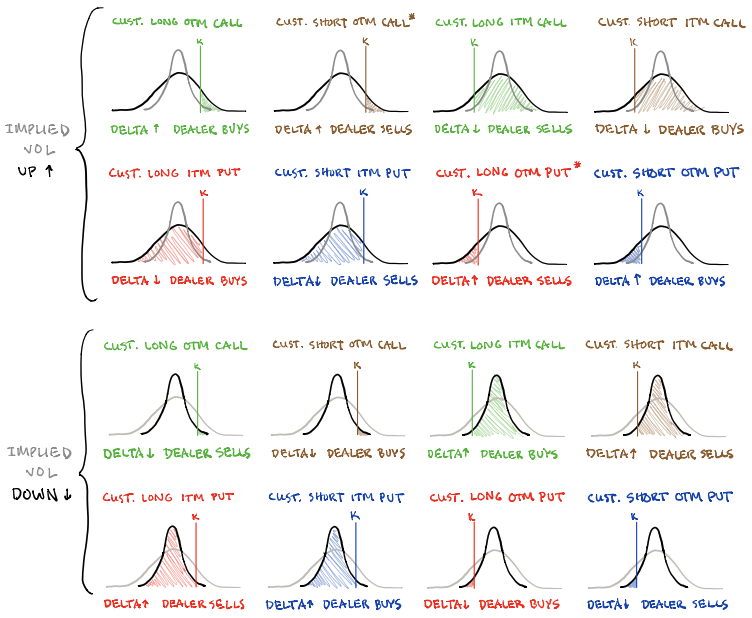
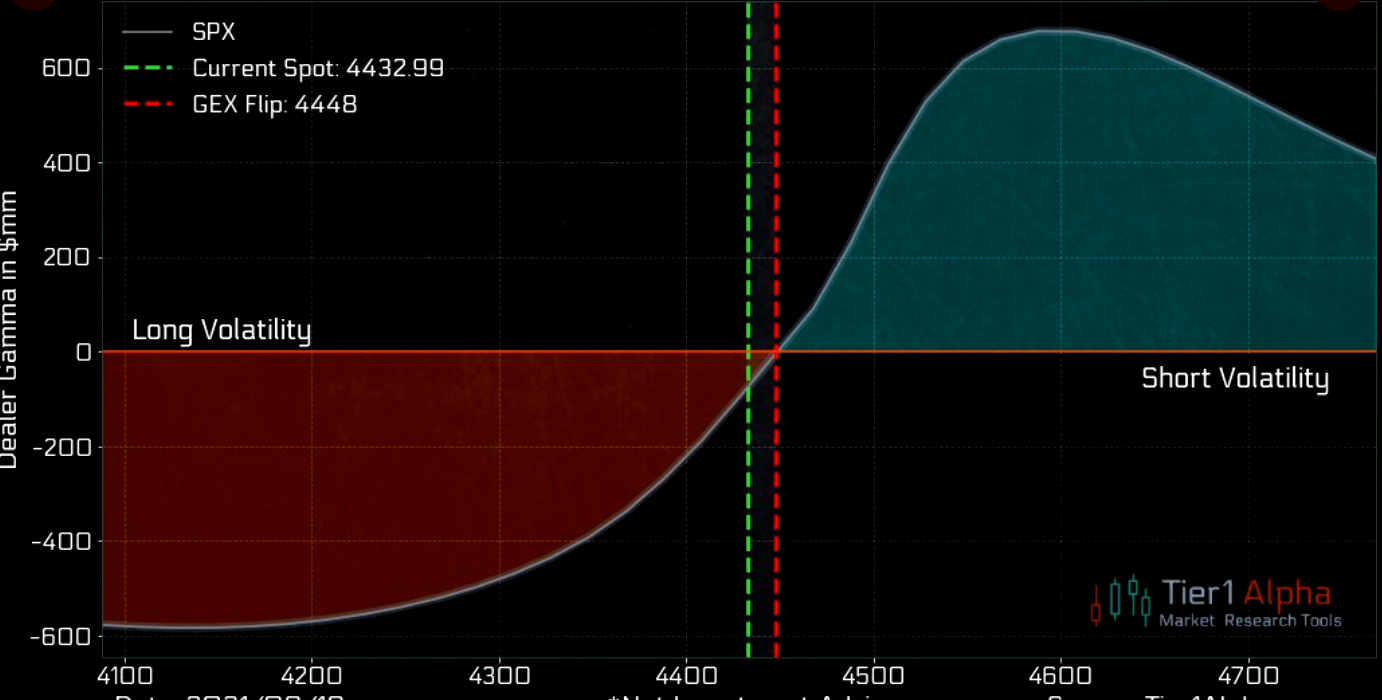
In terms of positioning, the CBOE Volatility Index (INDEX: VIX) was lower, while the VIX futures term structure settled in contango; supply at the front end of the curve, alongside the long-gamma environment, signals a potential for near-term equity market stability.
According to SpotGamma analyses, this is where the so-called vanna (i.e., inflows as a result of options sliding down their term structure) dynamic comes to dominate. Adding, we look for increased interest in options strikes that are higher in price and further out in time.
Moreover, for today, participants may make use of the following frameworks.
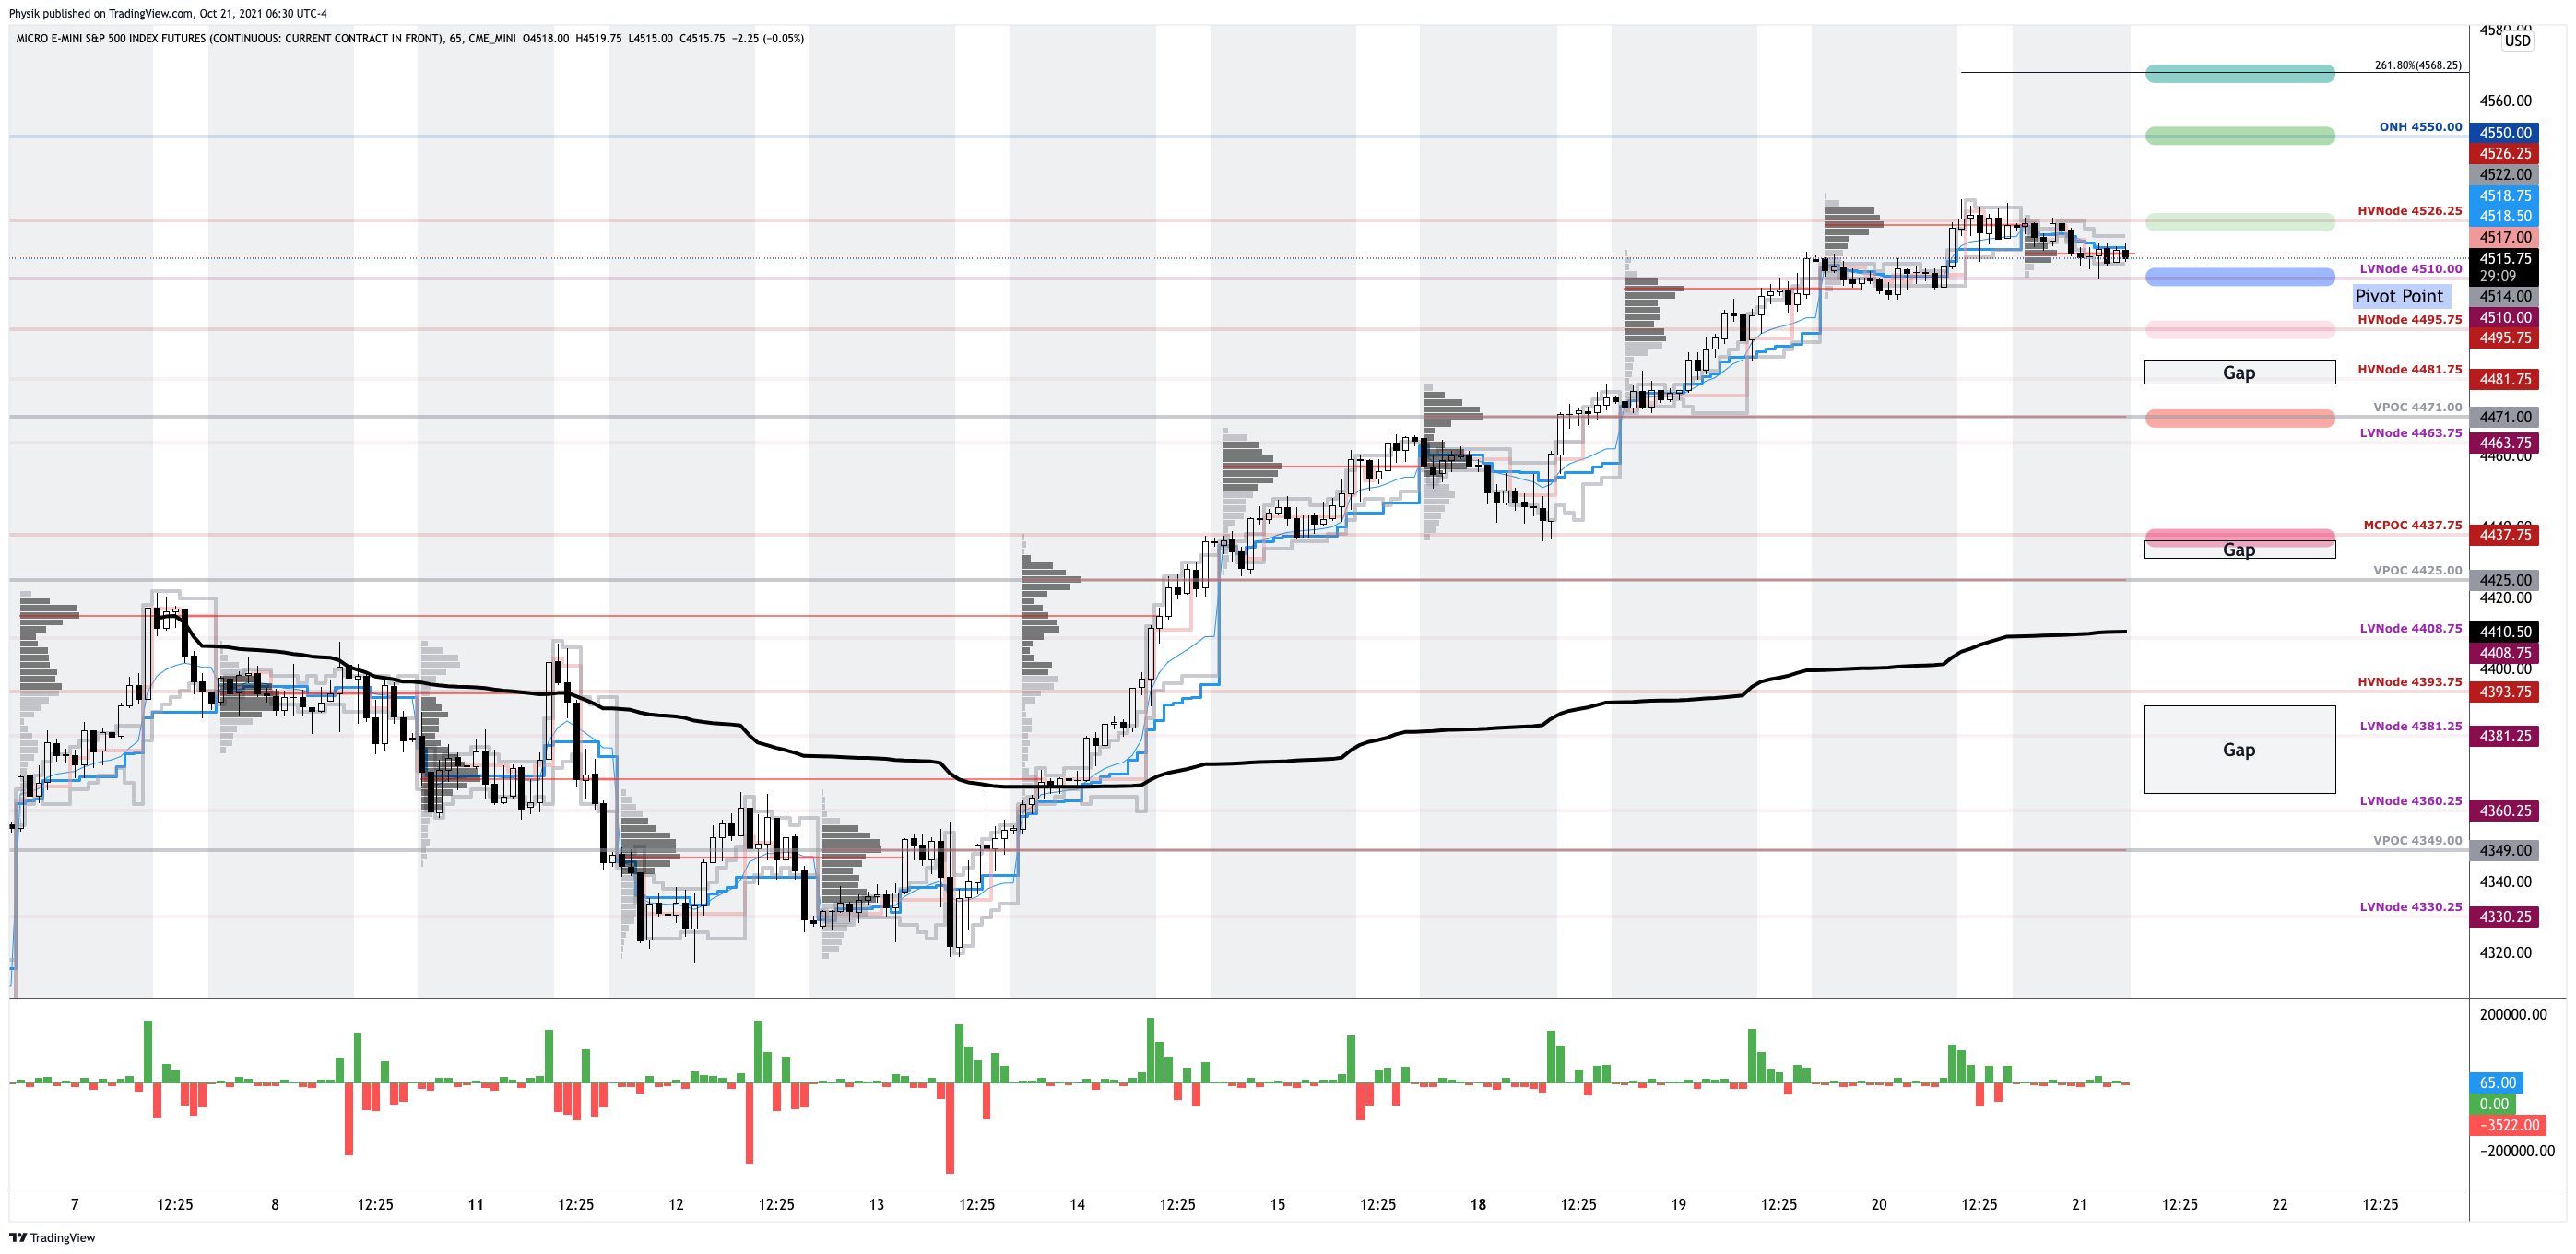
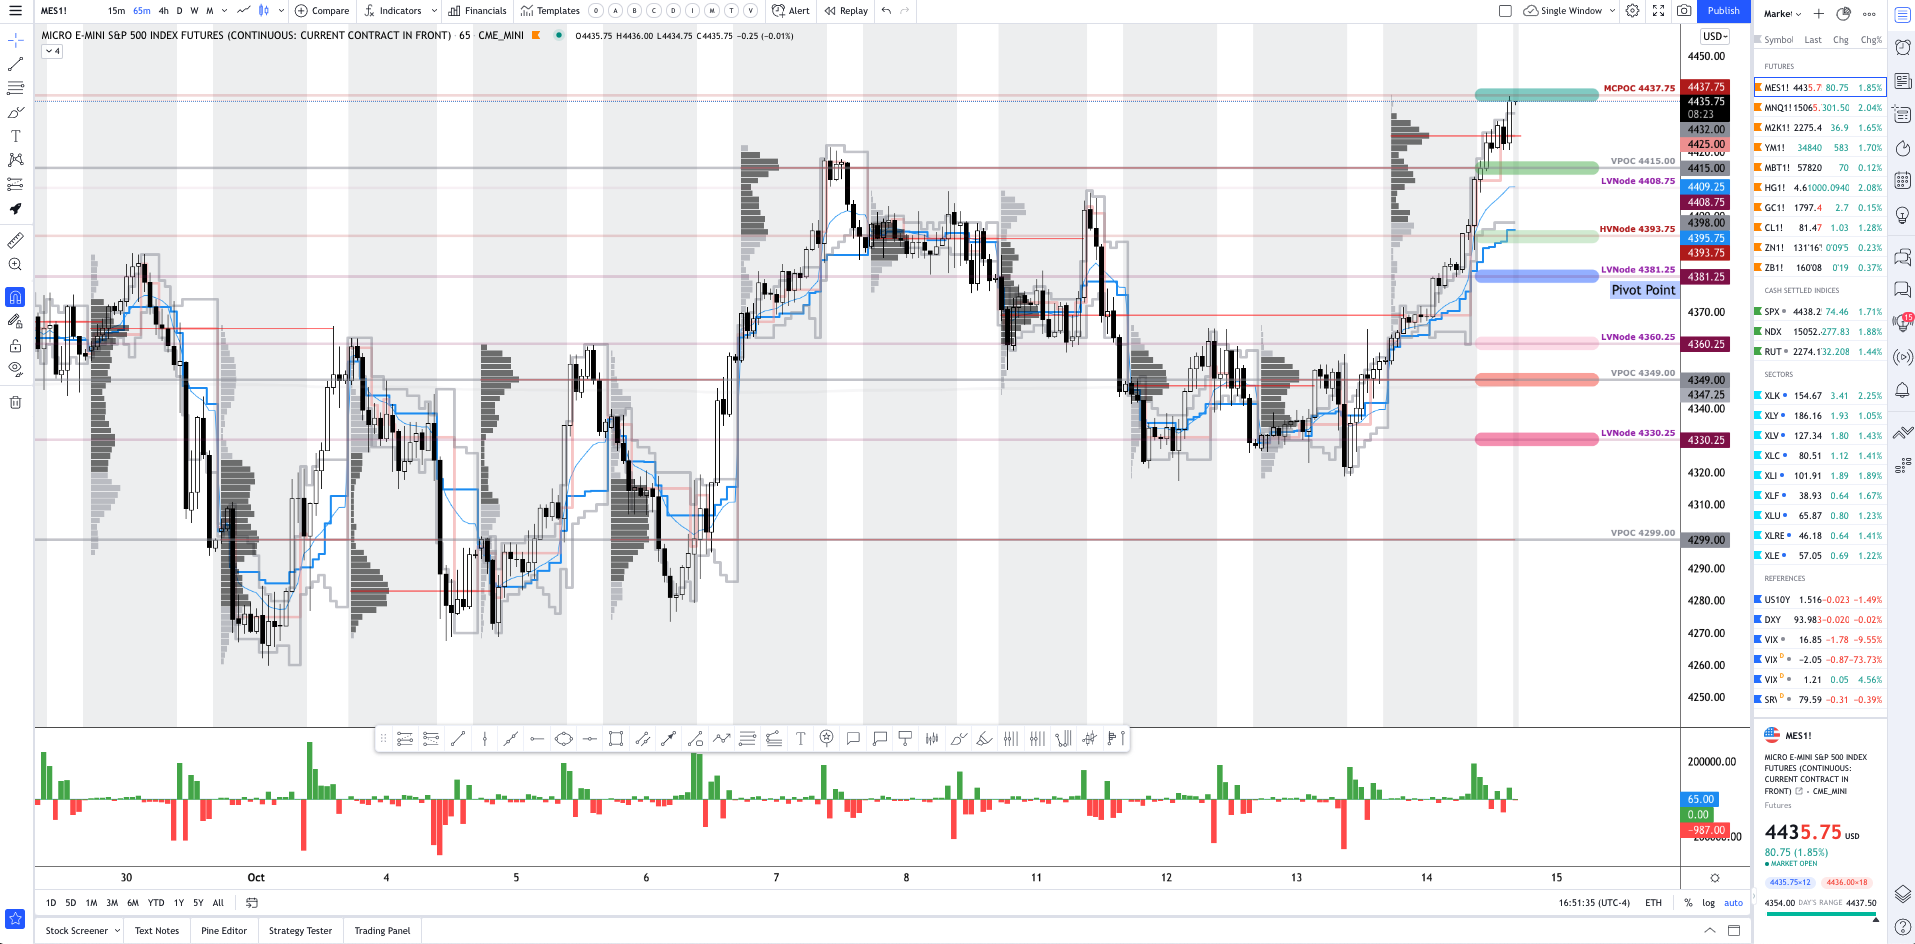
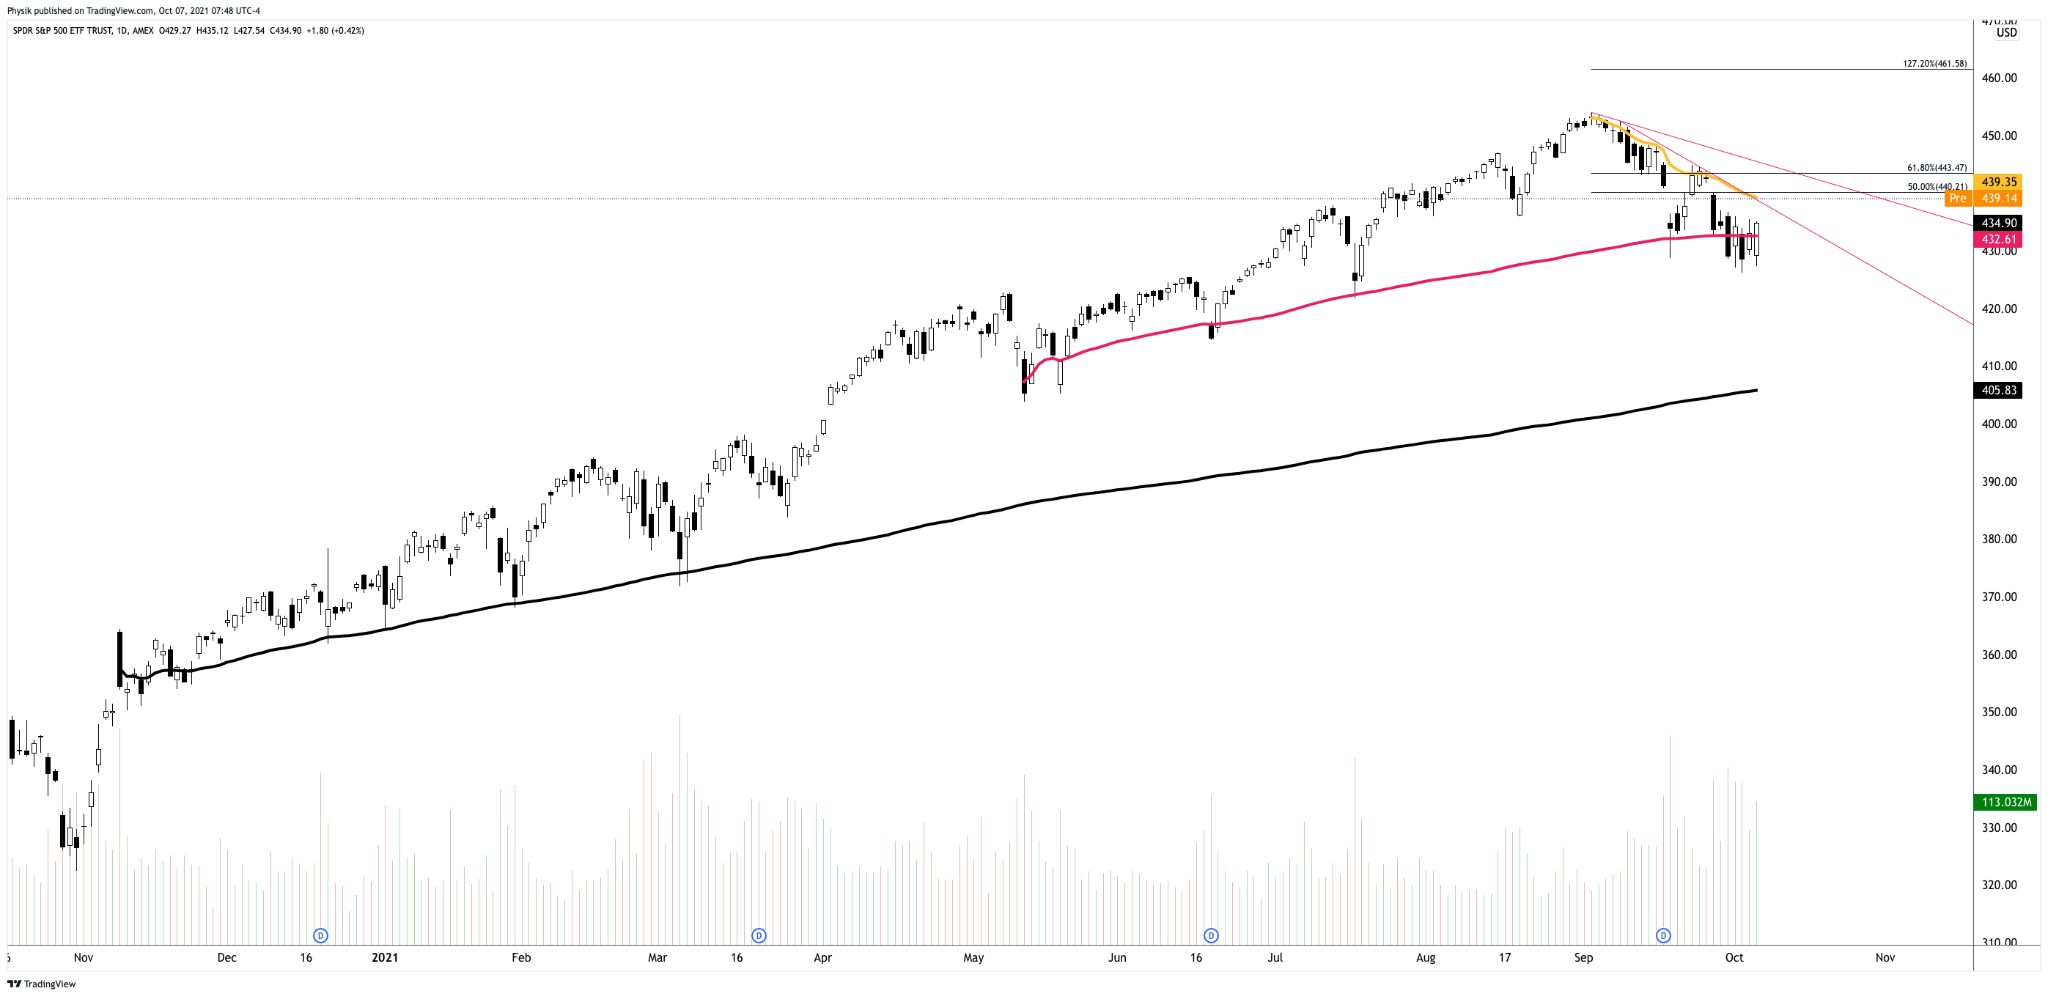
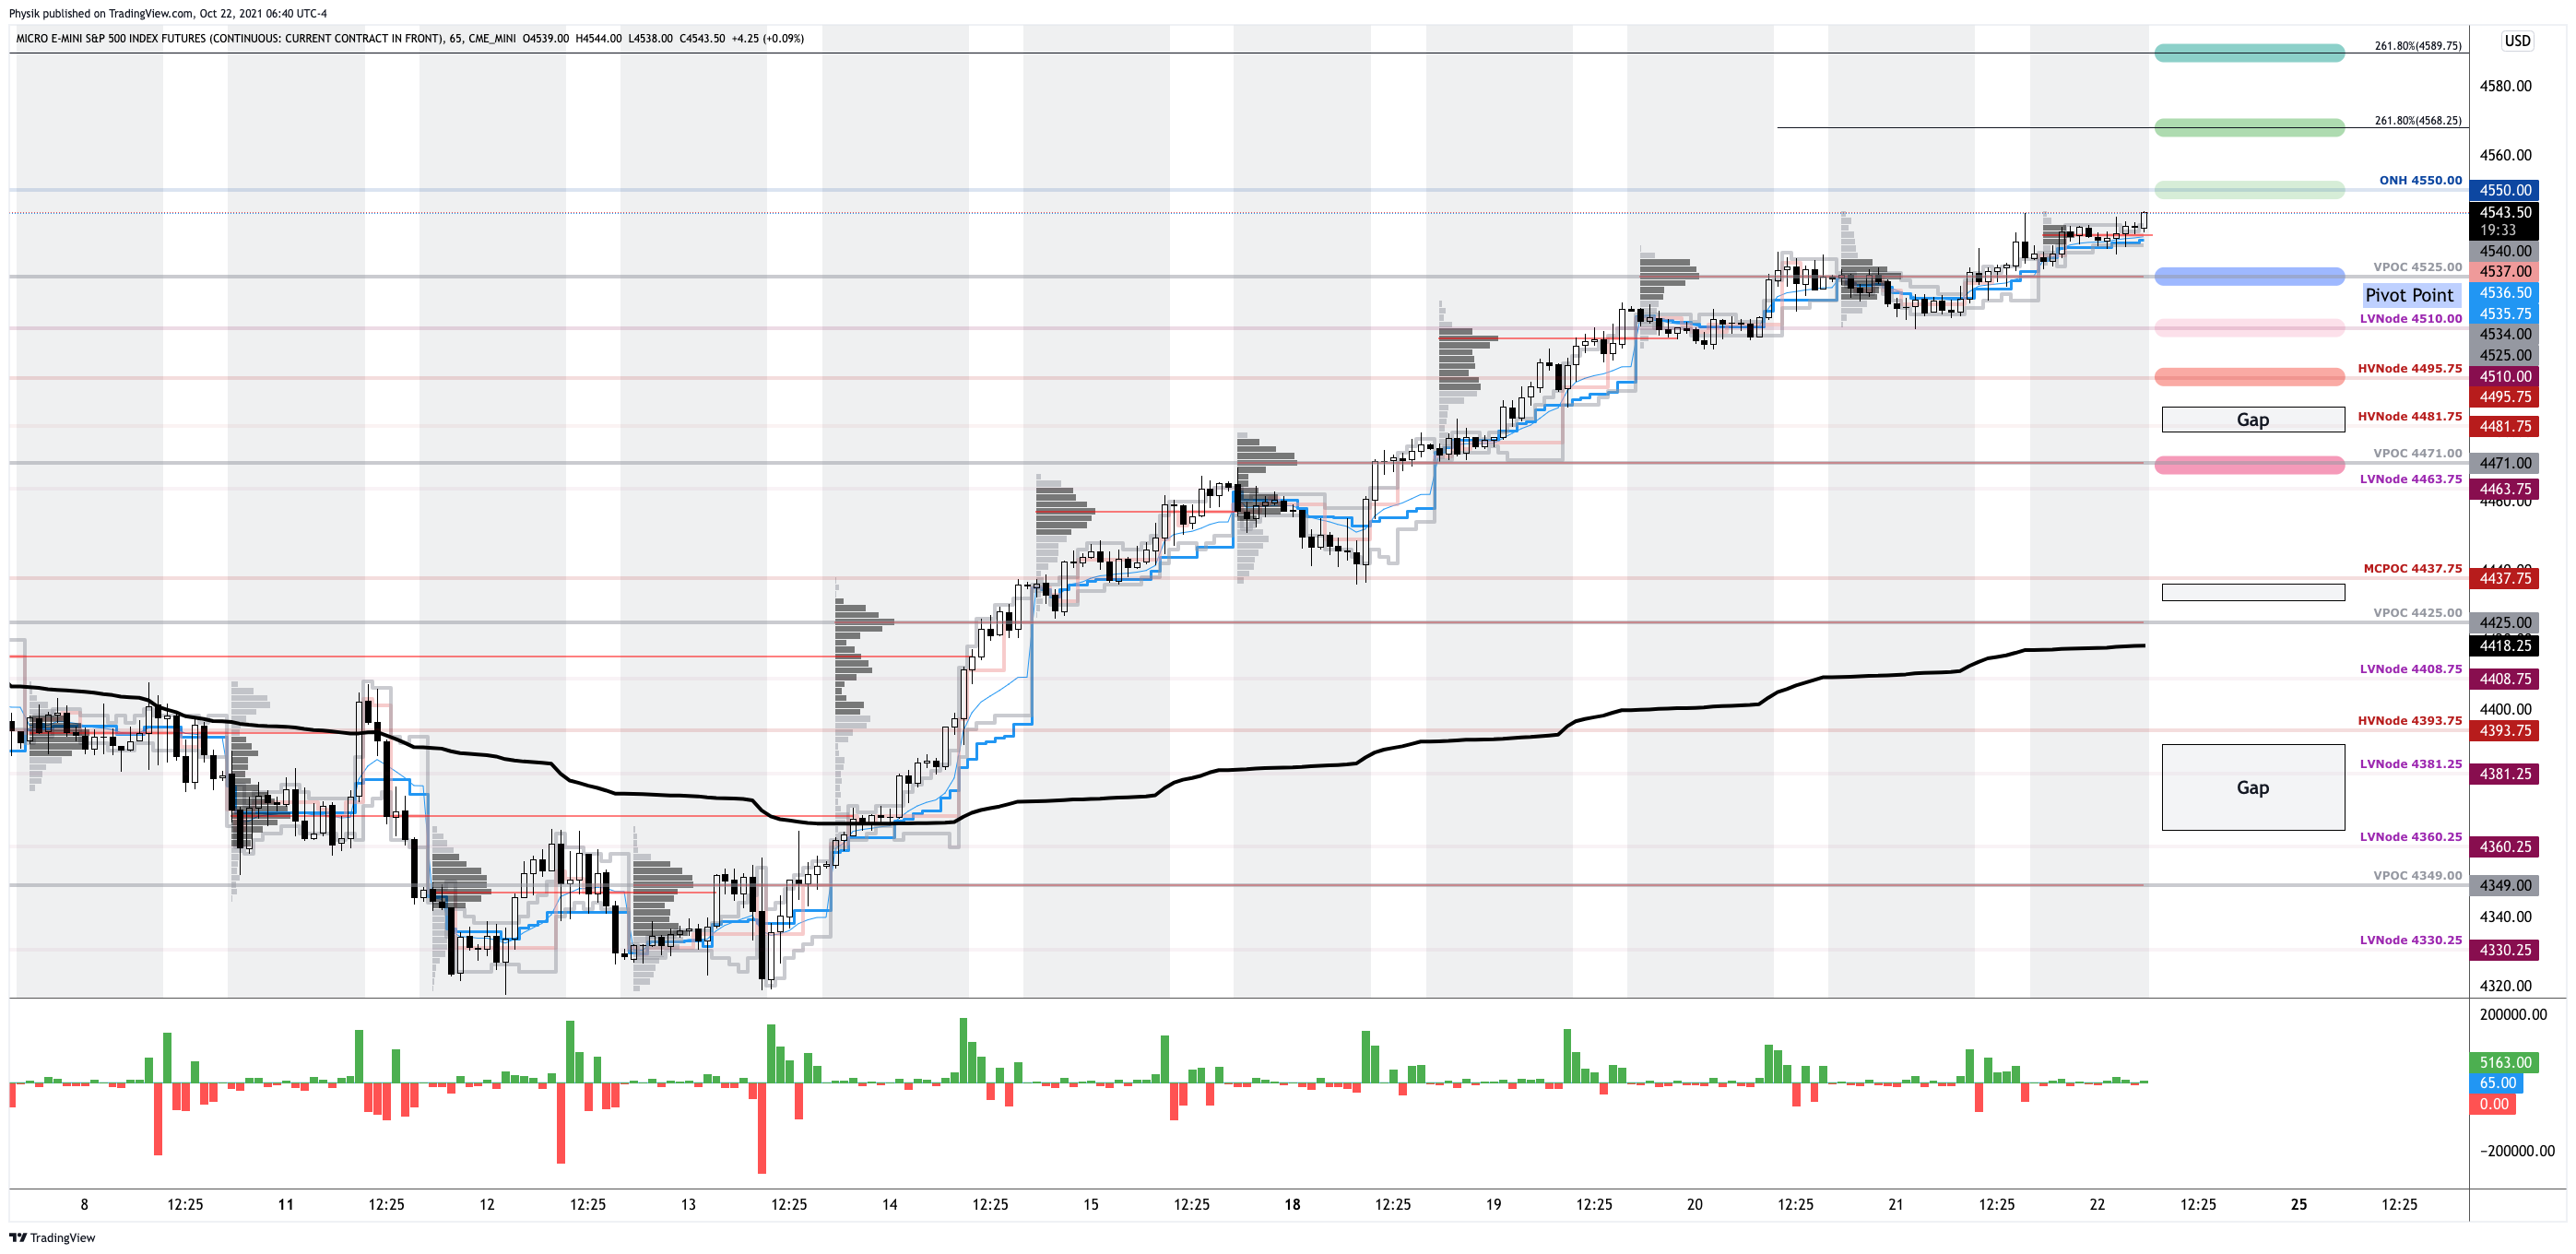
In the best case, the S&P 500 trades sideways or higher; activity above the $4,525.00 untested point of control (VPOC) puts in play the $4,550.00 overnight high (ONH). Initiative trade beyond the ONH could reach as high as the $4,568.25 and $4,589.75 Fibonacci extensions, or higher.
In the worst case, the S&P 500 trades lower; activity below the $4,525.00 VPOC puts in play the $4,510.00 low volume area (LVNode). Initiative trade beyond the LVNode could reach as low as the $4,495.75 high volume area (HVNode) and $4,471.00 VPOC, or lower.
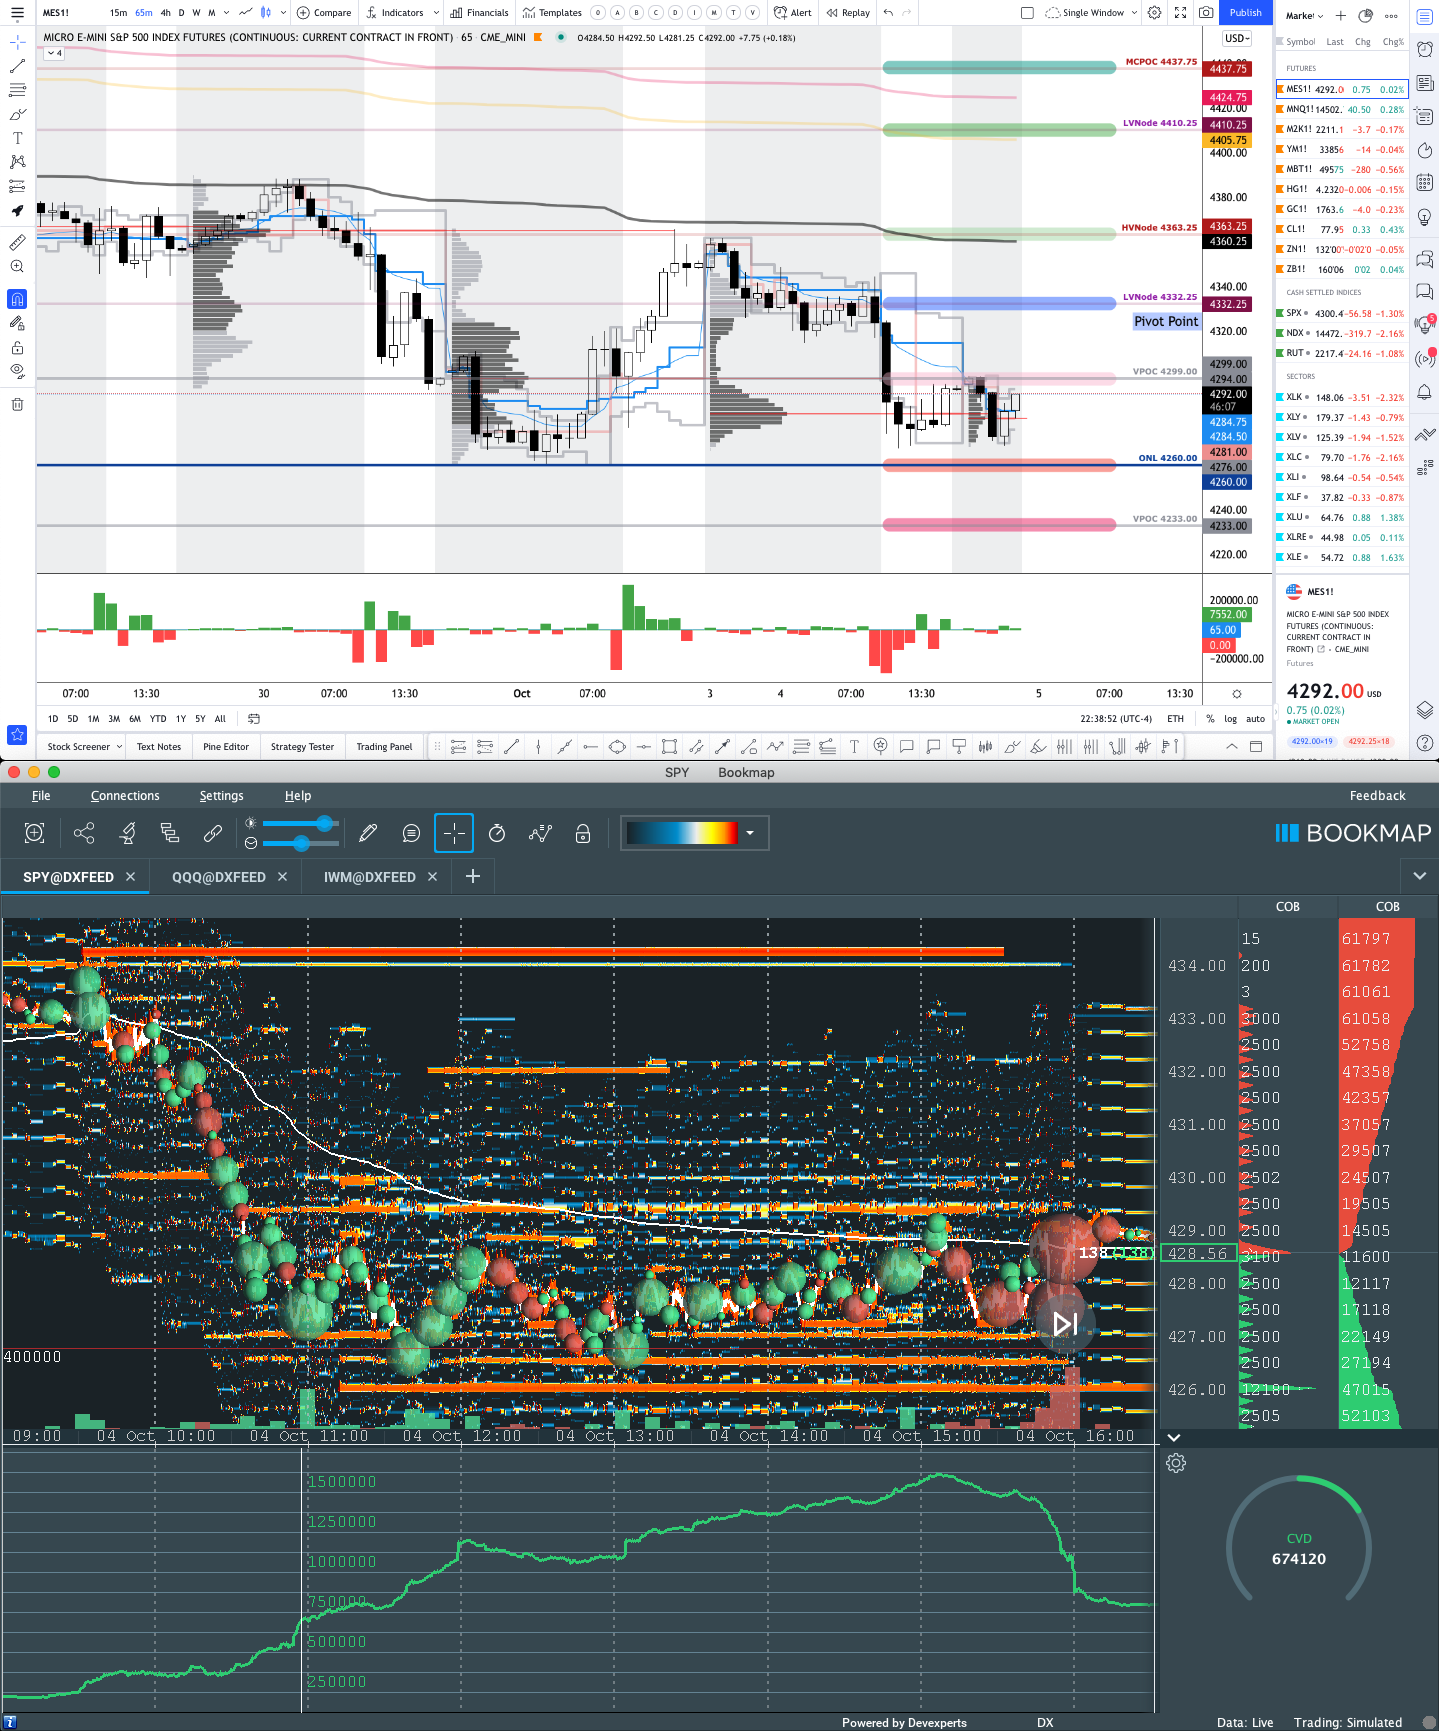
Click here to load today’s updated real-time key levels into the web-based TradingView charting platform. Please note that all levels are derived using the 65-minute timeframe.

Definitions
Cave-Fill Process: Widened the area deemed favorable to transact at by an increased share of participants. This is a good development.
Overnight Rally Highs (Lows): Typically, there is a low historical probability associated with overnight rally-highs (lows) ending the upside (downside) discovery process.

Volume Areas: A structurally sound market will build on areas of high volume (HVNodes). Should the market trend for long periods of time, it will lack sound structure, identified as low volume areas (LVNodes). LVNodes denote directional conviction and ought to offer support on any test.

If participants were to auction and find acceptance into areas of prior low volume (LVNodes), then future discovery ought to be volatile and quick as participants look to HVNodes for favorable entry or exit.

POCs: POCs are valuable as they denote areas where two-sided trade was most prevalent in a prior day session. Participants will respond to future tests of value as they offer favorable entry and exit.
Excess: A proper end to price discovery; the market travels too far while advertising prices. Responsive, other-timeframe (OTF) participants aggressively enter the market, leaving tails or gaps which denote unfair prices.
Ledges: Flattened area on the profile which suggests responsive participants are in control, or initiative participants lack the confidence to continue the discovery process. The ledge will either hold and force participants to liquidate (cover) their positions, or crack and offer support (resistance).
Volume-Weighted Average Prices (VWAPs): A metric highly regarded by chief investment officers, among other participants, for quality of trade. Additionally, liquidity algorithms are benchmarked and programmed to buy and sell around VWAPs.
News And Analysis
U.K. consumer confidence falls amidst cheerless news.
Growth digitalization of finance intensifying competition.
Supply issues could haunt the holidays after sales rise.
Substantial progress toward Fed’s mandates. Tapering?
Think everything’s expensive now? Wait there is more.
Big jump in home sales – impressive considering supply.
Biden: U.S. would defend Taiwan from attack by China.
Online wager, engagement key to sports betting growth.
What People Are Saying
About
After years of self-education, strategy development, and trial-and-error, Renato Leonard Capelj began trading full-time and founded Physik Invest to detail his methods, research, and performance in the markets.
Additionally, Capelj is a finance and technology reporter. Some of his biggest works include interviews with leaders such as John Chambers, founder and CEO, JC2 Ventures, Kevin O’Leary, businessman and Shark Tank host, Catherine Wood, CEO and CIO, ARK Invest, among others.
Disclaimer
At this time, Physik Invest does not manage outside capital and is not licensed. In no way should the materials herein be construed as advice. Derivatives carry a substantial risk of loss. All content is for informational purposes only.