Categories
Commentary

Daily Brief For March 14, 2023

Physik Invest’s Daily Brief is read free by thousands of subscribers. Join this community to learn about the fundamental and technical drivers of markets.
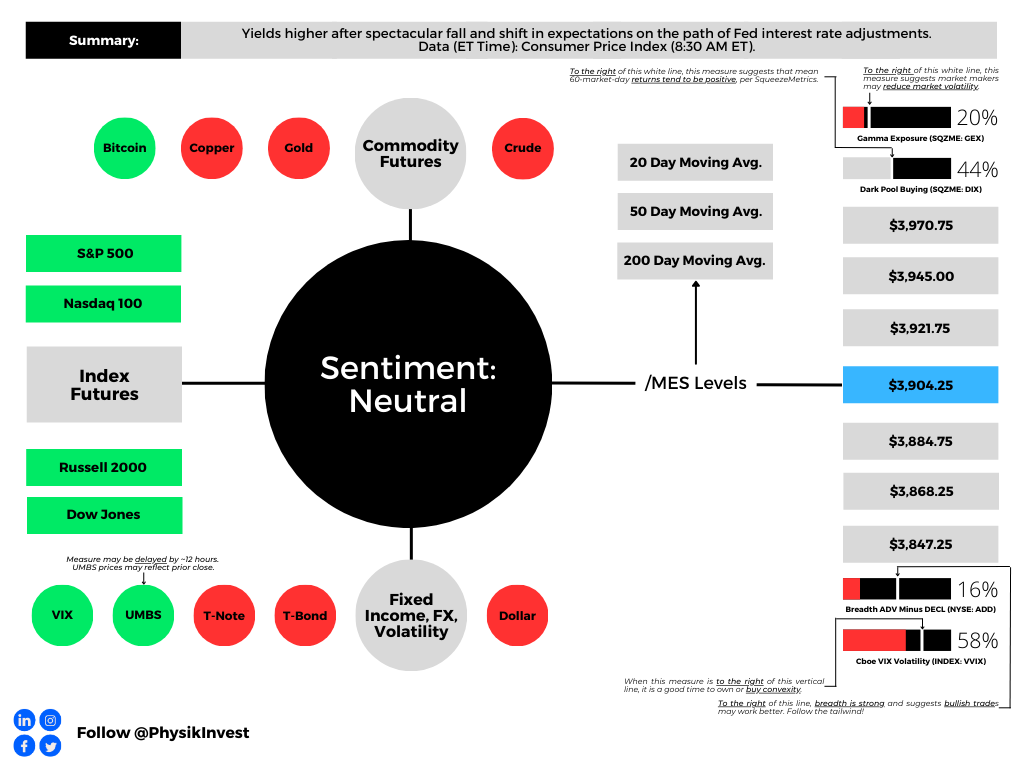
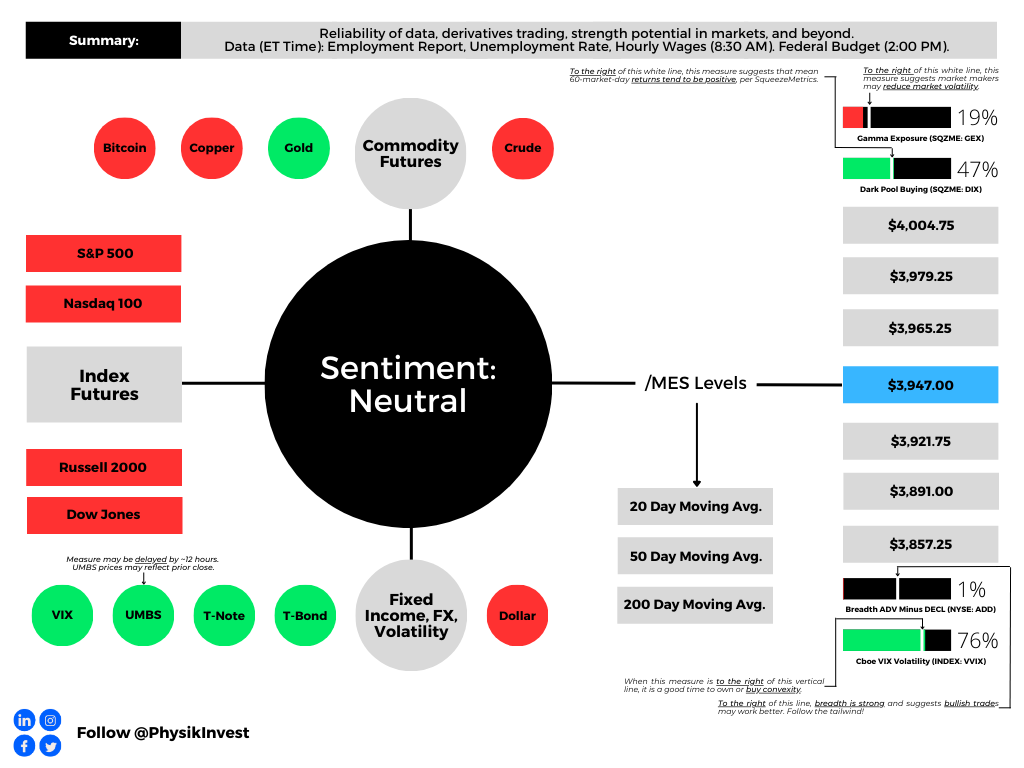
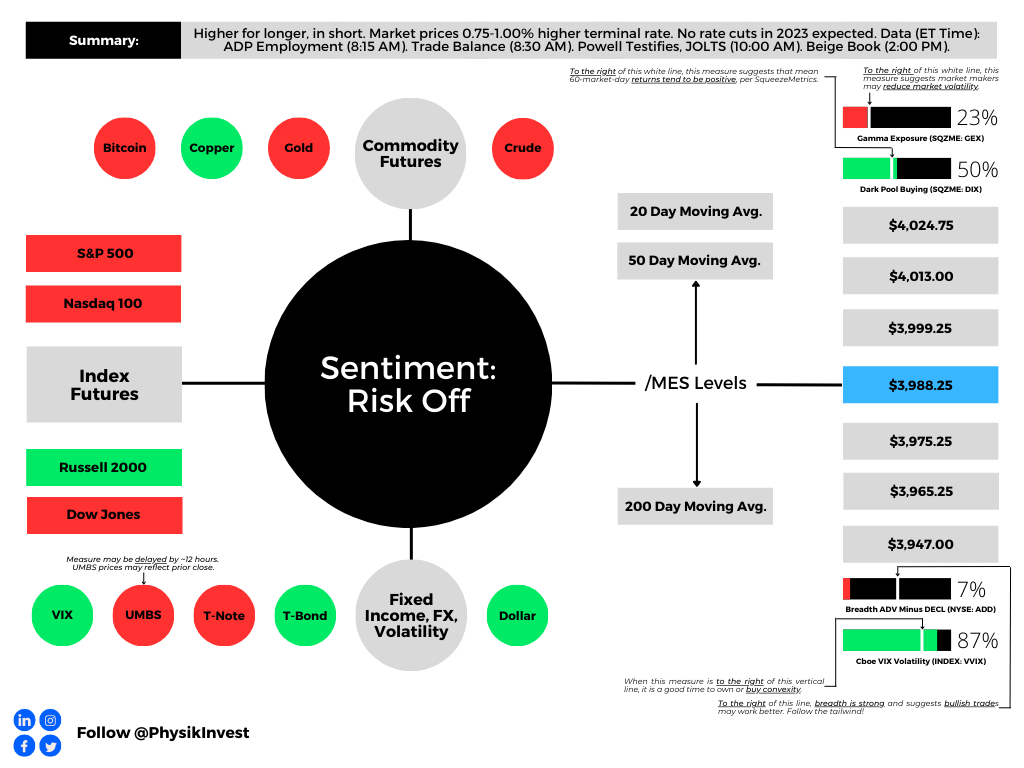
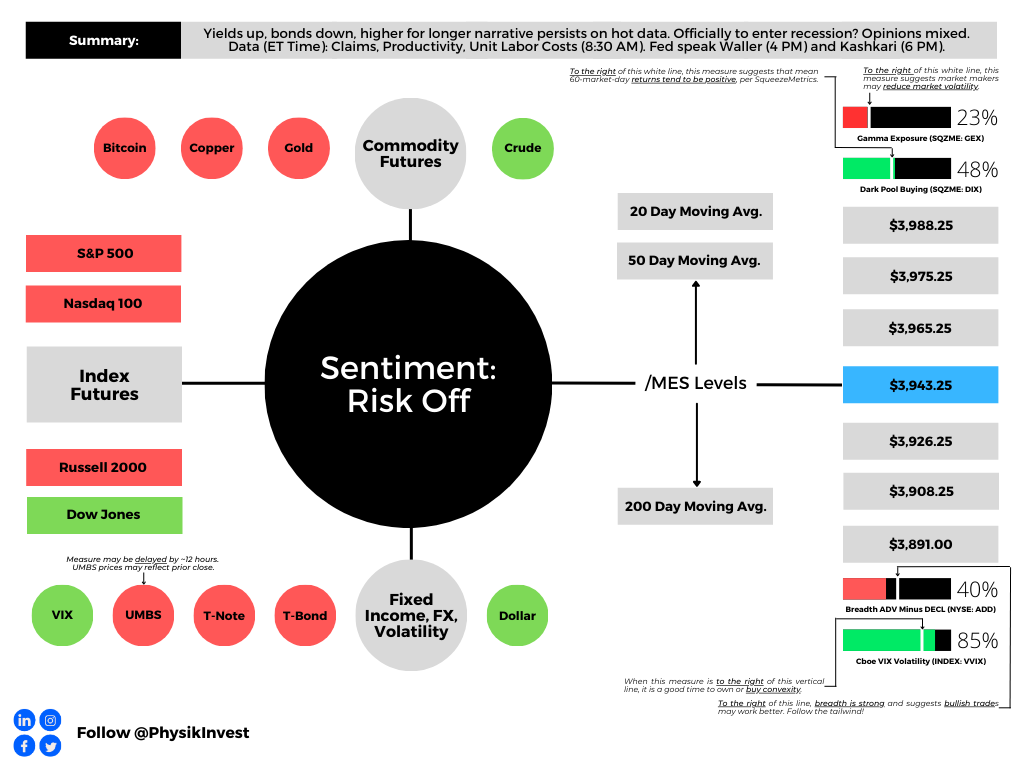
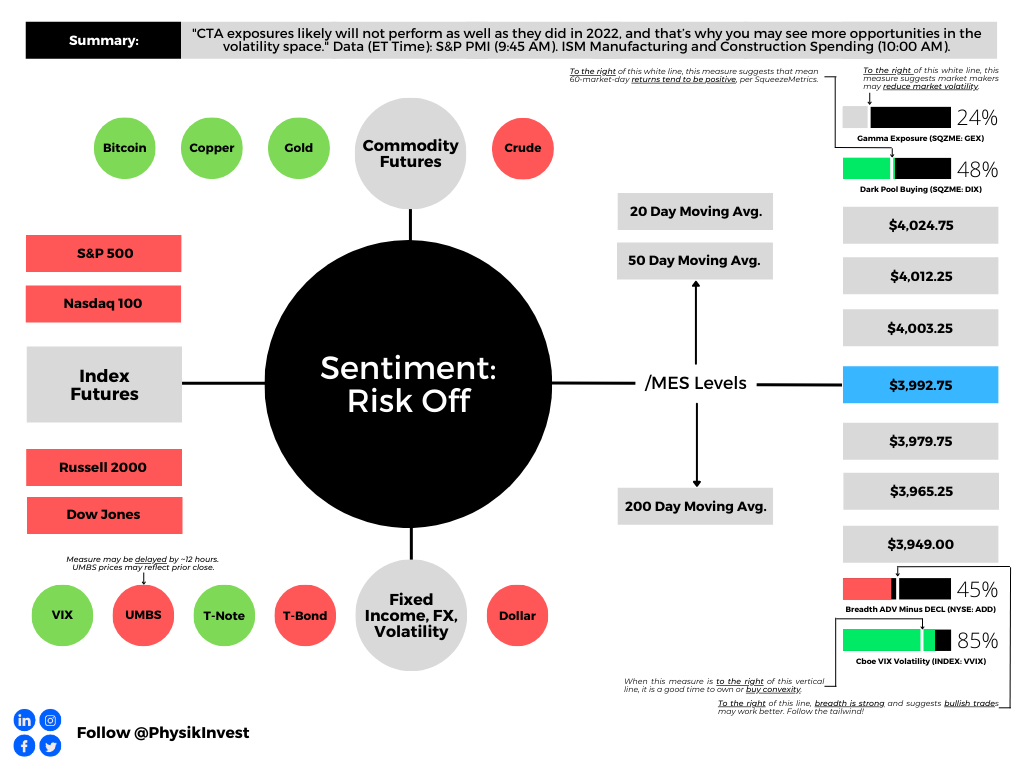
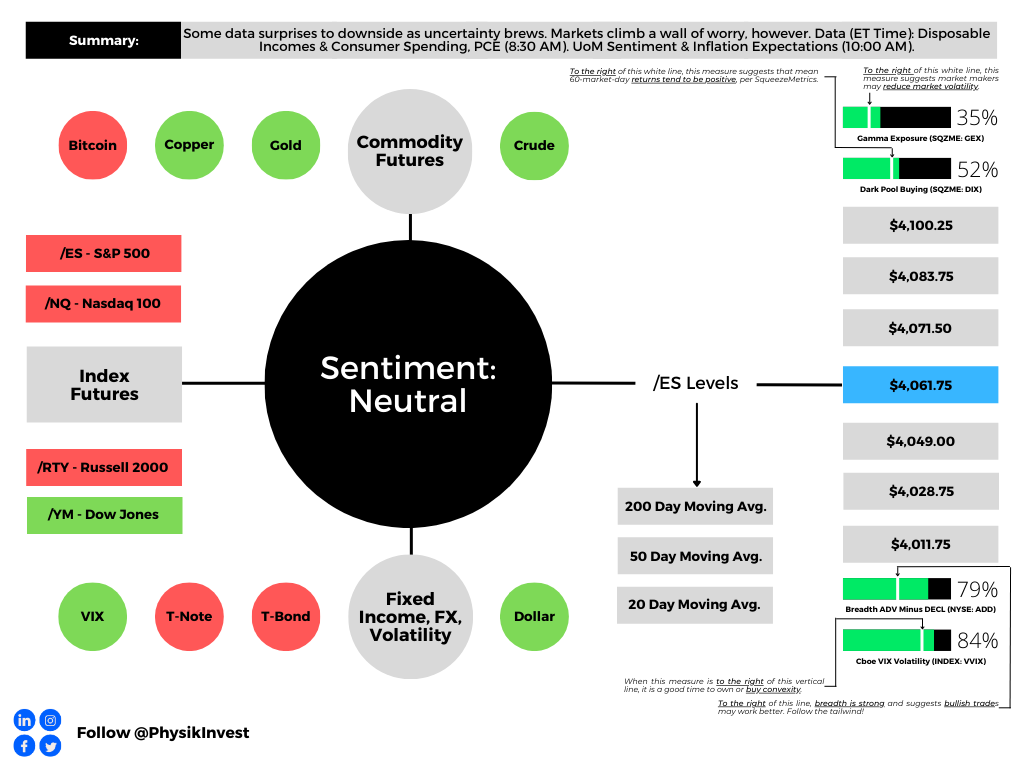
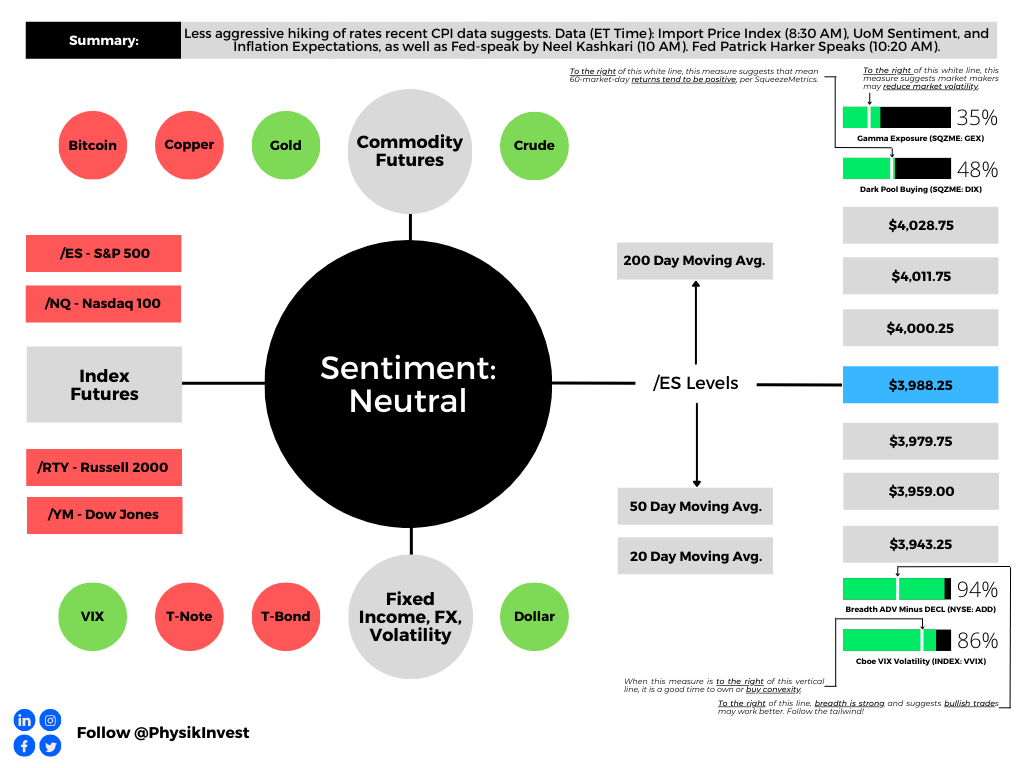
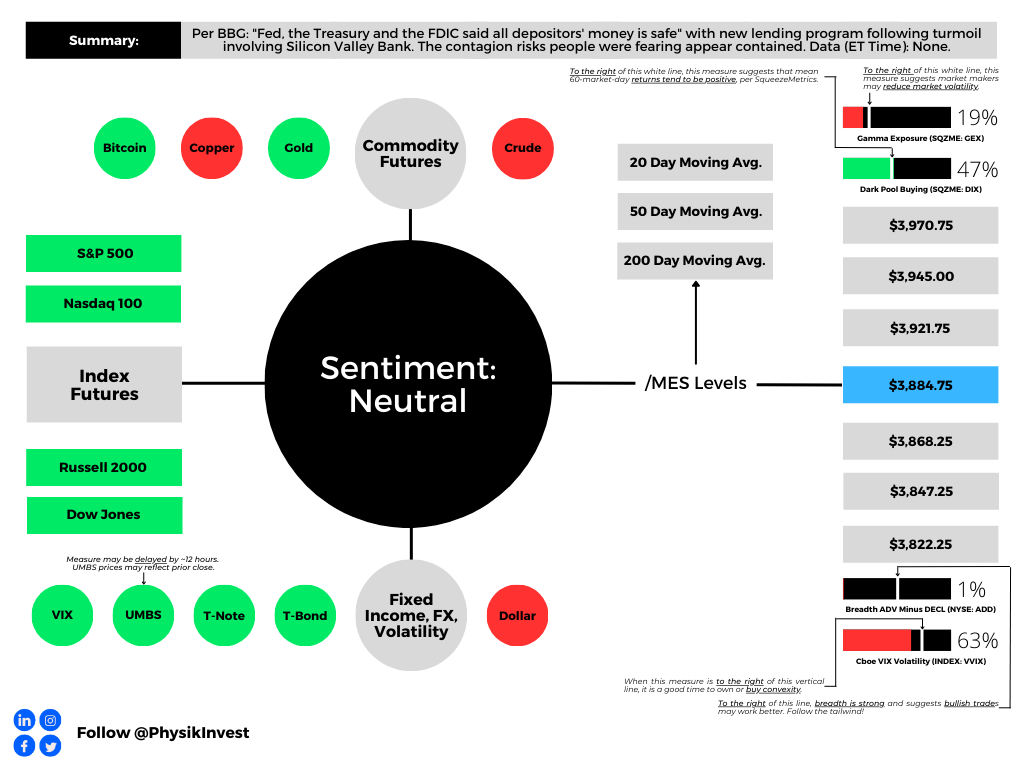
Graphic updated 6:30 AM ET. Sentiment Neutral if expected /MES open is inside of the prior day’s range. /MES levels are derived from the profile graphic at the bottom of this letter. Click here for the latest levels. SqueezeMetrics Dark Pool Index (DIX) and Gamma (GEX) with the latter calculated based on where the prior day’s reading falls with respect to the MAX and MIN of all occurrences available. A higher DIX is bullish. The lower the GEX, the more (expected) volatility. Click to learn the implications of volatility, direction, and moneyness. Breadth reflects a reading of the prior day’s NYSE Advance/Decline indicator. The CBOE VIX Volatility Index (INDEX: VVIX) reflects the attractiveness of owning volatility. UMBS prices via MNDClick here for the economic calendar.

Administrative

A long(er) letter, today. Through the end-of-this week, newsletters may be shorter due to the letter writer’s commitments. Take care!

Fundamental

Yesterday’s letter focused on the SVB Financial Group (NASDAQ: SIVB) failure, albeit with an optimistic tone. In short, the bank could not make good on fast accelerating withdrawals. Read more here.

According to one TechCrunch article, the likes of Founders Fund “reportedly advised their portfolio companies … to withdraw their money, … [and], if everybody is telling each other that SVB is in trouble, that will be a challenge,” as it was.
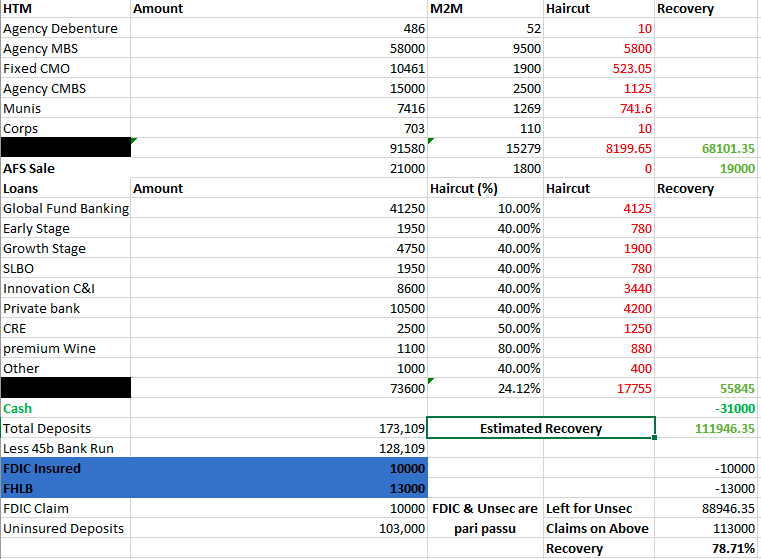
Graphic: Retrieved from @Citrini7. In the worst-case scenario, it was likely that uninsured depositors at SIVB would have received $0.80 on each dollar barring a bailout.

Authorities later put forth emergency measures guaranteeing all deposits. The effort shored up confidence in the banking system and markets strengthened, though some regional names such as First Republic Bank (NYSE: FRC) continued trading weak. In FRC’s case, the Federal Reserve’s (Fed) new bailout facility does not help. As former Fed trader Joseph Wang explains, “you need Treasuries and Agency MBS to tap the facility, and [FRC] barely owns any.”
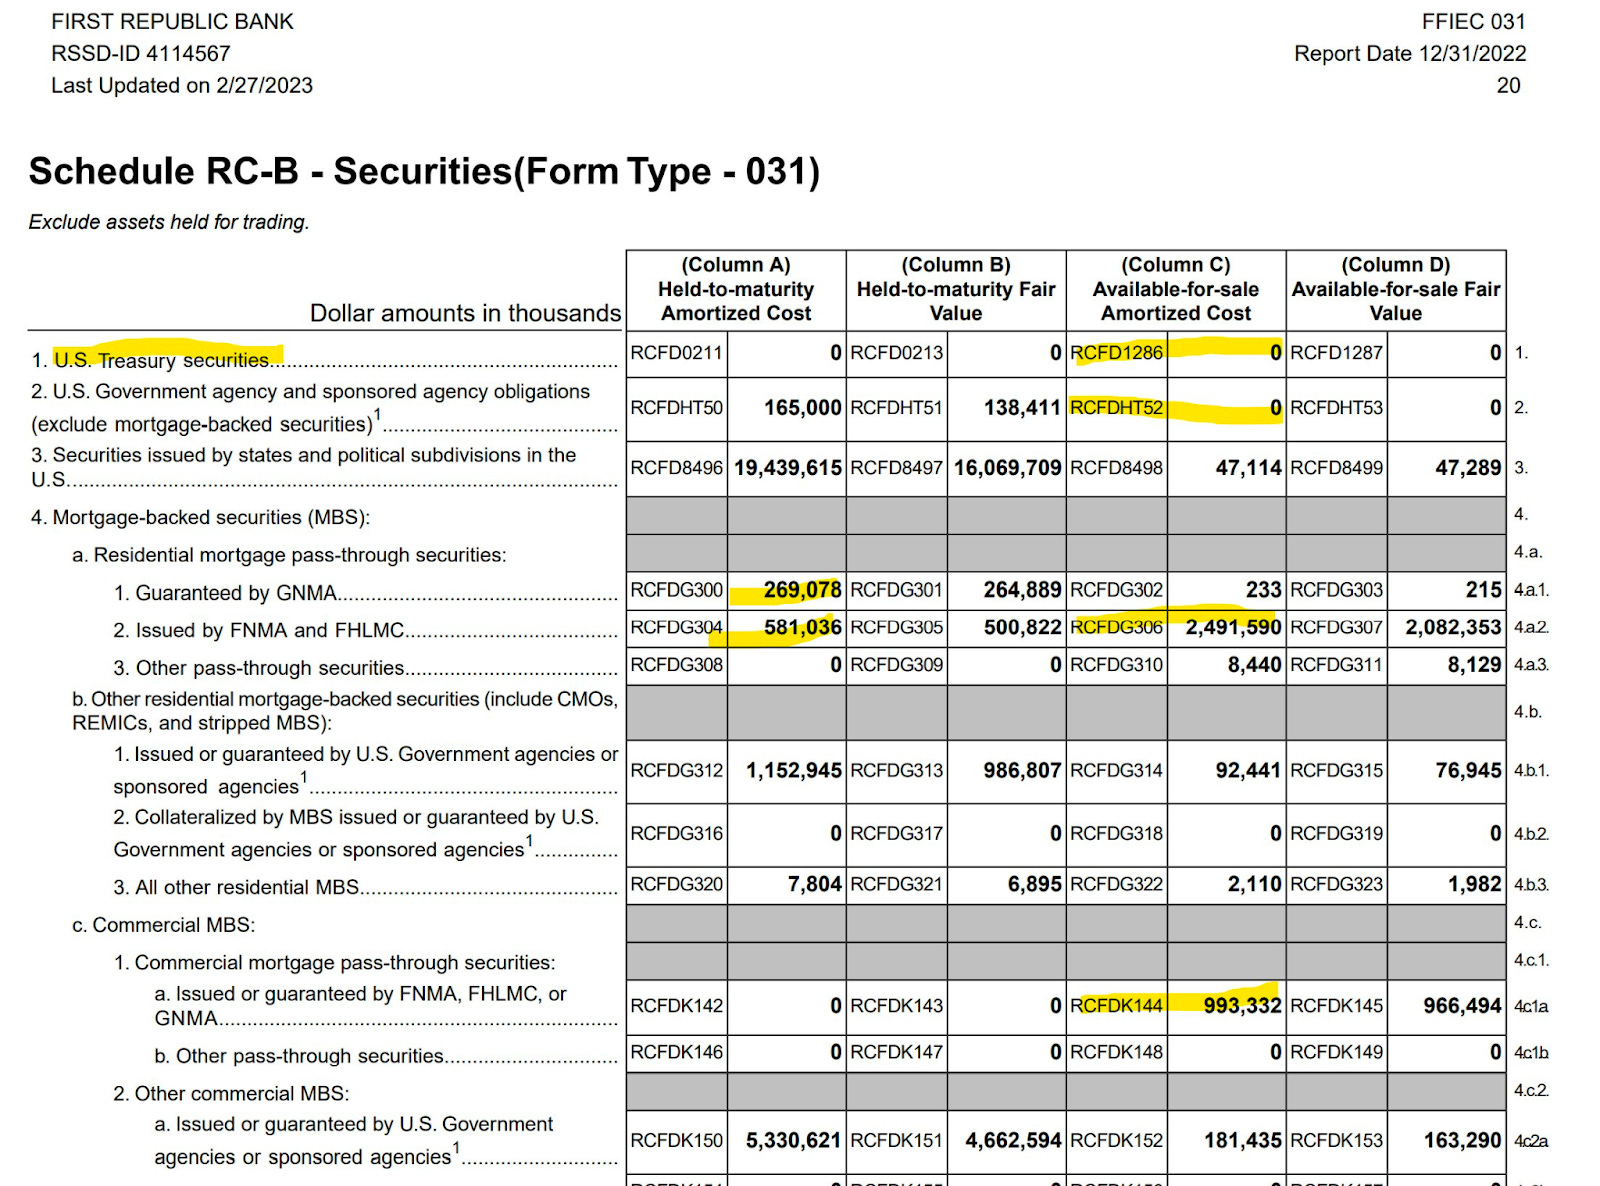
Graphic: Retrieved via Joseph Wang.

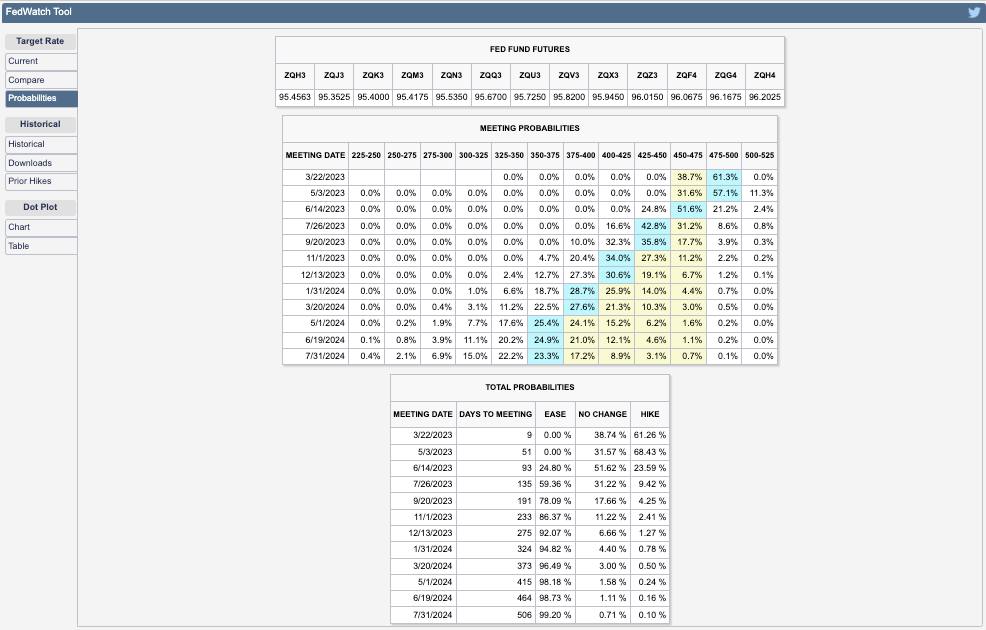
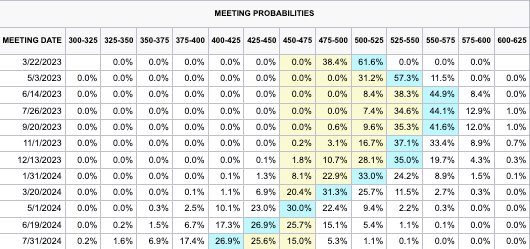
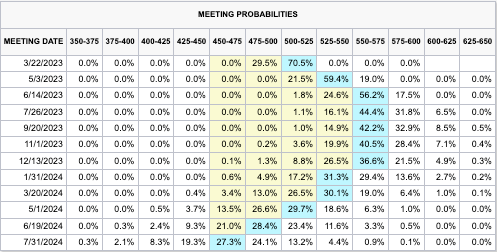
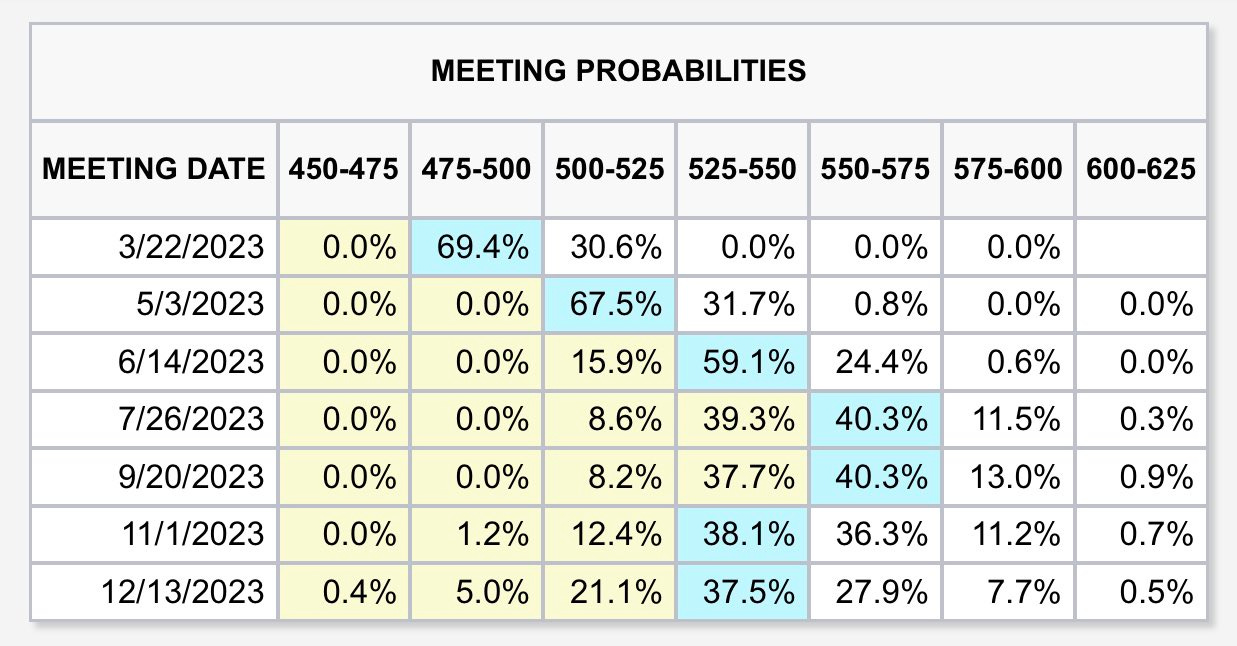
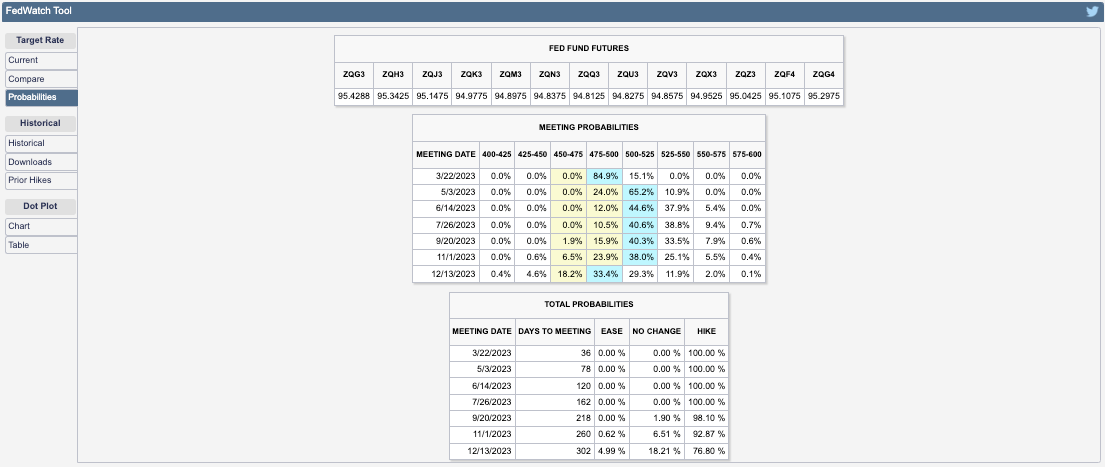
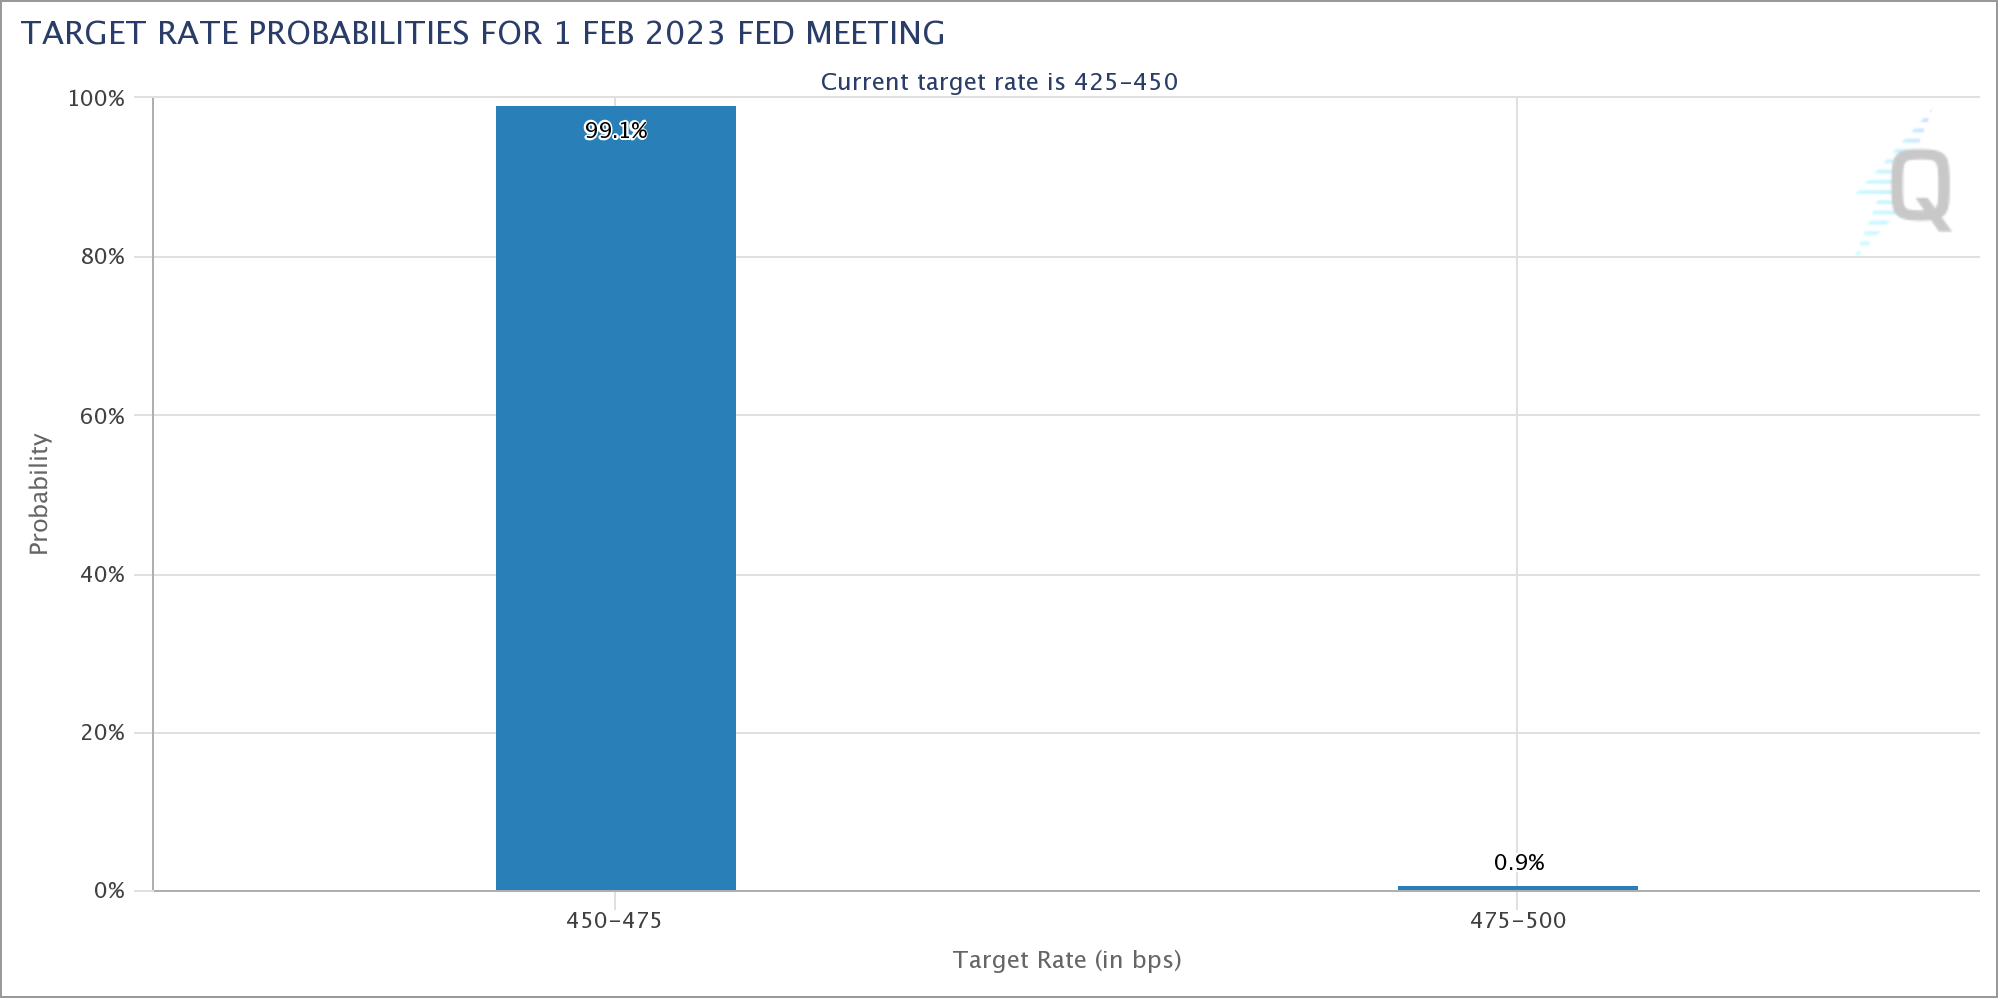
Anyways, as yesterday’s letter briefly mentioned, expectations on the path of Fed Funds shifted. Traders put the terminal/peak rate at 5.00-5.25%, down from 5.50-5.75%, while pricing cuts after spring. Previously, no cuts were expected in 2023.
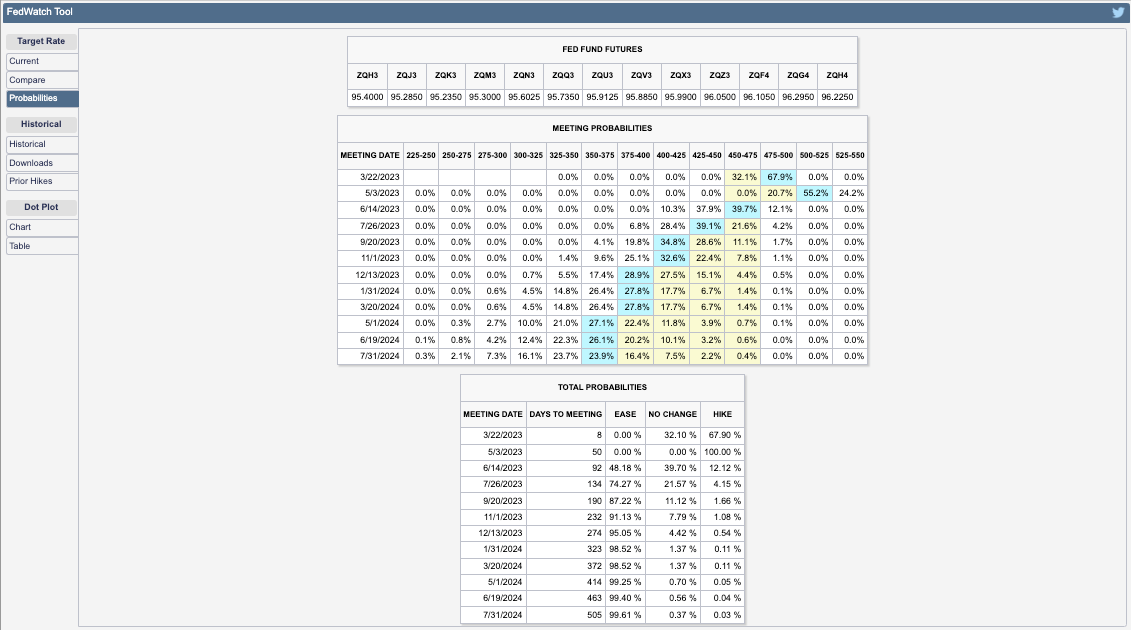
Graphic: Retrieved from CME Group Inc’s (NASDAQ: CME) FedWatch Tool.

Some Treasury yields fell spectacularly, too, …
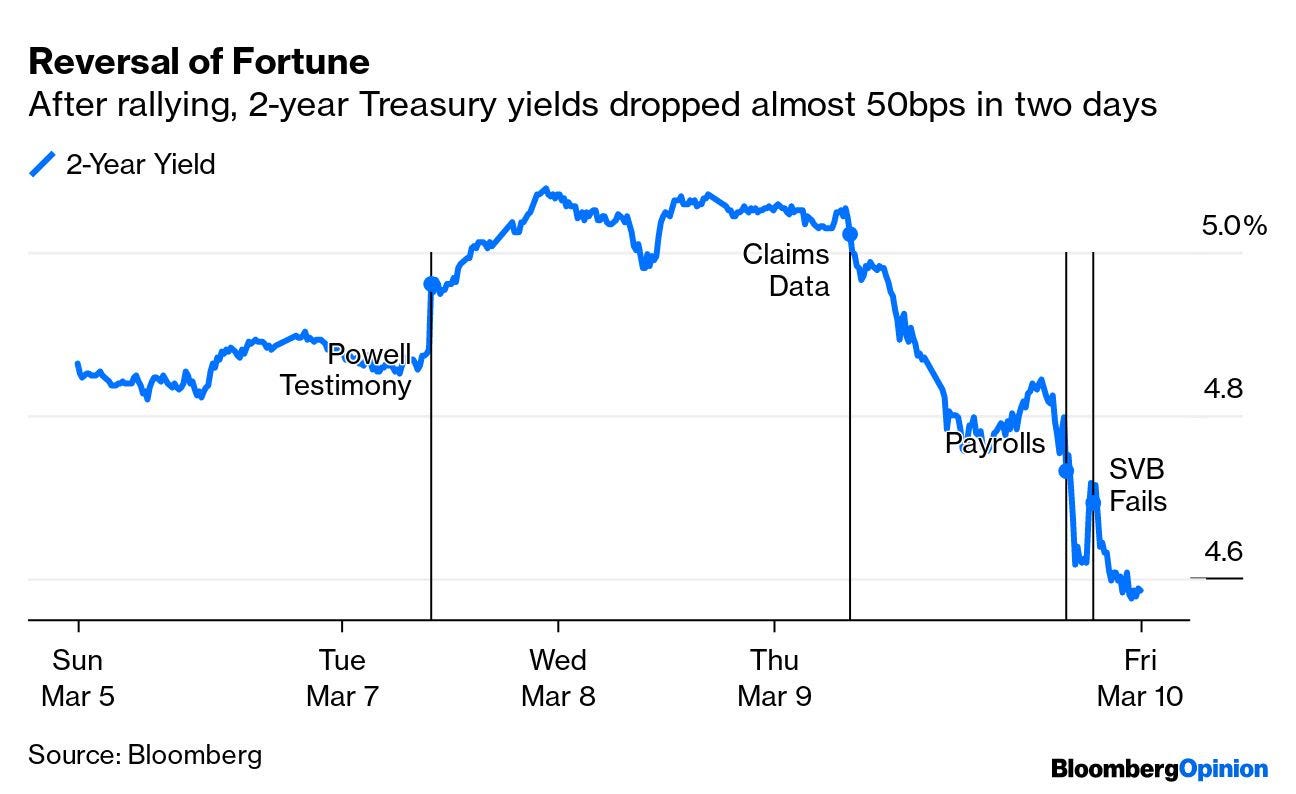
Graphic: Retrieved from Bloomberg.

… on par with those declines experienced amidst major crises, at least in the case of the 2-year.
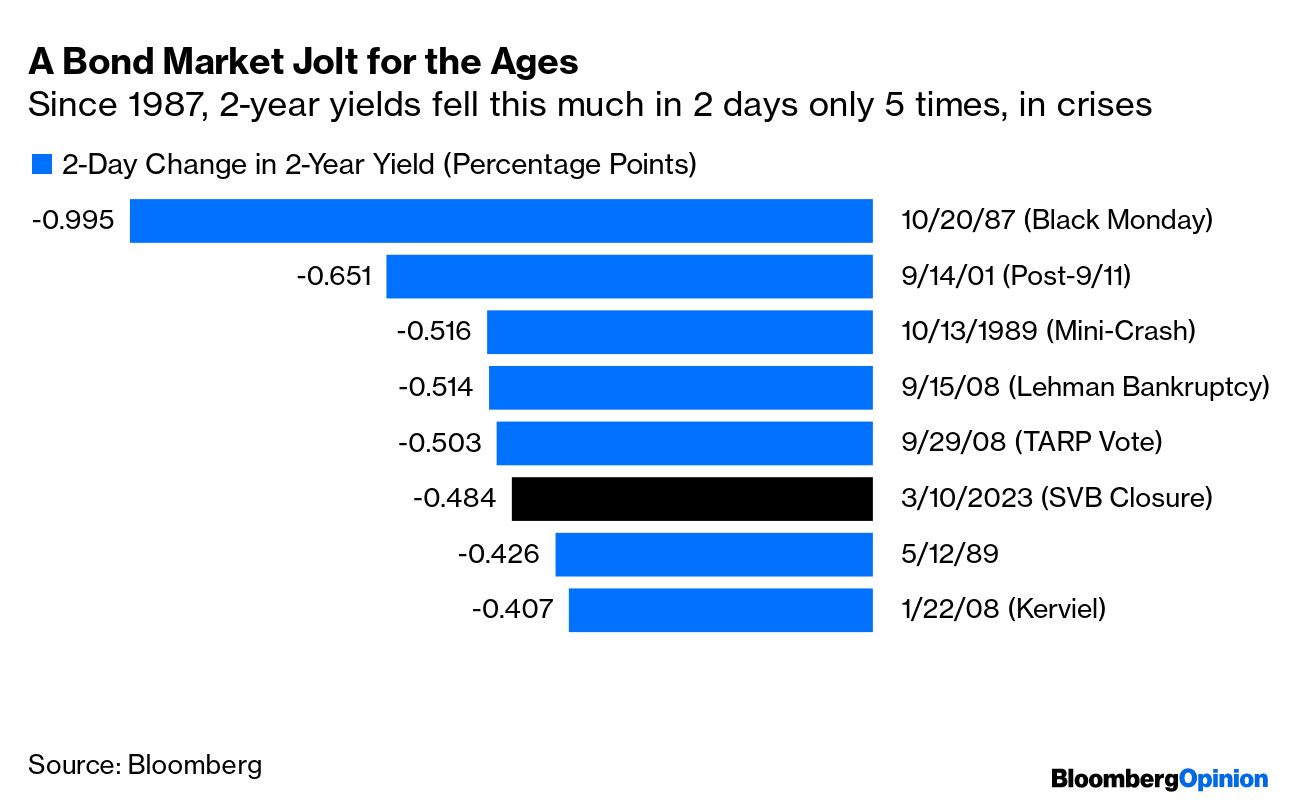
Graphic: Retrieved from Bloomberg.

Measures of US Treasury yield volatility implied by options (i.e., bets or hedges on or against market movement) adjusted higher, accordingly. This is often a harbinger of equity market volatility.
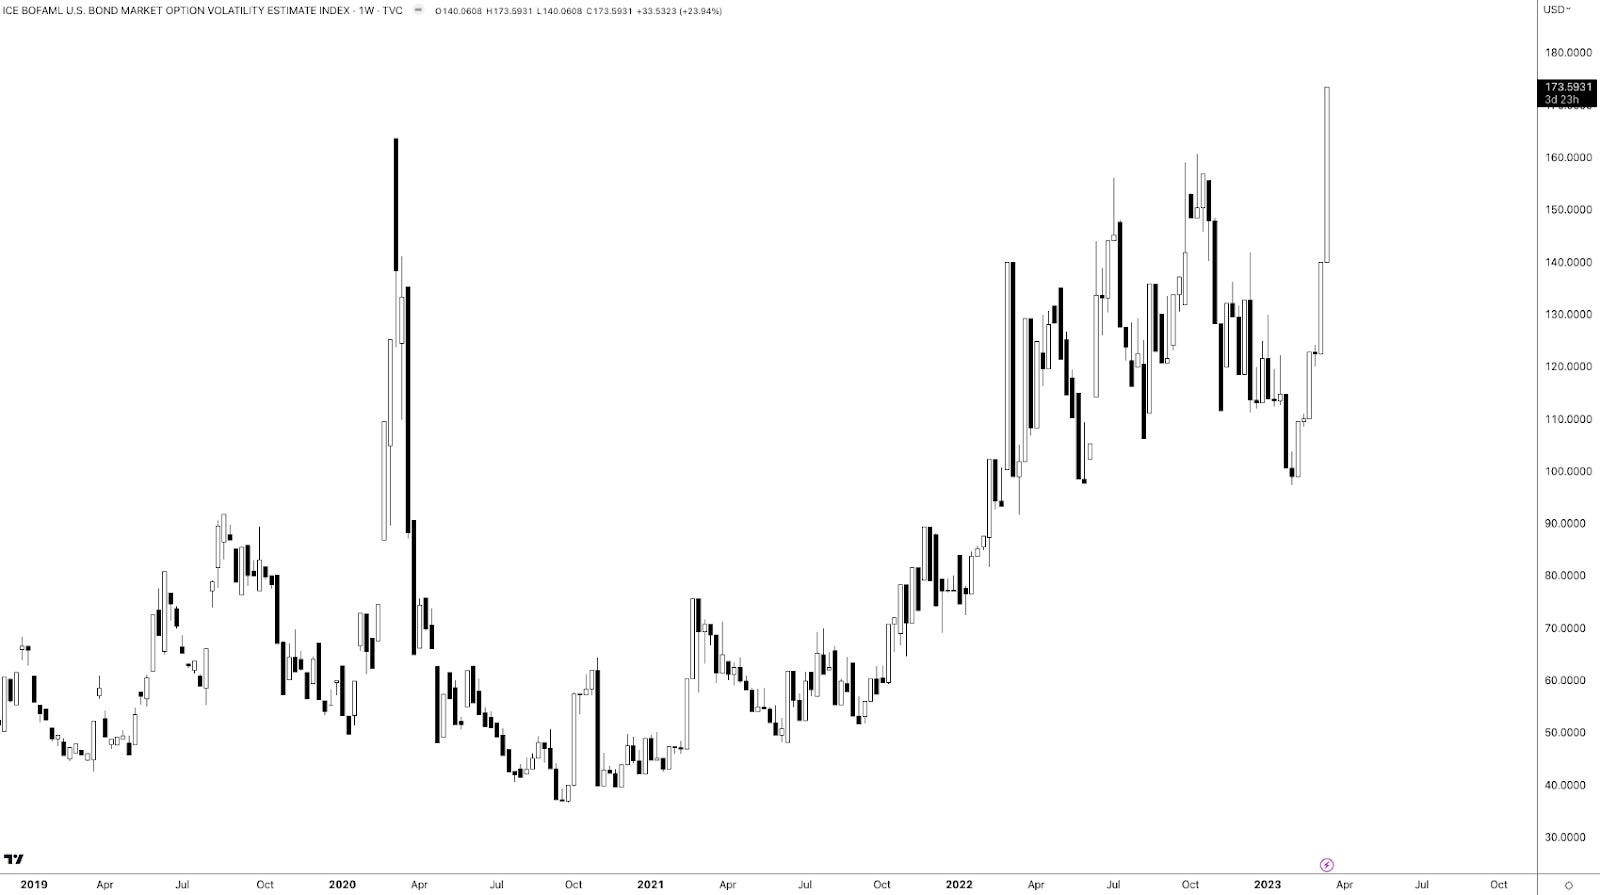
Graphic: Merrill Lynch Option Volatility Estimate retrieved from TradingView

Call options on the three-month Secured Overnight Financing Rate (FUTURE: SOFR) future (i.e., bets on interest rates falling in the future) paid handsomely.

For instance, bull call spreads that expire in December 2023 (e.g., BUY +1 VERTICAL /SR3Z23:XCME 1/2500 DEC 23 /SR3Z23:XCME 96/97 CALL @.0375) increased in value by about 650.00% to $0.33 (i.e., $750.00 per contract).
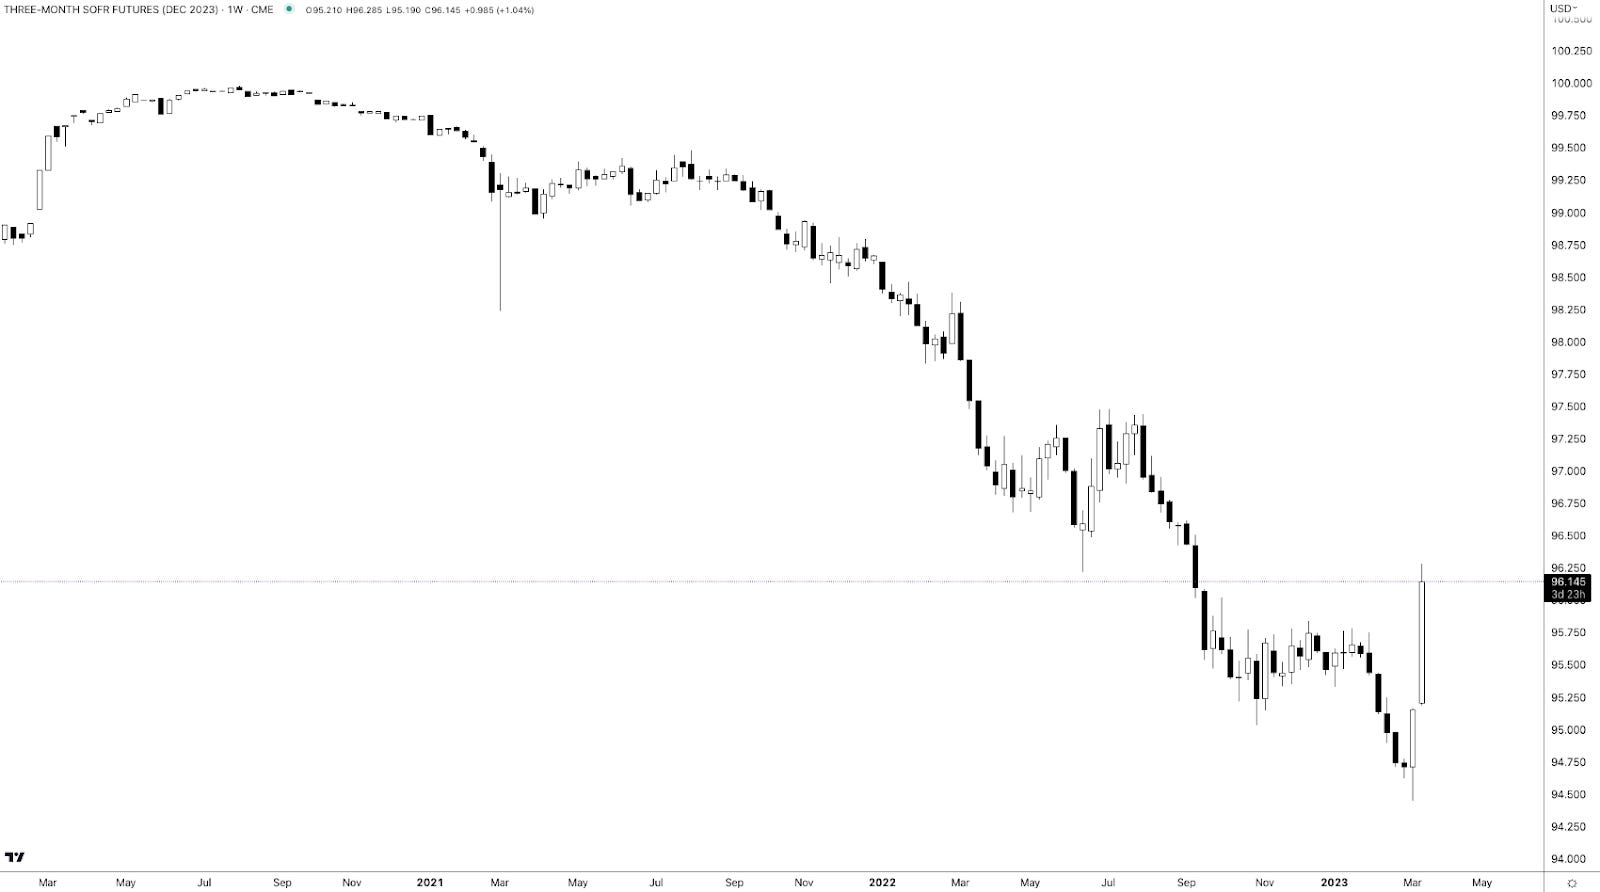
Graphic: Retrieved via TradingView. Three-month SOFR Future (December 2023). When SOFR is at a lower (higher) number, the market is pricing an increase (decrease) in interest rates. Participants put the December 2023 SOFR rate at 100-96.145 = 3.855%.

In the equity space, some readers may have caught some commentary on spot-vol beta in the VIX complex strengthening like we have not seen in a while, a nod to the harbinger of equity market volatility remark a few paragraphs higher.

Recommended Readings:

  • Read: The Ambrus Group’s Kris Sidial on two major risks investors should watch out for in 2023. In short, volatility’s sensitivity to underlying prices (spot-vol beta) was low, and Sidial cast blame, in part, on commodity trading advisors and strong volatility supply.
  • Read: Simplify Asset Management’s Michael Green on using option and bond overlays to hedge big uncertainties facing markets. Following 2022, investors swapped poor-performing long-dated volatility exposures for ones with bounded risk and less time to expiry, hence the increase in 0 DTE trading.
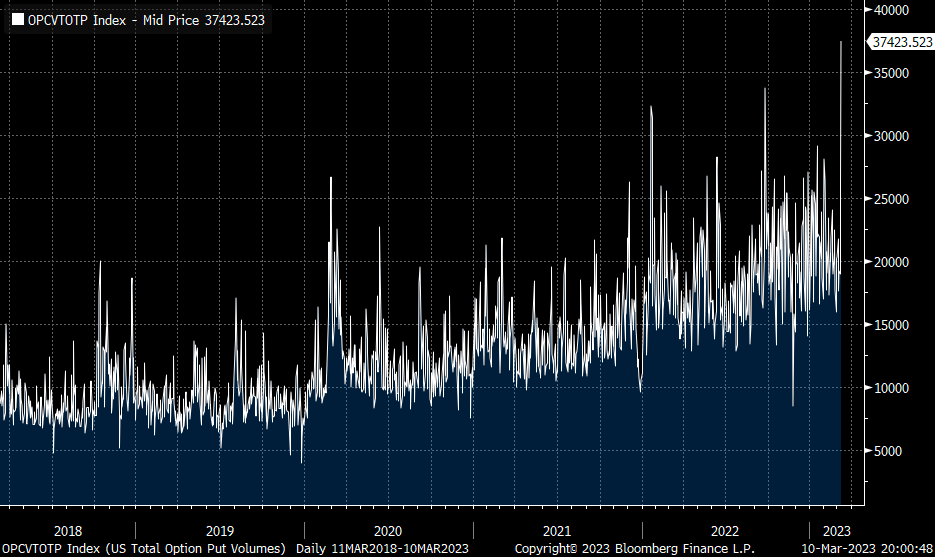
Graphic: Retrieved from Piper Sandler’s (NYSE: PIPR) Danny Kirsch.

This spot-vol beta remark suggests that (at least some of) the volatility in rates, as well as certain small pockets of the equity and crypto market, manifested demand for crash protection in the S&P 500, “which feeds back into VIX,” one explanation put well.
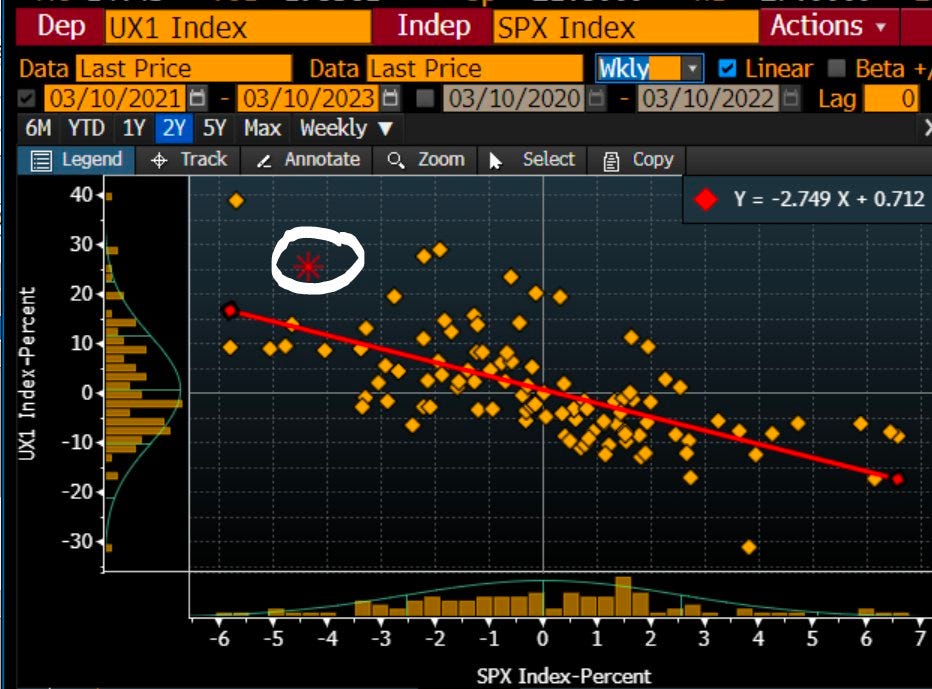
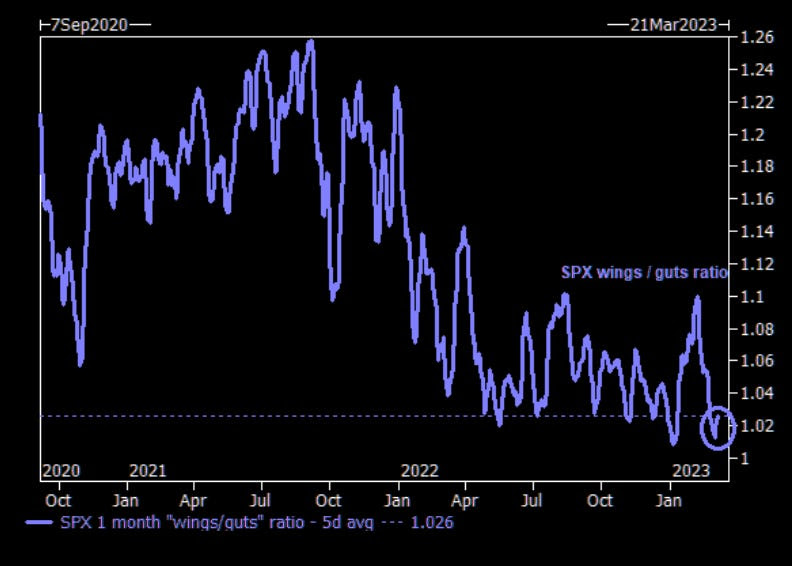
Graphic: Retrieved from Piper Sandler’s (NYSE: PIPR) Danny Kirsch. “[Last] week finally got a bit of explosiveness in VIX as fixed strike volatility got bid. This is VIX generic front month future and move in SPX. Last time it really “paid” to have VIX upside was Jan of 2022 (point in upper left corner).”

Notwithstanding, for these options to keep their value and continue to perform well, realized volatility (RVOL) must pick up substantially, which is not likely.

Unlimited’s Bob Elliott comments: “the bond market is pricing a broad-based credit crunch, … [and though] it’s not crazy for the Fed to slow down here given the current uncertainty,” odds are financial problems are contained and the Fed moves forward with its mission to get (and keep) inflation down.
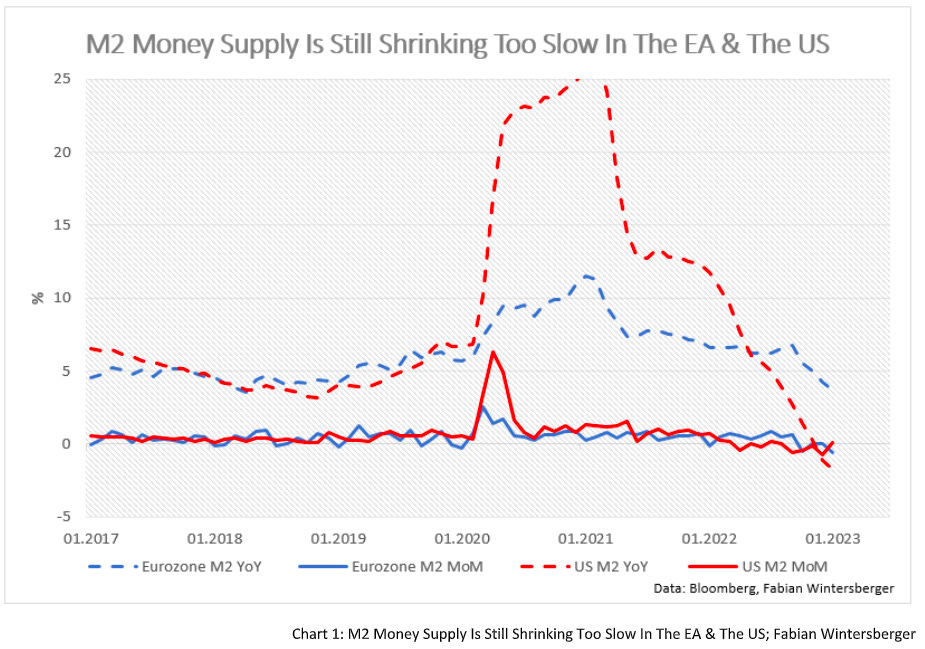
Graphic: Retrieved from Fabian Wintersberger. Just as the “monetary expansion supported the rise in equity and bond prices in January.”

Consequently, “the pricing of Dec23s and 5yr BEIs makes no sense,” Elliott adds. This means the example SOFR trade above is/was ripe for some monetization, and equity volatility must be dealt with carefully (i.e., price movements must be higher than they are now which would be difficult given that authorities/Fed do not want liquidations).

In support of siding with the less extreme take, we paraphrase Kai Volatility’s Cem Karsan who says that for years prior to the 2007-2008 turmoil, macro tourists were calling for a crash.

For markets to crumble, there would have to be an exogenous event far greater in implications than what just transpired with SIVB over the weekend. With odds that such turmoil doesn’t happen soon, coupled with participants easing up on their long-equity exposure (i.e., selling stock and not needing to hedge, hence the statement that owning equity volatility must be dealt with carefully), RVOL is likely to stay contained. That’s not to say that this volatility observed in the rates market can’t persist. It’s also not to say that markets can’t continue to trade lower (in fact, with interest rates rising and processes like quantitative tightening challenging bank liquidity, there is less incentive for investors to reside in lower-yielding equities). It just means that, barring some exogenous event, the market remains intact.

Graphic: Retrieved from Jack Farley. “Silicon Valley Bank owns >$80 Billion of Mortgage-Backed Securities (MBS), a market that is ‘more prone to bouts of volatility’ because ‘small investors & leveraged funds have become the main buyers’ as the Fed & banks step away from market, according to Dec 2022 BIS report.”

Positioning

Following important events like the release of the Consumer Price Index (CPI) today, the compression of implied volatility or IVOL, coupled with the nearing of big options expirations (OpEx), sets the market up for potential short bursts of strength heading into the end of the month and next month.
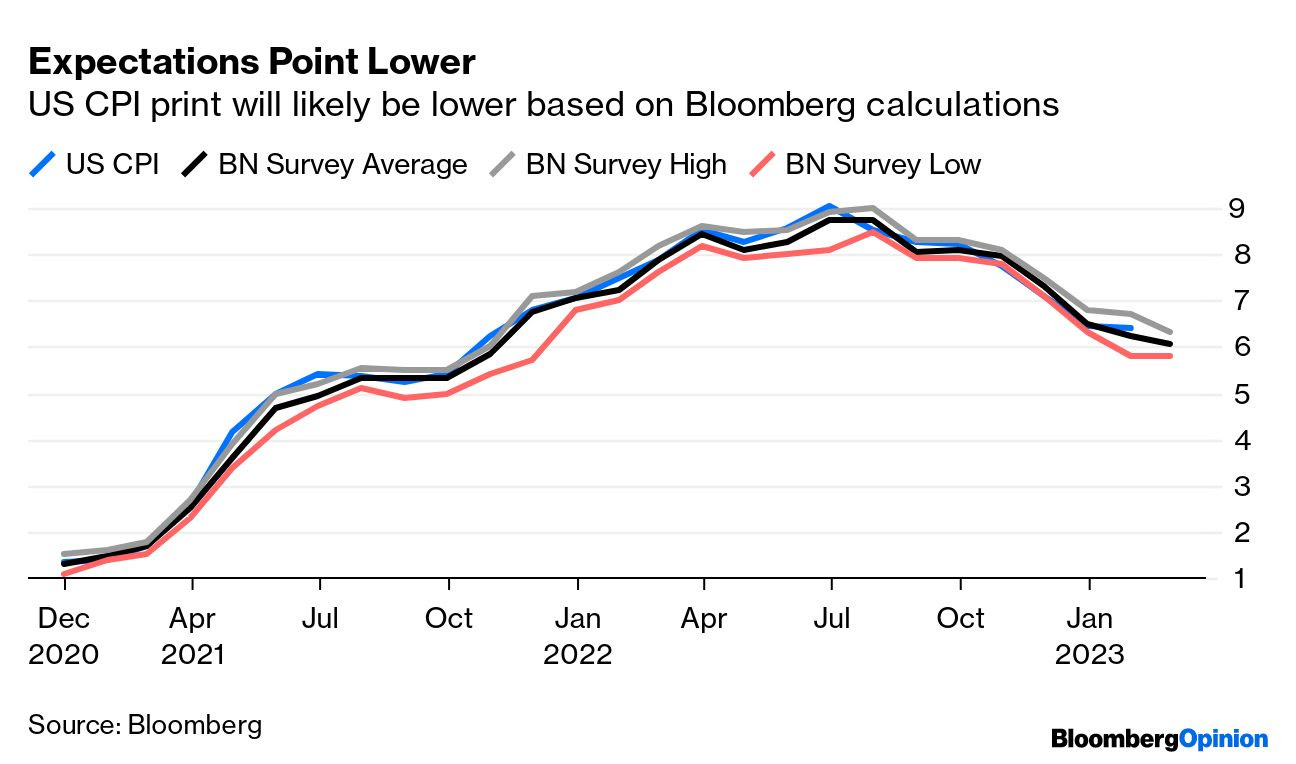
Graphic: Retrieved from Bloomberg. Inflation has been well within forecasts.

A quick comparison of the Russell 2000 (INDEX: RUT) and Nasdaq 100 (INDEX: NDX) suggests this options-induced strength may help keep the recent re-grossing theme intact. The compression of wound IVOL and passage of OpEx, coupled with the still-live re-grossing theme, may put a floor under equities.
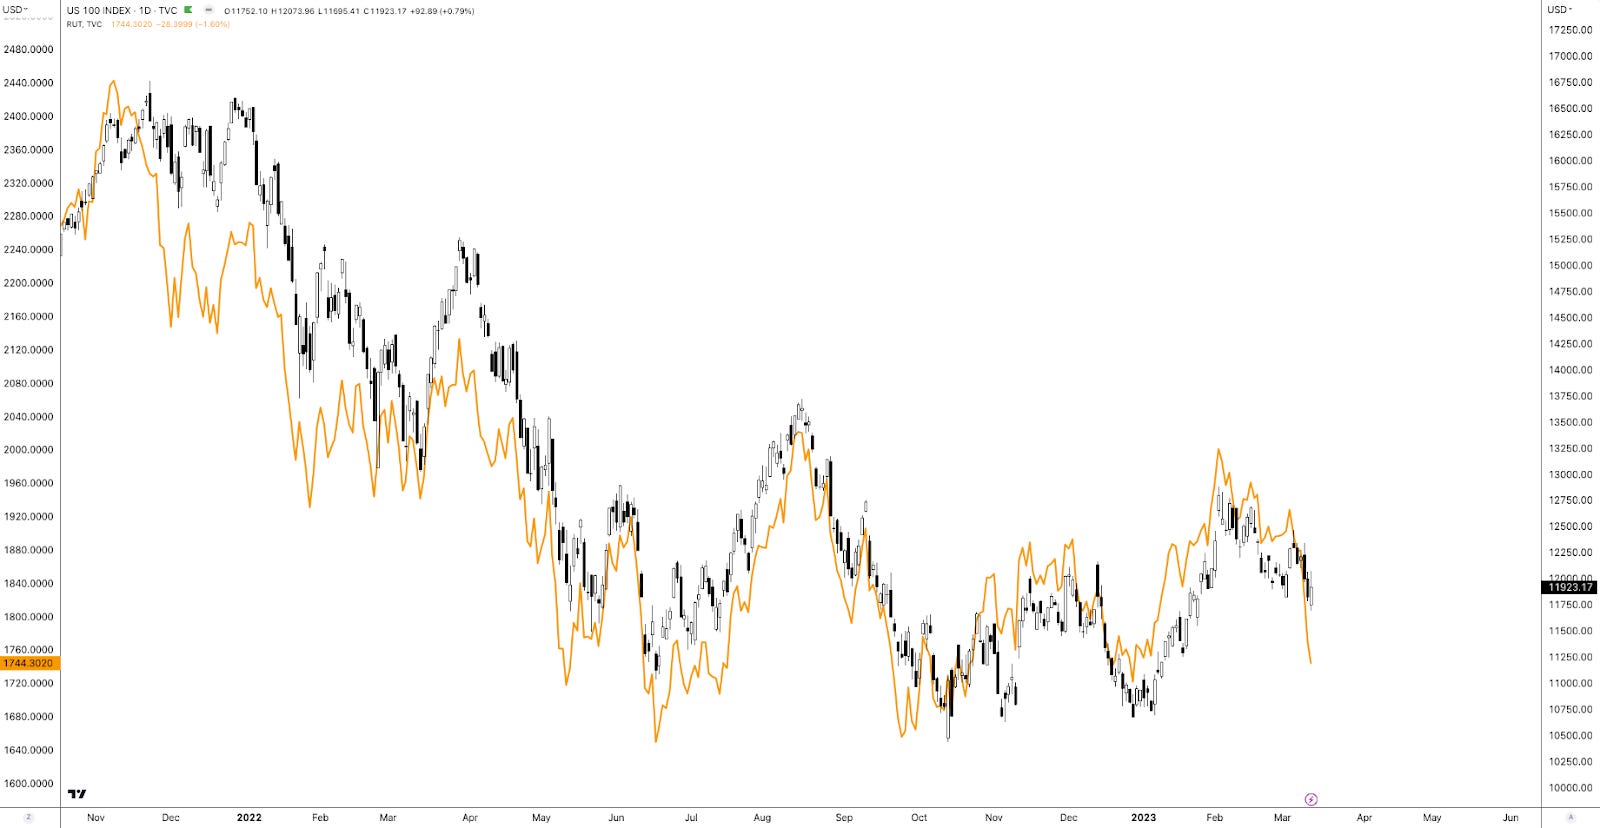
Graphic: Retrieved from TradingView. Orange = RUT. Candles = NDX. Note the weakness in RUT. Note the strength of the Nasdaq relative to the Russell.

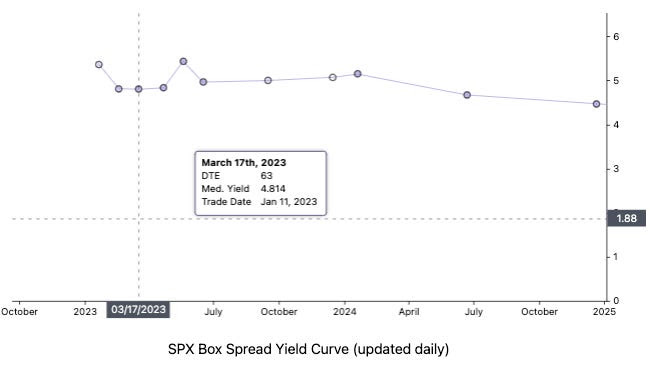
To play, one could place a portion of their cash in money market funds or T-bill ETFs or box spreads, for instance, while allocating another portion to leverage potential by way of some call options structures that use one or more short options to help bring down the cost of a long option that is closer to current market prices (e.g., a bull call spread or short ratio call spread). To note, based on options prices as of this writing, it may be too early to enter call structures (i.e., too expensive given the context).

 Technical

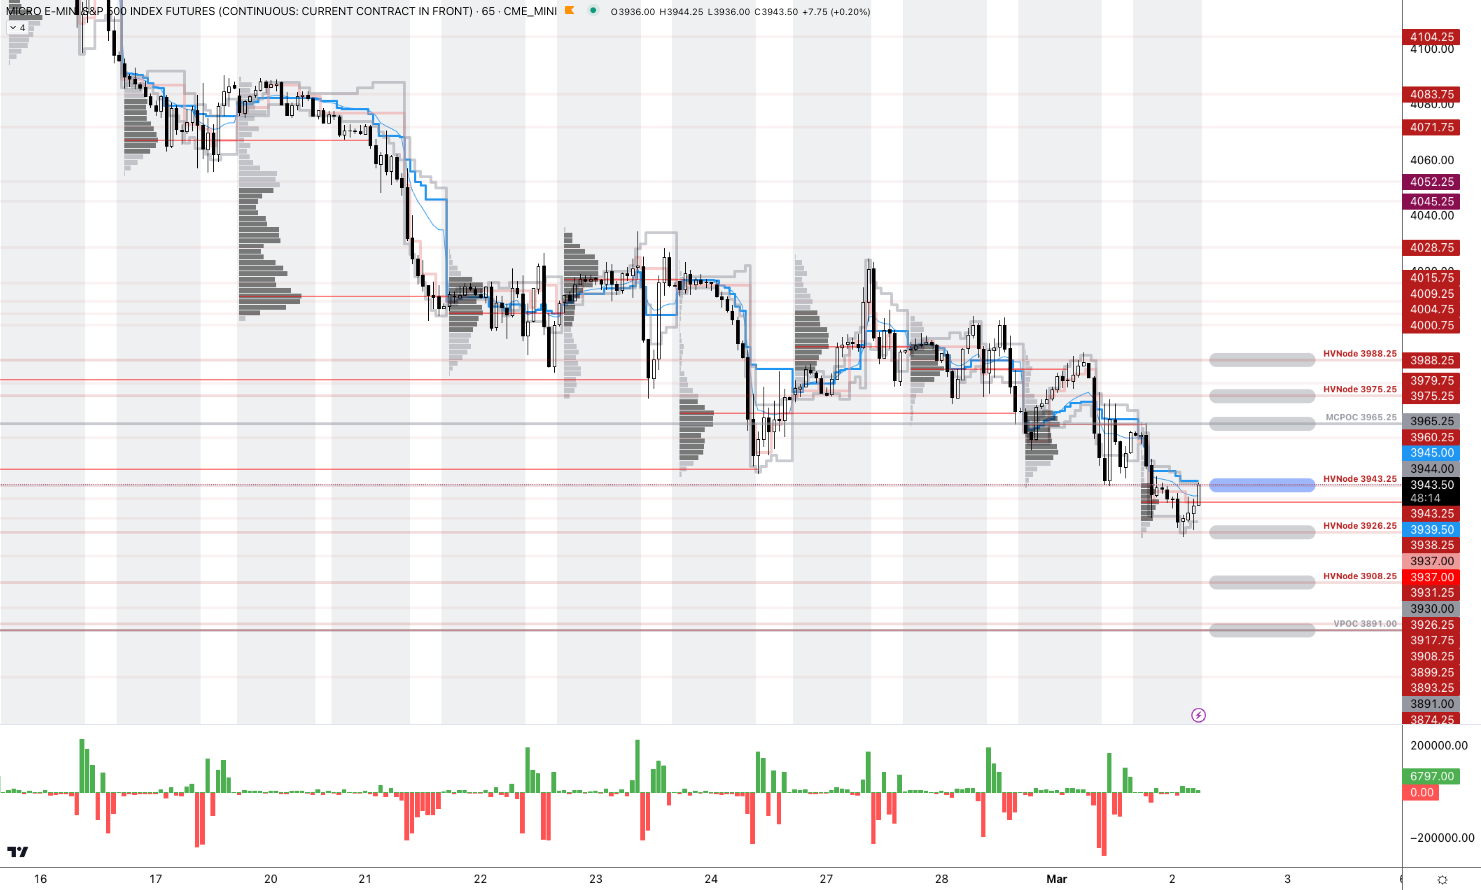
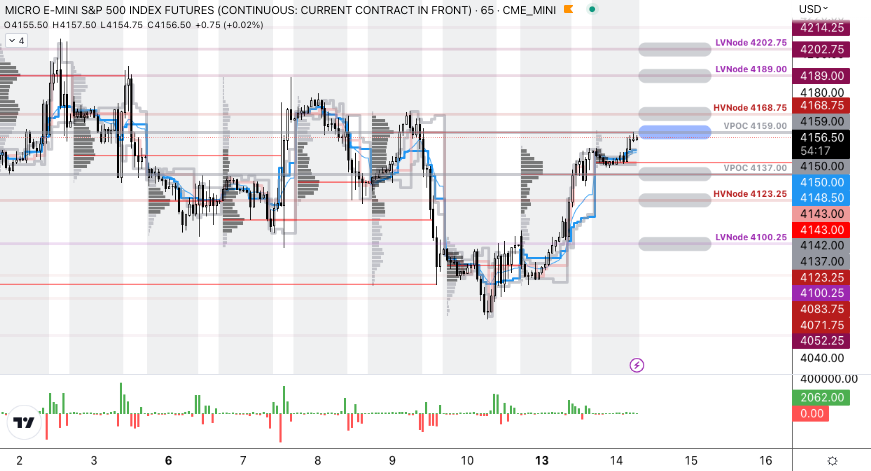
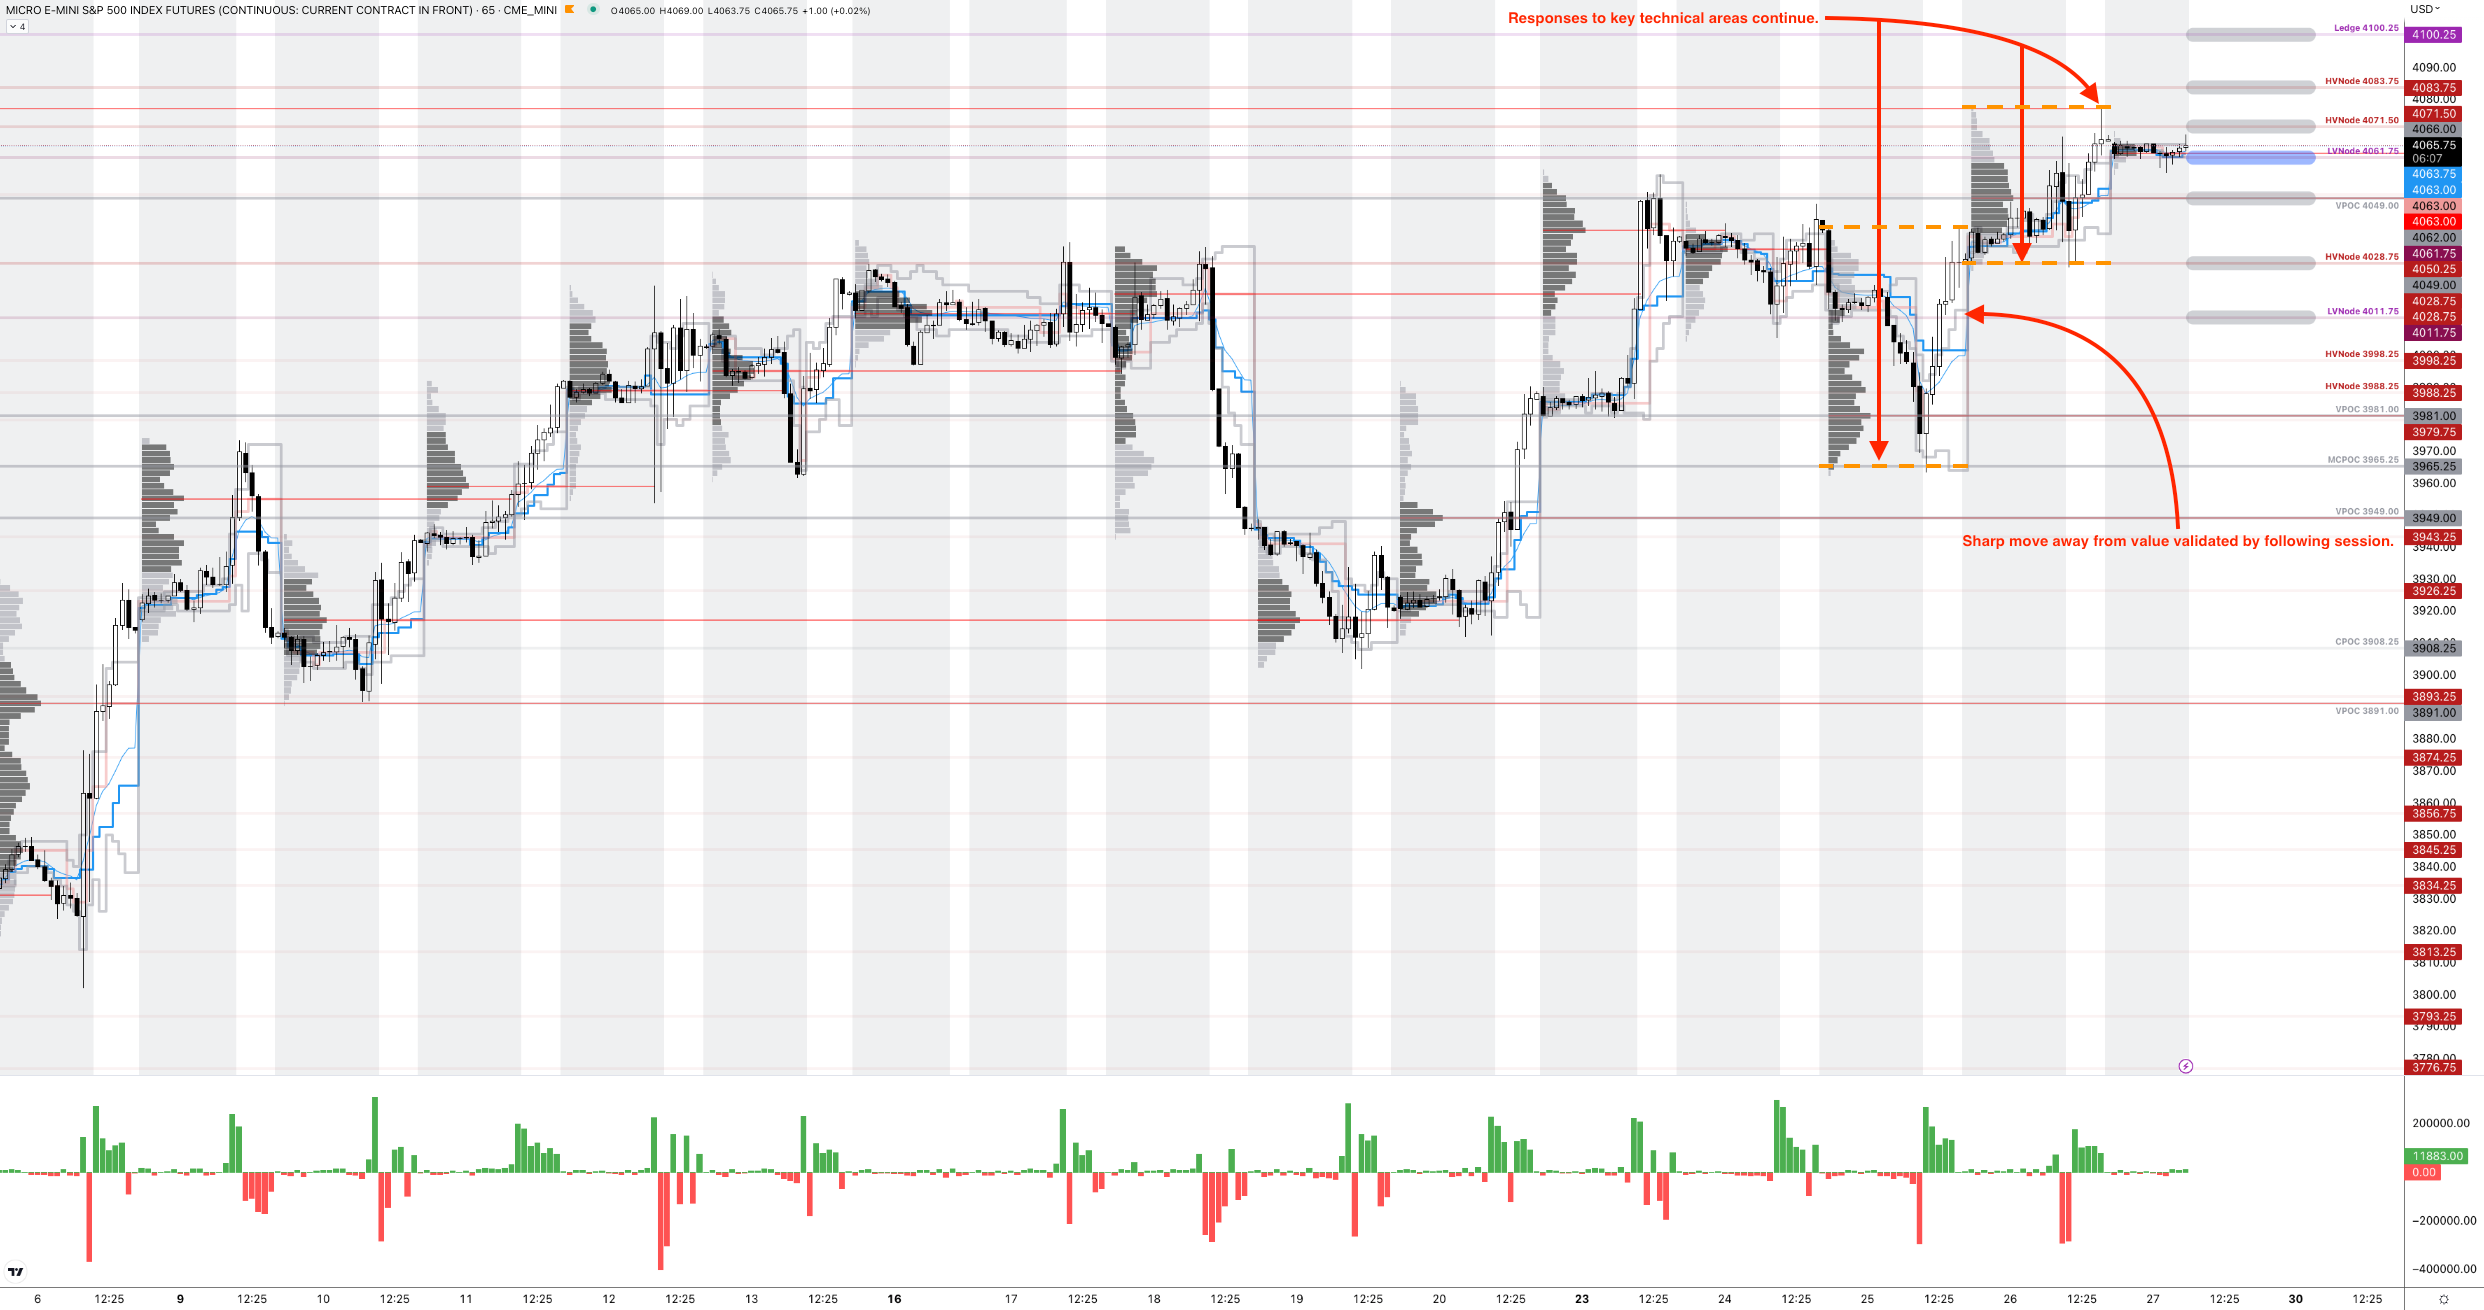
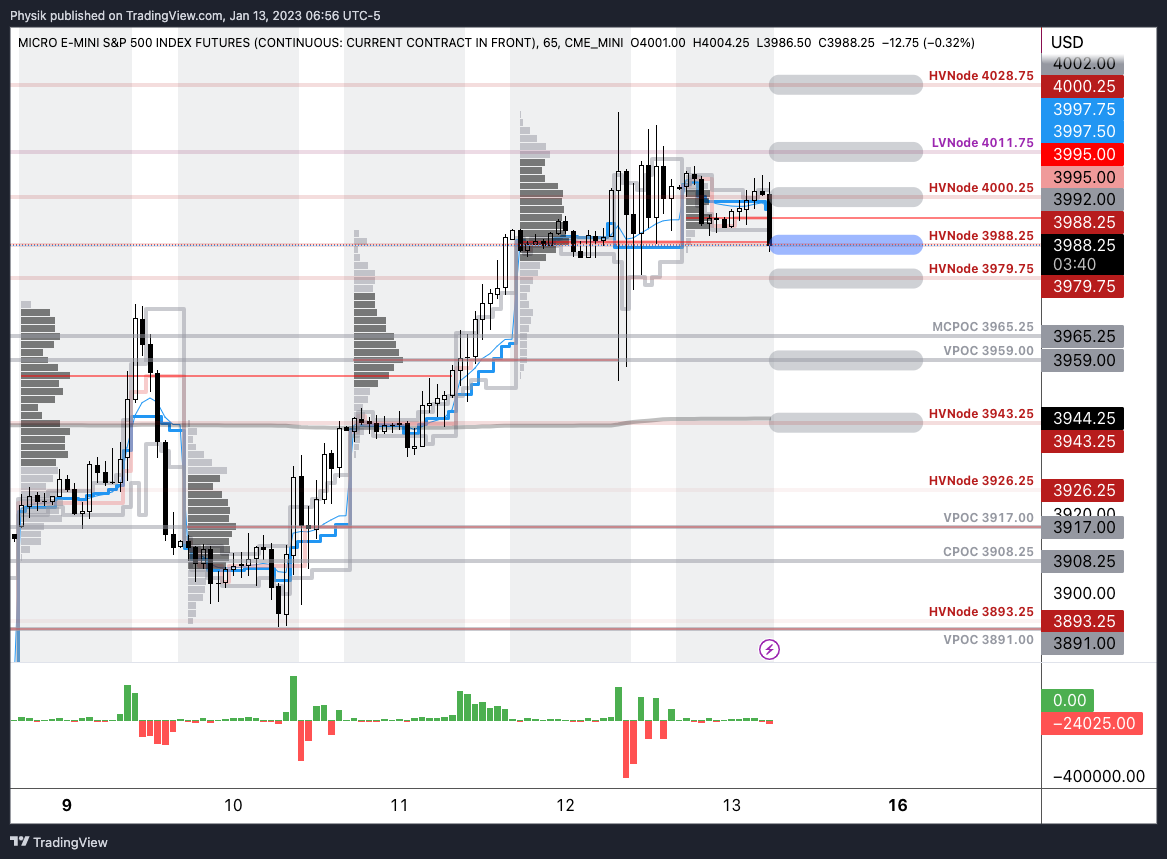
As of 6:30 AM ET, Tuesday’s regular session (9:30 AM – 4:00 PM ET), in the S&P 500, is likely to open in the middle part of a balanced overnight inventory, inside of the prior day’s range, suggesting a limited potential for immediate directional opportunity.

The S&P 500 pivot for today is $3,904.25. 

Key levels to the upside include $3,921.75, $3,945.00, and $3,970.75.

Key levels to the downside include $3,884.75, $3,868.25, and $3,847.25.

Disclaimer: Click here to load the updated key levels via the web-based TradingView platform. New links are produced daily. Quoted levels likely hold barring an exogenous development.
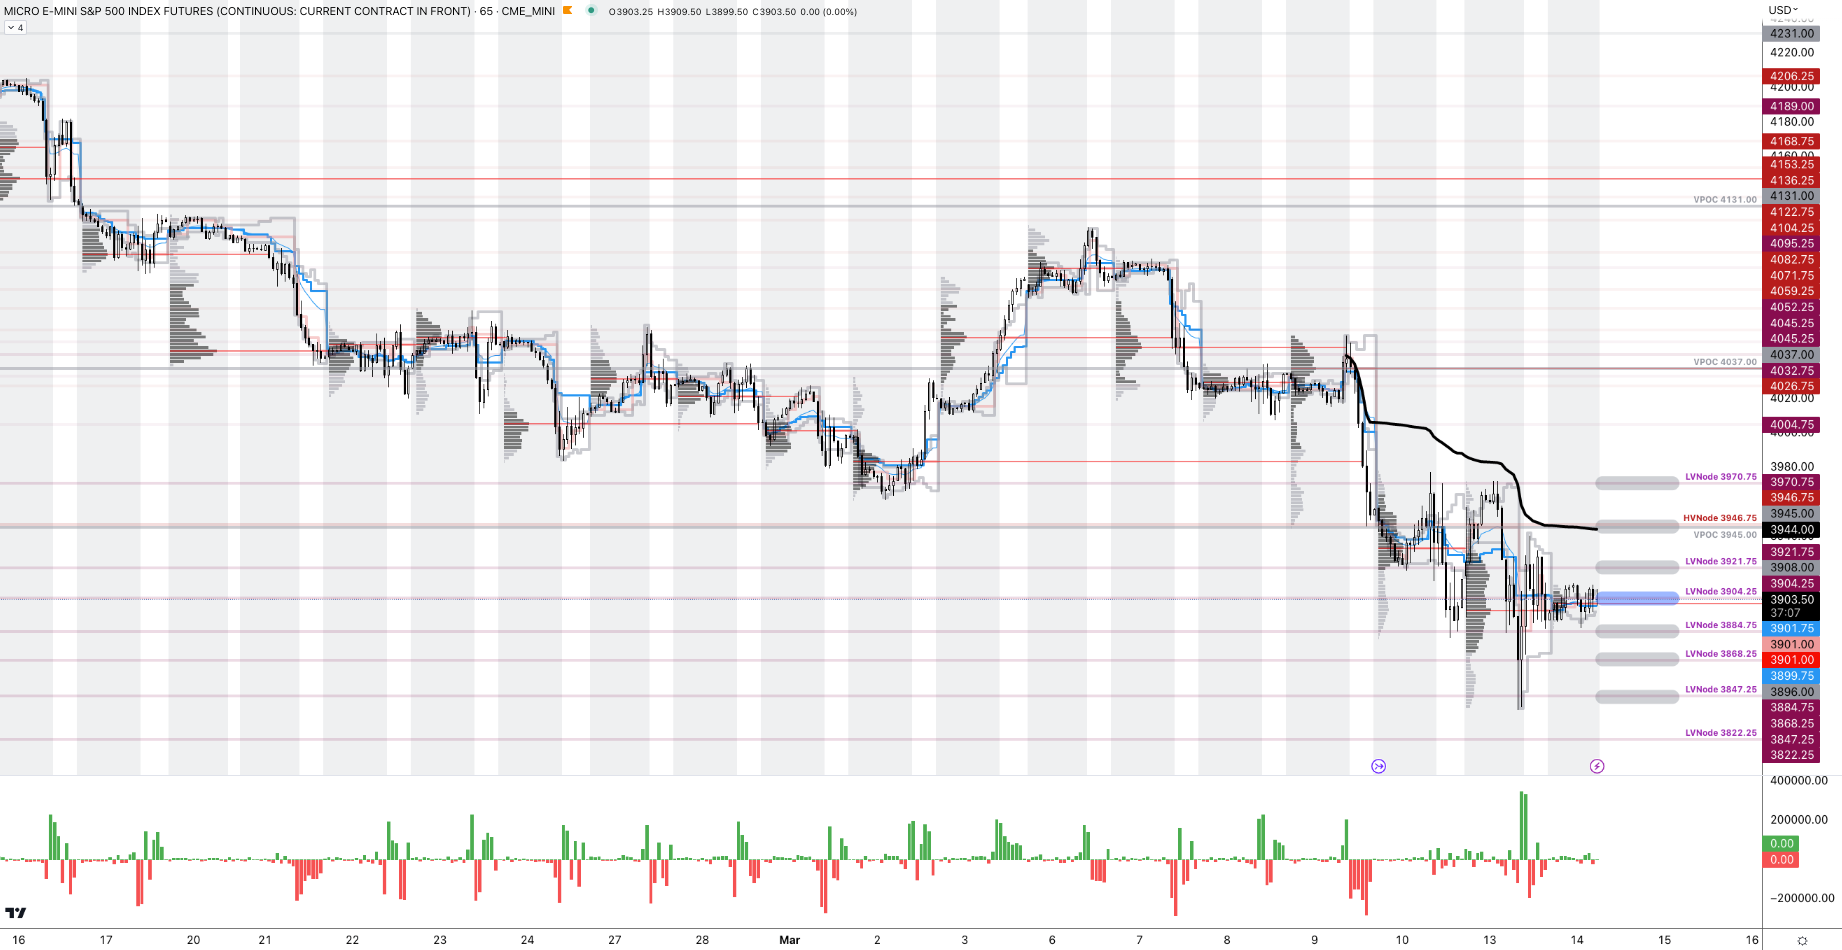
Graphic: 65-minute profile chart of the Micro E-mini S&P 500 Futures.

Definitions

Volume Areas: Markets will build on areas of high-volume (HVNodes). Should the market trend for a period of time, this will be identified by a low-volume area (LVNodes). The LVNodes denote directional conviction and ought to offer support on any test.

If participants auction and find acceptance in an area of a prior LVNode, then future discovery ought to be volatile and quick as participants look to the nearest HVNodes for more favorable entry or exit.

POCs: Areas where two-sided trade was most prevalent in a prior day session. Participants will respond to future tests of value as they offer favorable entry and exit.

Volume-Weighted Average Prices (VWAPs): A metric highly regarded by chief investment officers, among other participants, for quality of trade. Additionally, liquidity algorithms are benchmarked and programmed to buy and sell around VWAPs.


About

The author, Renato Leonard Capelj, spends the bulk of his time at Physik Invest, an entity through which he invests and publishes free daily analyses to thousands of subscribers. The analyses offer him and his subscribers a way to stay on the right side of the market. 

Separately, Capelj is an accredited journalist with past works including interviews with investor Kevin O’Leary, ARK Invest’s Catherine Wood, FTX’s Sam Bankman-Fried, North Dakota Governor Doug Burgum, Lithuania’s Minister of Economy and Innovation Aušrinė Armonaitė, former Cisco chairman and CEO John Chambers, and persons at the Clinton Global Initiative.

Connect

Direct queries to renato@physikinvest.com. Find Physik Invest on TwitterLinkedInFacebook, and Instagram. Find Capelj on TwitterLinkedIn, and Instagram. Only follow the verified profiles.

Calendar

You may view this letter’s content calendar at this link.

Disclaimer

Do not construe this newsletter as advice. All content is for informational purposes. Capelj and Physik Invest manage their own capital and will not solicit others for it.

Categories
Commentary

Daily Brief For March 13, 2023

Physik Invest’s Daily Brief is read free by thousands of subscribers. Join this community to learn about the fundamental and technical drivers of markets.

Graphic updated 6:40 AM ET. Sentiment Neutral if expected /MES open is inside of the prior day’s range./MES levels are derived from the profile graphic at the bottom of this letter. Click here for the latest levels. SqueezeMetrics Dark Pool Index (DIX) and Gamma (GEX) with the latter calculated based on where the prior day’s reading falls with respect to the MAX and MIN of all occurrences available. A higher DIX is bullish. The lower the GEX, the more (expected) volatility. Click to learn the implications of volatility, direction, and moneyness. Breadth reflects a reading of the prior day’s NYSE Advance/Decline indicator. The CBOE VIX Volatility Index (INDEX: VVIX) reflects the attractiveness of owning volatility. UMBS prices via MNDClick here for the economic calendar.

Administrative

Please check out Friday’s Daily Brief on the letter writer’s discussion with Simplify’s Michael Green. In that letter, we unpacked a variety of topics including the reliability of data, what this means for active management, derivatives trading, strength potential in markets, and things to be optimistic about. 

Regarding today’s letter, we shall take a less pessimistic view of the events that have transpired over the past few days involving the likes of Silvergate Capital Corporation (NYSE: SI) and SVB Financial Group (NASDAQ: SIVB). This too shall pass.

Fundamental

The pandemic stimulus had SIVB taking in “cash deposits as a combination of PPP loans, equity investments in VC and cash from new issues (including SPACS),” says Simplify’s Michael Green who your letter writer spoke to for a Benzinga article. SIVB took these deposits and invested them into longer-dated bonds. At the time, these bonds were yielding 1% or so. SIVB “borrowed short (deposits) and lent long.”

Eventually, monetary policy tightened.

SIVB’s client base, many of who were “money-losing VC startups” drew on cash. With interest rates rising and losses on SIVB’s bond portfolio growing, the bank decided to “designate the securities as ‘held-to-maturity’ where mark-to-market losses would not flow through the income statement.”

Graphic: Retrieved from Bloomberg.

With this HTM designation, the SIVB no longer had to hedge interest rate exposure. Unfortunately, with the rapid pace of interest rate increases, SIVB’s unhedged bond portfolio fell sharply in value while withdrawals continued to increase. 

Graphic: Retrieved from Michael Green of Simplify Asset Management.

Green summarizes it well: “With deposits cratering, SVB is forced to begin selling the HTM portfolio to obtain liquidity. This action will push the unrealized losses from the HTM portfolio onto the income statement and impair SVB’s equity. Hence the need to raise equity capital.”

Moreover, as news of capital raises spread, and given that most depositors’ accounts were valued in excess of the FDIC’s insurance limits, withdrawals accelerated further.

“Roughly 25% of total deposits” flowed out. “There is no bank that can survive this,” Green put forth. The risk with SIVB was fear/panic and contagion; the depositors have employees to pay and their business to conduct (e.g., Circle minting and redemption of USDC, a major source of collateral in the crypto-verse).

Consequently, SIVB entered receivership and the FDIC sought buyers. If the latter were to fail, the FDIC would have sold off SIVB’s assets to make good on deposits.

And, in another case, authorities could safeguard or guarantee uninsured deposits with a new deposit insurance fund banks pay into (i.e., not a cost to taxpayers or a bailout). And, that’s basically what the authorities decided to do.

On Sunday, authorities announced emergency measures to guarantee all deposits of SIVB and shore up confidence in the US banking system.

Per a Wall Street Journal article, the government’s bank-deposit insurance fund will cover all deposits, rather than the measly $250,000.00. Additionally, any losses to the fund would be “recovered in a special assessment on banks and the US taxpayers wouldn’t bear any losses.” The Federal Reserve, in separate statements, said it would make additional funds available to banks through the “Bank Term Funding Program” which offers loans up to a year out with Treasuries and mortgage-backed securities, among other assets owned by banks, pledged as collateral. In short, the program signals banks don’t have to liquidate securities and realize losses to raise cash.

“Many of those securities have fallen in value as the Fed has raised interest rates,” the WSJ adds. “The terms would allow banks to borrow at 100 cents on the dollar for securities trading potentially well below that value, potentially putting the government at risk of losses incurred by banks. Critics said the move would essentially offer a backdoor subsidy to bank investors and management for failing to properly manage interest-rate risks.” 

“The new facility provides cheap and under-secured loans – the exact opposite of good central banking,” former Fed trader Joseph Wang explains. “A bank can take collateral trading at $0.90 and borrow a $1.00 from the facility at below market rates.” This suggests the “Administration has decided to socialize the banking sector.”

The turmoil has muddied the outlook on interest rates. Higher for longer was the case heading into the end of last week. Traders now think the terminal/peak rate sits at 4.75-5.00%. Following the spring timeframe, traders think the Fed starts to ease.

Graphic: Retrieved from CME Group Inc’s (NASDAQ: CME) FedWatch Tool.

Technical

As of 6:40 AM ET, Monday’s regular session (9:30 AM – 4:00 PM ET), in the S&P 500, is likely to open in the lower part of a balanced overnight inventory, inside of the prior day’s range, suggesting a limited potential for immediate directional opportunity.

The S&P 500 pivot for today is $3,884.75. 

Key levels to the upside include $3,921.75, $3,945.00, and $3,970.75.

Key levels to the downside include $3,868.25, $3,847.25, and $3,822.25.

Disclaimer: Click here to load the updated key levels via the web-based TradingView platform. New links are produced daily. Quoted levels likely hold barring an exogenous development.

Graphic: 65-minute profile chart of the Micro E-mini S&P 500 Futures (bottom middle).

Definitions

Volume Areas: Markets will build on areas of high-volume (HVNodes). Should the market trend for a period of time, this will be identified by a low-volume area (LVNodes). The LVNodes denote directional conviction and ought to offer support on any test.

If participants auction and find acceptance in an area of a prior LVNode, then future discovery ought to be volatile and quick as participants look to the nearest HVNodes for more favorable entry or exit.

POCs: Areas where two-sided trade was most prevalent in a prior day session. Participants will respond to future tests of value as they offer favorable entry and exit.


About

The author, Renato Leonard Capelj, spends the bulk of his time at Physik Invest, an entity through which he invests and publishes free daily analyses to thousands of subscribers. The analyses offer him and his subscribers a way to stay on the right side of the market. 

Separately, Capelj is an accredited journalist with past works including interviews with investor Kevin O’Leary, ARK Invest’s Catherine Wood, FTX’s Sam Bankman-Fried, North Dakota Governor Doug Burgum, Lithuania’s Minister of Economy and Innovation Aušrinė Armonaitė, former Cisco chairman and CEO John Chambers, and persons at the Clinton Global Initiative.

Connect

Direct queries to renato@physikinvest.com. Find Physik Invest on TwitterLinkedInFacebook, and Instagram. Find Capelj on TwitterLinkedIn, and Instagram. Only follow the verified profiles.

Calendar

You may view this letter’s content calendar at this link.

Disclaimer

Do not construe this newsletter as advice. All content is for informational purposes. Capelj and Physik Invest manage their own capital and will not solicit others for it.

Categories
Commentary

Daily Brief For March 10, 2023

Physik Invest’s Daily Brief is read free by thousands of subscribers. Join this community to learn about the fundamental and technical drivers of markets.

Graphic updated 7:15 AM ET. Sentiment Risk-Off if expected /MES open is below the prior day’s range. /MES levels are derived from the profile graphic at the bottom of this letter. Click here for the latest levels. SqueezeMetrics Dark Pool Index (DIX) and Gamma (GEX) with the latter calculated based on where the prior day’s reading falls with respect to the MAX and MIN of all occurrences available. A higher DIX is bullish. The lower the GEX, the more (expected) volatility. Click to learn the implications of volatility, direction, and moneyness. Breadth reflects a reading of the prior day’s NYSE Advance/Decline indicator. The CBOE VIX Volatility Index (INDEX: VVIX) reflects the attractiveness of owning volatility. UMBS prices via MNDClick here for the economic calendar.

Administrative

Yesterday’s newsletter put forth the writer’s discussion with Simplify’s Mike Green, fresh after he spoke at Exchange Miami. The letter covered a lot, albeit in a messy way, given some unforeseen obligations. Today, we clarify those narratives for you. Hopefully, you enjoy it, and take care!

Fundamental

In summary, Simplify’s Michael Green trades 60/40-looking portfolios on macroeconomic signals while using derivative exposures to reduce volatility and amplify profit potential (e.g., responding to economic data in real-time by trading options on the CME Group Inc’s [NASDAQ: CME] Eurodollar [FUTURE: /GE], a tool to express views on future interest rates).

His conversation with your letter writer covered a variety of topics including the reliability of data and what that means for his active management, derivatives trading, strength potential in markets, as well as what he’s optimistic about. Here’s what you need to know.

1 – Green explains that his preferred macro guides for decision-making are unclear. He explains that traditional adjustments “ranging from seasonality to the birth-death models used in smoothing employment reports” are in question, and he jokes that developed market data sets are approaching emerging market data sets in terms of quality.

2 – Green reflects on 2022 noting options, colloquially referred to as volatility, were a big underperformer. “One-year variance swaps or implied volatility on an at-the-money S&P 500 put option would trade somewhere in the neighborhood of 25 to 30%,” he explains. “That implies a level of daily price movement that is difficult to achieve.”

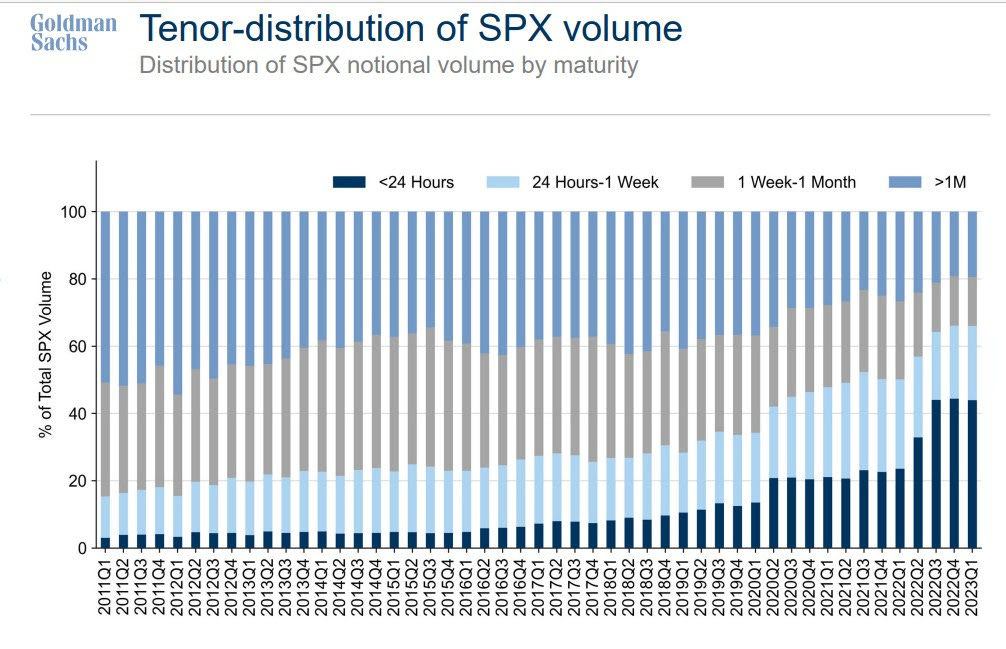
Having learned their lesson, in 2023 investors swapped long-dated volatility exposures for ones with bounded risk (e.g., Bear Put Spread) and less time to expiry (e.g., 0 DTE).

Graphic: Retrieved from Goldman Sachs Group Inc (NYSE: GS).

Though both may leave counterparties with less risk, if news shocks the market far one way, market movements may become exaggerated when investors, and counterparties accordingly, scramble to adjust their risk.

Major Wall Street players and clearing houses have, too, just announced an investigation into the risks such activity poses as well.

Up until now, however, the activity has manifested a push-and-pull, mean-reverting-type action; investors lean short volatility in the morning and long volatility in the afternoon which, combined, tends to mute price action.

Graphic: Retrieved from Bank of America Corporation (NYSE: BAC).

Say one morning an “investor sells call options and a dealer receives them,” Green puts forth as an example. “The dealer will hedge their long call position by selling futures which will pressure the market and result in the options prices collapsing in value.”

To re-hedge falling options prices, “dealers have to buy back their futures exposure and this pushes the markets upward. This is the pattern that’s been playing out over and over again. It’s weakness in the morning followed by strength in the afternoon.”

Though this is a very smart exposure to have, Green says volatility that’s longer-dated is cheap and, when an eventual shock occurs, its payout may more than justify its cost, particularly as the outlook for equities, bonds, and commodities further blurs.

Graphic: Retrieved from Goldman Sachs Group Inc (NYSE: GS) via The Market Ear.

3 – Despite still-robust appearing economic data, Green sees clear signs the economy is starting to deteriorate. 

Graphic: Retrieved from Bloomberg. “If the unemployment data this week is very strong then you’ve got 50 basis points back on the table,” explained Bob Michele, the chief investment officer of JPMorgan Asset Management. “But that is a pretty high hurdle to get to once you’ve down-shifted to 25 basis points.”

“We’re seeing cracks in bubbles like commercial real estate” and risk assets including crypto, presently maintained by a lack of inventory or supply that’s tied up in the bankruptcy proceedings of FTX (CRYPT0: FTT) and Voyager Digital Ltd (ex-OTC: VYGVF), of all things.

Graphic: Retrieved from JPMorgan Chase & Co (NYSE: JPM) via The Market Ear. “Excess liquidity is being withdrawn at an accelerating pace.”

“The question is whether higher interest rates ultimately drive a fraction of the market into distress with forced transactions,” Green wonders, pointing to the likes of Blackstone Inc (NYSE: BX) and Brookfield Corp (NYSE: BN) handing in keys to properties. “It takes one person being in distress to set a new clearing price which, in turn, changes valuations for everybody, and makes it more difficult to qualify for things like mortgages.”

4 – Looking forward, over the short-term at least, Green says inflation is likely to trend higher for longer, particularly with monetary policy inspiring fiscal action and sparking off geopolitics.

“The world’s growing materially slower and manufacturing capacity, which is spreading around the world, requires labor and investment, which could be inflationary in the short-run,” Green puts forth. Traditionally, “lower rates and costs enable added capacity and a predictable rebound in consumption. However, we’re driving a stake through the vampire’s heart, now, and … there’s the multiplier effect driving fiscal policy, too.”

Graphic: Retrieved from CME Group Inc’s (NASDAQ: CME) FedWatch Tool. The terminal (peak) rate sits at 5.50-5.75%.

5 – In response to uncertainty, investors can park cash in Treasury bonds, as well as allocate some capital to volatility “to introduce a degree of convexity,” risking only the premium paid. Alternatively, investors can take a more optimistic long view and position in innovations like artificial intelligence or next-generation energy production.

Graphic: Retrieved from Goldman Sachs Group Inc (NYSE: GS) via The Market Ear. Investors are not concerned with tail risk.

“I’m optimistic about human innovation and the rise of AI, … as well as higher energy prices creating the impetus for tremendous innovations in energy generation that have the potential to lift us out of this period of perceived scarcity if we allow ourselves to embrace it.”

Technical

As of 8:00 AM ET, Friday’s regular session (9:30 AM – 4:00 PM ET), in the S&P 500, is likely to open in the upper part of a negatively skewed overnight inventory, outside of the prior day’s range, suggesting a potential for immediate directional opportunity.

The S&P 500 pivot for today is $3,947.00. 

Key levels to the upside include $3,965.25, $3,979.25, and $4,004.75.

Key levels to the downside include $3,921.75, $3,891.00, and $3,857.25.

Disclaimer: Click here to load the updated key levels via the web-based TradingView platform. New links are produced daily. Quoted levels likely hold barring an exogenous development.

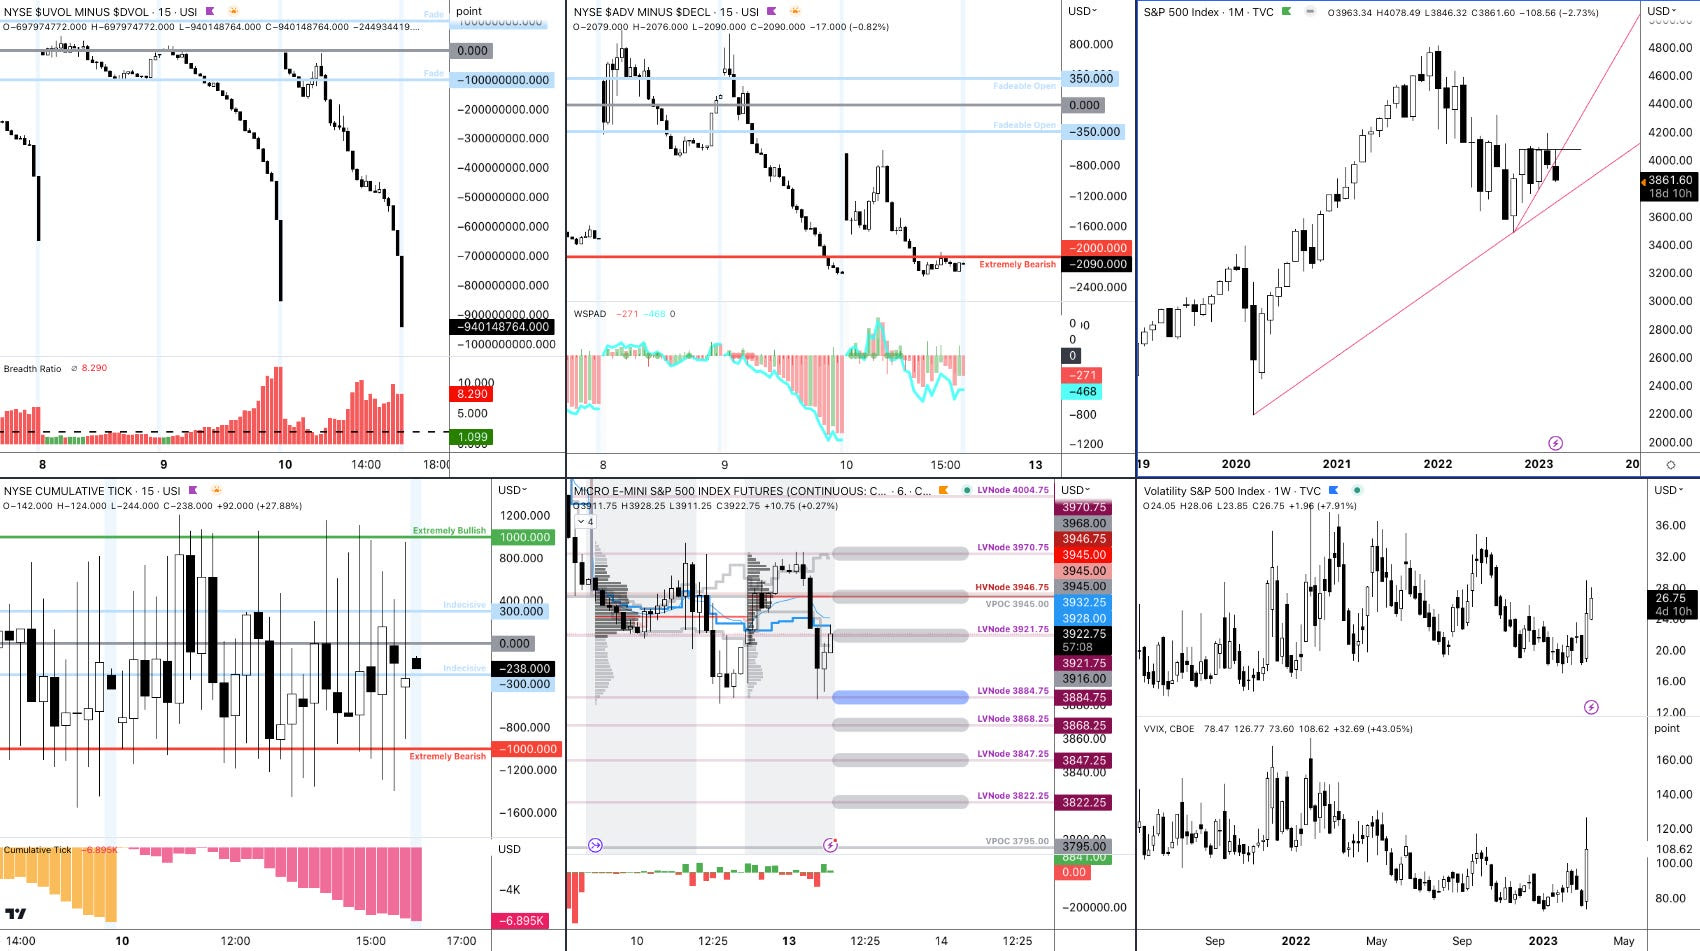
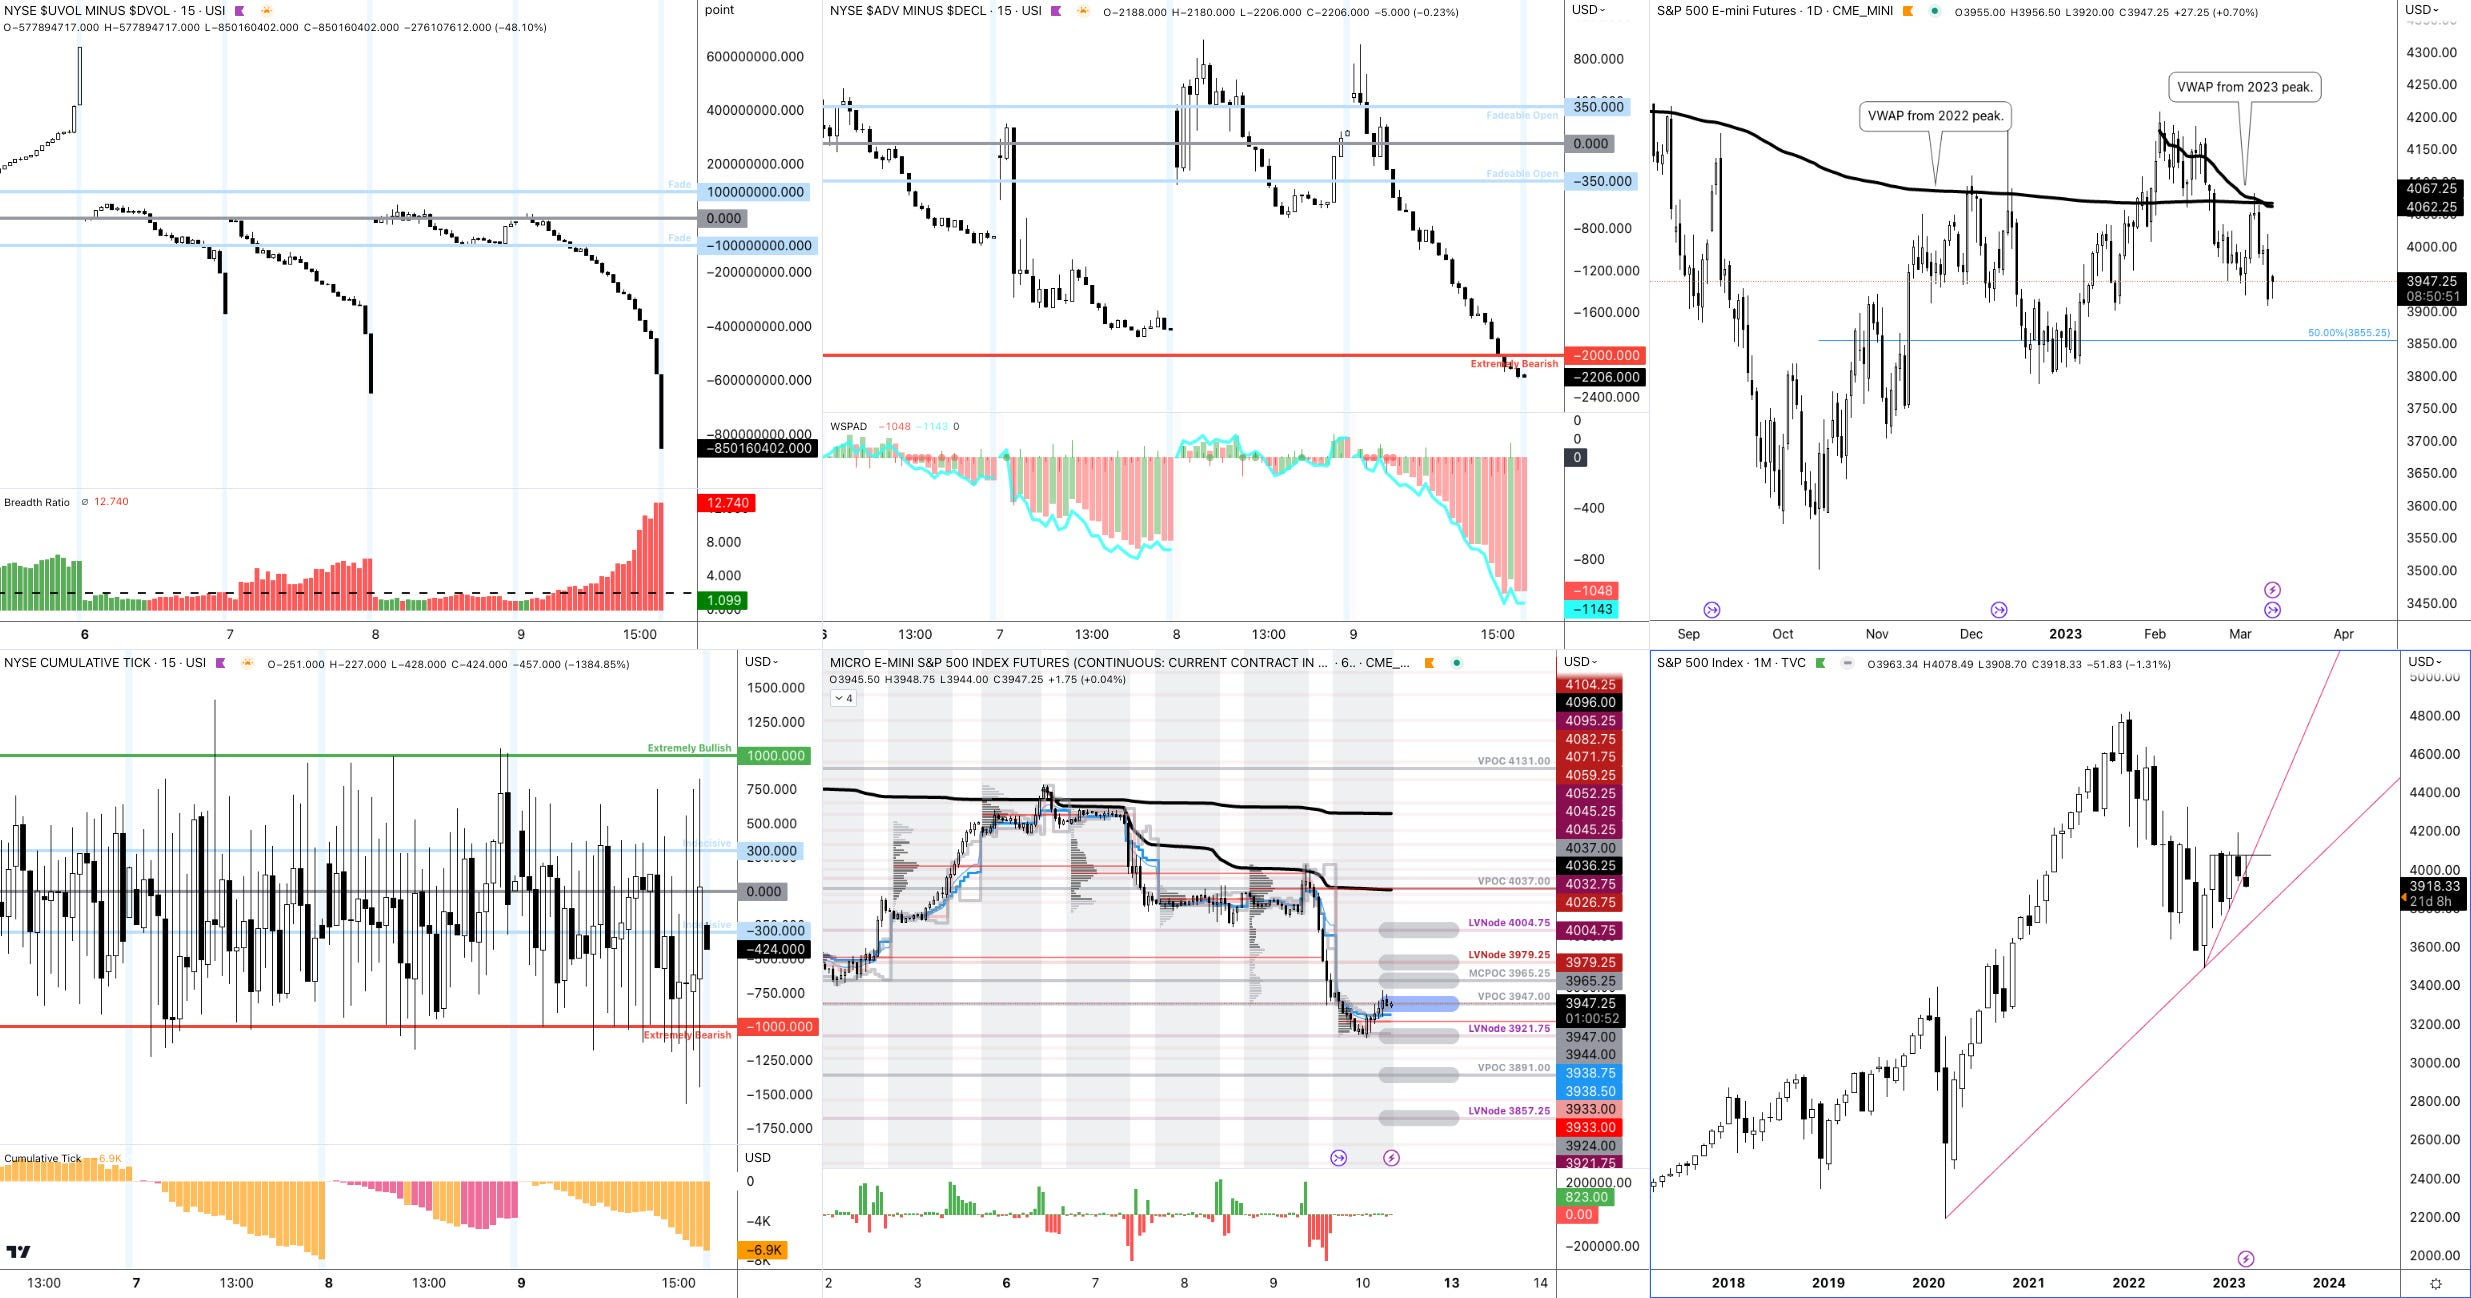
Graphic: 65-minute profile chart of the Micro E-mini S&P 500 Futures (bottom middle) and market internals as taught by Peter Reznicek.

Definitions

Volume Areas: Markets will build on areas of high-volume (HVNodes). Should the market trend for a period of time, this will be identified by a low-volume area (LVNodes). The LVNodes denote directional conviction and ought to offer support on any test.

If participants auction and find acceptance in an area of a prior LVNode, then future discovery ought to be volatile and quick as participants look to the nearest HVNodes for more favorable entry or exit.

POCs: Areas where two-sided trade was most prevalent in a prior day session. Participants will respond to future tests of value as they offer favorable entry and exit.

MCPOCs: Denote areas where two-sided trade was most prevalent over numerous sessions. Participants will respond to future tests of value as they offer favorable entry and exit.


About

The author, Renato Leonard Capelj, spends the bulk of his time at Physik Invest, an entity through which he invests and publishes free daily analyses to thousands of subscribers. The analyses offer him and his subscribers a way to stay on the right side of the market. 

Separately, Capelj is an accredited journalist with past works including interviews with investor Kevin O’Leary, ARK Invest’s Catherine Wood, FTX’s Sam Bankman-Fried, North Dakota Governor Doug Burgum, Lithuania’s Minister of Economy and Innovation Aušrinė Armonaitė, former Cisco chairman and CEO John Chambers, and persons at the Clinton Global Initiative.

Connect

Direct queries to renato@physikinvest.com. Find Physik Invest on TwitterLinkedInFacebook, and Instagram. Find Capelj on TwitterLinkedIn, and Instagram. Only follow the verified profiles.

Calendar

You may view this letter’s content calendar at this link.

Disclaimer

Do not construe this newsletter as advice. All content is for informational purposes. Capelj and Physik Invest manage their own capital and will not solicit others for it.

Categories
Commentary

Daily Brief For March 8, 2023

Physik Invest’s Daily Brief is read free by thousands of subscribers. Join this community to learn about the fundamental and technical drivers of markets.

Graphic updated 8:00 AM ET. Sentiment Risk-Off if expected /MES open is below the prior day’s range. /MES levels are derived from the profile graphic at the bottom of this letter. Click here for the latest levels. SqueezeMetrics Dark Pool Index (DIX) and Gamma (GEX) with the latter calculated based on where the prior day’s reading falls with respect to the MAX and MIN of all occurrences available. A higher DIX is bullish. The lower the GEX, the more (expected) volatility. Click to learn the implications of volatility, direction, and moneyness. Breadth reflects a reading of the prior day’s NYSE Advance/Decline indicator. The CBOE VIX Volatility Index (INDEX: VVIX) reflects the attractiveness of owning volatility. UMBS prices via MNDClick here for the economic calendar.

Fundamental

Note: The write-up on the conversation with Simplify’s Mike Green and your letter writer coming soon. Your letter writer is juggling Physik Invest, Benzinga, and two weeks of jury duty! Oh, my.

Following Federal Reserve (Fed) Chair Jerome Powell’s testimony yesterday, traders shifted their outlook on the path of interest rates. The terminal rate now sits between 5.50% and 5.75%, and there are no cuts priced in 2023. Traders are also anticipating a 0.50% hike at the March meeting, up from 0.25%.

Graphic: Retrieved from CME Group Inc’s (NASDAQ: CME) FedWatch Tool. Updated 3/8/2023.

The likes of Ken Griffin, who is the founder of Citadel and Citadel Securities, said the Fed’s updates have confused investors. He advised Powell to talk less about inflation.

“Every time they take the foot off the brake, or the market perceives they’re taking their foot off the brake, and the job’s not done, they make their work even harder,” he explained. TS Lombard’s Steven Blitz added the downshifts in hikes were a mistake and the testimony was a “tacit admission.”

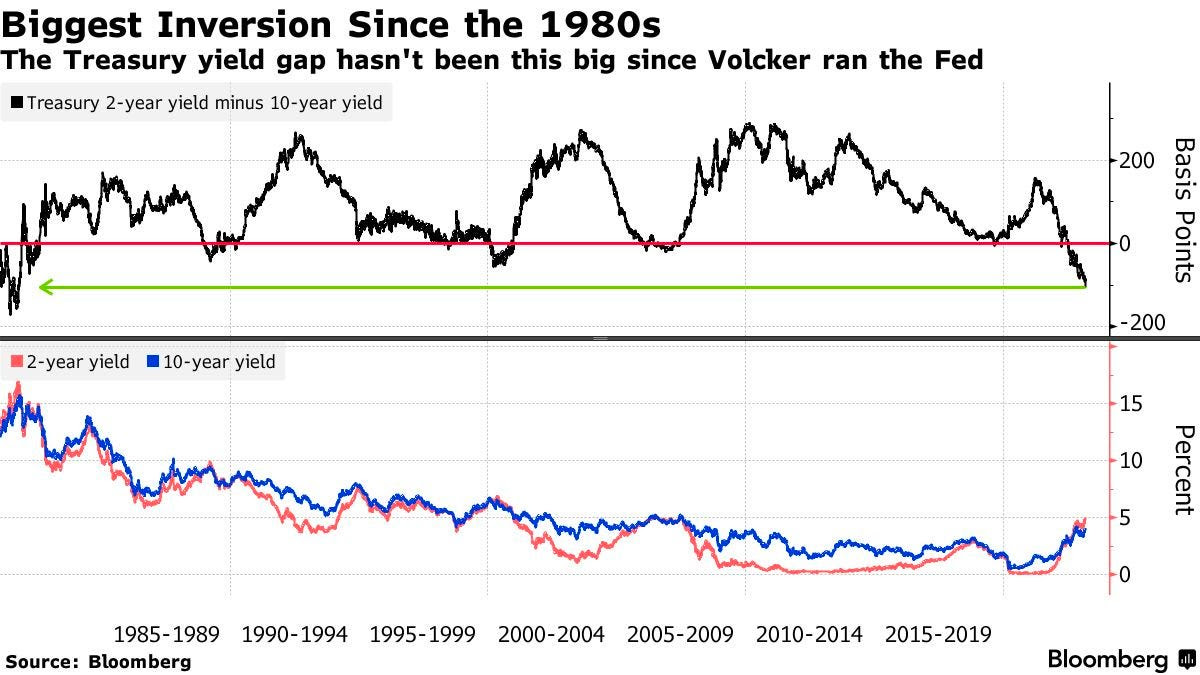
Anyways, the 2- and 10-year Treasury yield spread is at levels when the Fed’s Volcker tightened up the economy to tackle double-digit inflation. Bespoke Investment notes that after that particular spread inverted in October of 1979, the economy peaked at the end of January 1980 but the stock market remained strong.

“The next year, the S&P 500 rallied 22.9%, the Nasdaq was up 36.0%, and the Russell 2000 was up over 40.0%.”

Graphic: Retrieved from Bloomberg. 

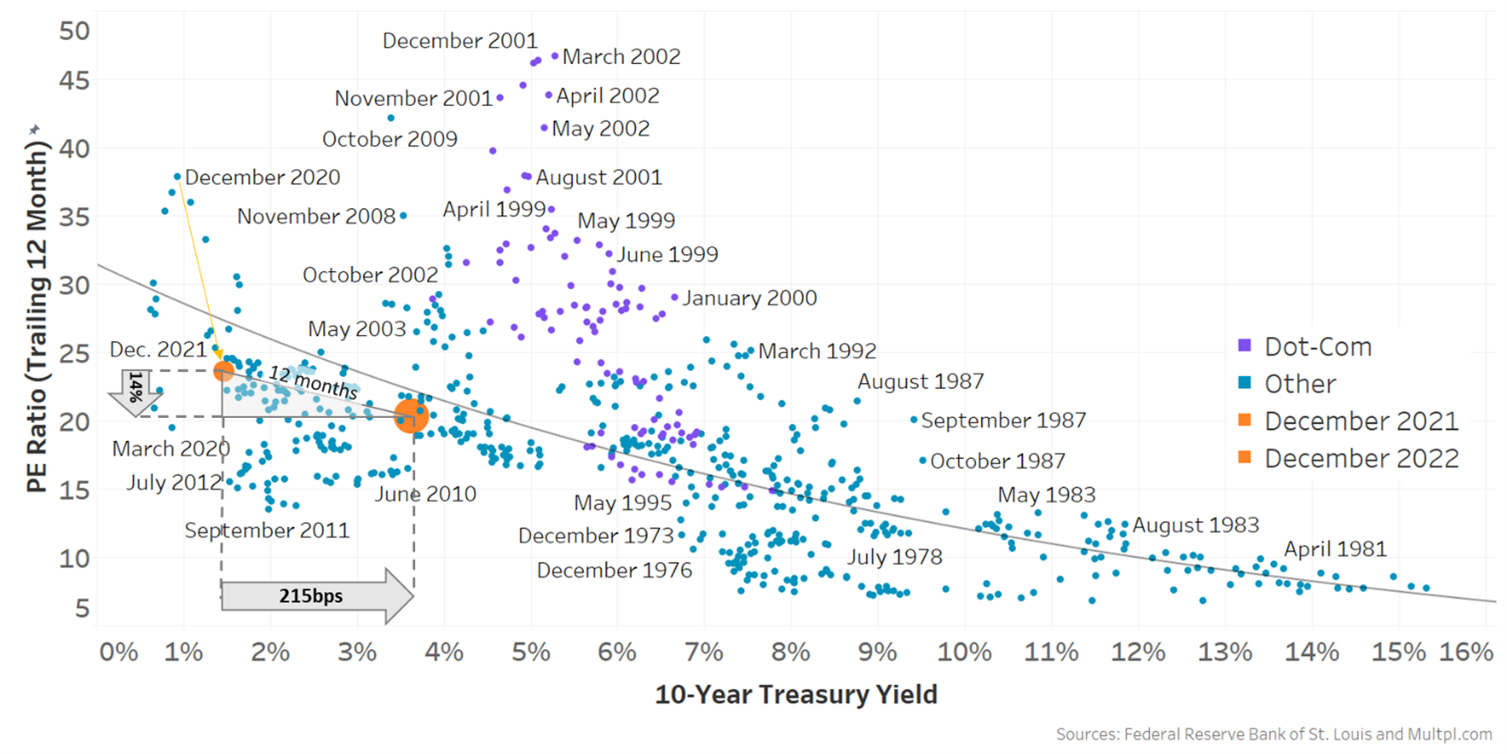
However, Bespoke adds that “back then, the S&P 500 was trading for just 7.3 times trailing earnings. Today, the S&P 500 trades at a multiple that’s two-and-a-half times that level.” Per last week’s letters, investors’ salvation may be found in less traditional portfolio constructions. That’s what Simplify Asset Management portfolio manager and strategist Mike Green said to your letter writer last week in an interview as well.

Given the unreliability of data, Green explains, and the positioning, investors can get through a lot of the uncertainty by buying a one-year bond and stepping out.

“A real decrease in the purchasing power of the dollar means stock prices should go up because they are something you’re purchasing like everything else. The problem is that would, then, require significant multiple compression as you move forward. So, corporations would be making more money, but that money would be valued less richly because of the inflation.” Conversely, we see multiple expansions, Green said in casting doubt on recent market strength. “Earnings are actually going down.”

With the S&P 500 trading upwards of 20% above the last decade’s average forward price-to-earnings, traditional rules imply the P/E likely falls, and that is supportive of Green’s doubt and support of alternative portfolio constructions layering bond and volatility (i.e., options) exposure to target a full return of principal at the least.

“Using options allows you to introduce a degree of convexity in portfolios where [you] can take risks with a limited downside because [you’ve] either protected [your] downside or simply expended a degree of premium on it.”

With deterioration in some markets “offset by a lack of inventory” and/or hesitancy to sell, the marginal impact of “one person being in distress” may eventually “set a new clearing price … chang[ing] valuations for everybody.” That’s a good place to be as the owner of options protection.

Technical

As of 7:50 AM ET, Wednesday’s regular session (9:30 AM – 4:00 PM ET), in the S&P 500, is likely to open in the lower part of a balanced overnight inventory, outside of the prior day’s range, suggesting a potential for immediate directional opportunity.

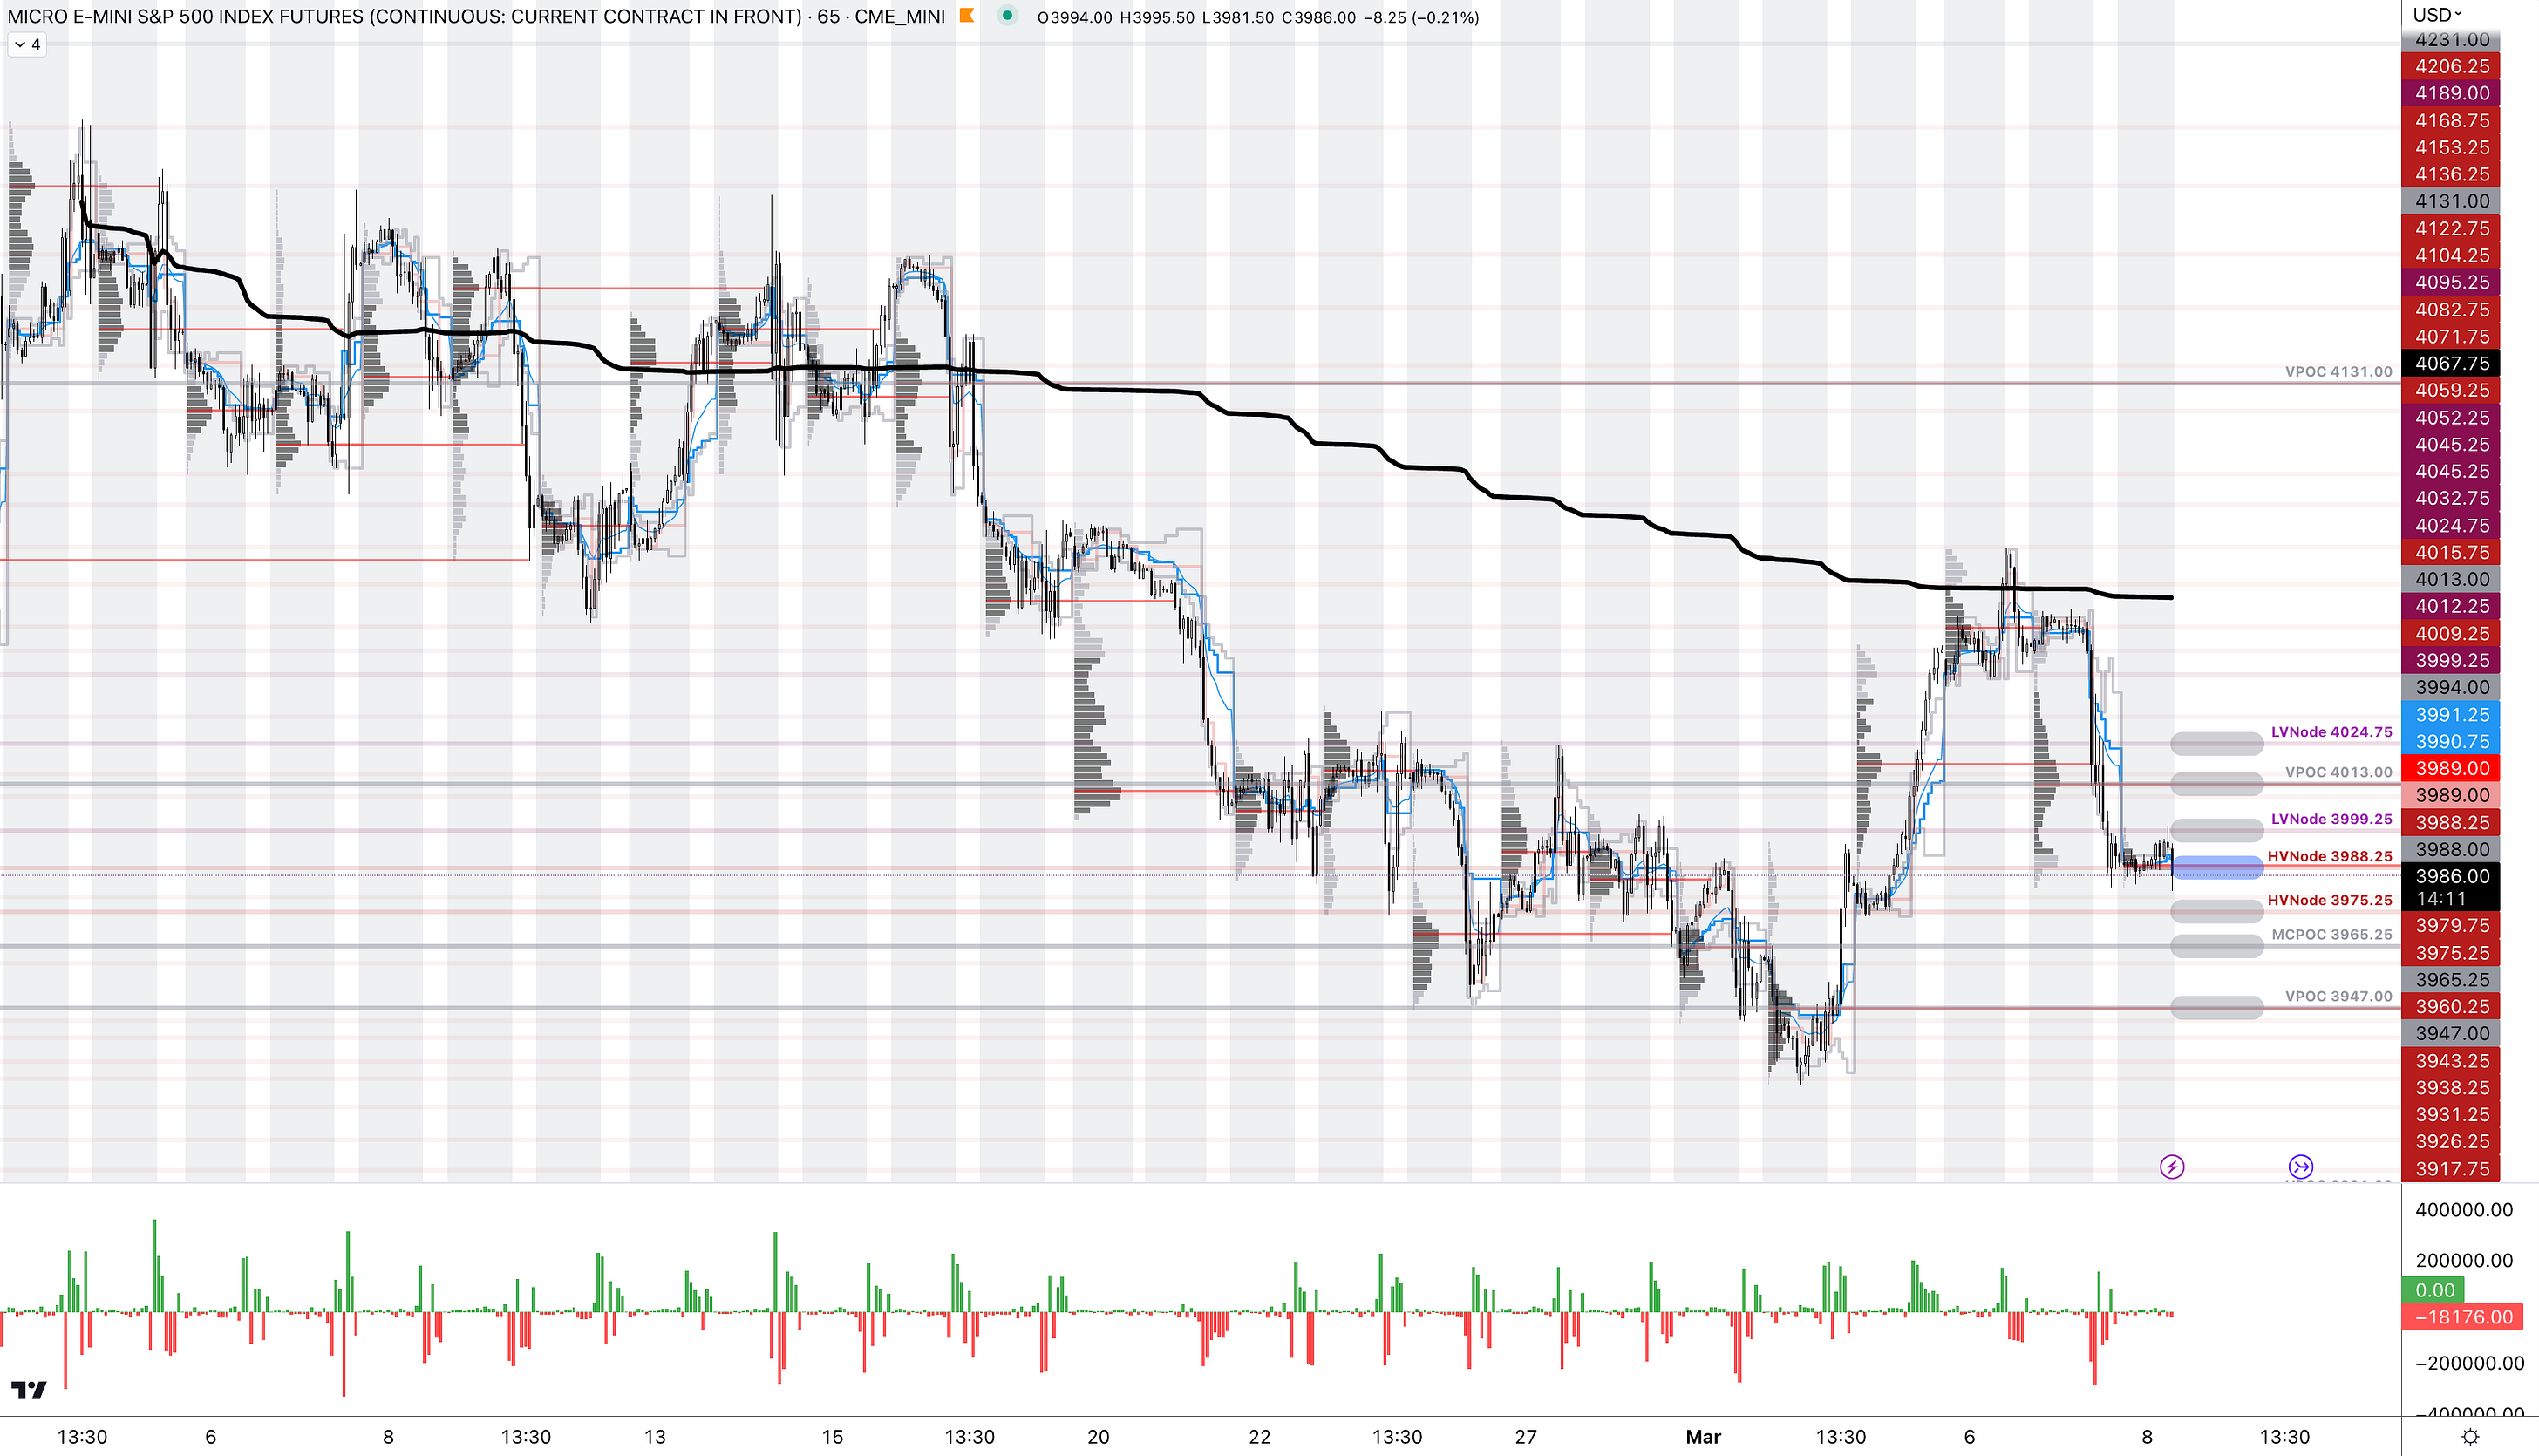
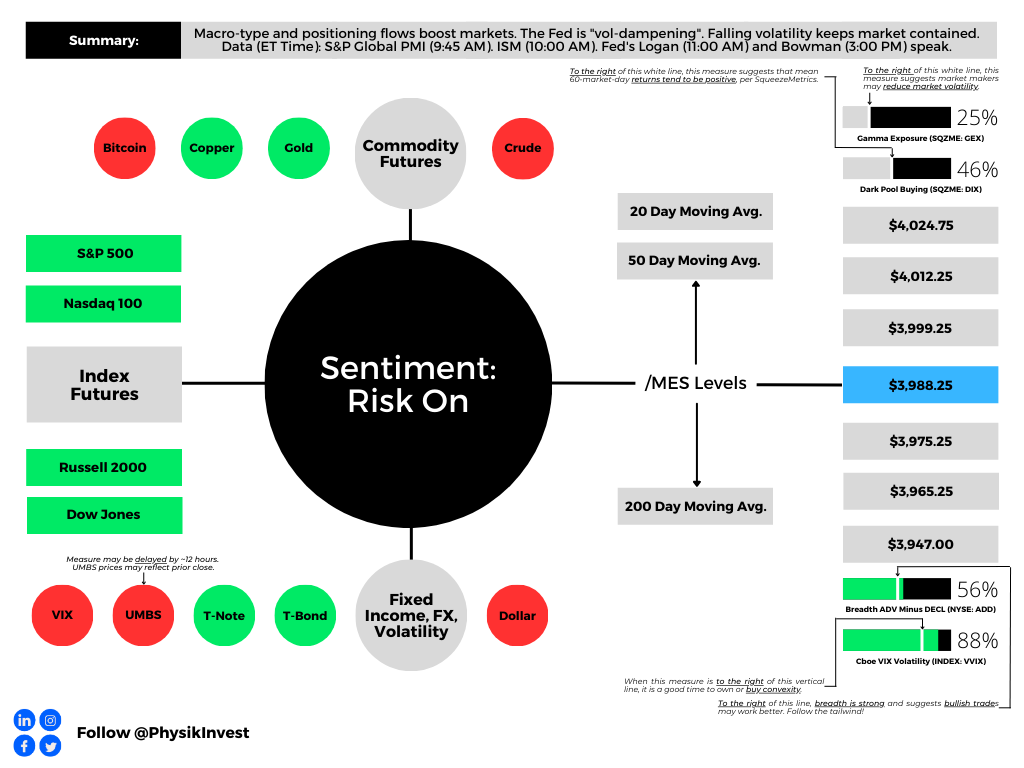
The S&P 500 pivot for today is $3,988.25. 

Key levels to the upside include $3,999.25, $4,013.00, and $4,024.75.

Key levels to the downside include $3,975.25, $3,965.25, and $3,947.00.

Disclaimer: Click here to load the updated key levels via the web-based TradingView platform. New links are produced daily. Quoted levels likely hold barring an exogenous development.

Graphic: 65-minute profile chart of the Micro E-mini S&P 500 Futures.

Definitions

Volume Areas: Markets will build on areas of high-volume (HVNodes). Should the market trend for a period of time, this will be identified by a low-volume area (LVNodes). The LVNodes denote directional conviction and ought to offer support on any test.

If participants auction and find acceptance in an area of a prior LVNode, then future discovery ought to be volatile and quick as participants look to the nearest HVNodes for more favorable entry or exit.

POCs: Areas where two-sided trade was most prevalent in a prior day session. Participants will respond to future tests of value as they offer favorable entry and exit.

MCPOCs: Denote areas where two-sided trade was most prevalent over numerous sessions. Participants will respond to future tests of value as they offer favorable entry and exit.


About

The author, Renato Leonard Capelj, spends the bulk of his time at Physik Invest, an entity through which he invests and publishes free daily analyses to thousands of subscribers. The analyses offer him and his subscribers a way to stay on the right side of the market. 

Separately, Capelj is an accredited journalist with past works including interviews with investor Kevin O’Leary, ARK Invest’s Catherine Wood, FTX’s Sam Bankman-Fried, North Dakota Governor Doug Burgum, Lithuania’s Minister of Economy and Innovation Aušrinė Armonaitė, former Cisco chairman and CEO John Chambers, and persons at the Clinton Global Initiative.

Connect

Direct queries to renato@physikinvest.com. Find Physik Invest on TwitterLinkedInFacebook, and Instagram. Find Capelj on TwitterLinkedIn, and Instagram. Only follow the verified profiles.

Calendar

You may view this letter’s content calendar at this link.

Disclaimer

Do not construe this newsletter as advice. All content is for informational purposes. Capelj and Physik Invest manage their own capital and will not solicit others for it.

Categories
Commentary

Daily Brief For March 3, 2023

Physik Invest’s Daily Brief is read free by thousands of subscribers. Join this community to learn about the fundamental and technical drivers of markets.

Graphic updated 7:00 AM ET. Sentiment Risk-On if expected /MES open is above the prior day’s range. /MES levels are derived from the profile graphic at the bottom of this letter. Click here for the latest levels. SqueezeMetrics Dark Pool Index (DIX) and Gamma (GEX) with the latter calculated based on where the prior day’s reading falls with respect to the MAX and MIN of all occurrences available. A higher DIX is bullish. The lower the GEX, the more (expected) volatility. Click to learn the implications of volatility, direction, and moneyness. Breadth reflects a reading of the prior day’s NYSE Advance/Decline indicator. The CBOE VIX Volatility Index (INDEX: VVIX) reflects the attractiveness of owning volatility. UMBS prices via MNDClick here for the economic calendar.

Administrative

Lots of content today but a bit rushed at the desk. If anything is unclear, we will clarify it in the coming sessions. Have a great weekend! – Renato

Fundamental

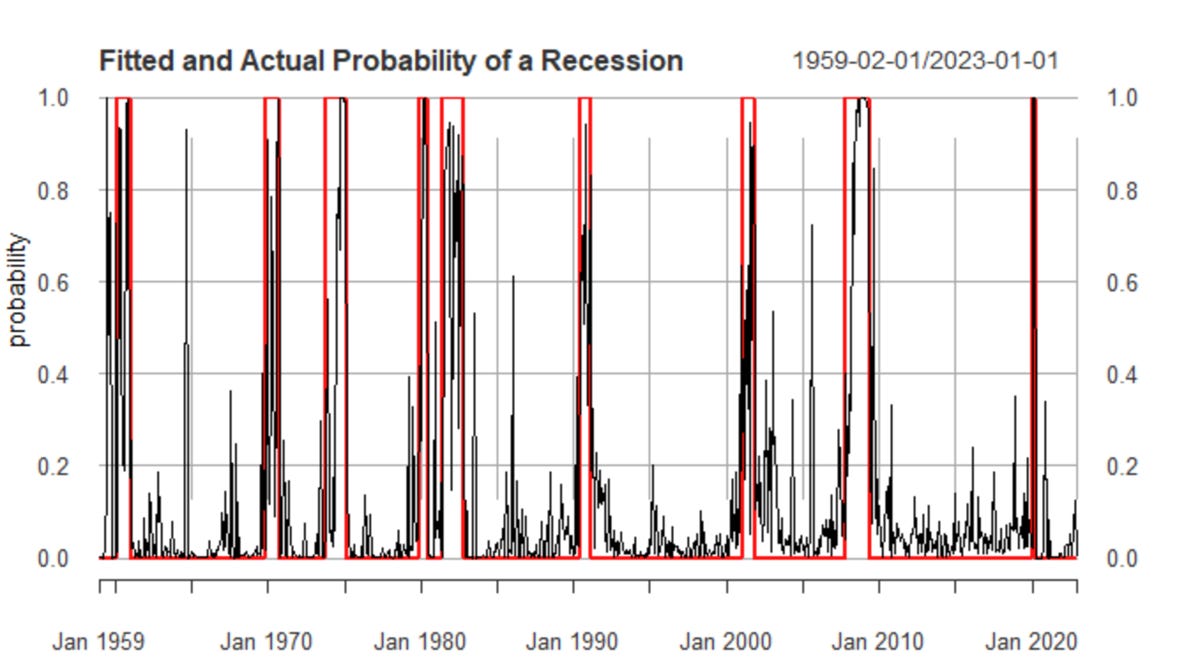
Physik Invest’s Daily Brief for March 2 talked about balancing the implications of still-hot inflation and an economy on solid footing. Basically, the probability the economy is in a recession is lower than it was at the end of ‘22. For the probabilities to change markedly, there would have to be a big increase in unemployment, for one.

According to a blog by Unlimited’s Bruce McNevin, if the unemployment rate rises by about 1%, recession odds go up by 29%. If the non-farm payroll employment falls by about 2% or 3 million jobs, recession odds increase by about 74%. After a year or so of tightening, unemployment measures are finally beginning to pick up.

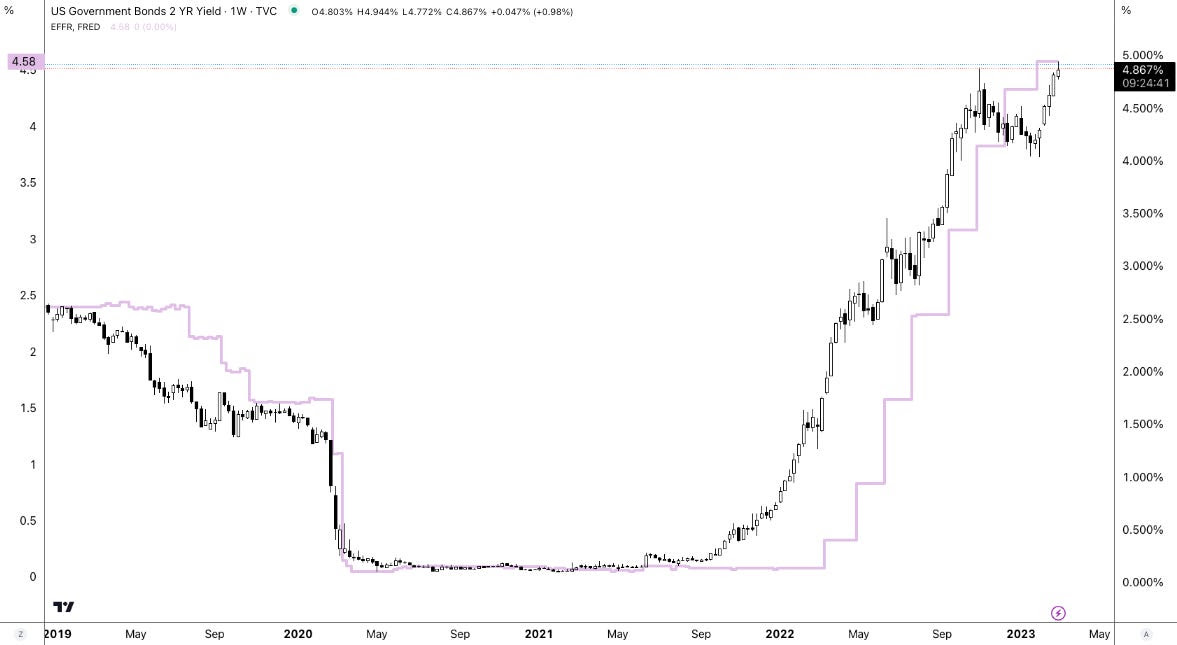
Policymakers, per recent remarks, maintain that more needs to be done, however. For instance, the Federal Reserve’s (Fed) Raphael Bostic, who generally carries an easier stance on monetary policy, mulled whether the Fed should raise interest rates beyond the 5.00-5.25% terminal rate consensus he previously endorsed. This commentary, coupled with newly released economic data, has sent yields surging at the front end. 

Graphic: Retrieved from TradingView.

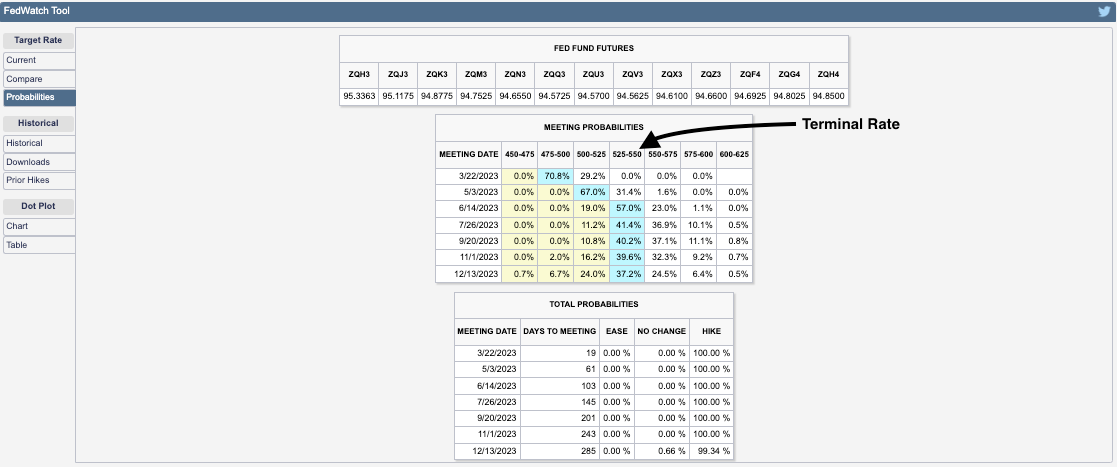
Traders are wildly repricing their terminal rate expectations this week. The terminal rate over the past few days has gone up from 5.25-5.50% to 5.50-5.75%, and back down to 5.25-5.50%.

Graphic: Retrieved from CME Group Inc (NASDAQ: CME).

Positioning

Stocks and bonds performed poorly. Commodity hedges are uninspiring also in that they do not hedge against (rising odds of) recession, per the Daily Brief for March 1

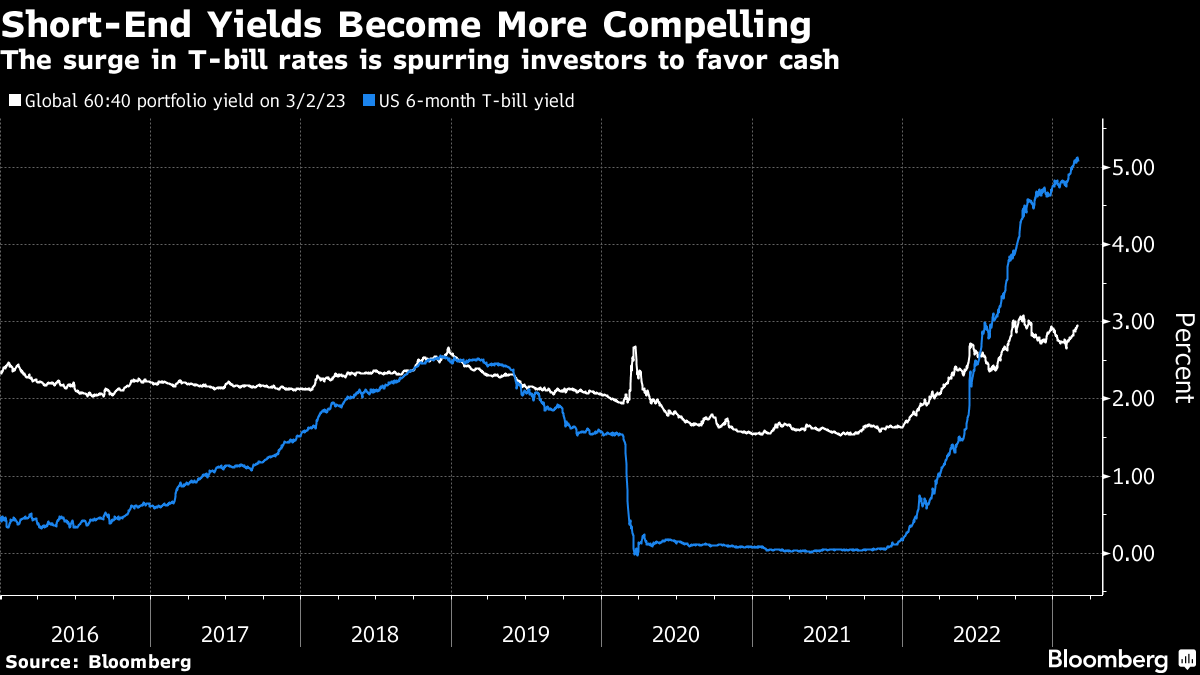
In navigating this precarious environment, this letter has put forward a few trade ideas including the sale of call options structures to finance put options structures, after the mid-February monthly options expiration (OpEx). Though measures suggest “we can [still] get cheap exposure to convexity while a lot of people are worried,” the location for similar (short call, long put) trades is not optimal. Rather, trades including building your own structured note, now catching the attention of some traders online, appear attractive now with T-bill rates surging.

Graphic: Retrieved from Bloomberg.

Such trades reduce portfolio volatility and downside while providing upside exposure comparable to poorly performing traditional portfolio constructions like 60/40.

As an example, per IPS Strategic Capital’s Pat Hennessy, with $1,000,000 to invest and rates at ~5% (i.e., $50,000 is 5% of $1,000,000), one could buy 1000 USTs or S&P 500 (INDEX: SPX) Box Spreads which will have a value of $1 million at maturity for the price of $950,000.

With $50,000 left in cash, one can use options for leveraged exposure to an asset of their choosing, Hennessy explained. Should these options expire worthless, the $50,000 gain from USTs, at maturity, provides “a full return of principal.”

For traders who are focused on short(er)-term movements, one could allocate the cash remaining toward structures that buy and sell call options over very short time horizons (e.g., 0 DTE).

Knowing that the absence of range expansion to the downside, positioning flows may build a platform for the market to rally, one could lean into structures like fixed-width call option butterflies.

For instance, yesterday, Nasdaq 100 (INDEX: NDX) call option butterflies expanded in value ~10 times (i.e., $5 → $50). An example 0 DTE trade is the BUTTERFLY NDX 100 (Weeklys) 2 MAR 23 12000/12100/12200 CALL. Such trade could have been bought near ~$5.00 in debit and, later, sold for much bigger credits (e.g., ~$40.00).

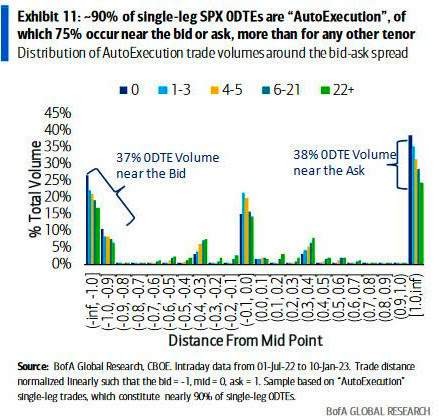
Such trade fits and plays on the narrative described in Physik Invest’s Daily Brief for February 24. That particular letter detailed Bank of America Corporation’s (NYSE: BAC) finding that “volume is uniquely skewed towards the ask early in the day but towards the bid later in the day” for these highly traded ultra-short-dated options.

Graphic: Retrieved from Goldman Sachs Group Inc (NYSE: GS) via Bloomberg. 

Even options insight and data provider SqueezeMetrics agrees: “Buy 0 DTE call.” The typical “day doesn’t end above straddle b/e, but call makes money,” SqueezeMetrics explained. “Dealer and call-buyer both profit. Gap down, repeat.”

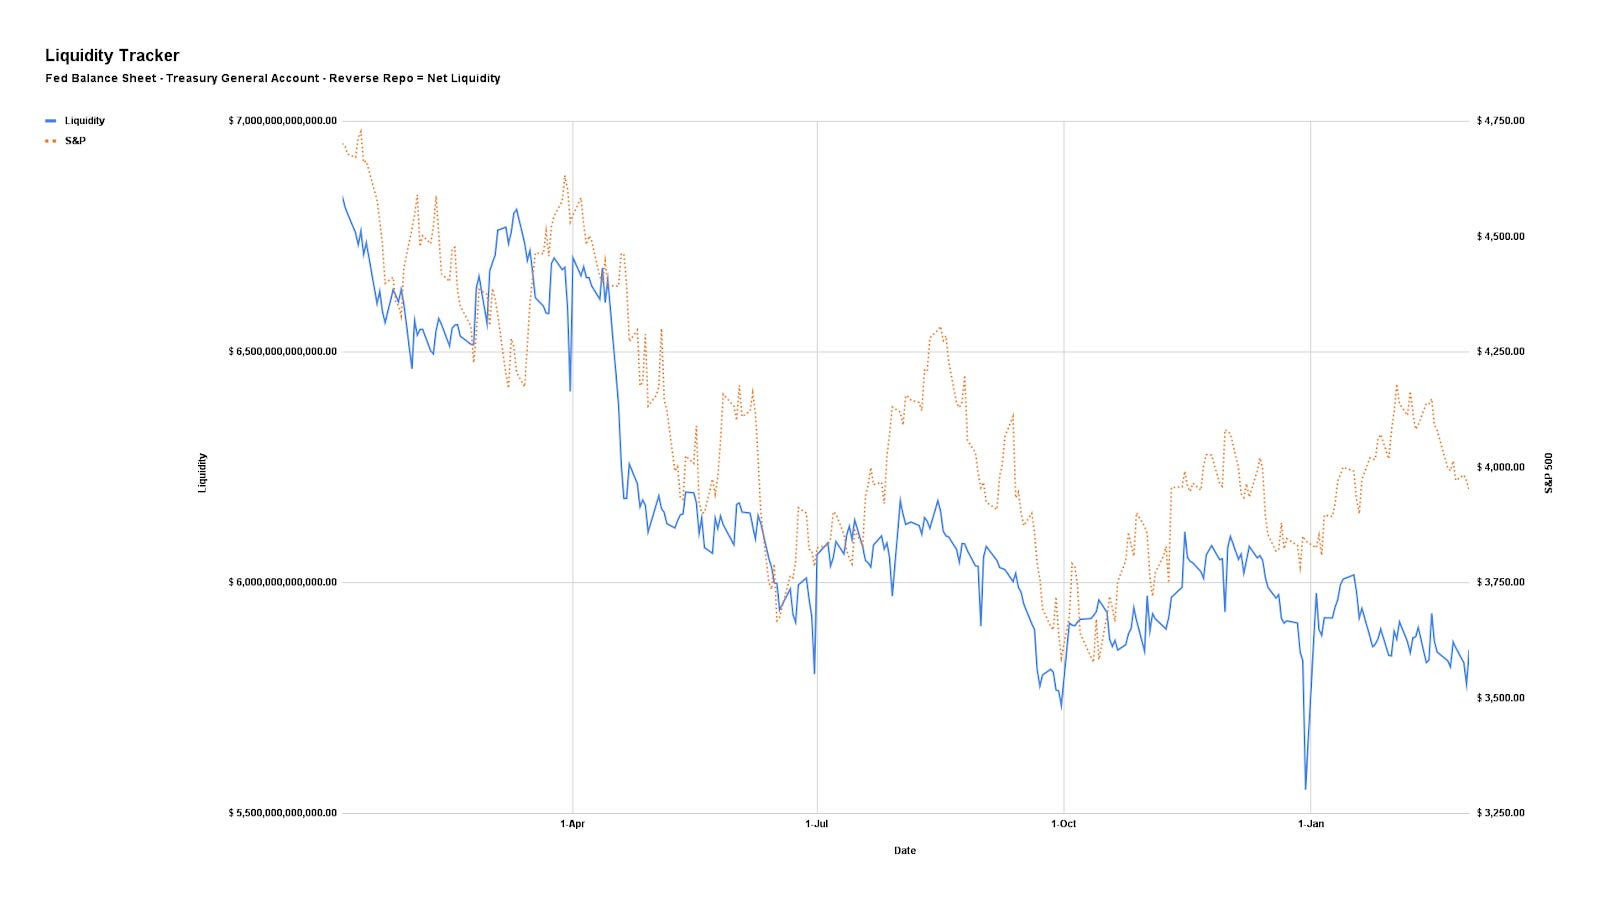
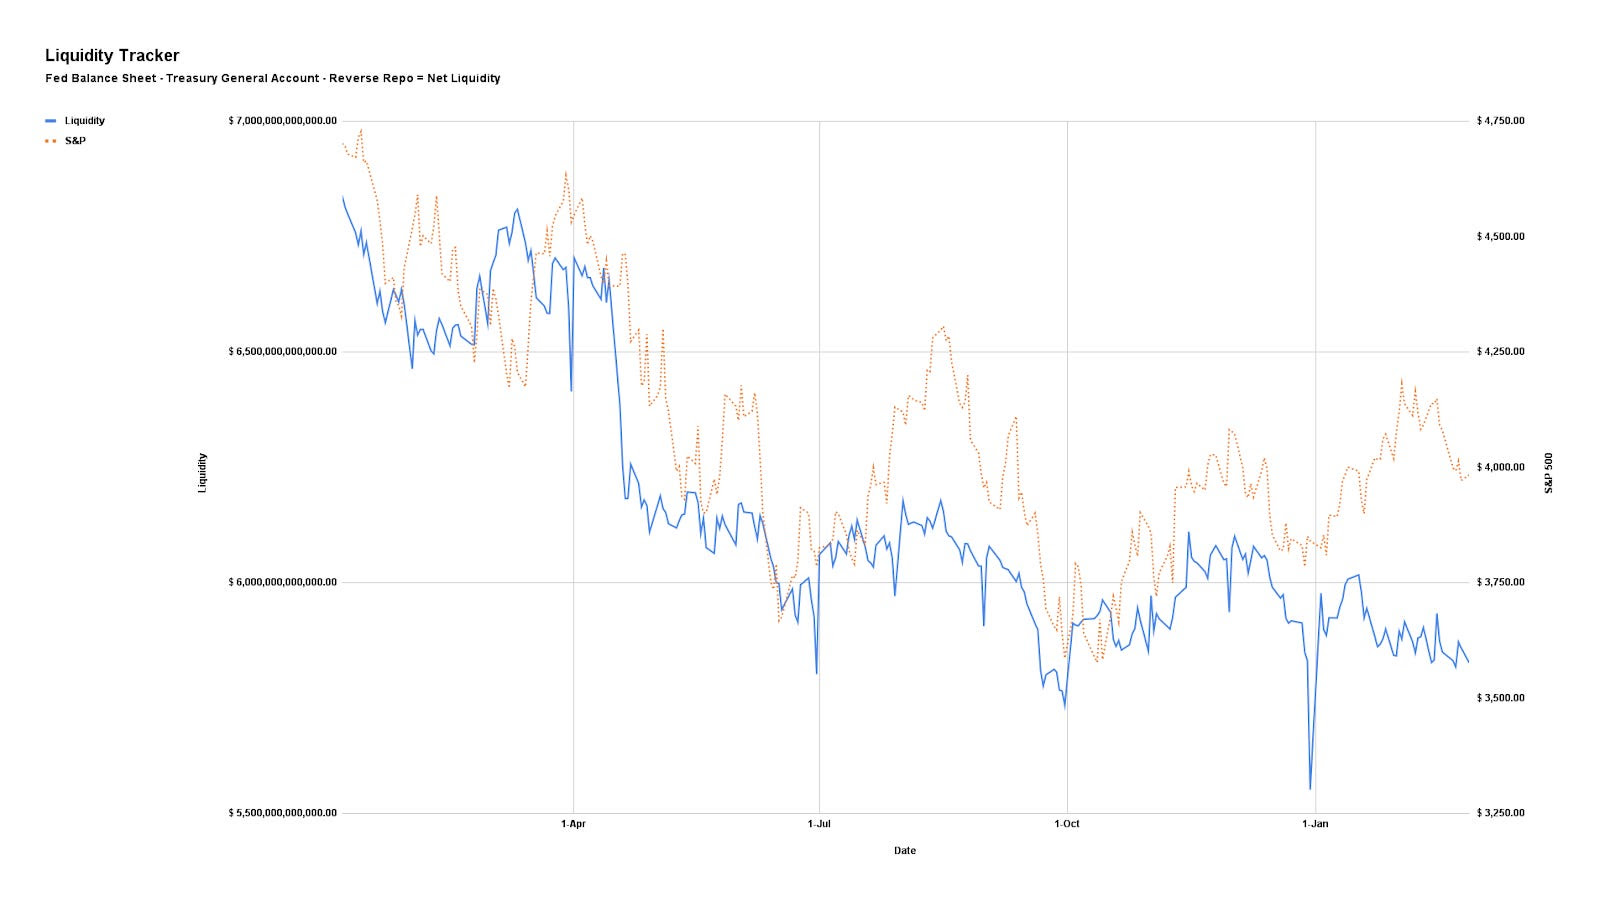
Anyways, back to the bigger trends impacted by liquidity coming off the table and increased competition between equities and fixed income.

Graphic: Via Physik Invest. Net Liquidity = Fed Balance Sheet – Treasury General Account – Reverse Repo.

As this letter put forth in the past, if the “market consolidates and doesn’t break,” as we see, the delta buy-back with respect to dropping implied volatility (IVOL) or vanna and buy-back with respect to the passage of time or charm could build a platform for a FOMO-driven call buying rally that ends in a blow-off. 

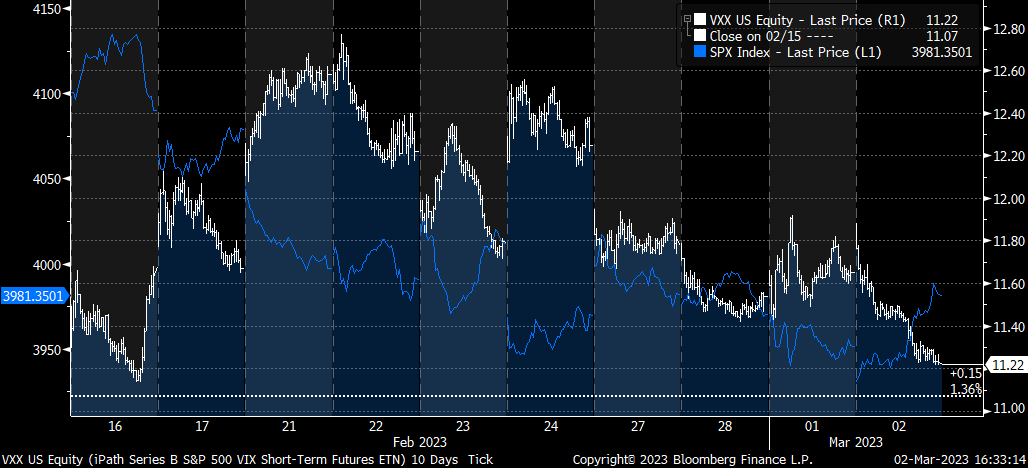
Graphic: Retrieved from Piper Sandler’s (NYSE: PIPR) Danny Kirsch. Short volatility and short stocks was attractive to trade. As your letter writer put in a recent SpotGamma note: “With IV at already low levels, the bullish impact of it falling further is weak, hence the SPX trending lower all the while IV measures (e.g., VIX term structure) have shifted markedly lower since last week. If IV was at a higher starting point, its falling would work to keep the market in a far more positive/bullish stance.”

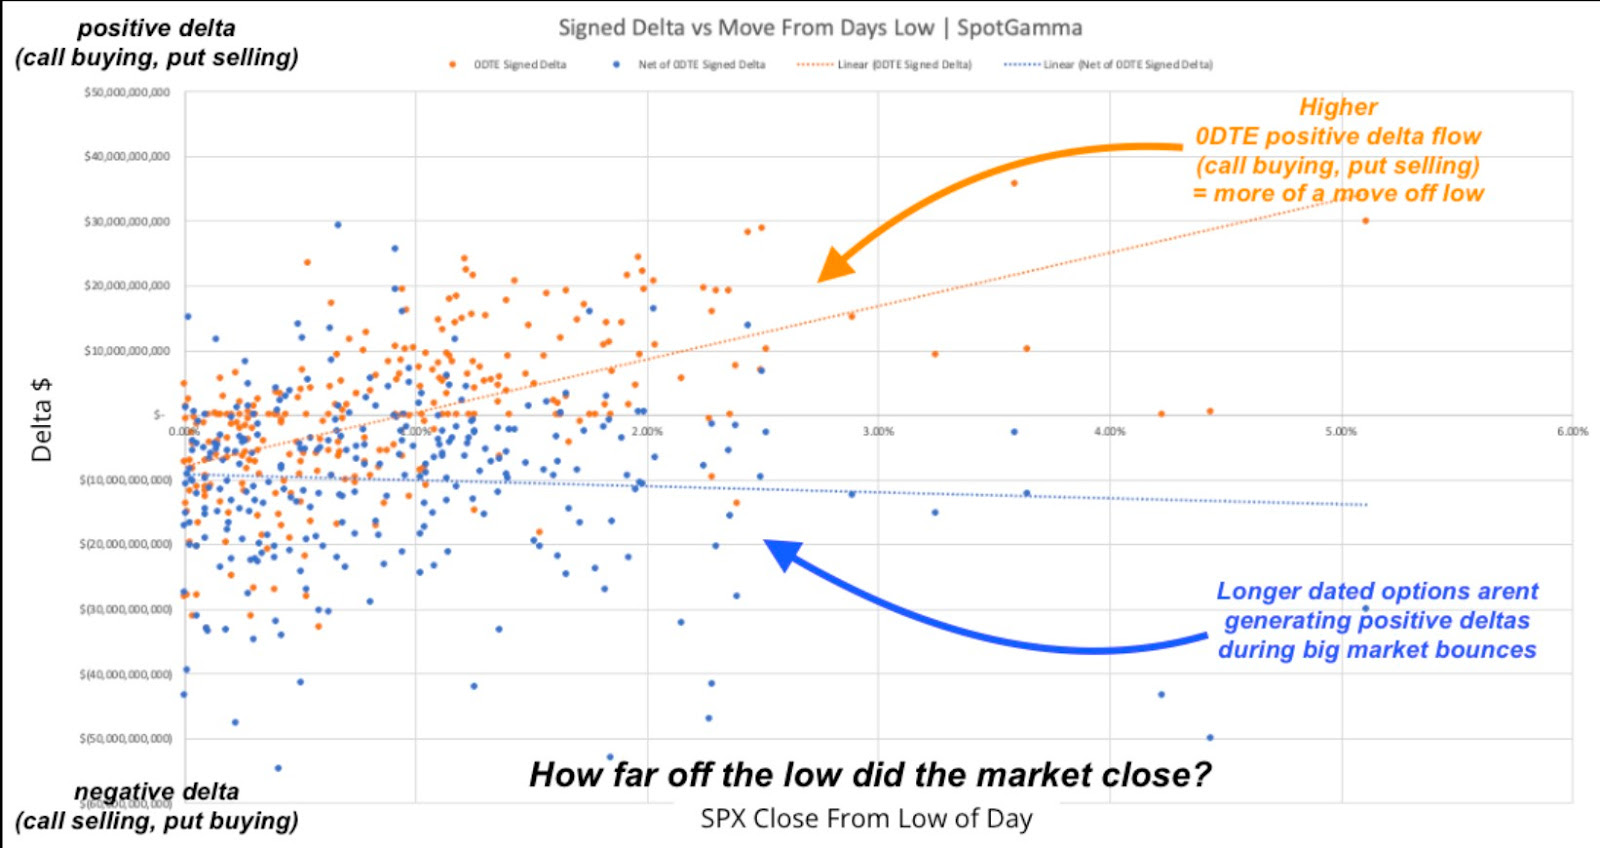
Per data by SpotGamma, another options insight and data provider your letter writer used to write for and highly recommends checking out, call buying, particularly over short time horizons, was often tied to market rallies. 

Graphic: Retrieved from SpotGamma via Bloomberg.

“0DTE does not seem to be associated with betting on a large downside movement. Large downside market volatility appears to be driven by larger, longer-dated S&P volume,” SpotGamma founder Brent Kochuba said in the Bloomberg article. “Where 0DTE is currently most impactful is where it seems 0DTE calls are being used to ‘buy the dips’ after large declines. In a way this suppresses volatility.”

Anyways, the signs of a “more combustible situation” would likely show when “volatility is sticky into a rally,” explained Kai Volatiity’s Cem Karsan. To gauge combustibility, look to the Daily Brief for February 17.

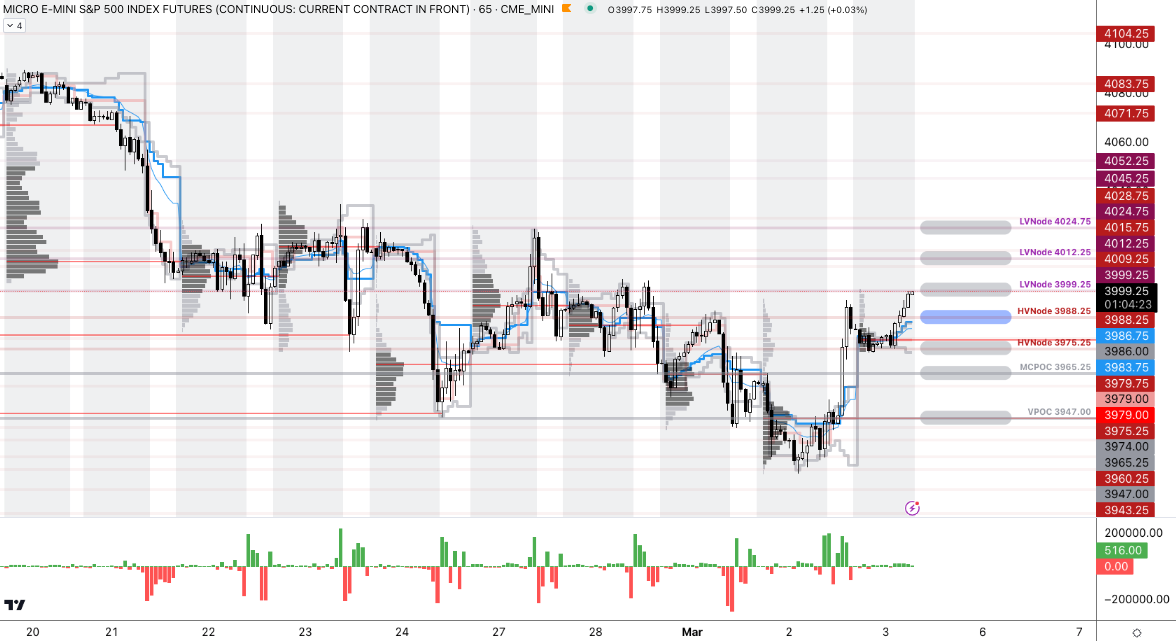
Technical

As of 6:50 AM ET, Friday’s regular session (9:30 AM – 4:00 PM ET), in the S&P 500, is likely to open in the upper part of a positively skewed overnight inventory, outside of the prior day’s range, suggesting a potential for immediate directional opportunity.

The S&P 500 pivot for today is $3,988.25. 

Key levels to the upside include $3,999.25, $4,012.25, and $4,024.75.

Key levels to the downside include $3,975.25, $3,965.25, and $3,947.00.

Disclaimer: Click here to load the updated key levels via the web-based TradingView platform. New links are produced daily. Quoted levels likely hold barring an exogenous development.

Graphic: 65-minute profile chart of the Micro E-mini S&P 500 Futures.

Definitions

Volume Areas: Markets will build on areas of high-volume (HVNodes). Should the market trend for a period of time, this will be identified by a low-volume area (LVNodes). The LVNodes denote directional conviction and ought to offer support on any test.

If participants auction and find acceptance in an area of a prior LVNode, then future discovery ought to be volatile and quick as participants look to the nearest HVNodes for more favorable entry or exit.

Vanna: The rate at which the Delta of an option changes with respect to implied volatility.

Charm: The rate at which the Delta of an option changes with respect to time.

POCs: Areas where two-sided trade was most prevalent in a prior day session. Participants will respond to future tests of value as they offer favorable entry and exit.

MCPOCs: Denote areas where two-sided trade was most prevalent over numerous sessions. Participants will respond to future tests of value as they offer favorable entry and exit.

Options Expiration (OPEX): Reduction in dealer Gamma exposure. Often, there is an increase in volatility after the removal of large options positions and associated hedging.

Options: Options offer an efficient way to gain directional exposure.

If an option buyer was short (long) stock, he or she could buy a call (put) to hedge upside (downside) exposure. Additionally, one can spread, or buy (+) and sell (-) options together, strategically.

Commonly discussed spreads include credit, debit, ratio, back, and calendar.

  • Credit: Sell -1 option closer to the money. Buy +1 option farther out of the money.
  • Debit: Buy +1 option closer to the money. Sell -1 option farther out of the money.
  • Ratio: Buy +1 option closer to the money. Sell -2 options farther out of the money. 
  • Back: Sell -1 option closer to the money. Buy +2 options farther out of the money.
  • Calendar: Sell -1 option. Buy +1 option farther out in time, at the same strike.

Typically, if bullish (bearish), sell at-the-money put (call) credit spread and/or buy a call (put) debit/ratio spread structured around the target price. Alternatively, if the expected directional move is great (small), opt for a back spread (calendar spread). Also, if credit spread, capture 50-75% of the premium collected. If debit spread, capture 2-300% of the premium paid.

Be cognizant of risk exposure to the direction (Delta), movement (Gamma), time (Theta), and volatility (Vega). 

  • Negative (positive) Delta = synthetic short (long).
  • Negative (positive) Gamma = movement hurts (helps).
  • Negative (positive) Theta = time decay hurts (helps).
  • Negative (positive) Vega = volatility hurts (helps).

About

The author, Renato Leonard Capelj, spends the bulk of his time at Physik Invest, an entity through which he invests and publishes free daily analyses to thousands of subscribers. The analyses offer him and his subscribers a way to stay on the right side of the market. 

Separately, Capelj is an accredited journalist with past works including interviews with investor Kevin O’Leary, ARK Invest’s Catherine Wood, FTX’s Sam Bankman-Fried, North Dakota Governor Doug Burgum, Lithuania’s Minister of Economy and Innovation Aušrinė Armonaitė, former Cisco chairman and CEO John Chambers, and persons at the Clinton Global Initiative.

Connect

Direct queries to renato@physikinvest.com. Find Physik Invest on TwitterLinkedInFacebook, and Instagram. Find Capelj on TwitterLinkedIn, and Instagram. Only follow the verified profiles.

Calendar

You may view this letter’s content calendar at this link.

Disclaimer

Do not construe this newsletter as advice. All content is for informational purposes. Capelj and Physik Invest manage their own capital and will not solicit others for it.
Categories
Commentary

Daily Brief For March 2, 2023

Physik Invest’s Daily Brief is read free by thousands of subscribers. Join this community to learn about the fundamental and technical drivers of markets.

Graphic updated 6:15 AM ET. Sentiment Risk-Off if expected /MES open is below the prior day’s range. /MES levels are derived from the profile graphic at the bottom of this letter. Click here for the latest levels. SqueezeMetrics Dark Pool Index (DIX) and Gamma (GEX) with the latter calculated based on where the prior day’s reading falls with respect to the MAX and MIN of all occurrences available. A higher DIX is bullish. The lower the GEX, the more (expected) volatility. Click to learn the implications of volatility, direction, and moneyness. Breadth reflects a reading of the prior day’s NYSE Advance/Decline indicator. The CBOE VIX Volatility Index (INDEX: VVIX) reflects the attractiveness of owning volatility. UMBS prices via MNDClick here for the economic calendar.

Fundamental

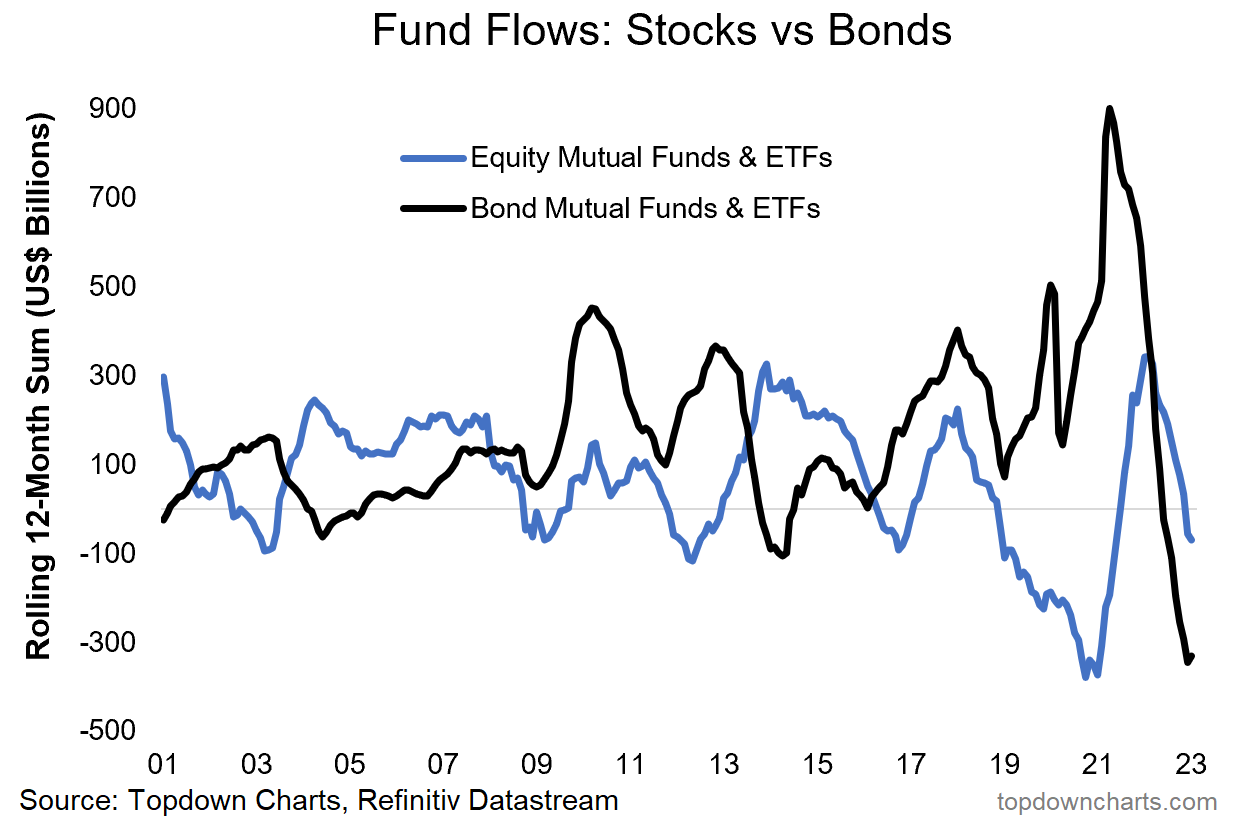
A tight monetary environment resulted in a hesitation to take risks. With inflation high, in the face of exogenous events (e.g., geopolitics disrupting deflationary influences) and beyond, assets were sold.

Graphic: Retrieved from Topdown Charts.

With inflation still hot and the economy on solid footing (i.e., “stronger growth for longer” per Unlimited’s Bruce McNevin), traders price even “tighter monetary policy and a harder eventual landing to ease inflation pressure.” This is not good for assets.

Graphic: Retrieved from Unlimited.

In fact, for a moment yesterday, traders put the terminal rate at 5.50-5.75%, up from 5.25-5.50% prior to the market opening.

Graphic: Retrieved from CME Group Inc’s (NASDAQ: CME) via The Kobeissi Letter on March 1, 2023, at 10:55 AM.

For the Federal Reserve (Fed) to hit its inflation target, likely in the range of 2-4% per Oaktree Capital Management’s Howard Marks said the real Fed Funds rate has to be positive. This effort puts the economy at risk of recession, said the Federal Reserve’s Neel Kashkari.

“Typically when the Fed raises rates to cool down inflation, it leads to a recession,” Kashkari explained, adding that “getting inflation down is job number one.”

Per Unlimited’s McNevin, the probability the economy is in a recession is lower than it was at the end of last year. For probabilities to change, there would have to be a large increase in unemployment. For instance, if the unemployment rate rises by about 1%, recession odds go up by 29%. If non-farm payroll employment falls by about 2% or 3 million jobs, recession odds jump by 74%.

Graphic: Retrieved from Unlimited.

Positioning

Per last month’s remarks by Kai Volatility’s Cem Karsan, quoted in Physik Invest’s Daily Brief for February 17, 2023, if the market was to not breakdown sharply after February monthly options expiration (OpEx), as we see today, then options decay could build a platform for a FOMO-driven call buying rally that ends in a blow-off. 

Consequently, trades this letter put forth last month (e.g., call verticals sold to finance put verticals expiring months from now) would suffer greatly.

“We’ve had an intraday range of 33.5 [points] thus far. That’s not vol[atility] expansion, which is what I’d want to see if I was short,” volatility trader Darrin John put well. “If the market doesn’t do what you think it should, in a reasonable amount of time, then it’s best to [exit].”

At the same time, with portfolio constructions like 60/40 not as attractive in this macroeconomic environment (i.e., asset headwind from monetary tightening, as well as slowing growth and inflation headwind to bonds and commodities), traders can look to Physik Invest’s Daily Brief for February 28, 2023, for ideas on how to navigate. In that letter, we talked about how traders can participate in the upside by about the same amount they would with a traditional construction (e.g., 60/40) while eliminating their downside risk exposure.

For instance, one can buy enough bonds/box spreads so that, at their maturity, the principal is returned. The cash remaining can be invested in leverage potential.

Ending with a supporting quote from Oaktree’s Howard Marks: “Investors can now potentially get solid returns from credit instruments, meaning they no longer have to rely as heavily on riskier investments to achieve their overall return targets.”

Technical

As of 6:00 AM ET, Thursday’s regular session (9:30 AM – 4:00 PM ET), in the S&P 500, is likely to open in the middle part of a negatively skewed overnight inventory, outside of the prior day’s range, suggesting a potential for immediate directional opportunity.

The S&P 500 pivot for today is $3,943.25. 

Key levels to the upside include $3,965.25, $3,975.25, and $3,988.25.

Key levels to the downside include $3,926.25, $3,908.25, and $3,891.00.

Disclaimer: Click here to load the updated key levels via the web-based TradingView platform. New links are produced daily. Quoted levels likely hold barring an exogenous development.

Graphic: 65-minute profile chart of the Micro E-mini S&P 500 Futures.

Definitions

Volume Areas: Markets will build on areas of high-volume (HVNodes). Should the market trend for a period of time, this will be identified by a low-volume area (LVNodes). The LVNodes denote directional conviction and ought to offer support on any test.

If participants auction and find acceptance in an area of a prior LVNode, then future discovery ought to be volatile and quick as participants look to the nearest HVNodes for more favorable entry or exit.

MCPOCs: Denote areas where two-sided trade was most prevalent over numerous sessions. Participants will respond to future tests of value as they offer favorable entry and exit.

POCs: Areas where two-sided trade was most prevalent in a prior day session. Participants will respond to future tests of value as they offer favorable entry and exit.

Options Expiration (OPEX): Reduction in dealer Gamma exposure. There is usually an increase in volatility after the removal of large options positions and associated hedging.


About

The author, Renato Leonard Capelj, spends the bulk of his time at Physik Invest, an entity through which he invests and publishes free daily analyses to thousands of subscribers. The analyses offer him and his subscribers a way to stay on the right side of the market. 

Separately, Capelj is an accredited journalist with past works including interviews with investor Kevin O’Leary, ARK Invest’s Catherine Wood, FTX’s Sam Bankman-Fried, North Dakota Governor Doug Burgum, Lithuania’s Minister of Economy and Innovation Aušrinė Armonaitė, former Cisco chairman and CEO John Chambers, and persons at the Clinton Global Initiative.

Connect

Direct queries to renato@physikinvest.com. Find Physik Invest on TwitterLinkedInFacebook, and Instagram. Find Capelj on TwitterLinkedIn, and Instagram. Only follow the verified profiles.

Calendar

You may view this letter’s content calendar at this link.

Disclaimer

Do not construe this newsletter as advice. All content is for informational purposes. Capelj and Physik Invest manage their own capital and will not solicit others for it.

Categories
Commentary

Daily Brief For March 1, 2023

Physik Invest’s Daily Brief is read free by thousands of subscribers. Join this community to learn about the fundamental and technical drivers of markets.

Graphic updated 9:25 AM ET. Sentiment Risk-Off if expected /MES open is below the prior day’s range. /MES levels are derived from the profile graphic at the bottom of this letter. Click here for the latest levels. SqueezeMetrics Dark Pool Index (DIX) and Gamma (GEX) with the latter calculated based on where the prior day’s reading falls with respect to the MAX and MIN of all occurrences available. A higher DIX is bullish. The lower the GEX, the more (expected) volatility. Click to learn the implications of volatility, direction, and moneyness. Breadth reflects a reading of the prior day’s NYSE Advance/Decline indicator. The CBOE VIX Volatility Index (INDEX: VVIX) reflects the attractiveness of owning volatility. UMBS prices via MNDClick here for the economic calendar.

Administrative

Pardon, the delay. Also, the levels in this letter are a little messy to the downside. Too many confluences. Will clear them up over the coming days. Have a great day!

Fundamental

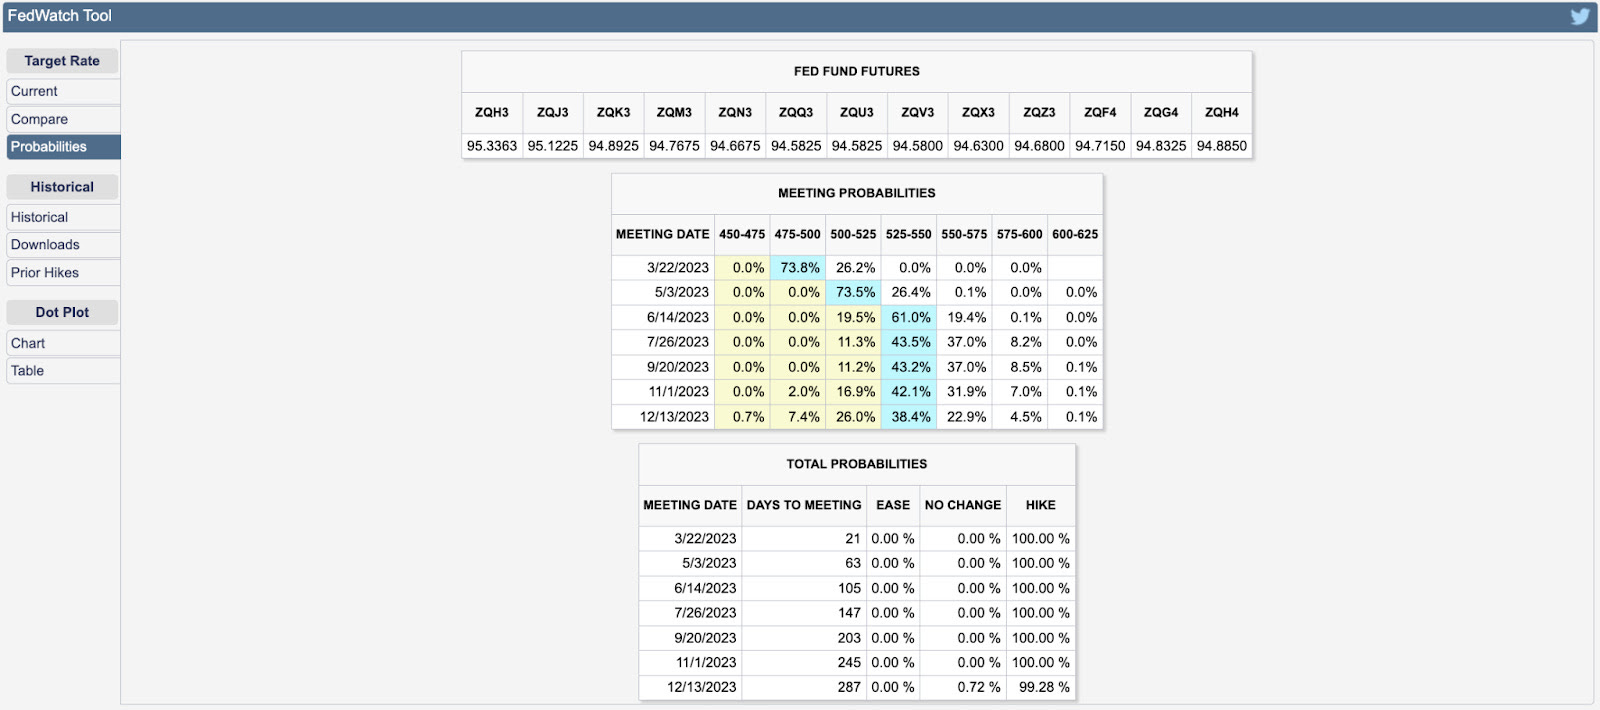
In the face of contrarian economic indications, based on CME Group Inc’s (NASDAQ: CME) FedWatch Tool, traders’ activity in the Fed Fund Futures shows the terminal rate peaking at 5.25-5.50%. Expectations for easing are pushed out to 2024, though at a less steep rate. This context, coupled with the prospects of slower economic growth, presents uninspiring realities for investors.

Graphic: Retrieved from CME Group Inc’s (NASDAQ: CME) FedWatch Tool.

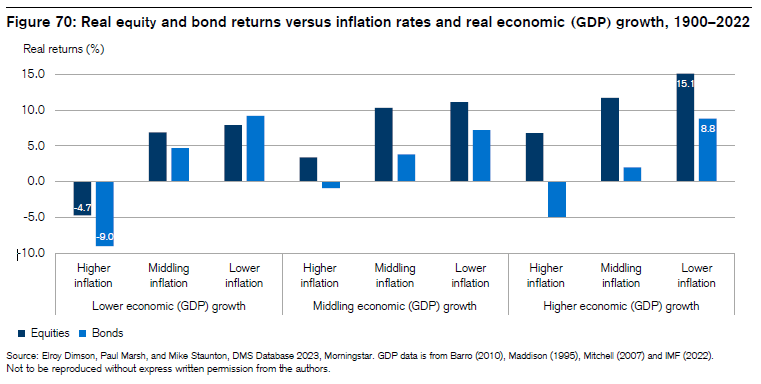
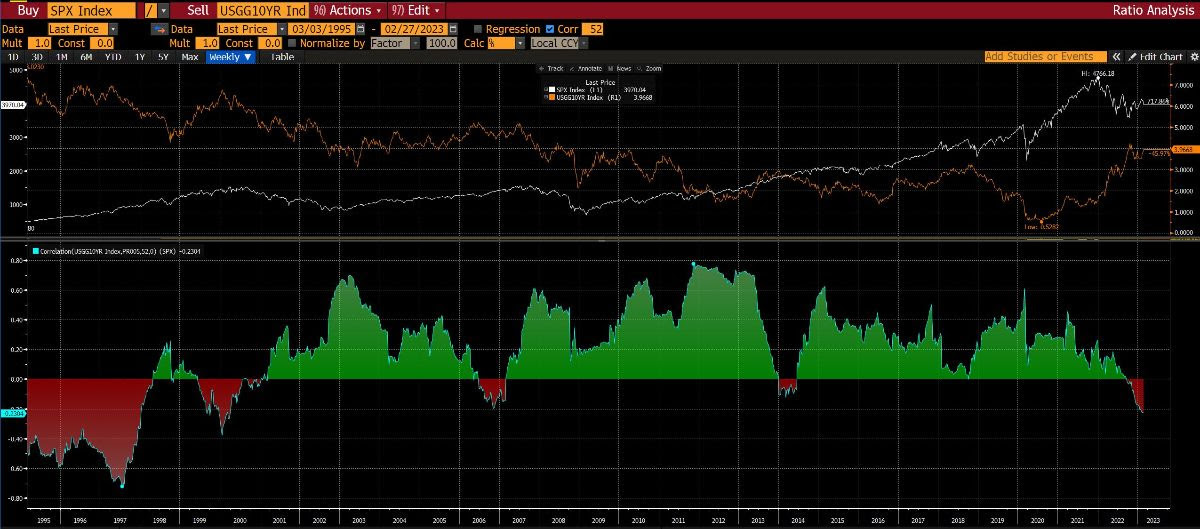
Consequently, the equity-bond correlation break is set to persist.

Graphic: Retrieved from Credit Suisse Group AG (NYSE: CS).

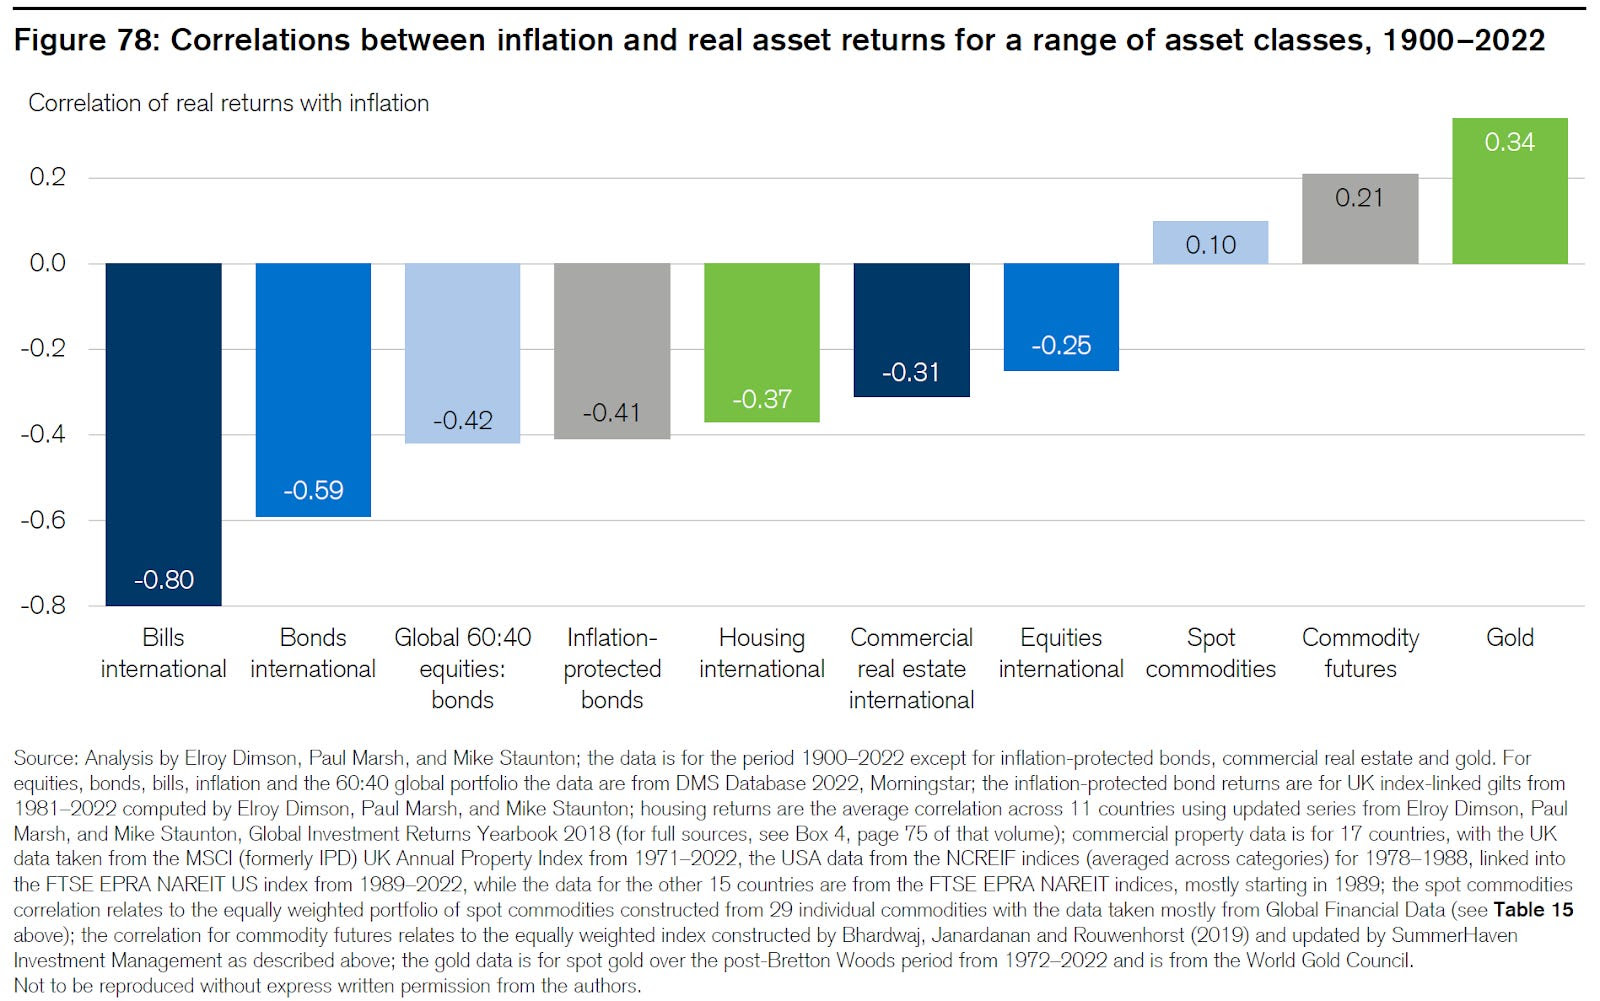
Quoting a Bloomberg analysis of Credit Suisse’s Global Investment Returns Yearbook, “[b]onds, equities and real estate tend to be negatively correlated with inflation,” while “only commodities had a positive correlation, making them the only true hedge.”

However, commodities are “often susceptible to deep and lengthy drawdowns … in periods of disinflation” and falling growth expectations. Though commodities are a hedge against inflation, they aren’t a hedge against (rising odds of) recession.

Graphic: Retrieved from Credit Suisse Group AG (NYSE: CS).

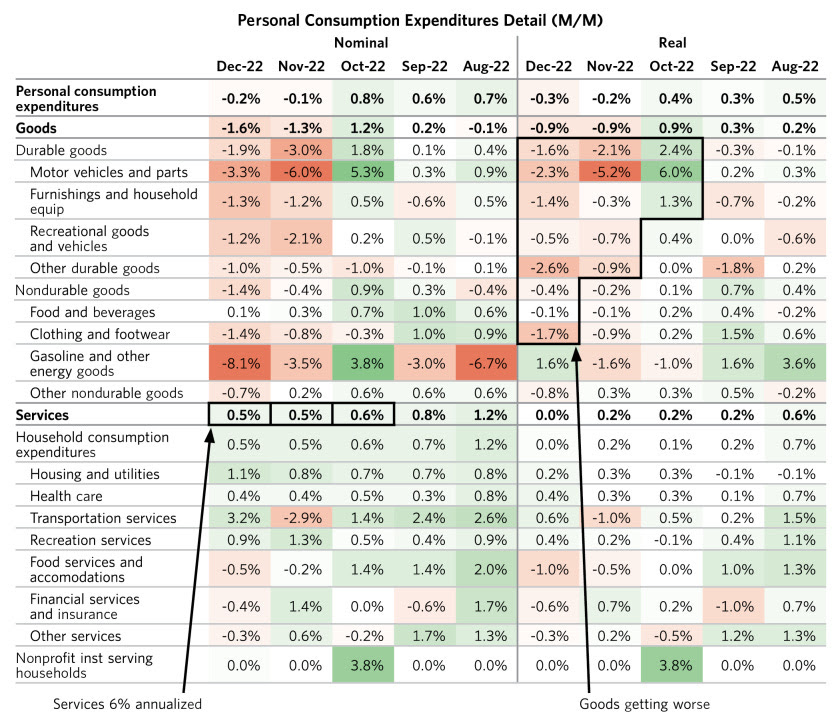
So, interest rates are likely to rise and stay higher for longer. 

Graphic: Retrieved from Bridgewater Associates LP. “Nominal spending on services has continued to grow at a rapid clip of about 6% annualized. Real and nominal demand for goods has been gradually weakening. This shift in the mix of demand has implications. Services spending is an upward pressure on employment and wages, while weak goods demand has a more pronounced impact on listed company sales.”

Equities, which are particularly sensitive to interest rates, are likely to weaken despite economic and earnings growth which is set to fall (i.e., close to zero earnings growth).

Graphic: Retrieved January 5, 2023, from Nasdaq Inc’s (NASDAQ: NDAQ) Phil Mackintosh.

Quantitative tightening or QT (i.e., the flow of capital out of capital markets and an asset headwind), which has been offset by the running off of the Treasury General Account and injecting liquidity into markets (i.e., TGA runoff increases the room banks have to lend and finance trading activities) in the face of the debt ceiling issue, is set to accelerate and compound the rising rate impact.

Graphic: Via Physik Invest. Data compiled by @jkonopas623. Fed Balance Sheet data, here. Treasury General Account Data, here. Reverse Repo data, here. NL = BS – TGA – RRP.

In light of rates and QT risk asset headwind, as well as slowing growth and inflation headwind to bonds and commodities, how does one protect their portfolio? As The Ambrus Group’s Kris Sidial explains, “[e]ven if inflation continues, the rate at which it rises won’t be the same. Due to this, CTA exposures likely will not perform as well as they did in 2022, and that’s why you may see more opportunities in the volatility space … [where] we can get cheap exposure to convexity.”

Graphic: Retrieved from Bloomberg via Tier1Alpha. “[T]he correlation between bond yields and equities, has begun to turn higher from a negative level. Remember that a negative correlation between bond yields and equity prices means equities go lower as bond prices go lower, defeating the historical diversification benefits of a 60/40-type portfolio.  Historically, this rotation has been associated with a period of LOWER returns, but it’s important to emphasize that this is because these periods are associated with Fed-induced slowdowns. Whether 2023 follows the same pattern remains to be seen.”

Please refer to past letters for trade examples. Though such trades may not be as attractive to enter now, they are attractive to keep on for longer.

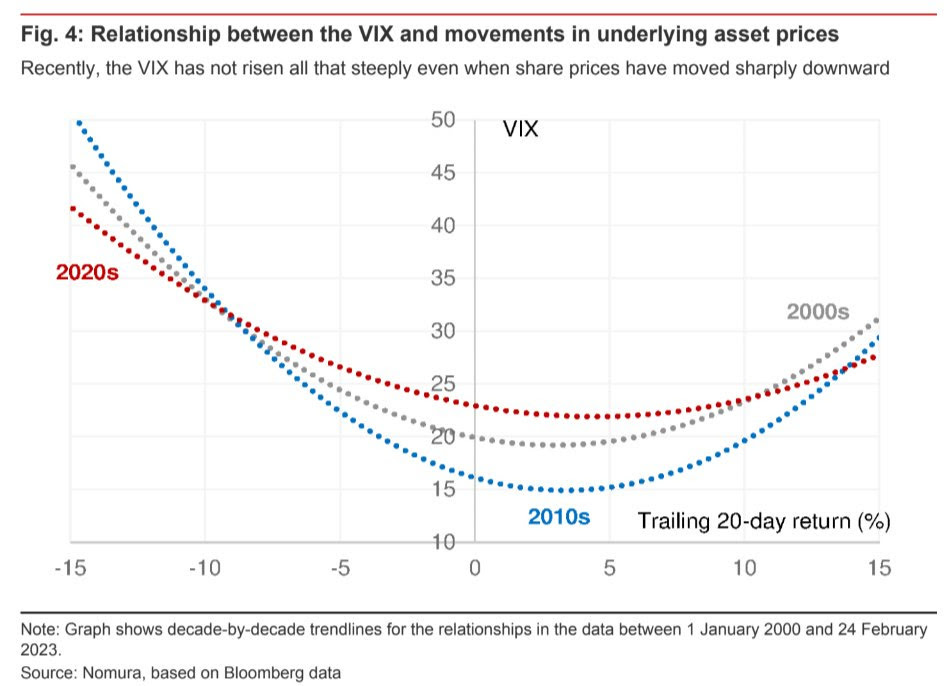
Graphic: Retrieved from Nomura Holdings Inc (NYSE: NMR). Downside trades are rather attractive now in the absence of hedging demands in longer-dated protection convex in price and volatility. Naive measures like the Cboe VIX Volatility (INDEX: VVIX), as well as the graphic above, allude to the little demands for convexity and a declining sensitivity of the VIX with respect to changes in share prices.

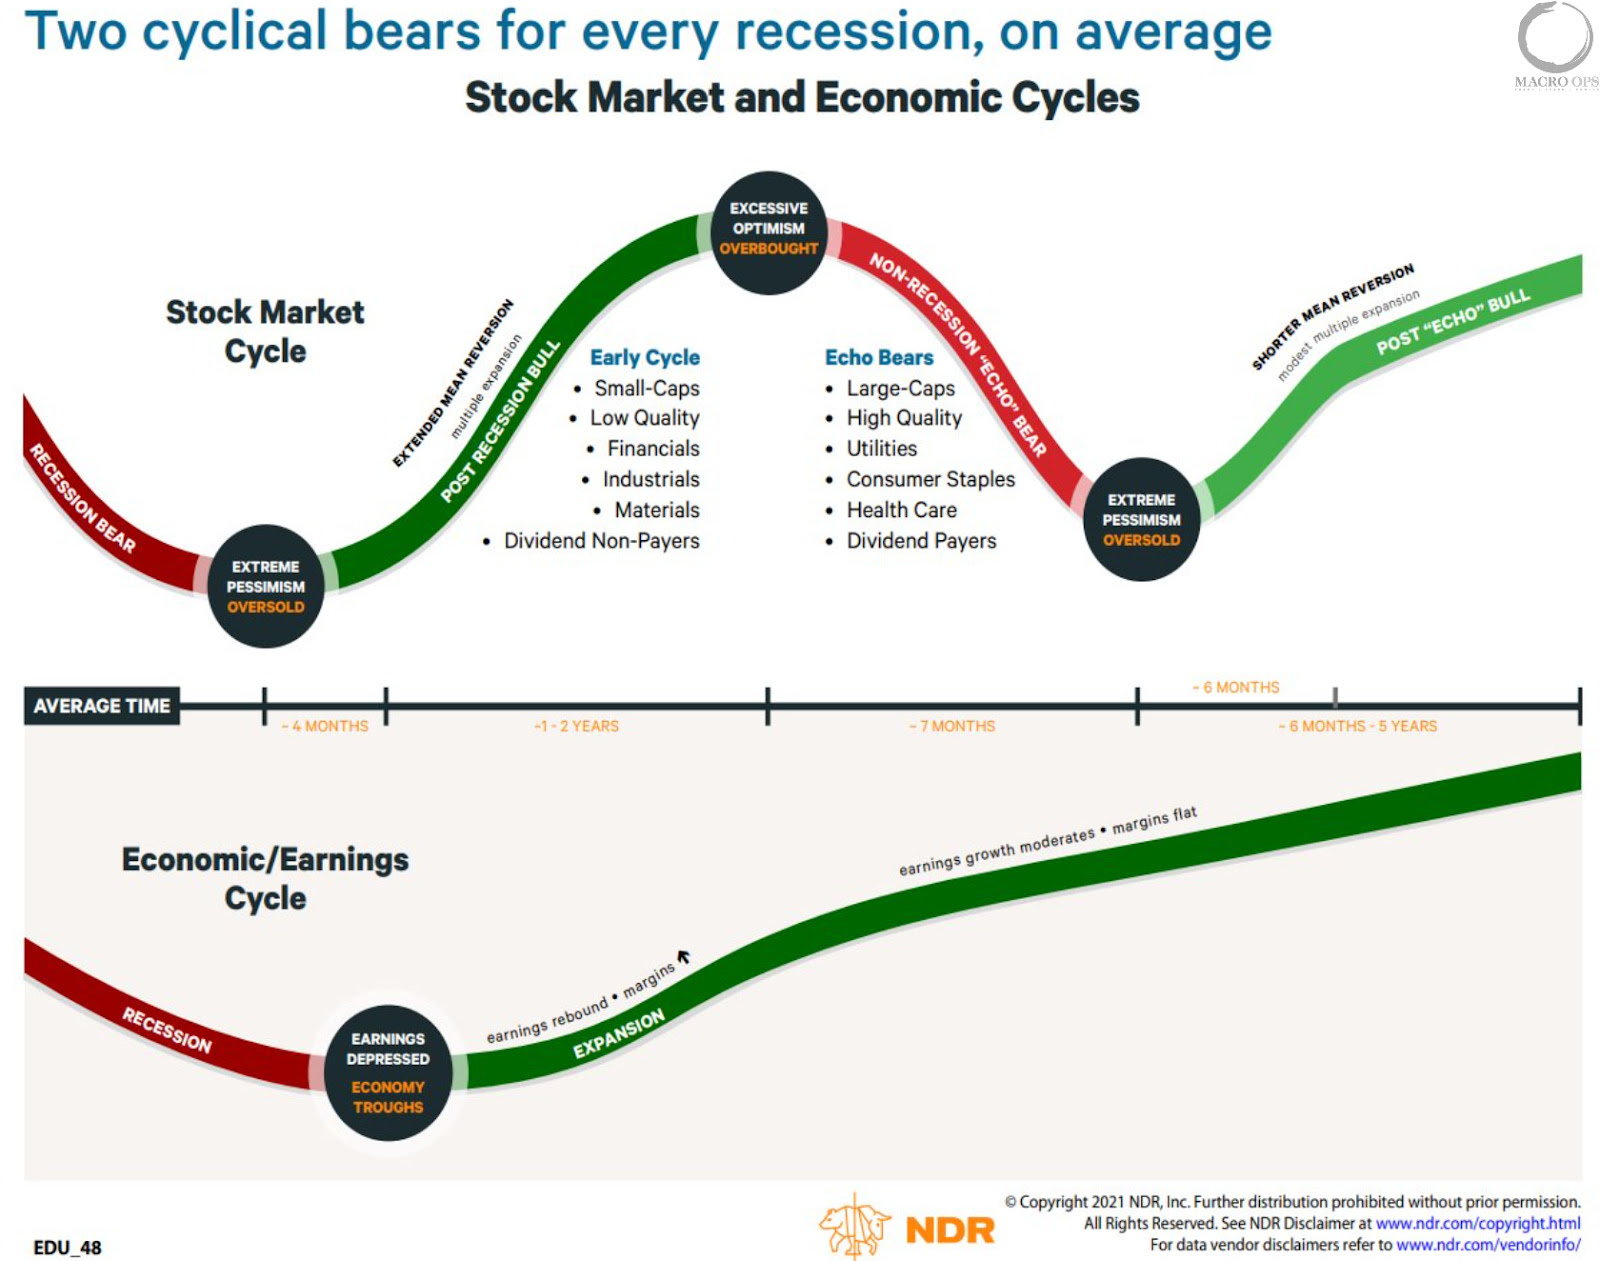
If, as Bridgewater Associates put it, there is another stage to tightening “marked either by an economic downturn or failure to meet the inflation target, prompting more tightening,” risk assets will perform poorly and this letter’s trade examples are likely to protect portfolios well until assets appear attractive enough to buy again.

Graphic: Retrieved from NDR via Macro Ops.

Positioning

SpotGamma explains that more of the same (i.e., back-and-forth consolidation and a grind higher or lower) can be expected until some macroeconomic catalysts solicit demand for upside or downside protection and, accordingly, counterparty hedging pressures catalyze a far-reaching movement. 

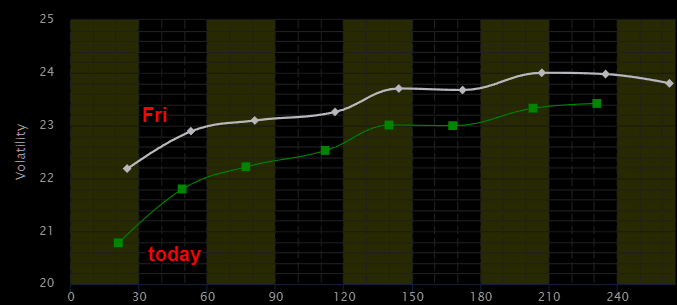
As an aside, “With IV at already low levels, the bullish impact of it falling further is weak, hence the SPX trending lower all the while IV measures (e.g., VIX term structure) have shifted markedly lower since last week. If IV was at a higher starting point, its falling would work to keep the market in a far more positive/bullish stance.”

Graphic: VIX Term Structure retrieved from VIX Central via The Market Ear.

Consequently, “if traders enter the market and demand protection, particularly that which is farther-dated, the bearish effect of rising IV will far outweigh the bullish effect of it falling. This will add to the underlying/fundamental pressure we see building via weak price action.”

Technical

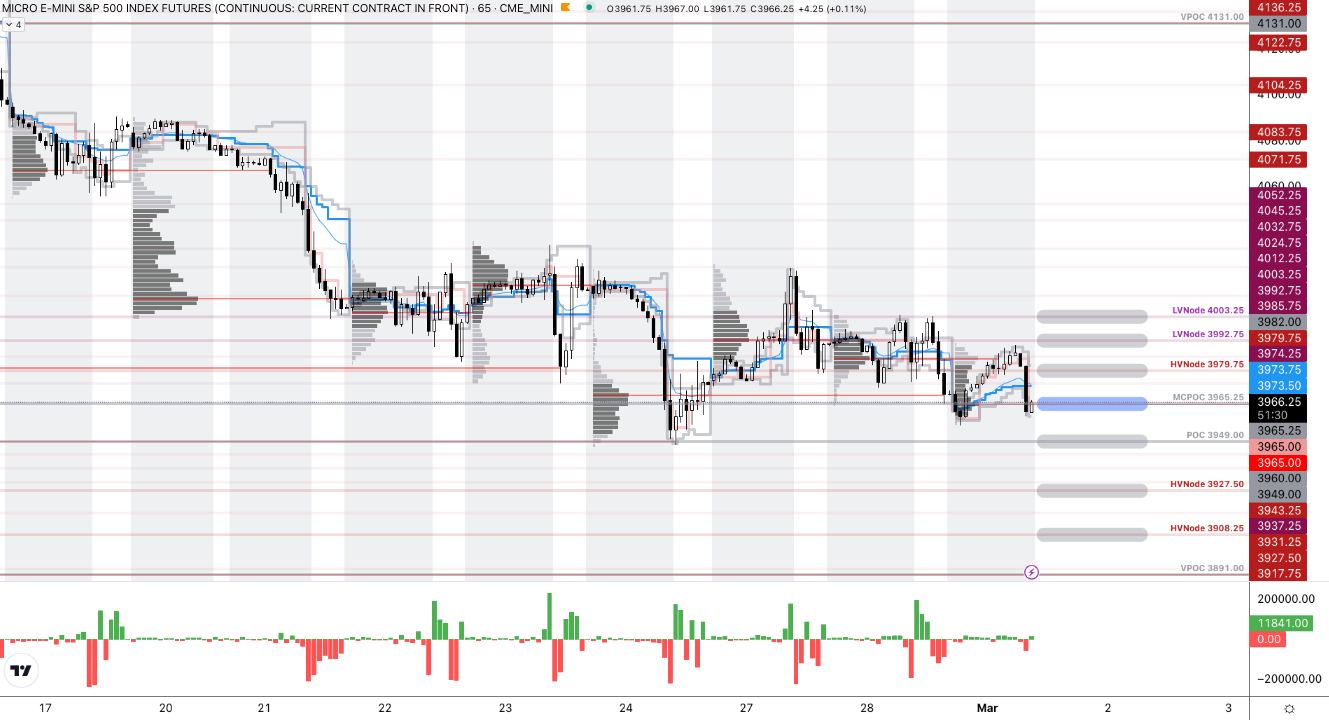
As of 9:20 AM ET, Wednesday’s regular session (9:30 AM – 4:00 PM ET), in the S&P 500, is likely to open in the lower part of a positively skewed overnight inventory, outside of the prior day’s range, suggesting a potential for immediate directional opportunity.

The S&P 500 pivot for today is $3,965.25. 

Key levels to the upside include $3,979.75, $3,992.75, and $4,003.25.

Key levels to the downside include $3,949.00, $3,927.50, and $3,908.25.

Disclaimer: Click here to load the updated key levels via the web-based TradingView platform. New links are produced daily. Quoted levels likely hold barring an exogenous development.

Graphic: 65-minute profile chart of the Micro E-mini S&P 500 Futures.

Definitions

Volume Areas: Markets will build on areas of high-volume (HVNodes). Should the market trend for a period of time, this will be identified by a low-volume area (LVNodes). The LVNodes denote directional conviction and ought to offer support on any test.

If participants auction and find acceptance in an area of a prior LVNode, then future discovery ought to be volatile and quick as participants look to the nearest HVNodes for more favorable entry or exit.

POCs: Areas where two-sided trade was most prevalent in a prior day session. Participants will respond to future tests of value as they offer favorable entry and exit.

MCPOCs: Denote areas where two-sided trade was most prevalent over numerous sessions. Participants will respond to future tests of value as they offer favorable entry and exit.


About

The author, Renato Leonard Capelj, works in finance and journalism.

Capelj spends the bulk of his time at Physik Invest, an entity through which he invests and publishes free daily analyses to thousands of subscribers. The analyses offer him and his subscribers a way to stay on the right side of the market. Separately, Capelj is an options analyst at SpotGamma and an accredited journalist.

Capelj’s past works include conversations with investor Kevin O’Leary, ARK Invest’s Catherine Wood, FTX’s Sam Bankman-Fried, North Dakota Governor Doug Burgum, Lithuania’s Minister of Economy and Innovation Aušrinė Armonaitė, former Cisco chairman and CEO John Chambers, and persons at the Clinton Global Initiative.

Connect

Direct queries to renato@physikinvest.com. Find Physik Invest on TwitterLinkedInFacebook, and Instagram. Find Capelj on TwitterLinkedIn, and Instagram. Only follow the verified profiles.

Calendar

You may view this letter’s content calendar at this link.

Disclaimer

Do not construe this newsletter as advice. All content is for informational purposes. Capelj and Physik Invest manage their own capital and will not solicit others for it.
Categories
Commentary

Daily Brief For February 14, 2023

Physik Invest’s Daily Brief is read by thousands of subscribers. You, too, can join this community to learn about the fundamental and technical drivers of markets.

Graphic updated 8:05 AM ET. Sentiment Risk-On if expected /ES open is above the prior day’s range. Click here for the latest levels. SqueezeMetrics Dark Pool Index (DIX) and Gamma (GEX) with the latter calculated based on where the prior day’s reading falls with respect to the MAX and MIN of all occurrences available. A higher DIX is bullish. At the same time, the lower the GEX, the more (expected) volatility. Click to learn the implications of volatility, direction, and moneyness. Breadth reflects a reading of the prior day’s NYSE Advance/Decline indicator. The CBOE VIX Volatility Index (INDEX: VVIX) reflects the attractiveness of owning volatility. UMBS price via MNDClick here for the calendar.

Fundamental

Companies are slowing price increases, 

The Transcript, quoting earnings calls, shared with subscribers. Notwithstanding, consumer spending still reads strong. Mastercard Inc (NYSE: MA) measured ~9% growth in spending last month, and this points to the presence of inflation in the system that needs to be worked out. 

Consequently, Federal Reserve (Fed) officials maintain that “more needs to be done”, and this is evident in traders’ guesses as to where rates peak (i.e., terminal rate), and when the eventual reduction in rates is set to occur (i.e., easing). 

The free CME Group Inc (NASDAQ: CME) FedWatch Tool shows rates peaking in the 5.00-5.25% range through November. Then, in December, traders price a move back to the 4.75-5.00% range where we are now.

Graphic: Retrieved from CME Group Inc’s (NASDAQ: CME) Fedwatch Tool.

This is the pricing is in anticipation of rising consumer prices; the Consumer Price Index (CPI) due at 8:30 AM ET, is set to rise 0.5% in January, the most in a few months. Core CPI, which matters a lot to the Fed, is set to advance by about 0.4%.

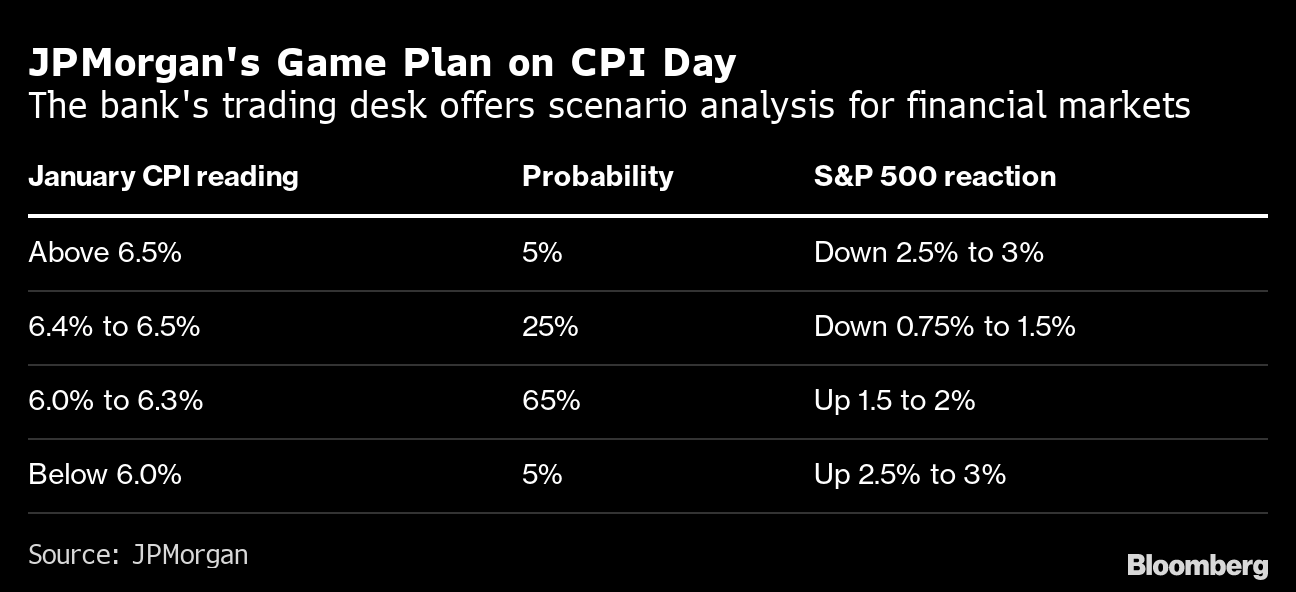
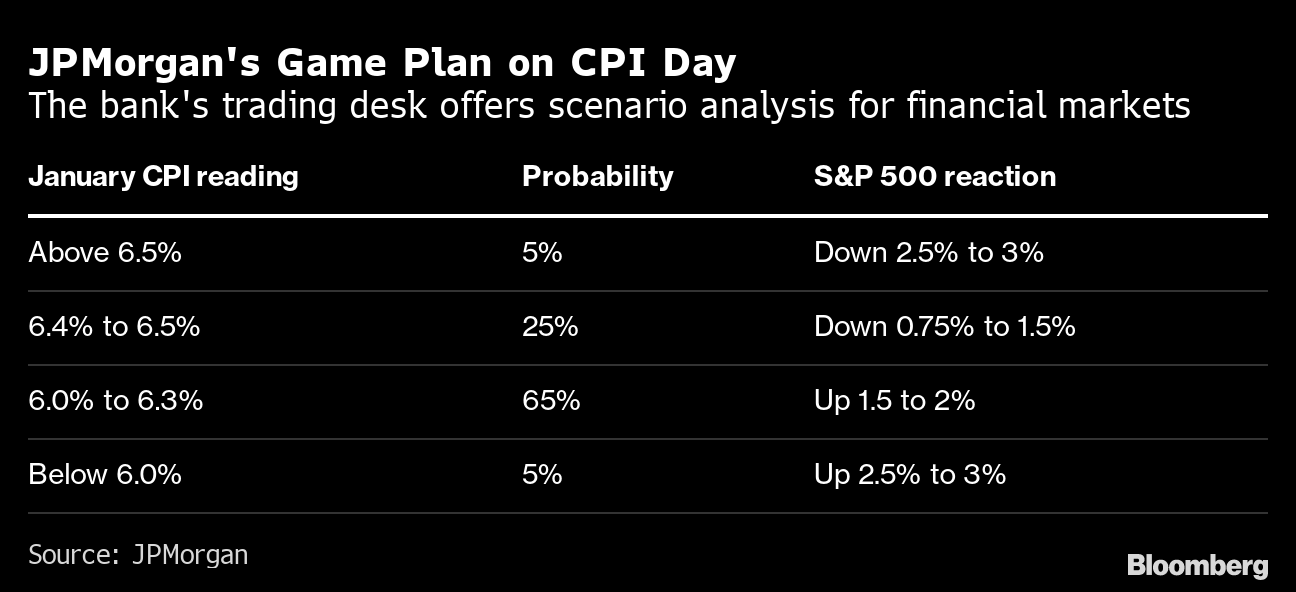
JPMorgan Chase & Co (NYSE: JPM) thinks that “data close to estimates would be treated as confirming a continued cooling in inflation, which would imply a fall for bond yields and the dollar, while tech shares would lead an advance for US stocks.”

But, any equity gains are likely to fade, [JPM] warned, ‘once investors shift attention to a relatively slower pace of disinflation than the previous two months, where each CPI print saw a decrease of 60 basis points.’”

Graphic: Retrieved from Bloomberg.

So in-line CPI, coupled with a strong January jobs report, will “corroborate recent comments from Fed officials that further interest-rate hikes are likely forthcoming,” Bloomberg adds. In a post by Joseph Wang, a former Fed trader, “a higher interest rate environment implies a more potent [quantiative tightening or] QT.”

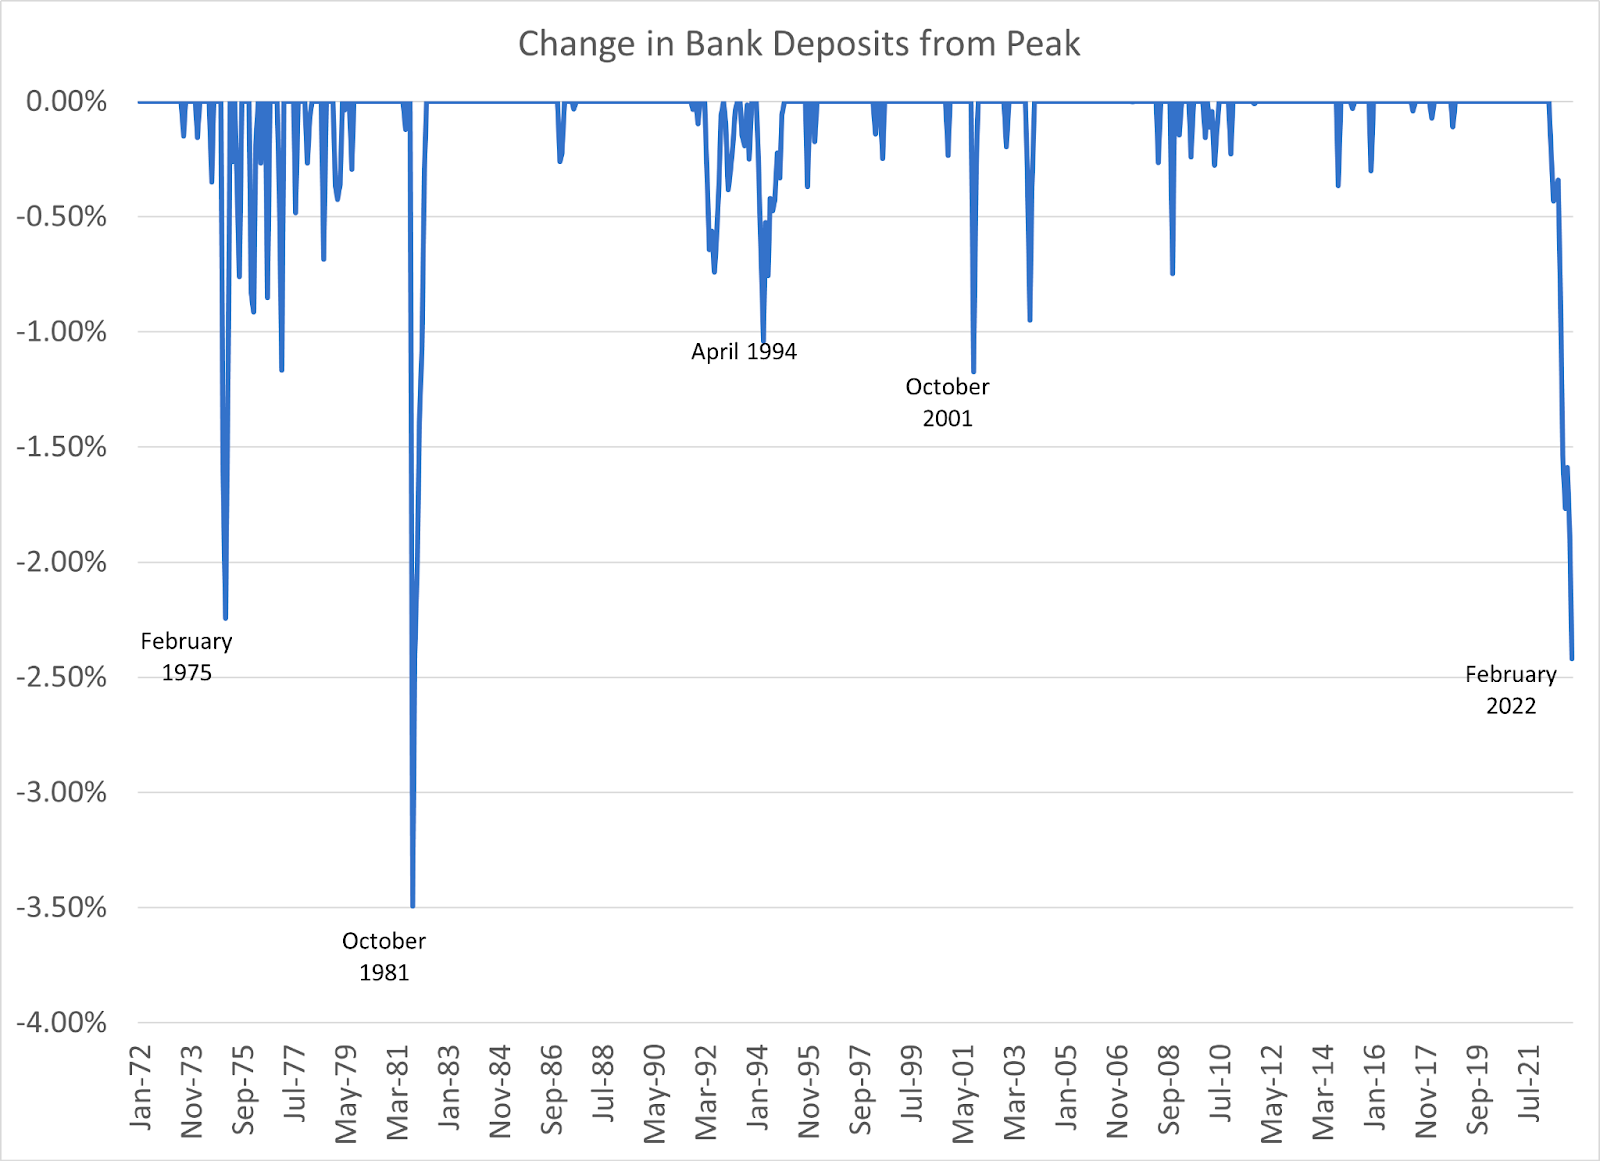
“The Fed’s aggressive hikes have yet to reach the bulk of bank deposits, which is the foundational financial asset for many households. These deeply negative real yields may be extending the portfolio rebalancing impact of QE. Some households have escaped financial repression by moving into Treasury bills or money market funds, but that is not the only refuge. The perceived return of risk assets likely remains high for many, as the memory of the 2021 boom is still fresh.” Further, a “sizable yield upgrade being forced onto the market may indicate a more impactful QT.”

QT, to put it simply, is the flow of capital out of capital markets. Higher rates for longer and more QT are not good for risk assets. Though money is flowing from other parts of the world, which, in part, has bolstered buying of assets over the past months, accelerating “QT shifts the composition of financial assets towards those that better reflect the Fed’s restrictive stance.”

Positioning

In the post-CPI expirations, implied volatility (IVOL), a demonstration of traders’ fears and demands for protection, is wound and is likely to serve as a catalyst for a fast move after CPI. Should fears be assuaged (i.e., barring the unexpected), wound volatility is likely to compress and this may result in a short-term market boost.

However, the sale and expiry of protection, after CPI and particularly the coming options expiration (OpEx), is likely to put the market in a precarious position.

According to SpotGamma, “current positioning, a result of re-grossing over the past weeks and months, has boosted dealer exposure to positive gamma.” This means counterparties (i.e., dealers) make money when the market moves and hedge in a manner that reduces volatility, “hence more rangebound trade as we have seen.”

Following OpEx, counterparty exposure to positive gamma will decline and “leave markets more at the whim of macro-type repositioning” which counterparties will do less to disrupt and more to bolster (i.e., add to movement).

Therefore, as SpotGamma summarizes, “[b]e prepared for potential relief immediately after CPI. However, across a longer time horizon, there is potential for weakness and that weakness may be exacerbated by dealer hedging.”

Technical

As of 7:15 AM ET, Tuesday’s regular session (9:30 AM – 4:00 PM ET), in the S&P 500, is likely to open in the upper part of a balanced overnight inventory, outside of the prior day’s range, suggesting a potential for immediate directional opportunity.

The S&P 500 pivot for today is $4,159.00. 

Key levels to the upside include $4,168.75, $4,189.00, and $4,202.75.

Key levels to the downside include $4,137.00, $4,123.25, and $4,100.25.

Disclaimer: Click here to load the updated key levels via the web-based TradingView platform. New links are produced daily. Quoted levels likely hold barring an exogenous development.

Graphic: 65-minute profile chart of the Micro E-mini S&P 500 Futures.

Definitions

Volume Areas: Markets will build on areas of high-volume (HVNodes). Should the market trend for a period of time, this will be identified by a low-volume area (LVNodes). The LVNodes denote directional conviction and ought to offer support on any test.

If participants auction and find acceptance in an area of a prior LVNode, then future discovery ought to be volatile and quick as participants look to the nearest HVNodes for more favorable entry or exit.
POCs: Areas where two-sided trade was most prevalent in a prior day session. Participants will respond to future tests of value as they offer favorable entry and exit.

About

The author, Renato Leonard Capelj, works in finance and journalism.
Capelj spends the bulk of his time at Physik Invest, an entity through which he invests and publishes free daily analyses to thousands of subscribers. The analyses offer him and his subscribers a way to stay on the right side of the market. Separately, Capelj is an options analyst at SpotGamma and an accredited journalist.

Capelj’s past works include conversations with investor Kevin O’Leary, ARK Invest’s Catherine Wood, FTX’s Sam Bankman-Fried, Lithuania’s Minister of Economy and Innovation Aušrinė Armonaitė, former Cisco chairman and CEO John Chambers, and persons at the Clinton Global Initiative.

Connect

Direct queries to renato@physikinvest.com or find Physik Invest on TwitterLinkedInFacebook, and Instagram.

Calendar

You may view this letter’s content calendar at this link.

Disclaimer

Do not construe this newsletter as advice. All content is for informational purposes.

Categories
Commentary

Daily Brief For January 27, 2023

Physik Invest’s Daily Brief is read by thousands of subscribers. You, too, can join this community to learn about the fundamental and technical drivers of markets.

Graphic updated 7:15 AM ET. Sentiment Neutral if expected /ES open is inside of the prior day’s range. /ES levels are derived from the profile graphic at the bottom of this letter. Click here for the latest levels. SqueezeMetrics Dark Pool Index (DIX) and Gamma (GEX) with the latter calculated based on where the prior day’s reading falls with respect to the MAX and MIN of all occurrences available. A higher DIX is bullish. At the same time, the lower the GEX, the more (expected) volatility. Click to learn the implications of volatility, direction, and moneyness. Breadth reflects a reading of the prior day’s NYSE Advance/Decline indicator. The CBOE VIX Volatility Index (INDEX: VVIX) reflects the attractiveness of owning volatility.

Week Recap

Monday’s newsletter was the first in-depth commentary on markets since the letter writer left on some travel. Discussed were recession expectations and traders’ bets on a policy reversal. The expectations of policy pivots and liquidity additions “due to the debt ceiling”, as well as the big monthly options expiration (OpEx) this January, manifested green shoots that likely do not last.

To be able to participate in the market’s upside (and take advantage of the S&P 500 and Cboe Volatility Index up environment) with limited downside, this letter offered some example trades that looked attractive.

Call structures with long options closer to the money and short options farther from the money (to lower the cost of the spread) have worked well, this letter explained.

February is likely to kick off with an interest rate hike. Traders are pricing the pace of rate hikes to slow, however. We’ll unpack this and more next week. Take care!

Graphic: Retrieved from CME Group Inc’s (NASDAQ: CME) FedWatch Tool.

Technical

As of 7:00 AM ET, Friday’s regular session (9:30 AM – 4:00 PM ET), in the S&P 500, is likely to open in the upper part of a balanced overnight inventory, inside of the prior range, suggesting a limited potential for immediate directional opportunity.

The S&P 500 pivot for today is $4,061.75. 

Key levels to the upside include $4,100.25, $4,083.75, and $4,071.50.

Key levels to the downside include $4,049.00, $4,028.75, and $4,011.75.

Disclaimer: Click here to load the updated key levels via the web-based TradingView platform. New links are produced daily. Quoted levels hold weight barring an exogenous development.

Graphic: 65-minute profile chart of the Micro E-mini S&P 500 Futures.

Definitions

Volume Areas: Markets will build on areas of high-volume (HVNodes). Should the market trend for a period of time, this will be identified by a low-volume area (LVNodes). The LVNodes denote directional conviction and ought to offer support on any test.

If participants auction and find acceptance in an area of a prior LVNode, then future discovery ought to be volatile and quick as participants look to the nearest HVNodes for more favorable entry or exit.

POCs: Areas where two-sided trade was most prevalent in a prior day session. Participants will respond to future tests of value as they offer favorable entry and exit.

About

In short, Renato Leonard Capelj is an economics graduate working in finance and journalism.
Capelj spends most of his time as the founder of Physik Invest through which he invests and publishes daily analyses to subscribers, some of whom represent well-known institutions.

Separately, Capelj is an equity options analyst at SpotGamma and an accredited journalist interviewing global leaders in business, government, and finance.

Past works include conversations with investor Kevin O’Leary, ARK Invest’s Catherine Wood, FTX’s Sam Bankman-Fried, Lithuania’s Minister of Economy and Innovation Aušrinė Armonaitė, former Cisco chairman and CEO John Chambers, and persons at the Clinton Global Initiative.

Contact

Direct queries to renato@physikinvest.com or Renato Capelj#8625 on Discord.

Calendar

You may view this letter’s content calendar at this link.

Disclaimer

Do not construe this newsletter as advice. All content is for informational purposes.

Categories
Commentary

Daily Brief For January 13, 2023

Physik Invest’s Daily Brief is read by thousands of subscribers. You, too, can join this community to learn about the fundamental and technical drivers of markets.

Graphic updated 7:00 AM ET. Sentiment Neutral if expected /ES open is inside of the prior day’s range. /ES levels are derived from the profile graphic at the bottom of this letter. Levels may have changed since initially quoted; click here for the latest levels. SqueezeMetrics Dark Pool Index (DIX) and Gamma (GEX) with the latter calculated based on where the prior day’s reading falls with respect to the MAX and MIN of all occurrences available. A higher DIX is bullish. At the same time, the lower the GEX, the more (expected) volatility. Click to learn the implications of volatility, direction, and moneyness. Breadth reflects a reading of the prior day’s NYSE Advance/Decline indicator. The CBOE VIX Volatility Index (INDEX: VVIX) measure reflects the total attractiveness of owning volatility.

Administrative

A bit late as your letter writer is getting ready to travel. Sorry and have a great Friday!

Fundamental

Thursday’s inflation update was as expected.

The Consumer Price Index (CPI) saw a 6.5% rise year-over-year (YoY) and a 0.1% fall month-over-month (MoM). Core CPI was +5.7% YoY and +0.3% MoM. 

In his post-CPI analysis, Andreas Steno Larsen said inflation has mostly disappeared, and, if we cut shelter costs, which are outdated, “deflation on a quarterly and monthly basis is here.”

Graphic: Retrieved from Andreas Steno Larsen.

The Federal Reserve’s (Fed) “favored statistical measures for underlying inflationary pressure all confirm a decline,” added Bloomberg’s John Authers.

Prices are beginning to behave more as central bankers would wish,” paving the way to a downshift in tightening, as is priced by the markets. Using the CME Group Inc’s (NASDAQ: CME) FedWatch Tool, traders were split, and the odds of a 25 or 50 basis point hike were more even prior to CPI.

The odds are now skewed toward a 25 basis point hike.

Graphic: Retrieved from CME Group Inc’s (NASDAQ: CME) FedWatch Tool. Depending on the measure, rates are seen peaking between 4.9% and 5.10%.

Despite the odds of a less aggressive hike – yields falling and swaps suggesting the Fed could skip a hike in March – and the impact that has on valuing businesses (e.g., firm profits worth less at higher interest rates hence the de-rate of 2022), the data suggests that “inflation spikes have never been vanquished until the federal funds rate exceeds the inflation rate,” and, with the return in deflation, Steno Larsen said, the outlook for stocks remains poor.

“Remember that the PPI (and the CPI for that matter) is a leading indicator for EPS.” Consequently, “we are in for negative EPS.”

If you’re not an active trader and unable to participate in both the up- and down-side of markets, then you may capitalize on higher interest rates with Treasury bills or Box Spreads, which allow you to create loan structures similar to a Treasury bill. Upon the spread’s maturity, it settles and earns a competitive interest rate.

Graphic: Retrieved from boxtrades.com.

If you’re an active trader, as I said to one subscriber privately, “the more depressed technology names to the upside for debits [were] attractive” (i.e., buying call option structures in the likes of Tesla and Amazon).

This is while put structures you may monetize in case of a large repricing in volatility have kept their values well amid what appears to be a shift higher in the skew; in the past days, we talked about measures including the Cboe VIX Volatility (INDEX: VVIX) printing at historic levels.

Graphic: Updated January 12, 2023. S&P 500 (INDEX: SPX) volatility skew retrieved from Interactive Brokers Group Inc’s (NASDAQ: IBKR) Trader Workstation.

Measures like the VVIX suggests “we can get cheap exposure to convexity while a lot of people are worried,” as The Ambrus Group’s Kris Sidial said in one article. Though volatility can be bimodal (i.e., stay low for longer for lack of better phrasing), from a “risk-to-reward perspective, … it’s a better bet to be on the long volatility side,” given “that there are so many things that … keep popping up” from a macro perspective.

Graphic: Cboe VIX Volatility (INDEX: VVIX) via TradingView.

Technical

As of 7:00 AM ET, Friday’s regular session (9:30 AM – 4:00 PM ET), in the S&P 500, is likely to open in the lower part of a negatively skewed overnight inventory, inside of prior-range and -value, suggesting a limited potential for immediate directional opportunity.

Our S&P 500 pivot for today is $3,988.25 HVNode. 

Key levels to the upside include $4,000.25, $4,011.75, and $4,028.75.

Key levels to the downside include $3,979.75, $3,959.00, and $3,943.25.

Click here to load today’s key levels into the web-based TradingView platform. All levels are derived using the 65-minute timeframe. New links are produced, daily. 

As a disclaimer, the S&P 500 could trade beyond the levels quoted in the letter. Therefore, you should load the above link on your browser for more relevant levels.

Graphic: 65-minute profile chart of the Micro E-mini S&P 500 Futures.

Definitions

Volume Areas: Markets will build on areas of high-volume (HVNodes). Should the market trend for long periods of time, it will be identified by low-volume areas (LVNodes). LVNodes denote directional conviction and ought to offer support on any test.

If participants auction and find acceptance in an area of a prior LVNode, then future discovery ought to be volatile and quick as participants look to HVNodes for favorable entry or exit.

POCs: Denote areas where two-sided trade was most prevalent in a prior day session. Participants will respond to future tests of value as they offer favorable entry and exit.

MCPOCs: Denote areas where two-sided trade was most prevalent over numerous sessions. Participants will respond to future tests of value as they offer favorable entry and exit.


About

In short, an economics graduate working in finance and journalism.

Capelj spends most of his time as the founder of Physik Invest through which he invests and publishes daily analyses to subscribers, some of whom represent well-known institutions.

Separately, Capelj is an equity options analyst at SpotGamma and an accredited journalist interviewing global leaders in business, government, and finance.

Past works include conversations with investor Kevin O’Leary, ARK Invest’s Catherine Wood, FTX’s Sam Bankman-Fried, Lithuania’s Minister of Economy and Innovation Aušrinė Armonaitė, former Cisco chairman and CEO John Chambers, and persons at the Clinton Global Initiative.

Contact

Direct queries to renato@physikinvest.com or Renato Capelj#8625 on Discord.

Calendar

You may view this letter’s content calendar at this link.

Disclaimer

Do not construe this newsletter as advice. All content is for informational purposes.