
Intrigued about what moves markets and economies and how that can impact your financial wellness? Subscribe to this free newsletter below!
Administrative
Keeping it brief for today. Enjoy your Friday. Be opportunistic and watch your risk.
Positioning
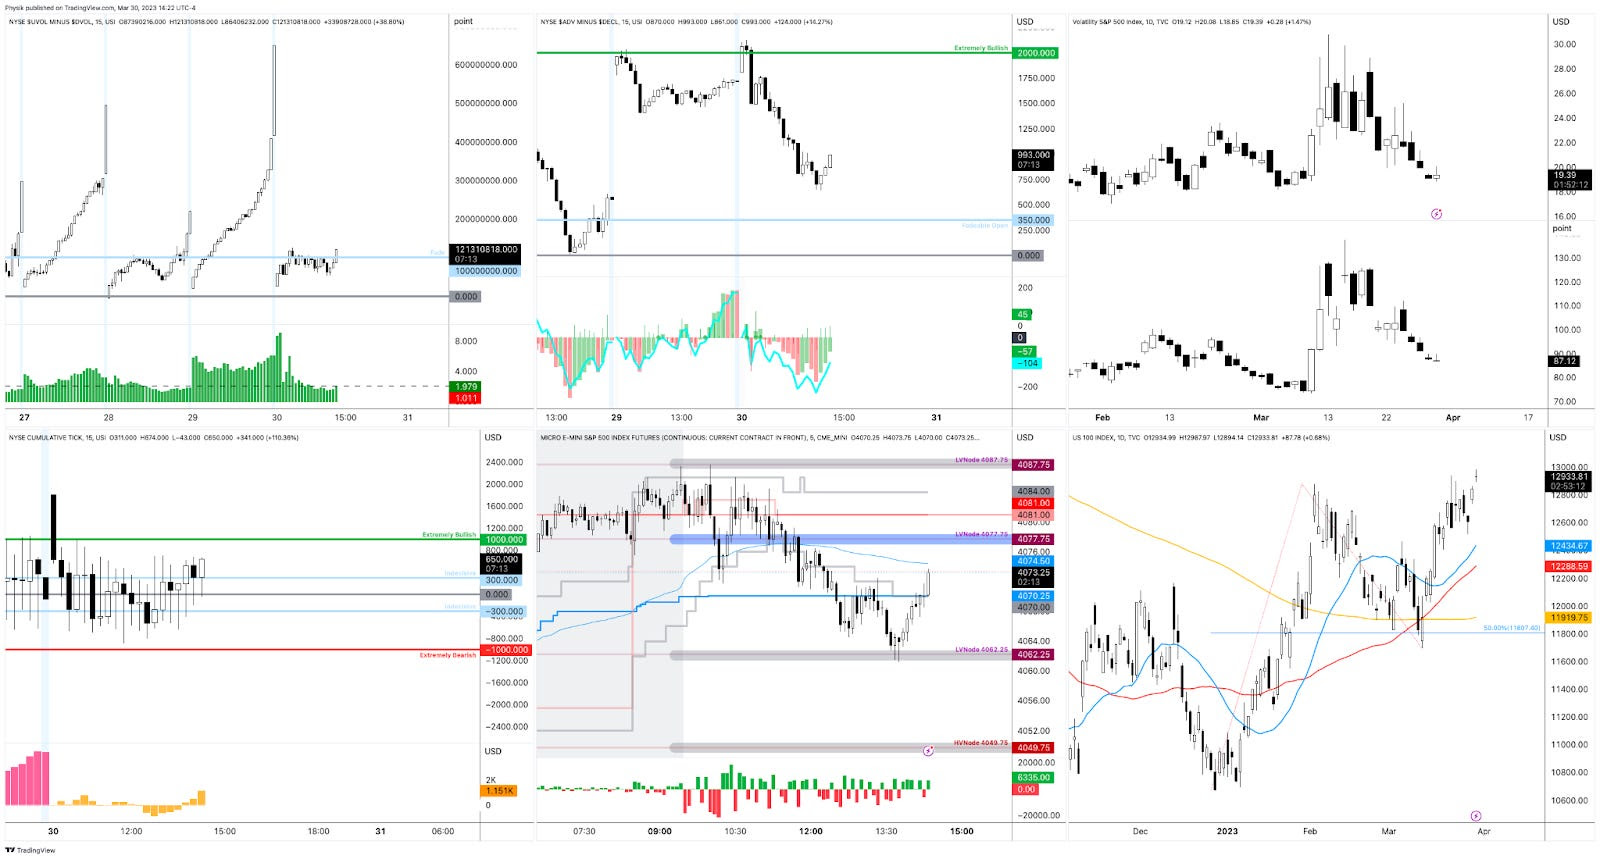
For days prior, top-line measures of implied volatility or IVOL like the Cboe Volatility Index (INDEX: VIX) fell, as did the Cboe VIX Volatility Index (INDEX: VVIX), the latter which is a way to gauge the expensiveness of IVOL or convexity. It was, in part, the resolution of a recent liquidity crisis that prompted this to happen. Under the hood, volatility skew told a different story; traders were hedging against tail outcomes.

Even so, this hedging and volatility skew behavior did little to boost the pricing of most spread structures above and below the market we analyzed. The non-stickiness of IVOL into this rally may have been detrimental to the more expensive call options structures, as we expected; hence, our consistent belief that structures should be kept at low- or no-cost.
The environment changed yesterday, however. Both top- and bottom-line measures of IVOL were sticky into equity market strength. This was observed via the pricing of spread structures (e.g., verticals and back- and ratio-spreads) structured above and below the market. The stickiness of volatility seemed to impact most the put side of the market. Some savvy traders may have been able to build spread structures below the market at a lesser cost potentially.
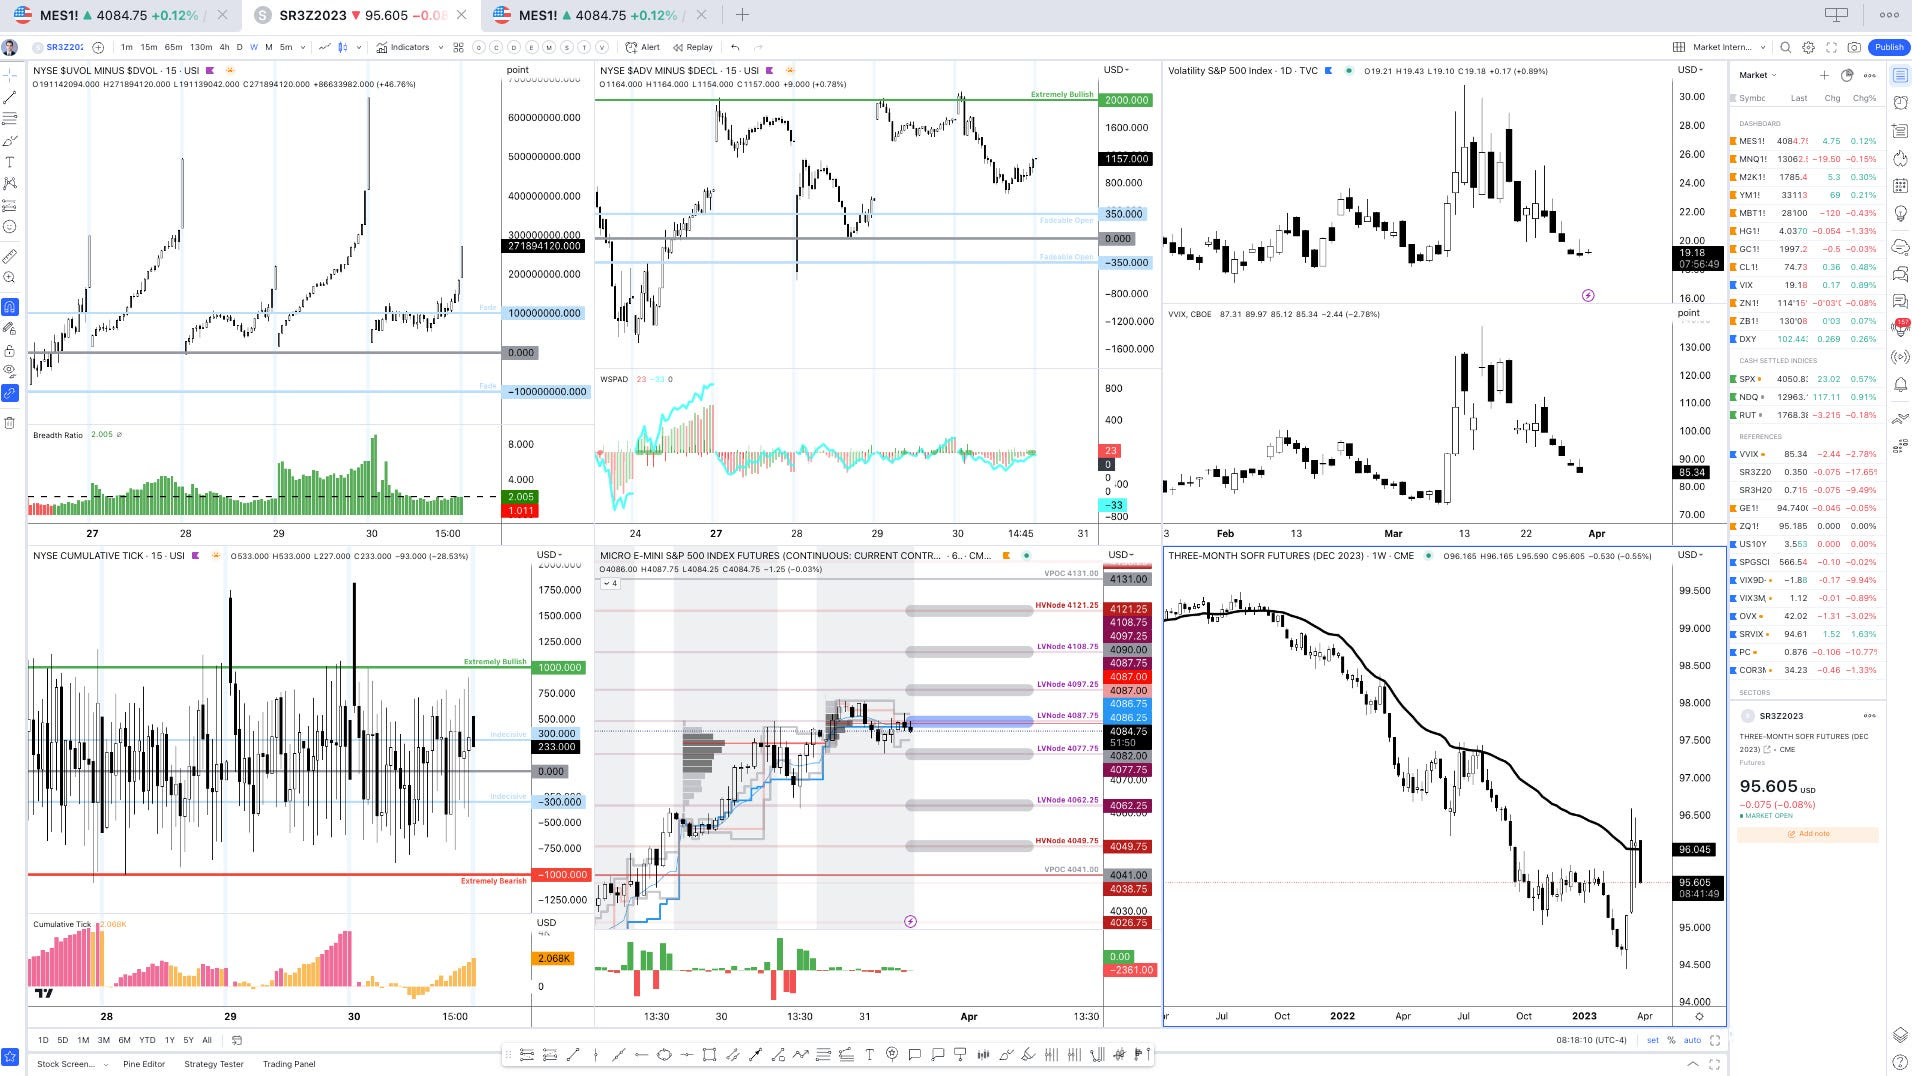
As an aside, some may have observed how well our levels have been working. For instance, as shown below (middle bottom), yesterday’s Daily Brief levels marked the session high and low for the Micro E-mini S&P 500 Index (FUTURE: /MES).
Commentators online have rightly pointed out the build-up of short-dated options exposures near current market prices. In short, this activity, and its potential hedging, help promote mean-reversion and responsiveness at our volume profile-derived key levels, which often overlap with centers of significant options activity, as we see. Particularly after the quarterly options expiry (OpEx), this activity’s ability to contain markets will ease; markets will yield to fundamental strengths or weaknesses. Based on top-line measures of breadth and IVOL, “there isn’t much juice left to squeeze,” SpotGamma says. From an options positioning perspective, for volatility to reprice lower and solicit re-hedging that boosts the market, “we need a change in [the] volatility regime (i.e., soft landing, bank crisis resolved, etc.),” SpotGamma adds. The likelihood of that happening is low; some expect the Federal Reserve (Fed) to stick to its original message and continue to tighten and withdraw liquidity. So, blindly selling options (colloquially referred to as volatility) in this environment is dangerous.

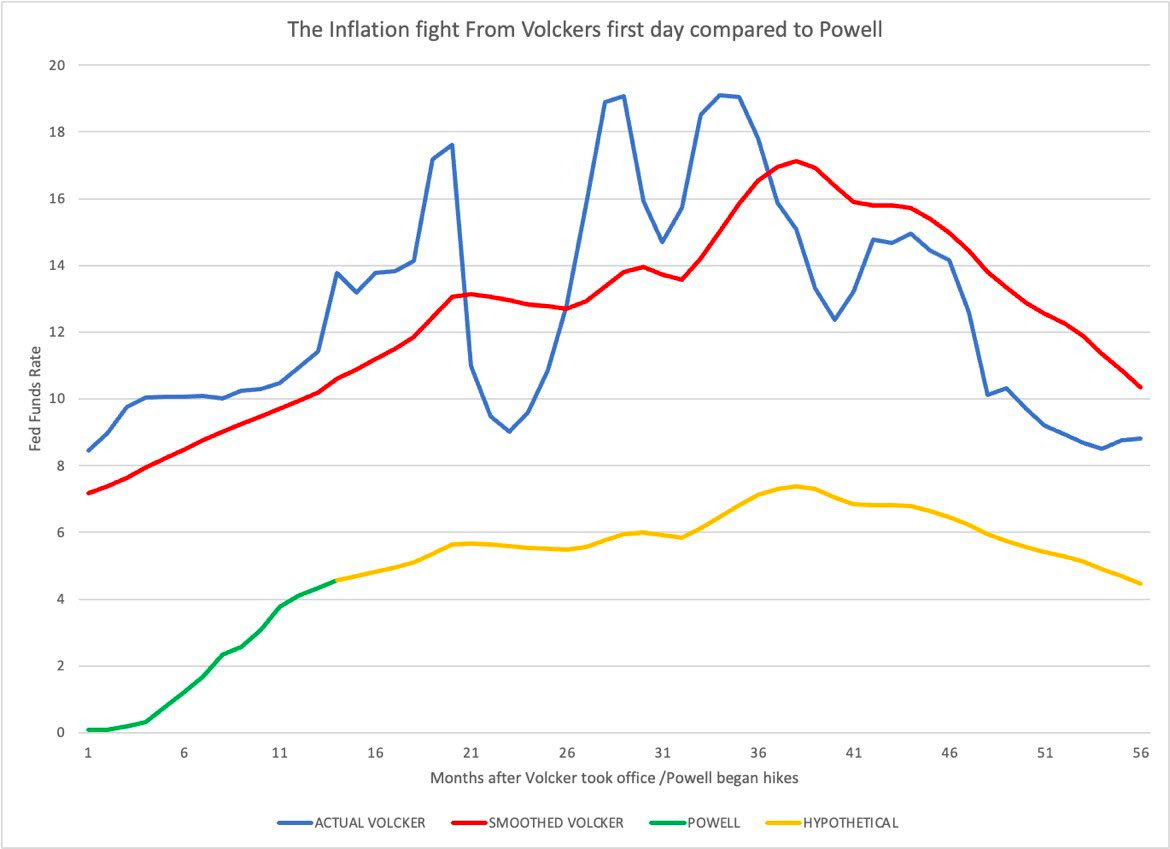
Damped Spring’s Andy Constan overlays past and present inflation fights. What if?
Technical
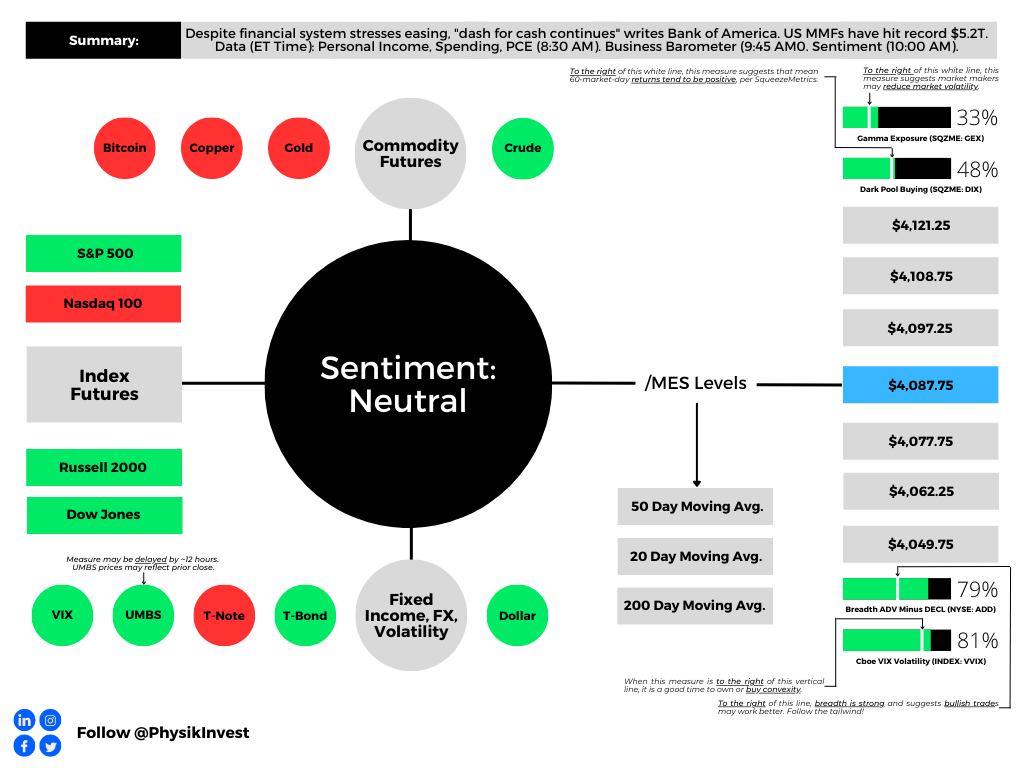
As of 8:00 AM ET, Friday’s regular session (9:30 AM – 4:00 PM ET) in the S&P 500 will likely open in the middle part of a balanced overnight inventory, inside of the prior day’s range, suggesting a limited potential for immediate directional opportunity.
The S&P 500 pivot for today is $4,087.75.
Key levels to the upside include $4,097.25, $4,108.75, and $4,121.25.
Key levels to the downside include $4,077.75, $4,062.25, and $4,049.75.
Disclaimer: Click here to load the updated key levels via the web-based TradingView platform. New links are produced daily. Quoted levels likely hold, barring an exogenous development.
About
The author, Renato Leonard Capelj, spends the bulk of his time at Physik Invest, an entity through which he invests and publishes free daily analyses to thousands of subscribers. The analyses offer him and his subscribers a way to stay on the right side of the market.
Separately, Capelj is an accredited journalist with past works, including interviews with investor Kevin O’Leary, ARK Invest’s Catherine Wood, FTX’s Sam Bankman-Fried, North Dakota Governor Doug Burgum, Lithuania’s Minister of Economy and Innovation Aušrinė Armonaitė, former Cisco chairman and CEO John Chambers, and persons at the Clinton Global Initiative.
Connect
Direct queries to renato@physikinvest.com. Find Physik Invest on Twitter, LinkedIn, Facebook, and Instagram. Find Capelj on Twitter, LinkedIn, and Instagram. Only follow the verified profiles.
Calendar
You may view this letter’s content calendar at this link.
Disclaimer
Do not construe this newsletter as advice; all content is for informational purposes, and derivatives carry a substantial risk of loss. Capelj and Physik Invest, non-professional advisors, will never solicit others for capital or collect fees and disbursements for their work.


