Categories
Commentary

Daily Brief For August 19, 2021

Market Commentary

Equity index futures continued yesterday’s late-day liquidation.

  • Chop-chop: Fed nears time to taper.
  • Busy morning in regards to releases.
  • Range is wide; volatility may persist.

What Happened: U.S. stock index futures auctioned lower overnight alongside the increased prospects of stimulus reduction in 2021.

Ahead is data on jobless claims (8:30 AM ET), Philadelphia Fed manufacturing index (8:30 AM ET), and the index of leading economic indicators (10:00 AM ET). 
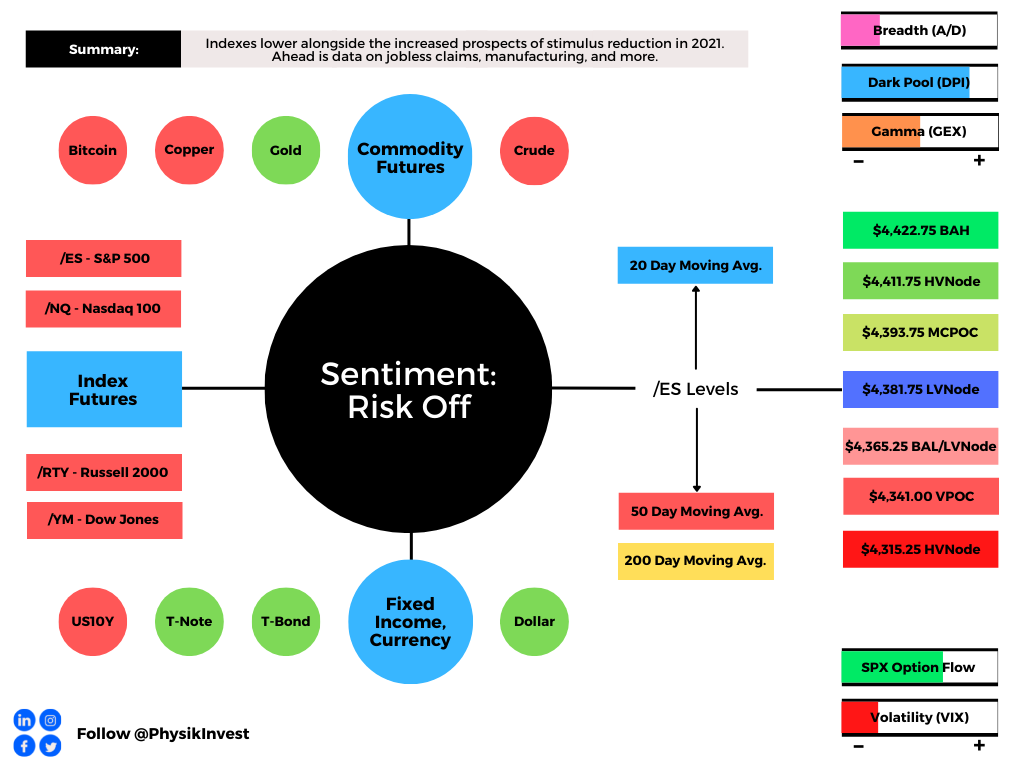
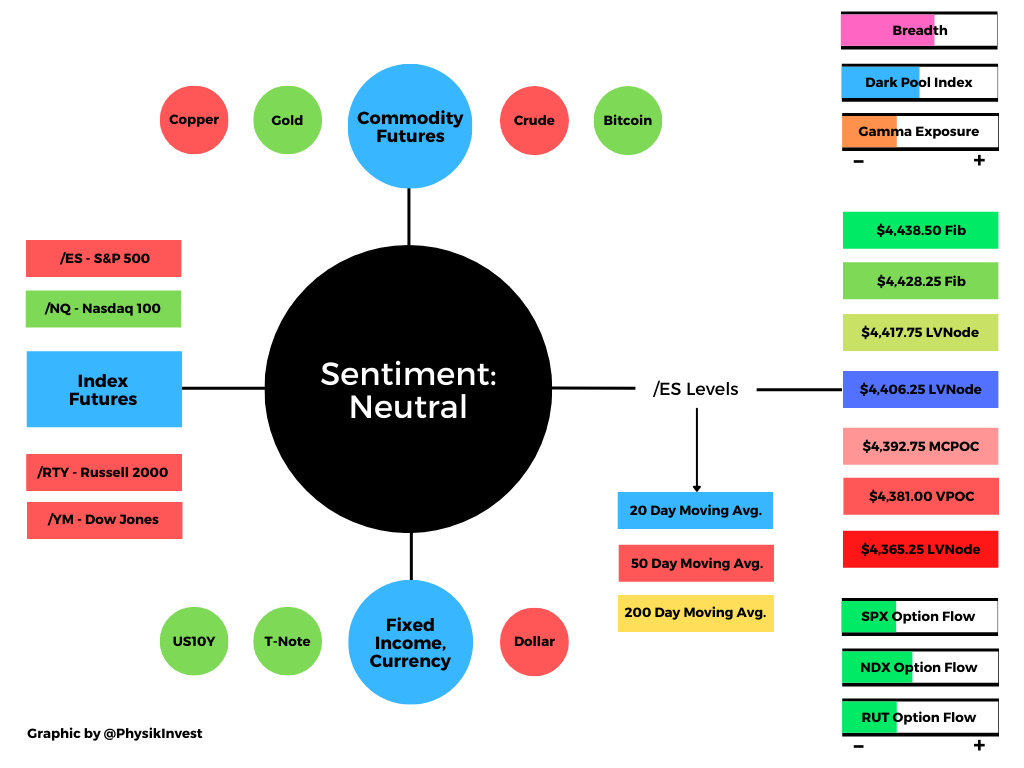
Graphic updated 6:45 AM ET. Sentiment Risk-Off if expected /ES open is below the prior day’s range. See here for more on the Dark Pool Index (DPI) and Gamma (GEX). A higher DPI approximation is bullish. At the same time, the lower the GEX approximation, the more volatility. SHIFT data used for options activity approximation. Note that options flow is sorted by the call premium spent; if green and more positive then more was spent on call options. Breadth reflects a reading of the prior day’s Advance/Decline indicator. VIX reflects a current reading of the CBOE Volatility Index from 0-100.

What To Expect: As of 6:45 AM ET, Thursday’s regular session (9:30 AM – 4:00 PM EST) in the S&P 500 will likely open outside of prior-range and -value, suggesting a higher potential for immediate directional opportunity.

Adding, during the prior day’s regular trade, on weak intraday breadth and market liquidity metrics, the worst-case outcome occurred, evidenced by a close below the $4,422.75 balance area high (BAH) and 20-day simple moving average (SMA).

This is significant because the BAH marked a go/no-go level on a prior breakout and the SMA – a metric that ought to solicit a response by short-term (i.e., technically driven) participants who may be unable to defend retests – broke. As a result of this failure, odds supported the move to the $4,365.25 balance area low (BAL), the lower end of the balance.

Gap Scenarios In Play: Gaps ought to fill quickly. Should they not, that’s a signal of strength; do not fade. Leaving value behind on a gap-fill or failing to fill a gap (i.e., remaining outside of the prior session’s range) is a go-with indicator.

Auctioning and spending at least 1-hour of trade back in the prior range suggests a lack of conviction; in such a case, do not follow the direction of the most recent initiative activity.

Further, the aforementioned trade is happening in the context of a shift in the tapering debate, ahead of the Jackson Hole Economic Policy Symposium August 26-28, 2021. This theme’s implications on price are contradictory; to elaborate, the summary of the late July Federal Open Market Committee (FOMC) meeting suggests an inclination to start reducing the pace of asset purchases this year.
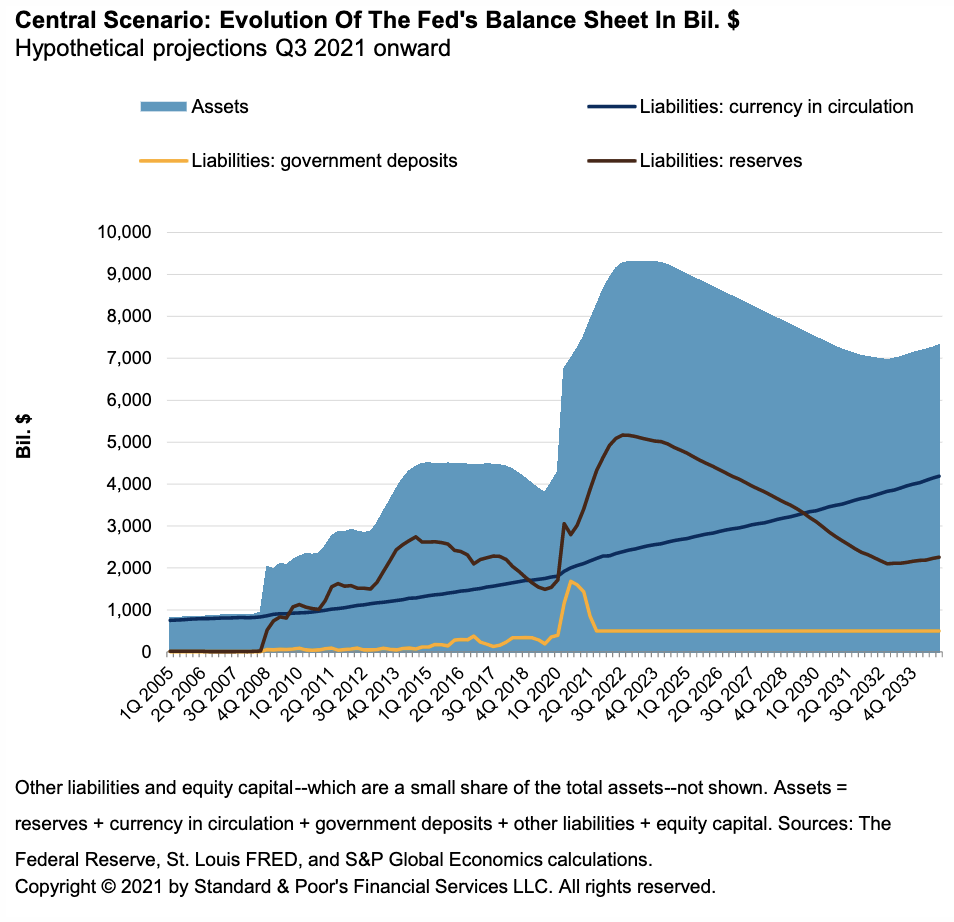
Graphic: S&P Global unpacks Federal Reserve balance sheet hypotheticals.

As an aside, markets went on a historic tear over the past year or so given monetary frameworks and max liquidity, so to speak. Add in the growth of derivatives exposure and potential for offsides positioning, even the slightest reduction in the Federal Reserve’s balance sheet – the removal of liquidity – has the potential to prompt a cascading reaction that exacerbates underlying price movements.

As Kai Volatility’s Cem Karsan, in a conversation with me for a Benzinga article, said: “It’s not a coincidence that the mid-February to mid-March 2020 downturn literally started the day after February expiration and ended the day of March quarterly expiration. These derivatives are incredibly embedded in how the tail reacts and there’s not enough liquidity, given the leverage, if the Fed were to taper.”
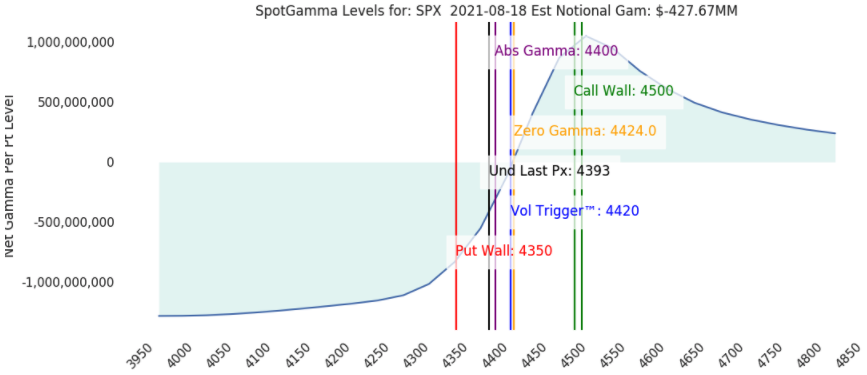
Graphic: SpotGamma data suggests the cash-settled S&P 500 Index (INDEX: SPX) may open in short-gamma territory. To note, gamma is the sensitivity of an option to changes in the underlying price. Dealers that take the other side of options trades hedge their exposure to risk by buying and selling the underlying. When dealers are short-gamma, they hedge by buying into strength and selling into weakness. When dealers are long-gamma, they hedge by selling into strength and buying into weakness. The former exacerbates volatility. The latter calms volatility.

Moreover, for today, in light of higher volatility and responsive trade expectations – given overextension from value (i.e., fair prices for two-sided trade as derived from the volume profile) and a test of a key anchored volume-weighted average price (VWAP) – participants may make use of the following frameworks.

More On Volume-Weighted Average Prices (VWAPs): A metric highly regarded by chief investment officers, among other participants, for quality of trade. Additionally, liquidity algorithms are benchmarked and programmed to buy and sell around VWAPs.
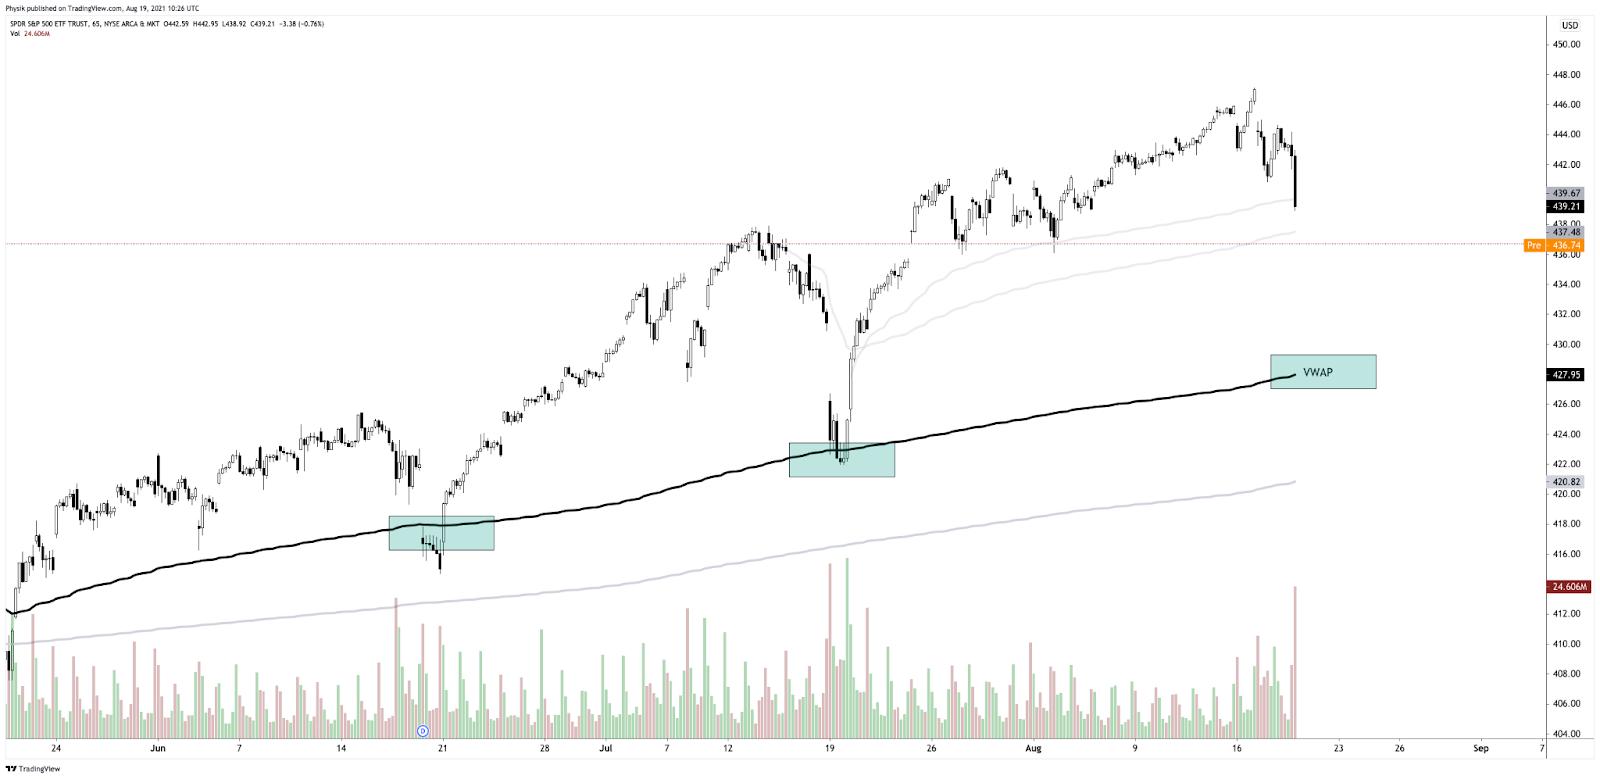
Graphic: SPDR S&P 500 Trust ETF (NYSE: SPY) flirts with key downside anchored VWAPs. A key downside level in SPY lies at $427.95, currently. 

In the best case, the S&P 500 trades sideways or higher; activity above the $4,381.75 low volume area (LVNode) pivot puts in play the $4,393.75 micro composite point of control (MCPOC). Initiative trade beyond the MCPOC could reach as high as the $4,411.75 high volume area (HVNode) and the aforementioned $4,422.75 BAH.

In the worst case, the S&P 500 trades lower; activity below the $4,381.75 low volume area (LVNode) puts in play the $4,365.25 BAL/LVNode. Initiative trade beyond the BAL/LVNode could reach as low as the $4,341.00 untested point of control (VPOC) and $4,315.25 HVNode.

Volume Areas: A structurally sound market will build on past areas of high volume. Should the market trend for long periods of time, it will lack sound structure (identified as a low volume area which denotes directional conviction and ought to offer support on any test). 

If participants were to auction and find acceptance into areas of prior low volume, then future discovery ought to be volatile and quick as participants look to areas of high volume for favorable entry or exit.

POCs: POCs are valuable as they denote areas where two-sided trade was most prevalent. Participants will respond to future tests of value as they offer favorable entry and exit.
Graphic: 65-minute profile chart of the Micro E-mini S&P 500 Futures updated 6:45 AM ET.

News And Analysis

Landlords from Florida to California are jacking up rents.

COVID vaccines are less effective against new variants.

UK Fintech market runs hot but fear of bubble premature.

Tencent warns of more China tech curbs after growth hit.

A closer look at the investment/speculative-grade divide.

US restaurants up prices to offset labor inflation, demand.

Disenchanted investors help drive the record gold prices.

A complete Fed balance sheet normalization years away.

What People Are Saying

About

After years of self-education, strategy development, and trial-and-error, Renato Leonard Capelj began trading full-time and founded Physik Invest to detail his methods, research, and performance in the markets. 

Additionally, Capelj is a finance and technology reporter. Some of his biggest works include interviews with leaders such as John Chambers, founder and CEO, JC2 Ventures, Kevin O’Leary, businessman and Shark Tank host, Catherine Wood, CEO and CIO, ARK Invest, among others.

Disclaimer

At this time, Physik Invest does not manage outside capital and is not licensed. In no way should the materials herein be construed as advice. Derivatives carry a substantial risk of loss. All content is for informational purposes only.

Categories
Commentary

Daily Brief For August 4, 2021

Editor’s Note: On Thursday (8/5) and Friday (8/6) there will be no Daily Brief newsletter. Additionally, there will be no Weekly Brief Sunday (8/8), either. All commentaries to resume August 9, 2021.

Market Commentary

Equity index futures trade higher ahead of key fundamental events.

  • Worry dwindles and volatility ebbs.
  • Ahead: Data on jobs and services.
  • A mixed bag. Positioned for higher.

What Happened: U.S. stock index futures auctioned higher and sideways as participants discounted drivers like the COVID-19 coronavirus and China clampdown. 

At the same time, earnings are robust and stimulus remains in play; “Aside from the healthy earnings outlook, we also see equities being supported by continued monetary stimulus from the Federal Reserve and the attractiveness of stocks relative to low bond yields,” said Mark Haefele of UBS Group AG (NYSE: UBS). “Cyclicals are expected to benefit from the shift in consumer spending away from pandemic winners such as mega-cap tech.”

Ahead is data on ADP employment, Markit services PMI, and the ISM services index.

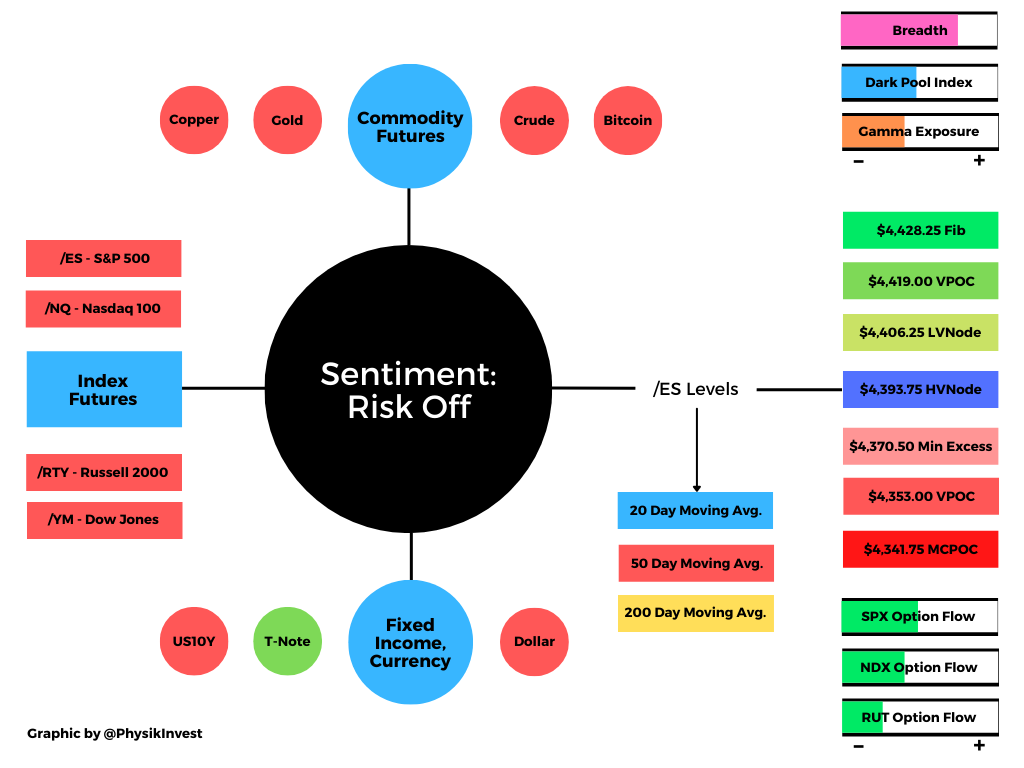
Graphic updated 6:30 AM ET. Sentiment Neutral if expected /ES open is inside of the prior day’s range. See here for more on the Dark Pool Index and Gamma. A positive Dark Pool Index reading is bullish. At the same time, the higher (lower) the gamma, the less (more) volatility. SHIFT Search data used for options activity. Note that options flow is sorted by the call premium spent; if green and more (less) positive then more (less) was spent on call options. Breadth reflects a reading of the prior day’s Advance/Decline indicator.

What To Expect: As of 6:30 AM ET, Wednesday’s regular session (9:30 AM – 4:00 PM EST) in the S&P 500 will likely open just inside of prior-range and -value, suggesting a limited potential for immediate directional opportunity.

Adding, during the prior day’s regular trade, the best case outcome occurred after a repair of the $4,370.50 minimal excess low; after testing the low (a level which corresponded with a volume-weighted average price or VWAP anchored from the July 19 swing low), responsive buyers initiated a rally that pushed prices to a higher close, away from value. 

Excess: A proper end to price discovery; the market travels too far while advertising prices. Responsive, other-timeframe (OTF) participants aggressively enter the market, leaving tails or gaps which denote unfair prices.

More On Volume-Weighted Average Prices (VWAPs): A metric highly regarded by chief investment officers, among other participants, for quality of trade. Additionally, liquidity algorithms are benchmarked and programmed to buy and sell around VWAPs.

In doing so, participants negated all of Monday’s selling which, as stated Tuesday, was not supported by value or strong metrics with respect to breadth and market liquidity

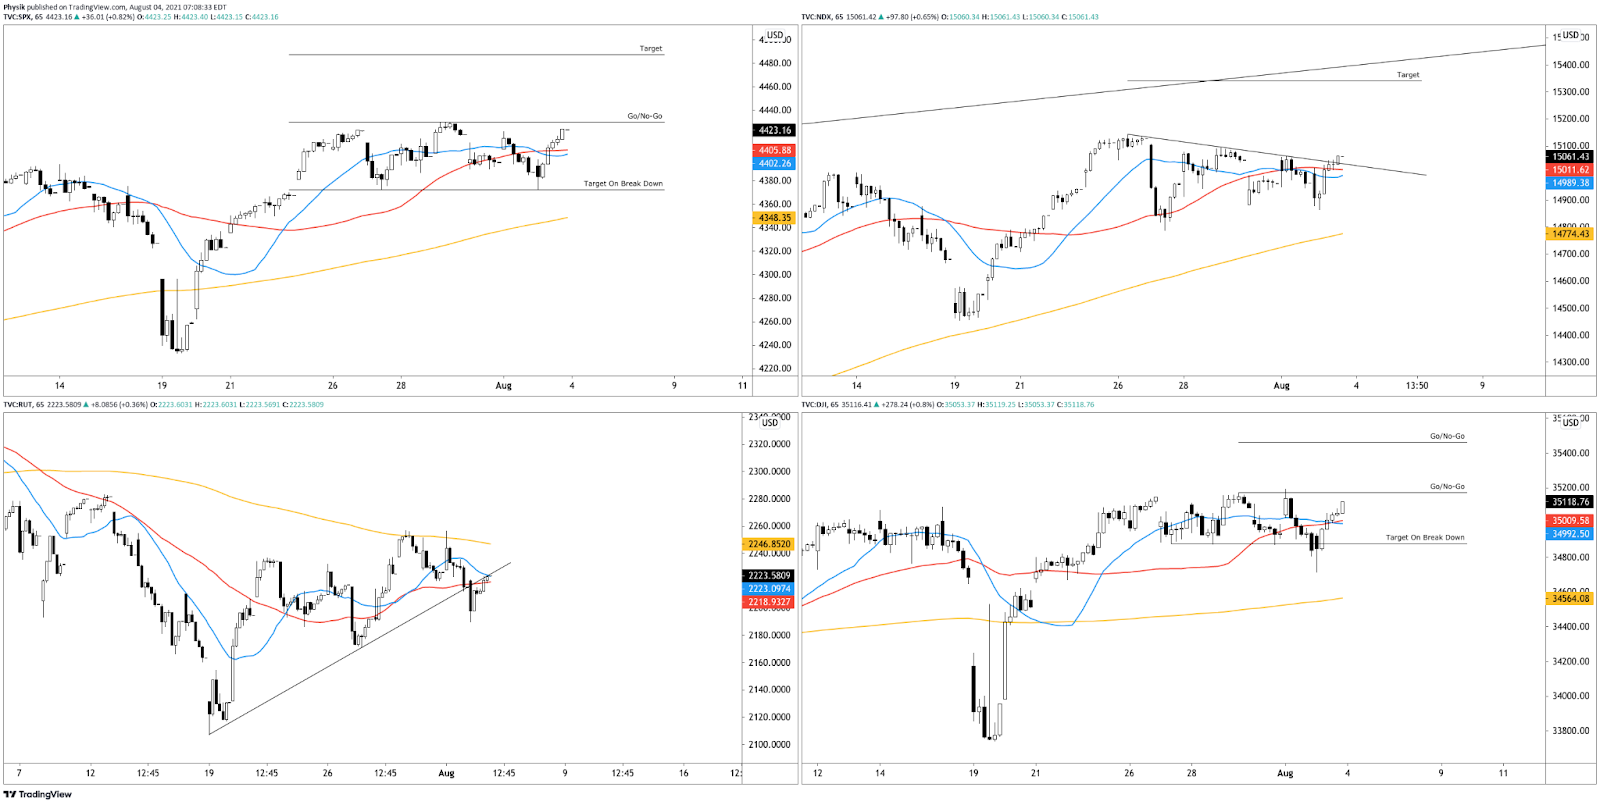
Coming into today’s session, opportunity resides in the S&P 500, Nasdaq 100, and Dow Jones Industrial Average; indices are trading at key go/no-go levels. 

Further up movement puts in play balance-area breakouts. In such a case, the modus operandi shifts from responsive trade (i.e., fade the edges) to initiative trade (i.e., play the break). Failure to expand range portends a rotation back into balance. 

Balance (Two-Timeframe Or Bracket): Rotational trade that denotes current prices offer favorable entry and exit. Balance-areas make it easy to spot a change in the market (i.e., the transition from two-time frame trade, or balance, to one-time frame trade, or trend).

Below are some rough levels to base expectations around. The width of the balance area, projected off the high end of the balance, is the typical target in such a breakout (e.g., $4,490 SPX cash).

Graphic: 65-minute candlestick charts of the cash-settled S&P 500 (INDEX: SPX), Nasdaq 100 (INDEX: NDX), Russell 2000 (INDEX: RUT), and Dow Jones Industrial Average (INDEX: DJI).

Moreover, for today, participants can trade from the following frameworks. 

In the best case, the S&P 500 trades sideways or higher; activity above the $4,406.25 low volume area (LVNode) pivot puts in play the $4,417.75 LVNode. Initiative trade beyond the $4,417.75 LVNode could reach as high as the $4,428.25 and $4,438.50 Fibonacci price extensions.

In the worst case, the S&P 500 trades lower; activity below the $4,406.25 LVNode puts in play the $4,392.75 micro-composite point of control (MCPOC). Initiative trade beyond the MCPOC could reach as low as the $4,381.75 untested point of control (VPOC) and $4,365.25 LVNode.

Volume Areas: A structurally sound market will build on past areas of high volume. Should the market trend for long periods of time, it will lack sound structure (identified as a low volume area which denotes directional conviction and ought to offer support on any test). 

If participants were to auction and find acceptance into areas of prior low volume, then future discovery ought to be volatile and quick as participants look to areas of high volume for favorable entry or exit.

POCs: POCs are valuable as they denote areas where two-sided trade was most prevalent. Participants will respond to future tests of value as they offer favorable entry and exit.
Graphic: 65-minute profile chart of the Micro E-mini S&P 500 Futures. Graphic updated 6:30 AM ET.

News And Analysis

Markets primed for Powell second term at risk from surprise pick.

China typhoons create latest supply-chain threat as ports close.

Economic data positive for risk but business cycle risks building.

New York City to require proof of vaccination for indoor activities.

Asia-Pacific on track for a strong rebound although scars will last.

What People Are Saying

About

After years of self-education, strategy development, and trial-and-error, Renato Leonard Capelj began trading full-time and founded Physik Invest to detail his methods, research, and performance in the markets. 

Additionally, Capelj is a finance and technology reporter. Some of his biggest works include interviews with leaders such as John Chambers, founder and CEO, JC2 Ventures, Kevin O’Leary, businessman and Shark Tank host, Catherine Wood, CEO and CIO, ARK Invest, among others.

Disclaimer

At this time, Physik Invest does not manage outside capital and is not licensed. In no way should the materials herein be construed as advice. Derivatives carry a substantial risk of loss. All content is for informational purposes only.
Categories
Commentary

Weekly Brief For August 1, 2021

Editor’s Note: On Thursday (8/5) and Friday (8/6) there will be no Daily Brief newsletter. Additionally, there will be no Weekly Brief Sunday (8/8), either. All commentaries to resume August 9, 2021.

If in the Miami, Florida area please contact renato@physikinvest.com if interested in connecting over markets, fintech, and the like.

PS: Added a new “Weekly Trade Ideas” section. Hope it provides added value!

Regards,

Renato Leonard Capelj

Market Commentary

Key Takeaways: Equity index futures to start the week off neutral, in prior-range and -value.

  • Debt limit, China, fiscal policy cloud outlook.
  • Expecting a heavy week for economic data.
  • Responsive trade until key levels are taken.
  • Amazon Inc (NASDAQ: AMZN) trade ideas.

What Happened: With respect to hot topic market risks, the week prior offered a ton of information to add to our narrative. We list for clarity.

  • Debt Limit: The August 1 reinstatement of the U.S. debt limit may have severe consequences, increasing the odds of a rating downgrade on government debt.
  • Monetary: Come September, participants will likely receive increased clarity over taper timelines with an official start early next year. Adding, Chairman Jerome Powell expressed inflation as temporary and the committee announced the creation of a pair of standing facilities to strengthen its ability to be the lender of last resort in the repo market.
  • China: Cross-asset volatility in China worsened, prompting talk of a yuan devaluation. A devaluation is something to fear; to note, The People’s Bank of China (PBOC) roiled global equity markets after its 2015 yuan devaluation.
  • Growth: U.S. economic data came in weaker suggesting growth likely peaked. Notwithstanding, consumer confidence improved markedly with sentiment recovering fully. Moody’s strategists look for real GDP to rise 6.7% this year, a downward revision on some fiscal policy assumptions.
  • Fiscal: Lawmakers debate another round of stimulus to ensure the strong long-term growth of lower- and middle-income households. The proposed legislation is receiving pushback with respect to its impact on inflation and taxes. Moody’s strategists note “higher taxes will weigh on economic growth, but the impact on the economy from the higher proposed taxes will be small.”
  • Pandemic: COVID-19 variants are a cause for concern – especially with respect to the Federal Reserve’s tapering of quantitative easing – but hospitalization ratios and mobility metrics suggest the crisis is likely over. In other areas, the CDC’s rental eviction moratorium and FHFA’s foreclosure moratorium expired with forbearance on government-backed mortgages and student loans ending September, also.
  • Yields: Technical factors – issuance, short coverings, a fading reflation trade, and peak growth – are to blame for lower Treasury yields. A longer-term deviation from the implied “economic fair value” of 1.6% and 1.65% for the 10-year yield would suggest other forces are driving long-term interest rates.
  • Earnings: Year-over-year profit growth of S&P 500 constituents stands at 85% with 88% of companies beating estimates for revenue and profit, according to Business Insider
  • Positioning: According to one Bank of America Corporation (NYSE: BAC) comment, highlighted by The Market Ear, “The average recovery time following 2-sigma one-day S&P declines has shortened significantly post-GFC, reaching an all-time low this year.” This has a lot to do with the inventory positioning of participants; volatility is oversupplied and associated heading forces make it so there is more liquidity and less movement. Should the market unpin, there’s “not enough liquidity” to absorb leverage on the tails.

Putting it all together, Goldman Sachs Group Inc (NYSE: GS) believes “[e]xpectations of higher interest rates and higher corporate tax rates by year-end are the primary reasons [to] forecast that the S&P 500 will trade sideways,” into end-of-year.

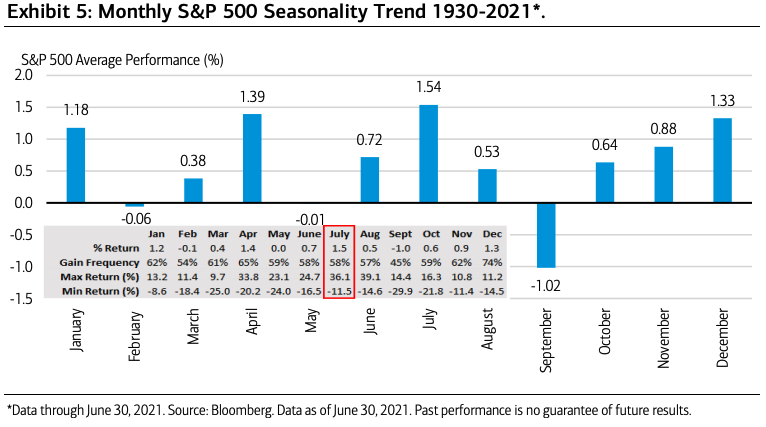
In support of that view is seasonality, also.

Graphic: Seasonality metrics via the Capital Market Outlook by Merrill.

What To Expect: The S&P 500, Nasdaq 100, and Dow Jones Industrial Average are above their key 20-, 50-, and 200-week moving averages while the Russell 2000 is stuck inside a multi-month trading range, between its 20- and 50-week moving averages.

Given the higher long-term trend, traders of the S&P 500, in particular, must contend with a week-long balance area, the result of participants finding higher prices valuable as they position themselves for a directional move, given increased clarity on earnings, taper, and more. 

Balance (Two-Timeframe Or Bracket): Rotational trade that denotes current prices offer favorable entry and exit. Balance-areas make it easy to spot a change in the market (i.e., the transition from two-time frame trade, or balance, to one-time frame trade, or trend).

In the coming sessions, given that the modus operandi is responsive trade (i.e., fade the edges), rather than initiative trade (i.e., play the break), participants will want to focus their attention on where the S&P 500 trades in relation to the $4,392.25 high volume area (HVNode) pivot.

In the best case, the S&P 500 trades sideways or higher; activity above the $4,392.25 HVNode pivot puts in play the $4,406.25 low volume area (LVNode) and $4,419.00 untested point of control (VPOC). Initiative trade beyond the VPOC portends a potential breakout above the $4,422.75 minimal excess high, up to the $4,428.25 Fibonacci extension.

In the worst case, the S&P 500 trades lower; activity below the $4,392.25 HVNode pivot puts in play the $4,381.75 LVNode. Initiative trade beyond the LVNode portends a potential breakdown below the $4,370.50 minimal excess low, down to the $4,353.00 VPOC and $4,341.75 micro-composite point of control (MCPOC).

Volume Areas: A structurally sound market will build on past areas of high volume. Should the market trend for long periods of time, it will lack sound structure (identified as a low volume area which denotes directional conviction and ought to offer support on any test). 

If participants were to auction and find acceptance into areas of prior low volume, then future discovery ought to be volatile and quick as participants look to areas of high volume for favorable entry or exit.

POCs: POCs are valuable as they denote areas where two-sided trade was most prevalent. Participants will respond to future tests of value as they offer favorable entry and exit.

Excess: A proper end to price discovery; the market travels too far while advertising prices. Responsive, other-timeframe (OTF) participants aggressively enter the market, leaving tails or gaps which denote unfair prices.
Graphic: 65-minute profile chart of the Micro E-mini S&P 500 Futures. Note the blue anchored Volume Weighted Average Price (VWAP) which suggests the average buyer, since FOMC, is underwater. To note, VWAP is a metric highly regarded by chief investment officers, among other participants, for quality of trade. Additionally, liquidity algorithms are benchmarked and programmed to buy and sell around VWAPs.

Weekly Trade Idea

Please Note: In no way is the below a trade recommendation. It is a peek into the thought process here at Physik Invest. To cover my butt, so to speak, I say DO NOT take this trade. Also, if you would like to see this section included in future commentaries, email me at renato@physikinvest.com with the subject line “Please Include Weekly Trade Ideas”.

Options offer an efficient way to gain directional exposure. 

If an option buyer was short (long) stock, he or she could buy a call (put) to hedge upside (downside) exposure. Additionally, one can spread, or buy (+) and sell (-) options together, strategically.

Commonly discussed spreads include credit, debit, ratio, back, and calendar.

  • Credit: Sell -1 option closer to the money. Buy +1 option farther out of the money.
  • Debit: Buy +1 option closer to the money. Sell -1 option farther out of the money.
  • Ratio: Buy +1 option closer to the money. Sell -2 options farther out of the money. 
  • Back: Sell -1 option closer to the money. Buy +2 options farther out of the money.
  • Calendar: Sell -1 option. Buy +1 option farther out in time, at the same strike.

Typically, if bullish (bearish), sell at-the-money put (call) credit spread and/or buy a call (put) debit/ratio spread structured around target price. Alternatively, if the expected directional move is great (small), opt for a back spread (calendar spread). Also, if credit spread, capture 50-75% of the premium collected. If debit spread, capture 2-300% of the premium paid.

Be cognizant of risk exposure to direction (delta), time (theta), and volatility (vega). 

  • Negative (positive) delta = synthetic short (long). 
  • Negative (positive) theta = time decay hurts (helps).
  • Negative (positive) vega = volatility hurts (helps).

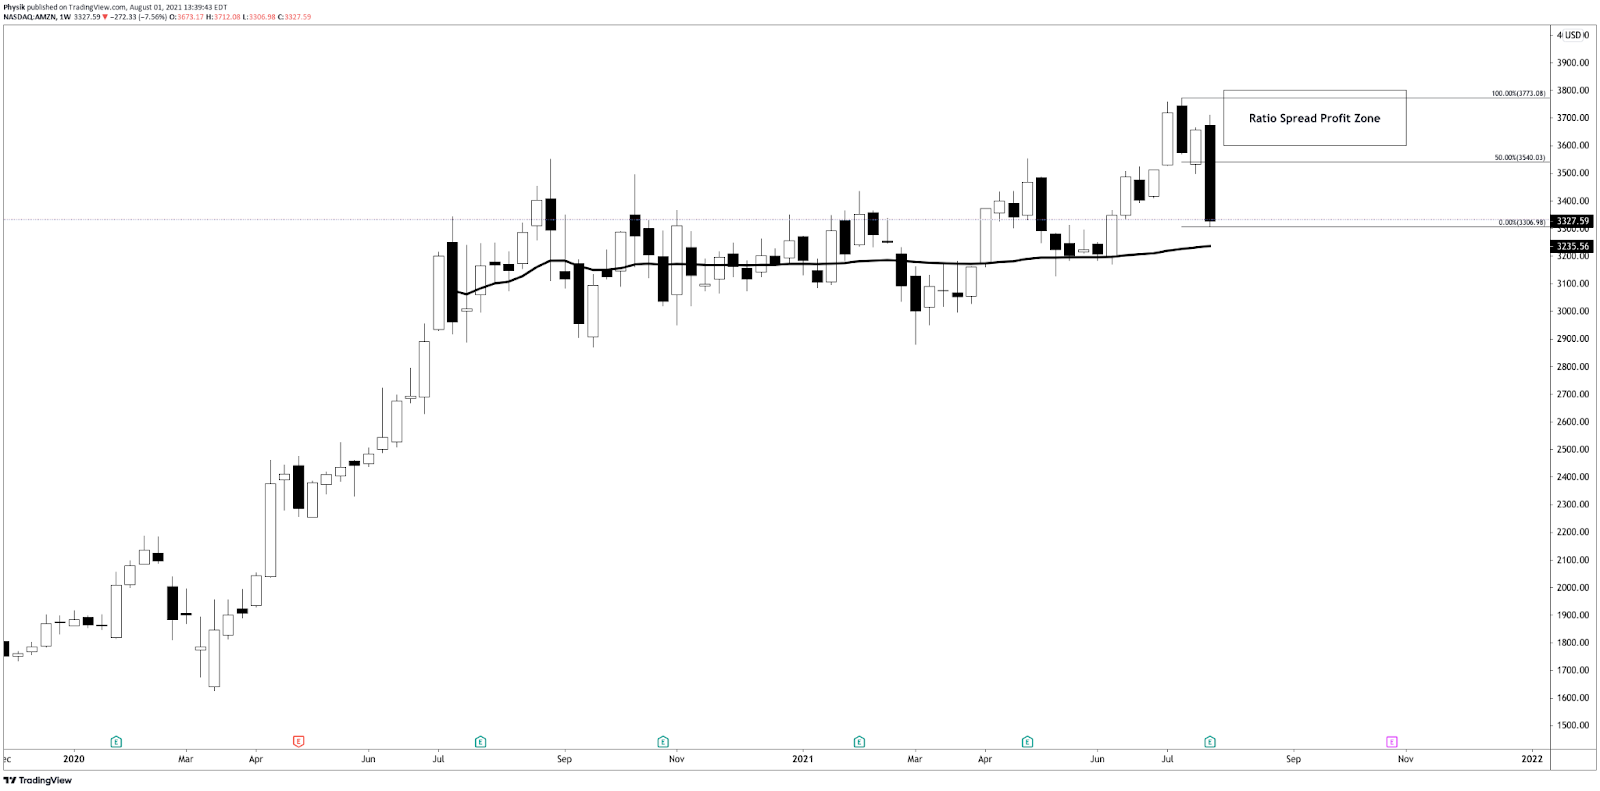
Trade Idea: SELL -1 1/2 BACKRATIO AMZN 100 (Weeklys) 6 AUG 21 3600/3700 CALL @.50 LMT

I’m bullish on Amazon and I think the stock may climb over the next week, toward $3,600. I will structure a spread above the current stock price, expiring in 1 week. I will buy the 3600 call option once (+1) and sell the 3700 call option twice (-2) for a $0.50 credit. Should the stock not move to my target, I keep the $50 credit. Should it move to $3,700, I could make $10,050.00 at expiry. Should the stock move past $3,850.00, I may incur unlimited losses. My goal, with this spread, is to capture the initial credit and close for additional credit if the stock moves higher. 

If necessary, I will hedge the position by either (A) buying long stock, (B) widening strikes, (C) buying a far out-of-the-money call option to cap upside in case of an unpredictable move higher, or (D) roll strikes up in price and out in time.

What People Are Saying

About

After years of self-education, strategy development, and trial-and-error, Renato Leonard Capelj began trading full-time and founded Physik Invest to detail his methods, research, and performance in the markets. 

Additionally, Capelj is a finance and technology reporter. Some of his biggest works include interviews with leaders such as John Chambers, founder, and CEO, JC2 Ventures, Kevin O’Leary, businessman and Shark Tank host, Catherine Wood, CEO and CIO, ARK Invest, among others.

Disclaimer

At this time, Physik Invest does not manage outside capital and is not licensed. In no way should the materials herein be construed as advice. Derivatives carry a substantial risk of loss. All content is for informational purposes only.

Categories
Commentary

Daily Brief For July 30, 2021

Market Commentary

Screens go red as equity index and commodity futures trade lower.

  • Mega-cap growth, China concerning.
  • Earnings, sentiment, and much more.
  • Favoring sideways, responsive trade.

What Happened: U.S. stock index futures auctioned lower overnight alongside narratives surrounding slowing mega-cap growth, China, and COVID-19. 

“The earnings season has delivered strong results so far, however, some investors are concerned that earnings growth will slow from here,” said Lewis Grant of Federated Hermes. “On the other hand, the economy is opening up as we move past the peak infections and consumer balance sheets are strong, and that should support the cyclical end of the market.”

Moreover, ahead is data on earnings, as well as the employment cost index, personal income, consumer spending, core inflation, Chicago PMI, and University of Michigan sentiment.

Graphic updated 6:40 AM ET. Sentiment Risk-Off if expected /ES open is below the prior day’s range. See here for more on the Dark Pool Index and Gamma. A positive Dark Pool Index reading is bullish. At the same time, the higher (lower) the gamma, the less (more) volatility. SHIFT Search data used for options activity. Note that options flow is sorted by the call premium spent; if green and more (less) positive then more (less) was spent on call options. Breadth reflects a reading of the prior day’s Advance/Decline indicator.

What To Expect: As of 6:40 AM ET, Friday’s regular session (9:30 AM – 4:00 PM EST) in the S&P 500 will likely open on a gap, outside of prior-range and -value, suggesting a potential for directional opportunity.

Gap Scenarios: Gaps ought to fill quickly. Should they not, that’s a signal of strength; do not fade. Leaving value behind on a gap-fill or failing to fill a gap (i.e., remaining outside of the prior session’s range) is a go-with indicator.

Auctioning and spending at least 1-hour of trade back in the prior range suggests a lack of conviction; in such a case, do not follow the direction of the most recent initiative activity.

That said, we take the word potential lightly, given the current technical juncture; the S&P 500 is trading within a larger balance area, the result of participants finding higher prices valuable as they position themselves for a directional move, given increased clarity on earnings, taper, and more. 

Balance (Two-Timeframe Or Bracket): Rotational trade that denotes current prices offer favorable entry and exit. Balance-areas make it easy to spot a change in the market (i.e., the transition from two-time frame trade, or balance, to one-time frame trade, or trend).

The modus operandi, in light of the above, is therefore responsive trade (i.e., fade the edges), rather than initiative trade (i.e., play the break).

In support of a fade are metrics with respect to breadth, market liquidity, and the options market. 

Breadth, at the exchange level, was positive yesterday with a steady, albeit soft inflow into the stocks that were up, versus those that were down. 

Similarly, into Thursday’s price rise, the cumulative volume delta became increasingly divergent, decreasing confidence in initiative trade beyond the $4,416.75 overnight high (ONH). 

In light of the decreased confidence, volume profiling also reveals a minimal excess high which could be construed as an improper end to price discovery. 

Volume Delta: Buying and selling power as calculated by the difference in volume traded at the bid and offer.

Excess: A proper end to price discovery; the market travels too far while advertising prices. Responsive, other-timeframe (OTF) participants aggressively enter the market, leaving tails or gaps which denote unfair prices.

Putting it all together, with options market activity supporting potential pinning into Friday’s weekly options expiry, odds favor sideways trade, more than anything else. 

Furthermore, for today, participants can trade from the following frameworks. 

In the best case, the S&P 500 trades sideways or higher; activity above the $4,393.75 high volume area (HVNode) pivot puts in play the $4,406.25 low volume area (LVNode). Initiative trade beyond the LVNode could reach as high as $4,419.00 untested point of control (VPOC) and $4,428.25 Fibonacci price extension.

In the worst case, the S&P 500 trades lower; activity below the $4,393.75 pivot puts in play the $4,370.50 minimal excess low. Initiative trade beyond the minimal excess low could reach as low as the $4,353.00 VPOC and $4,341.75 micro composite point of control (MCPOC).

Volume Areas: A structurally sound market will build on past areas of high volume. Should the market trend for long periods of time, it will lack sound structure (identified as a low volume area which denotes directional conviction and ought to offer support on any test). 

If participants were to auction and find acceptance into areas of prior low volume, then future discovery ought to be volatile and quick as participants look to areas of high volume for favorable entry or exit.

POCs: POCs are valuable as they denote areas where two-sided trade was most prevalent. Participants will respond to future tests of value as they offer favorable entry and exit.
Graphic: 65-minute profile chart of the Micro E-mini S&P 500 Futures. Graphic updated 6:40 AM ET.

News And Analysis

Industrial policy is back as the West dusts off old ideas to counter China.

Global financing condition – issuance strong despite modest contraction.

Nordea talks European-area GDP and inflation: country-level differences.

Fears of a U.S. market correction increase as stocks climb to new highs.

Robinhood got Catherine Wood’s backing despite miserable trading day.

Chinese stocks slipped, ending the wild week as traders price in realities.

What People Are Saying

About

After years of self-education, strategy development, and trial-and-error, Renato Leonard Capelj began trading full-time and founded Physik Invest to detail his methods, research, and performance in the markets. Additionally, Capelj is a finance and technology reporter. Some of his biggest works include interviews with leaders such as John Chambers, founder and CEO, JC2 Ventures, Kevin O’Leary, businessman and Shark Tank host, Catherine Wood, CEO and CIO, ARK Invest, among others.

Disclaimer

At this time, Physik Invest does not manage outside capital and is not licensed. In no way should the materials herein be construed as advice. Derivatives carry a substantial risk of loss. All content is for informational purposes only.