Categories
Commentary

Daily Brief For July 12, 2022

The daily brief is a free glimpse into the prevailing fundamental and technical drivers of U.S. equity market products. Join the 300+ that read this report daily, below!
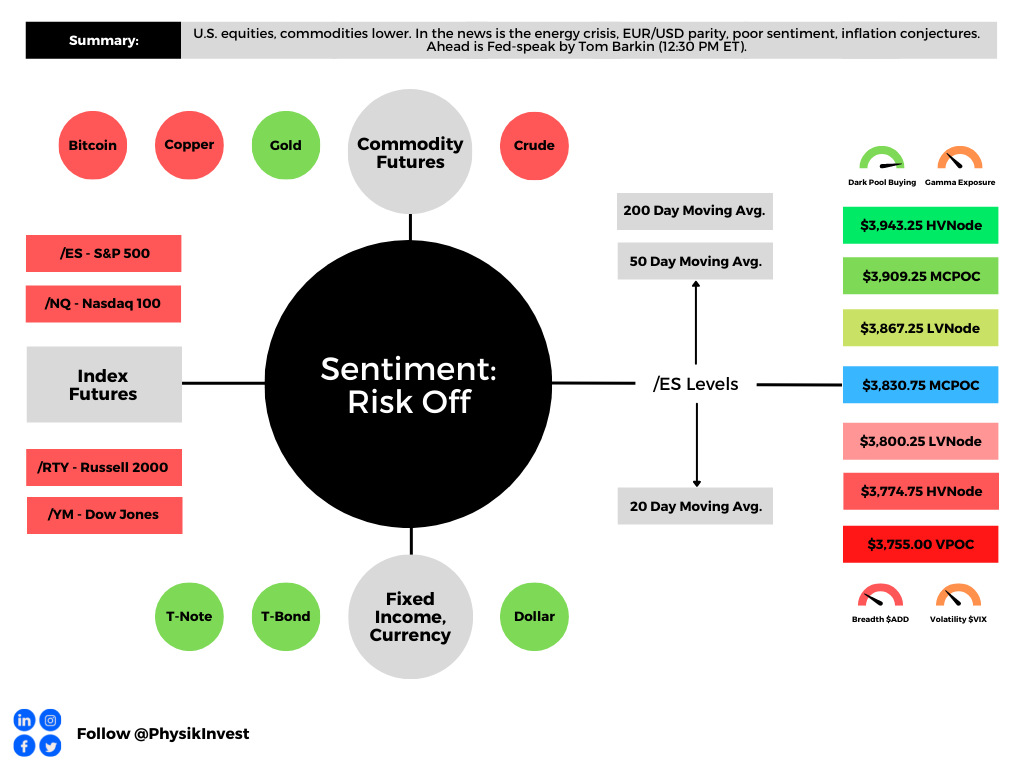
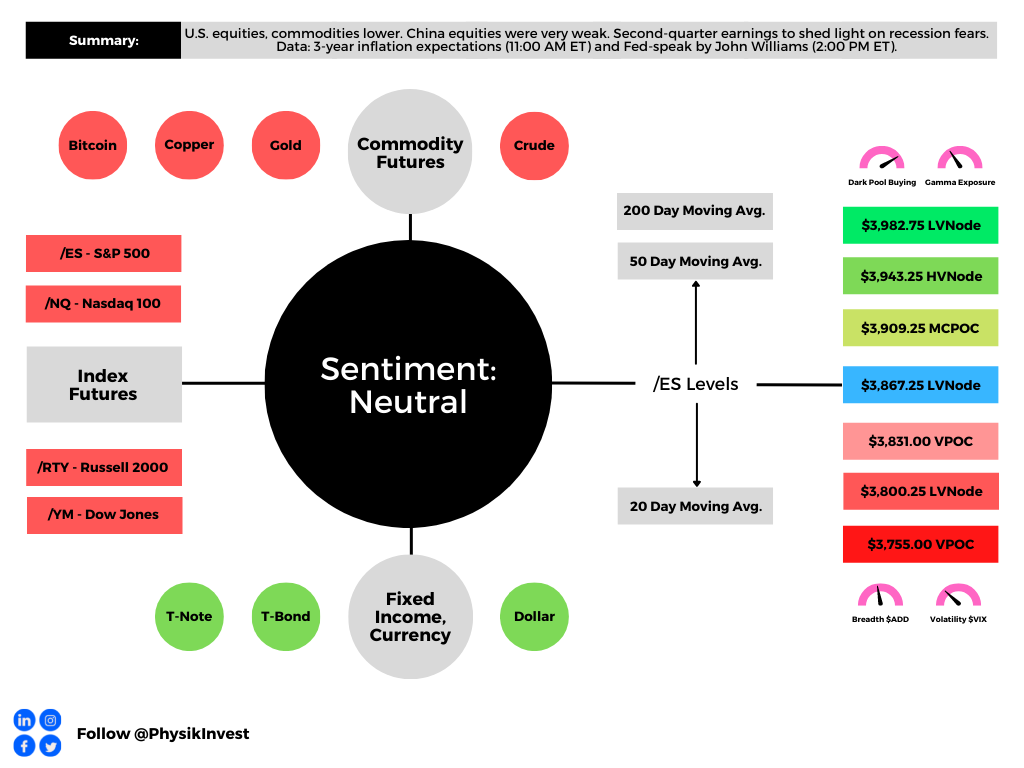
Graphic updated 7:00 AM ET. Sentiment Risk-Off if expected /ES open is below the prior day’s range. /ES levels are derived from the profile graphic at the bottom of the following section. Levels may have changed since initially quoted; click here for the latest levels. SqueezeMetrics Dark Pool Index (DIX) and Gamma (GEX) calculations are based on where the prior day’s reading falls with respect to the MAX and MIN of all occurrences available. A higher DIX is bullish. At the same time, the lower the GEX, the more (expected) volatility. Learn the implications of volatility, direction, and moneyness. Breadth reflects a reading of the prior day’s NYSE Advance/Decline indicator. VIX reflects a current reading of the CBOE Volatility Index (INDEX: VIX) from 0-100.

Fundamental

The top headlines are on the inflation conjectures, the depth and breadth of the energy crisis, supply constraints, EUR/USD parity, geopolitical unrest, and global economic slowing.
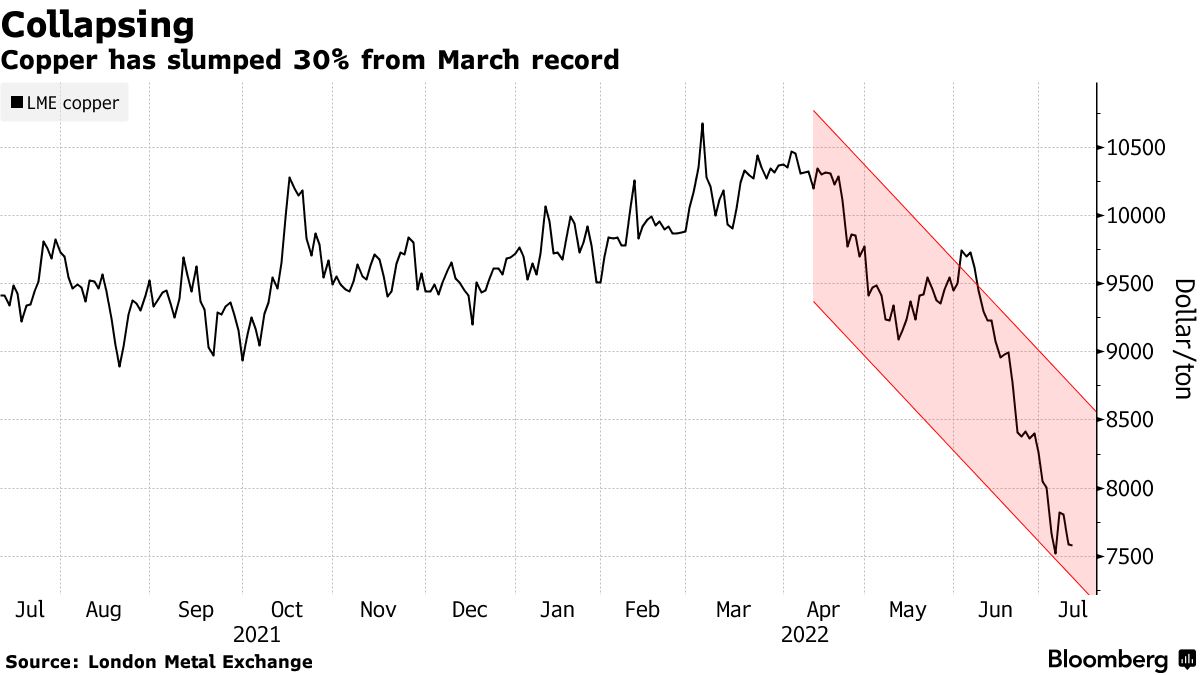
Graphic: Via Bloomberg. Dollar surge, European growth path, waning demand, and increasing supply weigh on copper, a bellwether of the world economy.

A boiling point, if not already, is soon to be reached, in short.

For instance, the energy crisis, which is, in part, the result of earlier capacity erosion, short-term triggers, and panic, is expected to worsen according to the International Energy Agency (IEA).

Per Goldman Sachs Group Inc (NYSE: GS), a “full interruption to Russian flows to Europe would be equivalent to a 35% supply shock to the European gas market.” 
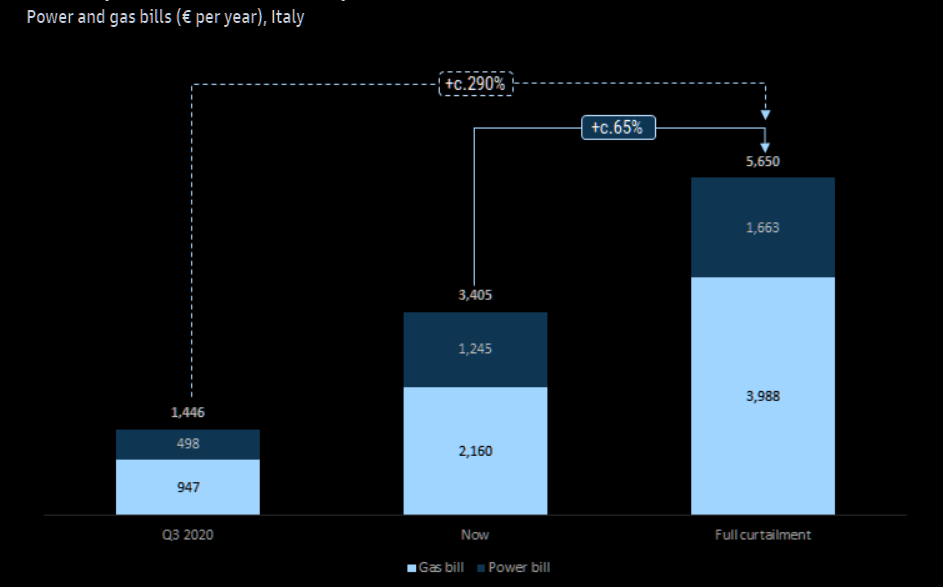
Graphic: Retrieved via The Market Ear. Via Goldman Sachs Group Inc (NYSE: GS). “[W]e estimate bills would increase by c.65% from here in this event, bringing the total household cost for power and gas to nearly €500/month, creating a meaningful affordability problem. Versus the summer-2020 trough, we estimate that gas/power bills would have increased by nearly 300% on this basis.”

What does this mean for the markets we’re focused on day-to-day in this letter?

Well – and this is pursuant to the Daily Brief for Monday, July 11 – markets have only suffered through compression in multiples. Does it stop or is there a looming earnings compression?

Most likely there is an earnings compression. For now, it is only sentiment that is taking the hit. 
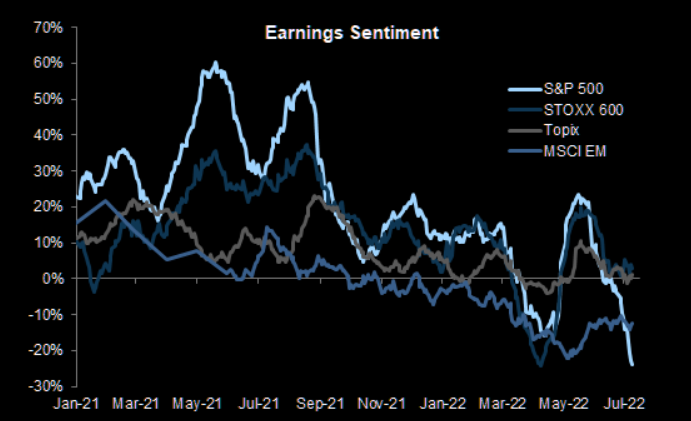
Graphic: Retrieved via The Market Ear. Taken from FactSet Research Systems Inc (NYSE: FDS). 

When will the turn occur?

As stated yesterday, it will be the earnings season that is likely to shed clarity on the answer all the while – what is known right now – a strong dollar is for sure to translate into a headwind for S&P 500 earnings growth.
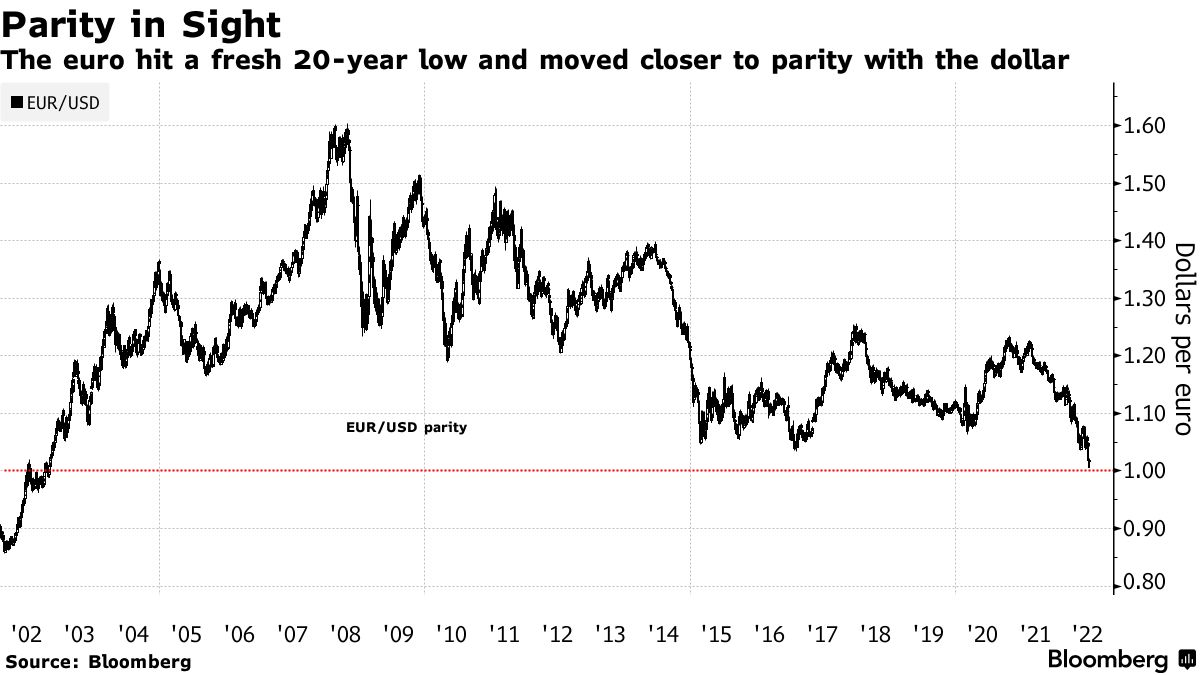
Graphic: Via Bloomberg. The “Fed is still perceived as having more room to hike rates going forward, also on the back of the strong US jobs report for June,” Unicredito SPA (OTC: UNCRY) analysts explained. “On the other hand, other central banks, such as the ECB and the BoE, might be forced to become more prudent, given the more direct exposure their respective economies have to the gas and energy crisis.”

What’s lending to the dollar’s strength?

Let’s start with the following. Participants were extending moneyness to nonmonetary assets, given easy monetary policies and an environment of ample debt and leverage (which cuts into asset price volatility). 
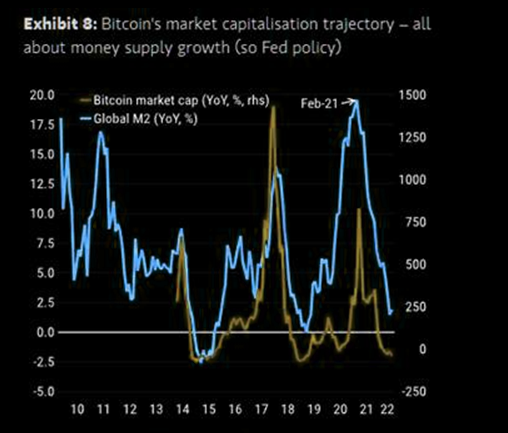
Graphic: Retrieved from The Market Ear. Via Morgan Stanley (NYSE: MS).

When the reverse happens – tighter liquidity and credit – and volatility eventually rises, the demand (and competition) for money (or cash) deflates assets.
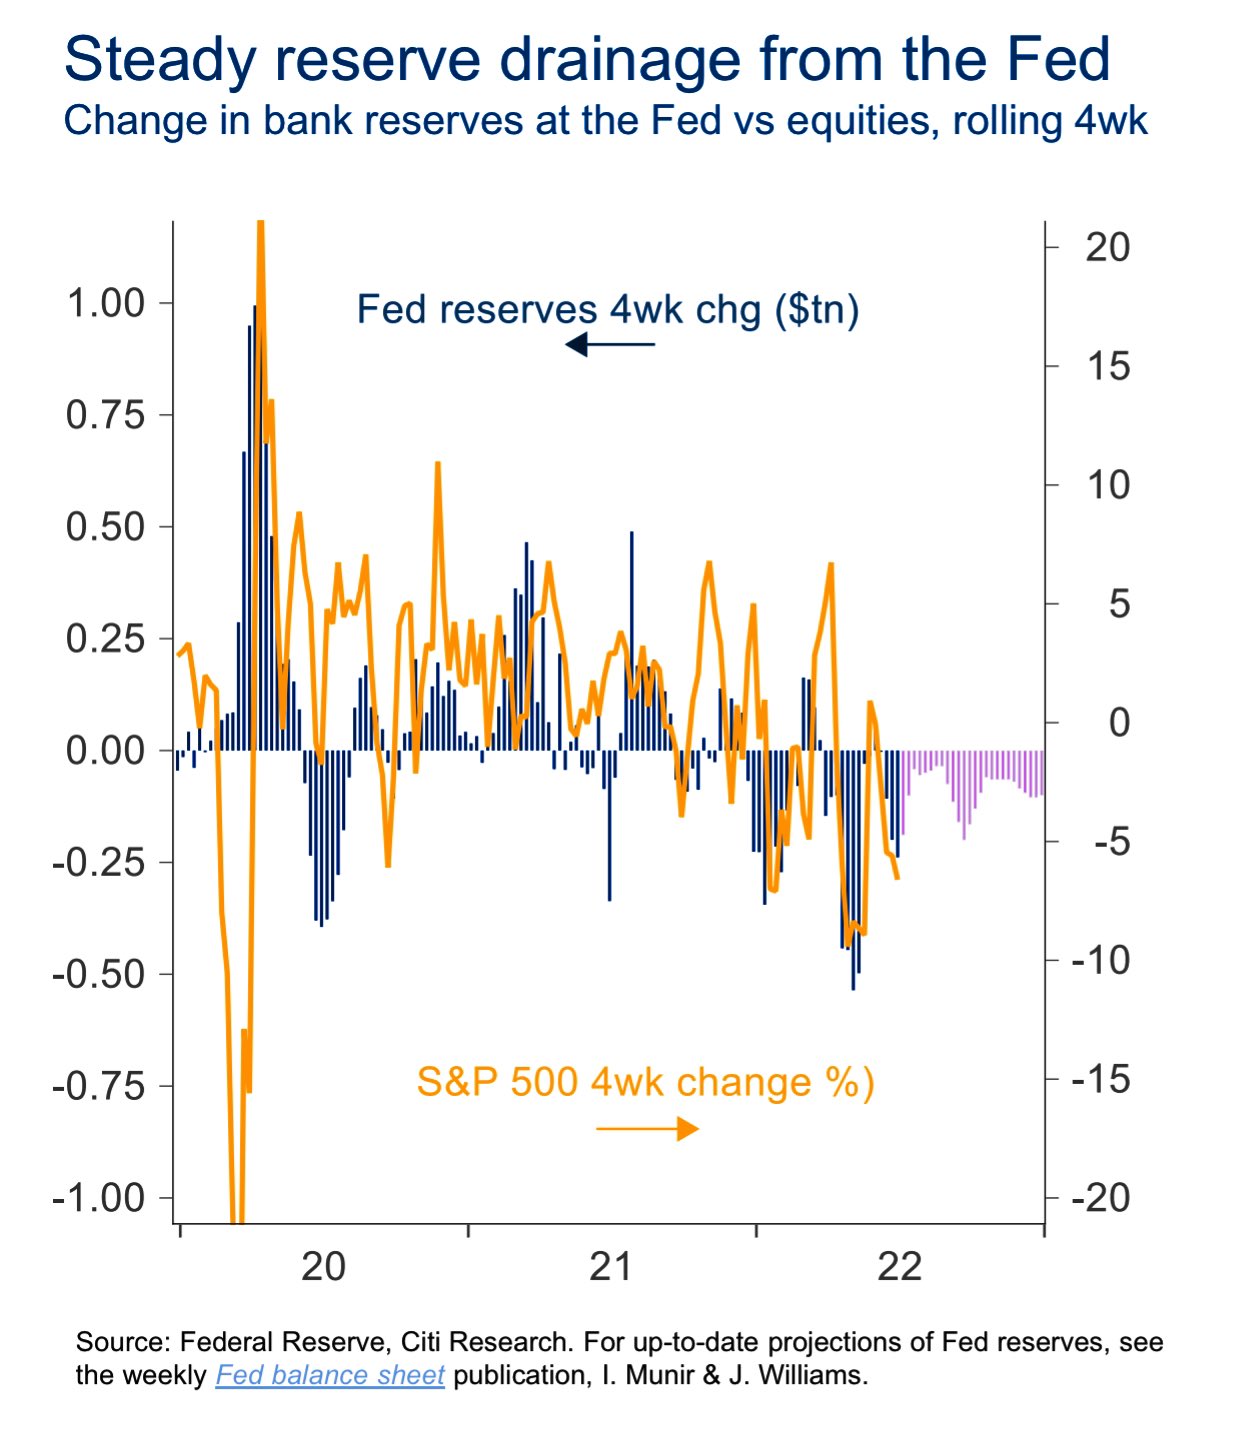
Graphic: Via Citigroup Inc (NYSE: C). According to Joseph Wang, amidst asset price volatility and bank deposits to drain about $1 trillion or so by year-end, investors will “continue to lower their selling prices to compete for the cash they want.”

It is a deflationary pulse manifesting disinflation in consumer prices, that will prompt the Fed to reverse itself on rates and quantitative tightening (QT).

What does this mean?

Depends on the timeframe. 

Though the policy pivot may come alongside a peak in the de-rate markets are experiencing, now, longer-term there are multi-decade trends brewing on the back of the de-globalization pulse, for instance, and a tendency to spend wealth, instead of creating it (as supply chains are replicated here at home), is inflationary which makes the context for a more two-sided market in the future (rather than straight up or down).

Read: Former Bridgewater Associate talks recession odds, capturing a macro edge.

What about the dollar?

With the Fed “still perceived as having more room to hike rates going forward,” per Unicredito SPA (OTC: UNCRY), all the while “other central banks, such as the ECB and the BoE … [are] more prudent, given … the[ir] gas and energy crisis,” short-term dollar strength does more to diminish the global reliance on the U.S.

This is explained even better by Lyn Alden of Lyn Alden Investment Strategy.

The dollar is the dominant currency for carry primarily due to easy monetary policies removing the risk of an ultra-strong dollar. Accordingly, the dollar is “the currency that most offshore debt is denominated in all over the world,” as explained by Bankless, who interviewed Alden.

“Non-US entities make dollar-based loans and transactions in pretty much all markets everywhere because it’s considered more trustworthy than native fiat,” they add. “When there’s a disruption in global cash flows, there’s effectively a short squeeze on the dollar.”

“The stronger the dollar gets in comparison, the less tenable it becomes as a global reserve,” and that is a pressure on the long-term trajectory of that currency.

Positioning

Yesterday’s letter was spot on with respect to positioning.

We can speculate as to where the market may move next, after the release of inflation figures, this week. What’s likely is that, even if the print is hot, the first move is to be structural, per Kai Volatility’s Cem Karsan.

“A function of inevitable rebalancing of dealer inventory post-event. The second move and final resolution, if you wait for it, is usually tied to the incremental effects on liquidity (QE/QT).”

Rising inflation probably bolsters the Fed’s backing of a 75 basis point rate hike on July 27. So, don’t fight the Fed. Rising rates and the withdrawal of liquidity prompts a continued de-rate.

Knowing this, the “flattening in the downside fixed strike skew, while the upside wings [are] more smiley,” as described by JPMorgan Chase & Co (NYSE: JPM), has made for attractive low-cost spread opportunities, as talked about yesterday and in the July 8, 2022 letter.

The moral is as follows: own volatility where the market is likely to not expire. Sell it where the market is likely to expire. Just because implied (IVOL) volatility is at a high starting point does not mean it should be sold, blindly.

Read: Explanations and Applications – Moontower on Gamma.

Technical

As of 7:00 AM ET, Tuesday’s regular session (9:30 AM – 4:00 PM ET), in the S&P 500, is likely to open in the lower part of a negatively skewed overnight inventory, outside of prior-range and -value, suggesting a potential for immediate directional opportunity.

In the best case, the S&P 500 trades higher.

Any activity above the $3,830.75 MCPOC puts into play the $3,867.25 LVNode. Initiative trade beyond the LVNode could reach as high as the $3,909.25 MCPOC and $3,943.25 HVNode, or higher.

In the worst case, the S&P 500 trades lower.

Any activity below the $3,830.75 MCPOC puts into play the $3,800.25 LVNode. Initiative trade beyond the LVNode could reach as low as the $3,774.75 HVNode and $3,755.00 VPOC, or lower.

Click here to load today’s key levels into the web-based TradingView charting platform. Note that all levels are derived using the 65-minute timeframe. New links are produced, daily.
Graphic: 65-minute profile chart of the Micro E-mini S&P 500 Futures.

Considerations: Responsiveness near key-technical areas (that are discernable visually on a chart), suggests technically-driven traders with short time horizons are very active. 

Such traders often lack the wherewithal to defend retests and, additionally, the type of trade may be indicative of the other time frame participants waiting for more information to initiate trades.

Example: The below 65-minute S&P 500 chart with volume profiles was included in the July 8, 2022 edition of the newsletter. Prices were near an inflection (micro-composite point of control and two key volume-weighted average price levels). From thereon, selling surfaced.

This is what is meant by responsiveness near key-technical areas.

Graphic: Updated 7/2/22. 65-minute profile chart of the Micro E-mini S&P 500 Futures.

Definitions

Volume Areas: A structurally sound market will build on areas of high volume (HVNodes). Should the market trend for long periods of time, it will lack sound structure, identified as low volume areas (LVNodes). LVNodes denote directional conviction and ought to offer support on any test. 

If participants were to auction and find acceptance into areas of prior low volume (LVNodes), then future discovery ought to be volatile and quick as participants look to HVNodes for favorable entry or exit.

POCs: POCs are valuable as they denote areas where two-sided trade was most prevalent in a prior day session. Participants will respond to future tests of value as they offer favorable entry and exit.

MCPOCs: POCs are valuable as they denote areas where two-sided trade was most prevalent over numerous day sessions. Participants will respond to future tests of value as they offer favorable entry and exit.

Volume-Weighted Average Prices (VWAPs): A metric highly regarded by chief investment officers, among other participants, for quality of trade. Additionally, liquidity algorithms are benchmarked and programmed to buy and sell around VWAPs.

About

After years of self-education, strategy development, mentorship, and trial-and-error, Renato Leonard Capelj began trading full-time and founded Physik Invest to detail his methods, research, and performance in the markets.

Capelj also develops insights around impactful options market dynamics at SpotGamma and is a Benzinga reporter.

Some of his works include conversations with ARK Invest’s Catherine Wood, investors Kevin O’Leary and John Chambers, FTX’s Sam Bankman-Fried, former Bridgewater Associate Andy Constan, Kai Volatility’s Cem Karsan, The Ambrus Group’s Kris Sidial, among many others.

Disclaimer

In no way should the materials herein be construed as advice. Derivatives carry a substantial risk of loss. All content is for informational purposes only.


Categories
Commentary

Daily Brief For July 11, 2022

The daily brief is a free glimpse into the prevailing fundamental and technical drivers of U.S. equity market products. Join the 300+ that read this report daily, below!

Graphic updated 7:00 AM ET. Sentiment Neutral if expected /ES open is inside of the prior day’s range. /ES levels are derived from the profile graphic at the bottom of the following section. Levels may have changed since initially quoted; click here for the latest levels. SqueezeMetrics Dark Pool Index (DIX) and Gamma (GEX) calculations are based on where the prior day’s reading falls with respect to the MAX and MIN of all occurrences available. A higher DIX is bullish. At the same time, the lower the GEX, the more (expected) volatility. Learn the implications of volatility, direction, and moneyness. Breadth reflects a reading of the prior day’s NYSE Advance/Decline indicator. VIX reflects a current reading of the CBOE Volatility Index (INDEX: VIX) from 0-100.

Fundamental

To start, thank you to the many new subscribers who joined in the past weeks. I’m honored.

Further, today we start broad (fundamental) and hone into specifics on how to act in the current trade environment (positioning), as well as potential inflection (technical) points.

I encourage you to read through to the technicals part, if possible. Have a great week!

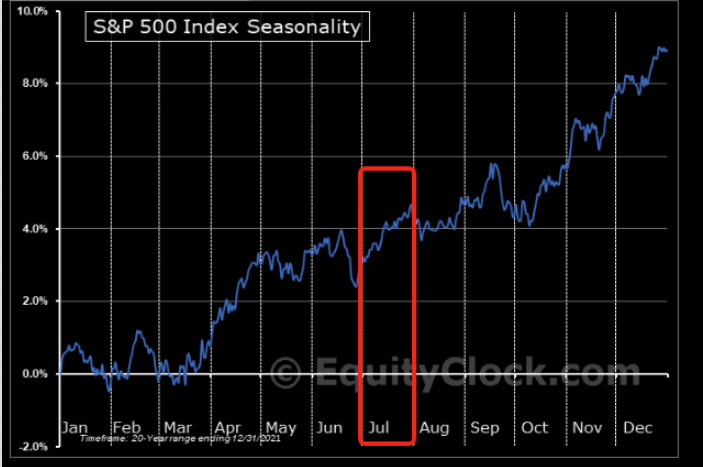
Seasonally speaking, the markets are in the midst of one of the most bullish periods of the year.

Graphic: Retrieved from The Market Ear.

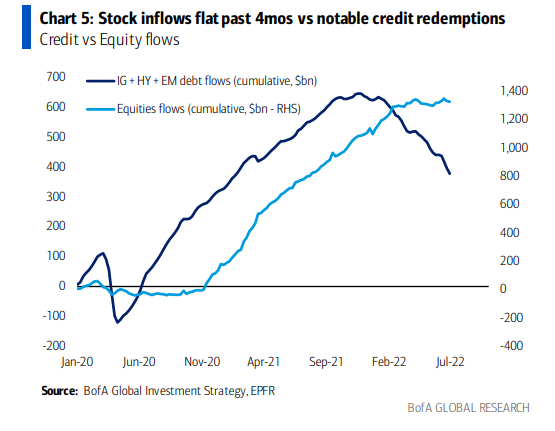
This is as stock market flows have yet to turn as they did for bonds months ago.

Graphic: Retrieved from Callum Thomas’ Topdown Charts. Via Bank of America Corporation (NYSE: BAC)

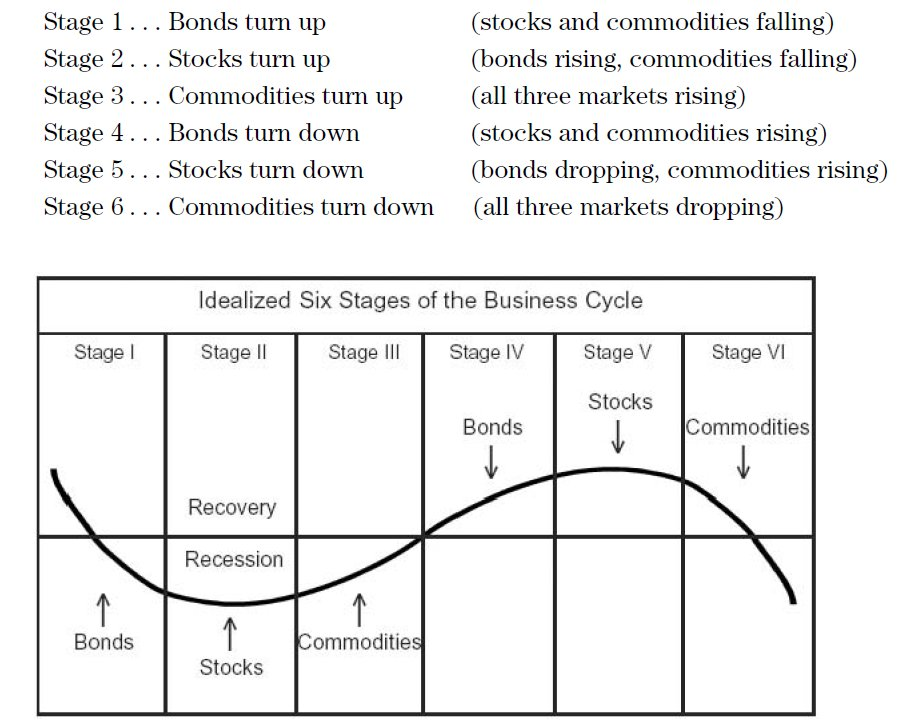
The cycle is as follows: typically bonds are the first to turn. Stocks and commodities follow. 

Graphic: Retrieved from @granthawkridge

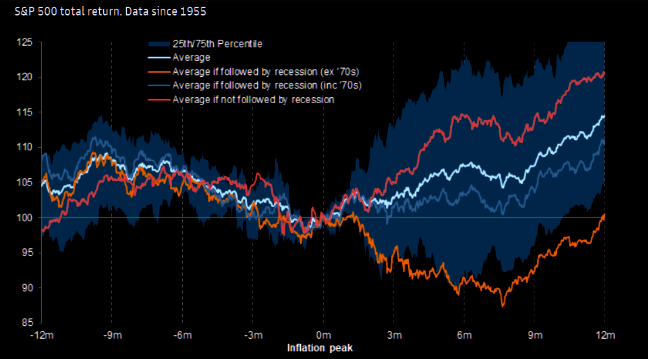
With bonds and equity products now off their swing lows and commodities off their highs (as inflation has, potentially, peaked), we have to question how much more?

Graphic: Retrieved from Goldman Sachs Group Inc (NYSE: GS).

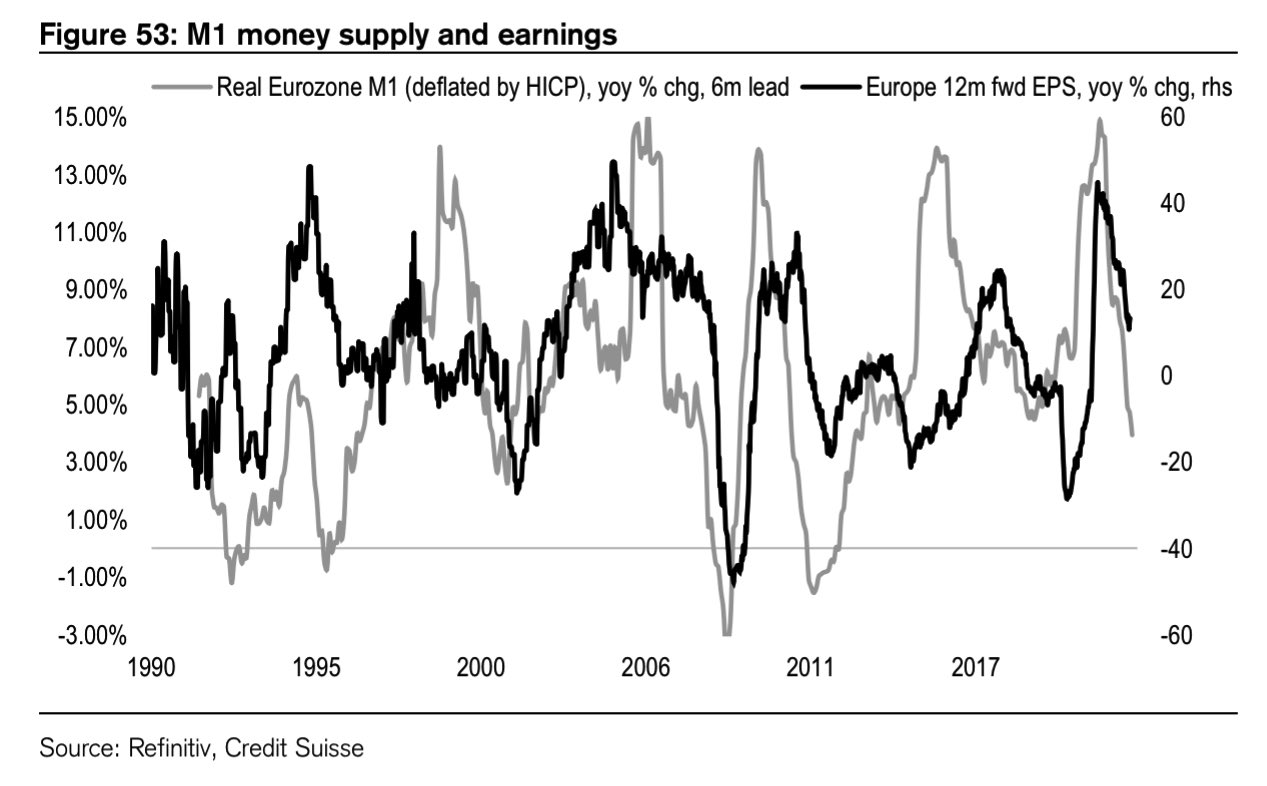
Well, thus far, and this is something we’ve talked about in the past, markets have suffered through compression in multiples. Does it stop or is there a looming earnings compression?

Graphic: Retrieved from Credit Suisse Group AG (NYSE: CS).

The earnings season shall shed clarity on the answer all the while – what is known – a strong dollar is sure to translate into a headwind for S&P 500 earnings growth.

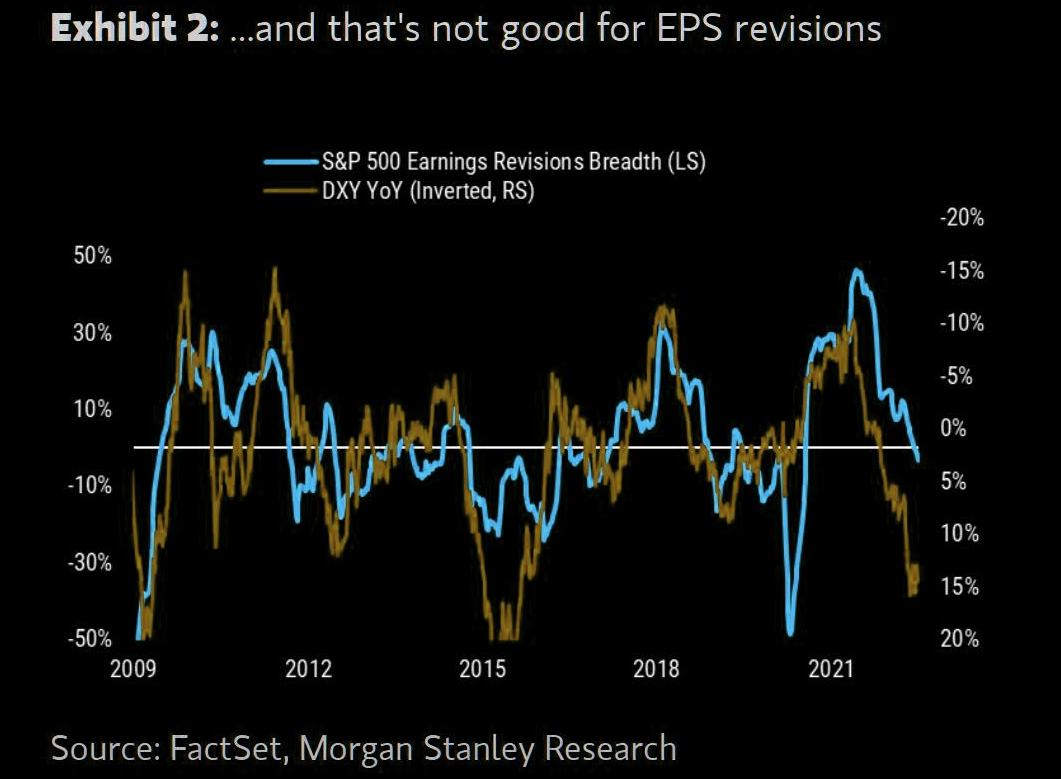
Graphic: Retrieved from The Market Ear. Via Morgan Stanley (NYSE: MS) research. “The simple math on S&P 500 earnings from currency is that for every percentage point increase on a year-on-year basis it’s approximately a 0.5xhit to EPS growth. At today’s 16% year-on-year level, that translates into an 8% headwind for S&P 500 EPS growth, all else equal”

“The main point for equity investors is that this dollar strength is just another reason to think earnings revisions are coming down,” Morgan Stanley’s Mike Wilson explains

“[T]he recent rally in stocks is likely to fizzle out before too long.”

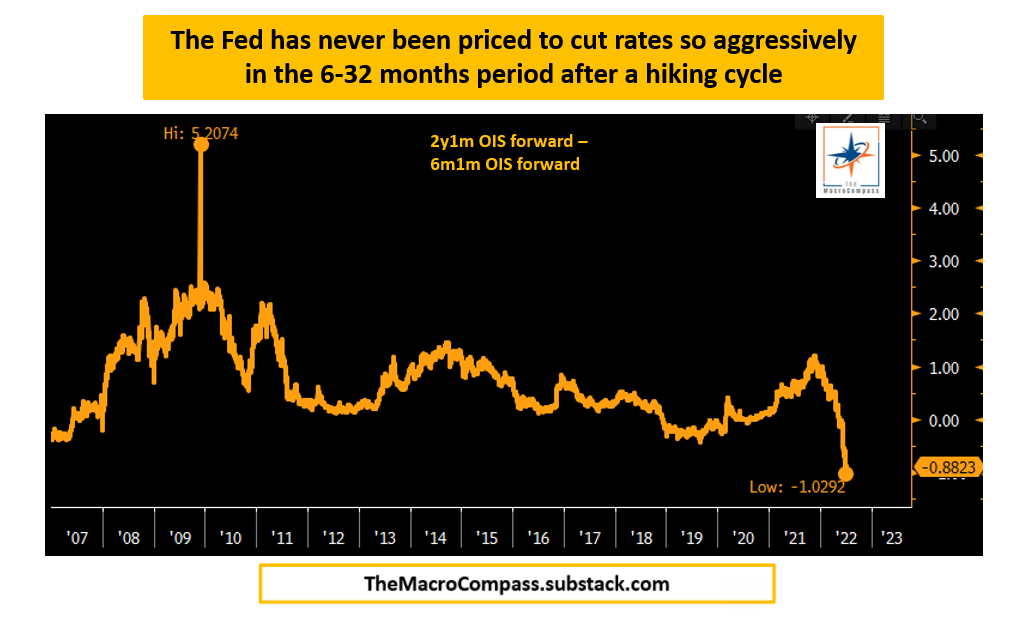
Moreover, with the impulse in credit falling, labor market showing preliminary signs of weakness, a drawdown in commodities (which is consistent with sharply lower economic growth), and bond market pricing rate cuts in early 2023, immediately following the hiking cycle, portfolios can “stay away from highly speculative assets, own USD cash and start allocating towards 5-10y+ government bonds,” as Alfonso Peccatiello explains well in his letter, The Macro Compass.

Graphic: Retrieved from The Macro Compass published by Alfonso Peccatiello.

Positioning

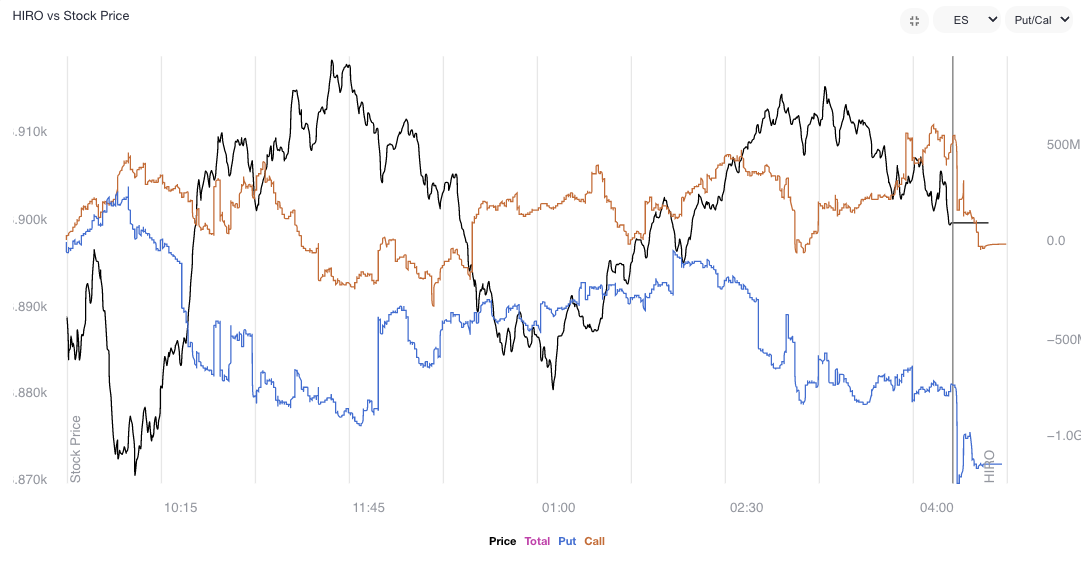
Calmer trade alongside easing volatility and generally rising gamma exposures. Trade, at times, was responsive. Participants would add positive (negative) delta bets into weakness (strength).

Graphic: Updated 7/8/2022. SpotGamma’s Hedging Impact of Real-Time Options (HIRO) indicator registers the sale of put (blue line) and call (orange) options.

Noteworthy is the continued sale of volatility, particularly across shorter time horizons, as well as increased demand for call options, especially in some of the larger index weights. Volatility sale, on the part of customers, leaves liquidity providers warehousing long volatility (which is kind of a naive thing to say as we’re discounting customer trades being paired off with each other).

Nonetheless, these liquidity providers’ positions, all else equal, will maintain or increase in value if underlying(s) realize volatility (especially that far in excess of implied). To hedge, rips (dips) will be sold (bought) to offset the increasing positive (negative) delta.

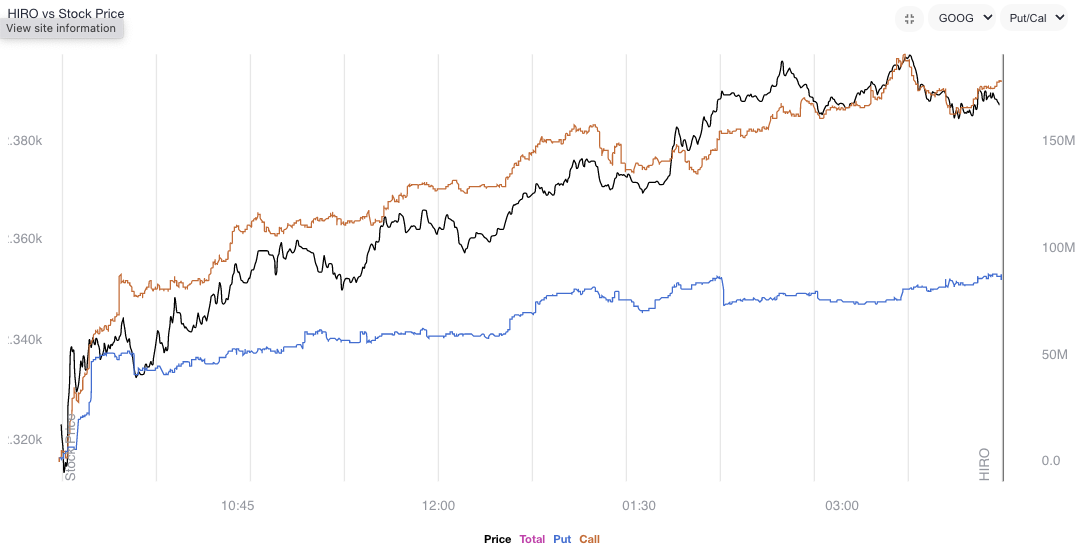
Graphic: Updated 7/7/2022. SpotGamma’s HIRO indicator for Alphabet Inc (NASDAQ: GOOG) (NASDAQ: GOOGL). Rising orange and blue lines point to call buying and put selling, both of which have bullish implications.

Moreover, this trend in volatility supply is in part on the loss of interest in “leveraged long S&P” trades, as well as “marginal demand for puts,” as SqueezeMetrics has stated, before.

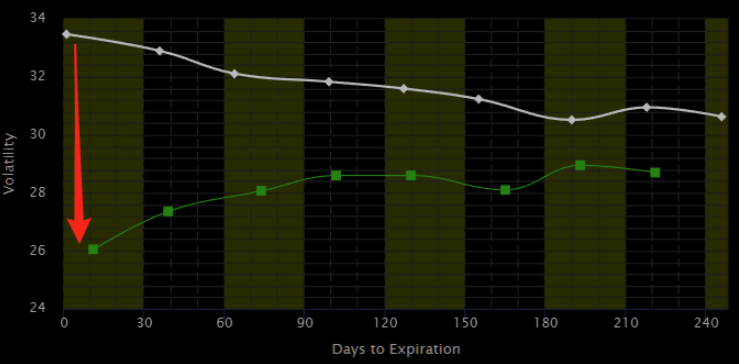
Graphic: Retrieved from The Market Ear. Originally sourced via VIX Central. “Chart shows the VIX term structure ‘crash’ since June 13, which was the most recent VIX peak. The curve is now back to normal with the short end of the curve ‘much’ lower than longer-term maturities. Let’s see how far down they ‘press’ this.”

“Creeping into net selling territory is ‘smart’ bear market positioning. Short delta, short skew.”

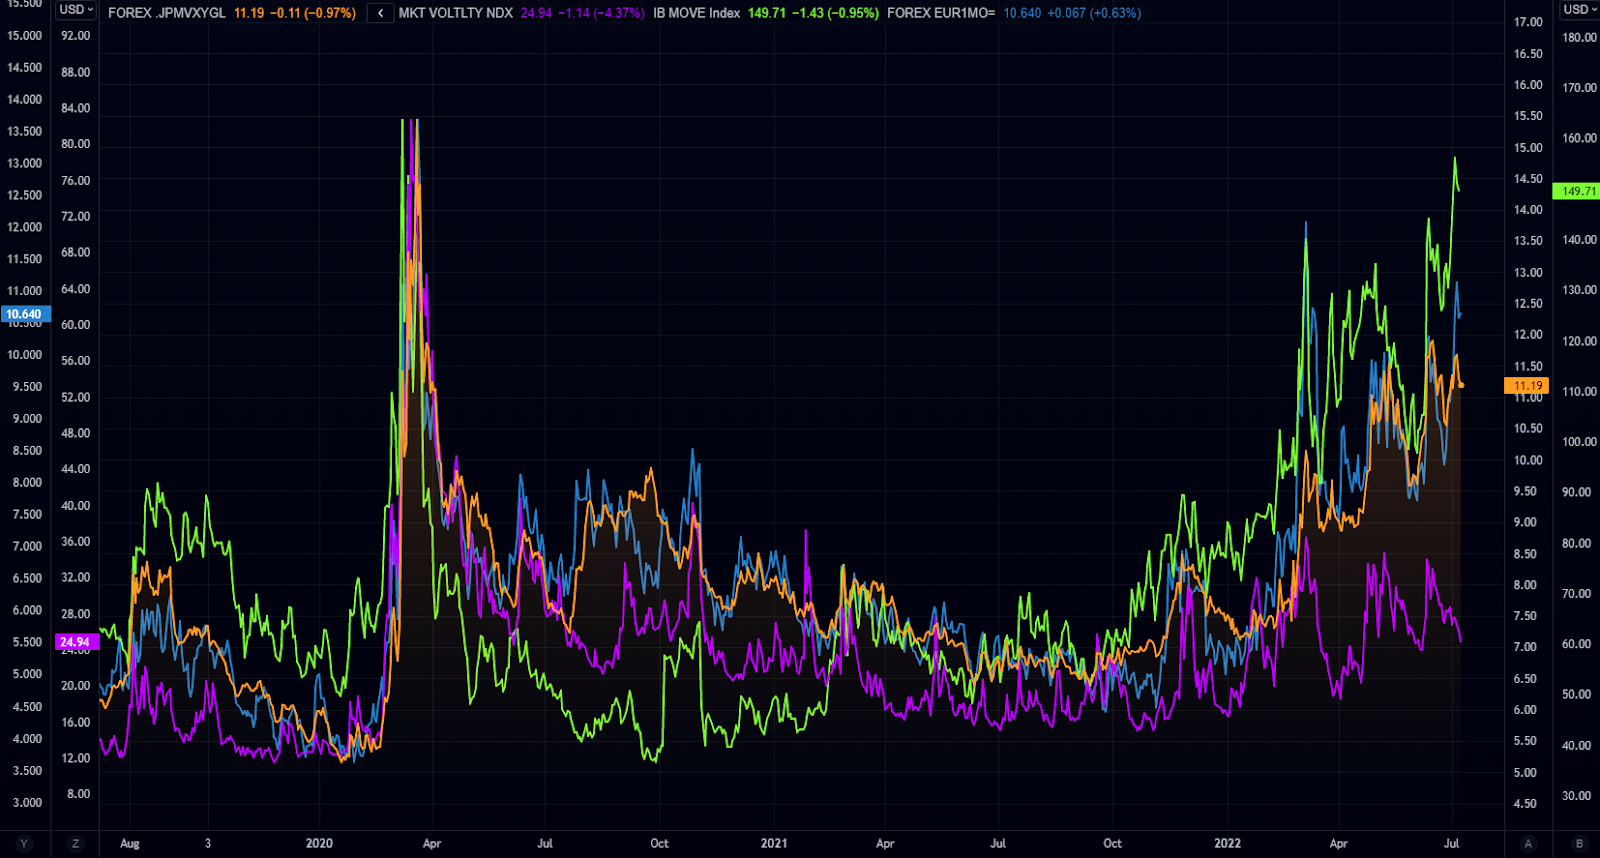
Graphic: Retrieved from The Market Ear. “VIX has decoupled from cross-asset volatilities.”

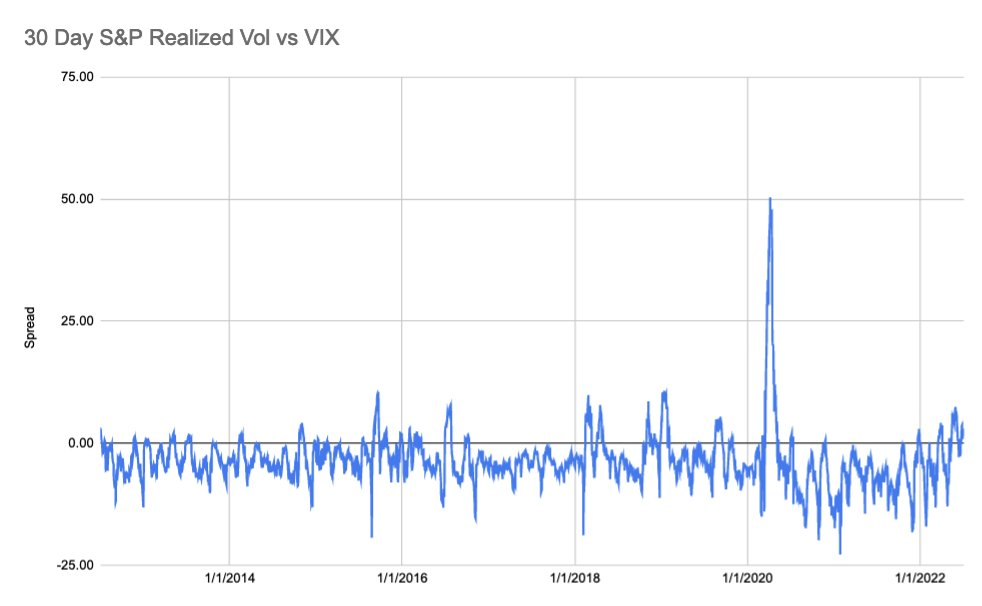
Accordingly, the volatility markets have realized (RVOL) has crept (and exceeded, at times) the volatility implied (IVOL). 

Graphic: Via S&P Global. As explained by SpotGamma, “30-day realized SPX volatility is now trading above the VIX, something that generally shows after major selloffs wherein IV “premium” needs to reset to calmer/higher equity markets.”

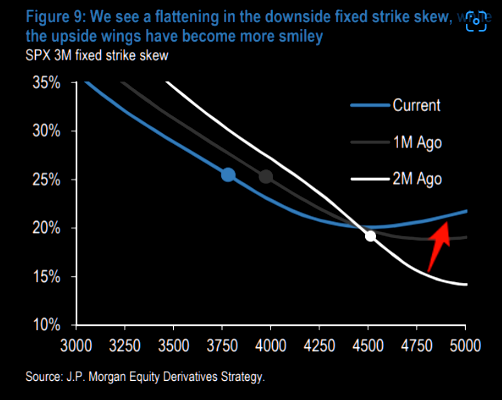
This, coupled with “a flattening in the downside fixed strike skew, while the upside wings [are] more smiley,” as described by JPMorgan Chase & Co (NYSE: JPM), has made for attractive low-cost spread opportunities, as talked about in the July 8, 2022 letter.

Graphic: Via JPMorgan Chase & Co (NYSE: JPM). Taken from The Market Ear.

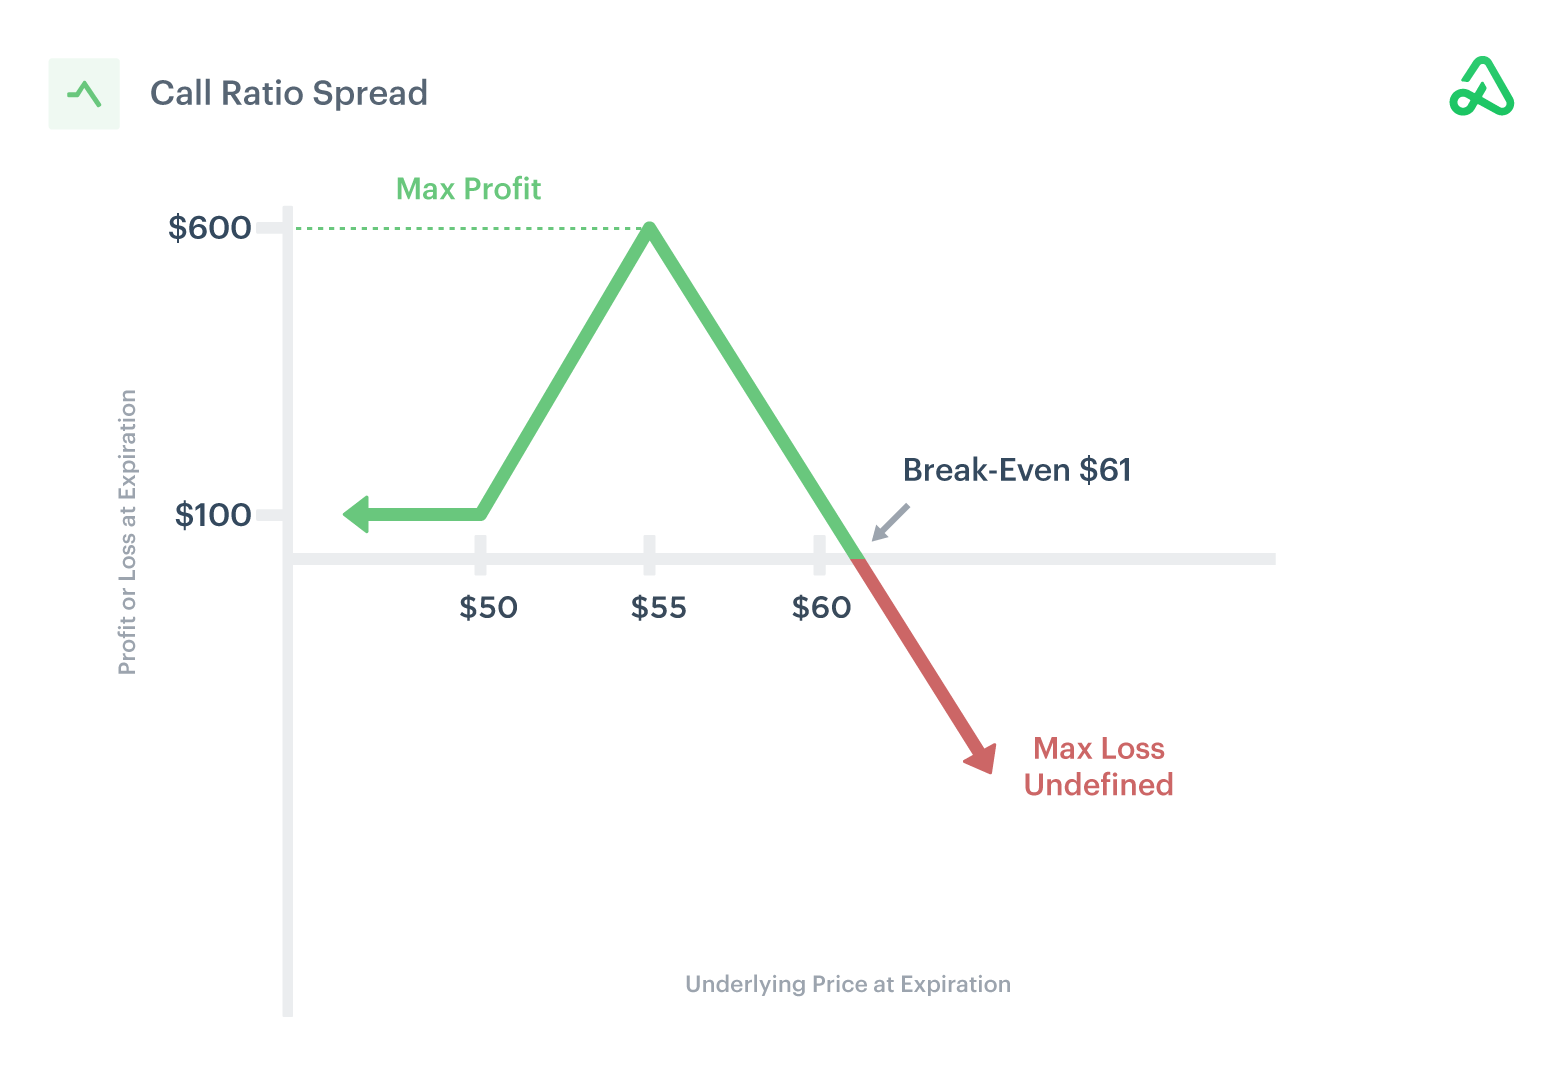
For instance, as discussed Friday, ratio spreads continue to work well for low- or no-cost exposure to the upside. 

Graphic: Via Option Alpha.

Pursuant to those remarks, no-cost spreads this letter’s writer has structured in Alphabet Inc (NASDAQ: GOOG) (NASDAQ: GOOGL) are pricing hundreds of dollars in credit to close.

Graphic: Via Charles Schwab Corporation-owned (NYSE: SCHW) TD Ameritrade’s Thinkorswim. 

Obviously, there’s no mention, here, of the risk management (e.g., sizing and width) involved. Again, this is as I’m trying to give actionable info without providing explicit recommendations.

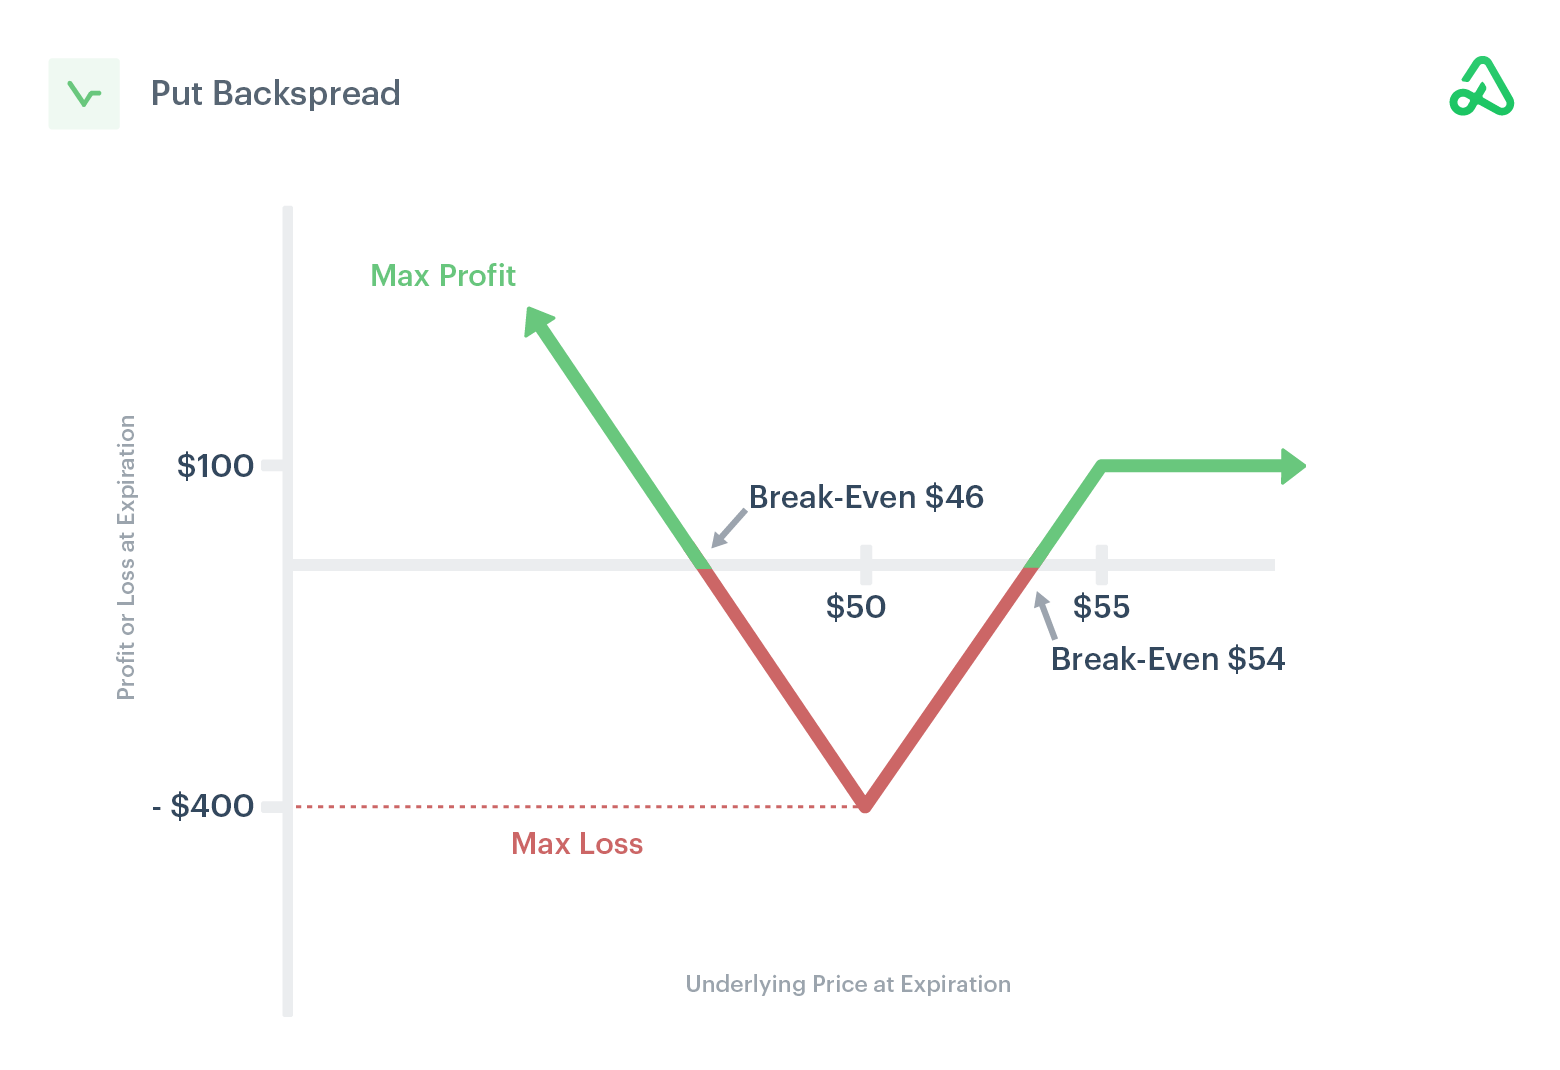
Similarly, if one thought volatility, though at a high starting point particularly at the money (ATM), was due for a repricing, they would look for exposure to the downside via something such as an inverse ratio (or back spread), as said last week.

Graphic: Via Option Alpha.

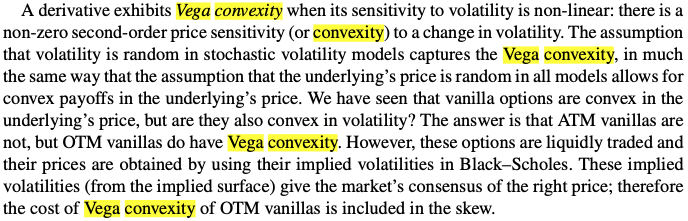
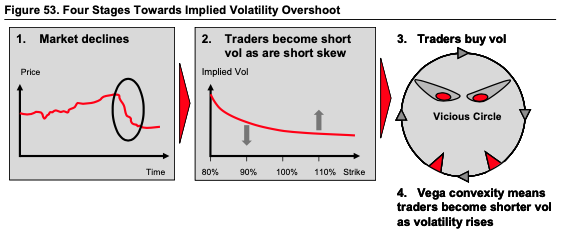
This is as the ATMs, unlike those further out of the money (OTM), are less convex in vega.

Graphic: Via Mohamed Bouzoubaa et al’s Exotic Options and Hybrids.

Technical

As of 7:00 AM ET, Monday’s regular session (9:30 AM – 4:00 PM ET), in the S&P 500, is likely to open in the middle-to-lower part of a negatively skewed overnight inventory, inside of prior-range and -value, suggesting a limited potential for immediate directional opportunity.

In the best case, the S&P 500 trades higher.

Any activity above the $3,867.25 LVNode puts into play the $3,909.25 MCPOC. Initiative trade beyond the MCPOC could reach as high as the $3,943.25 HVNode and $3,982.75 LVNode, or higher.

In the worst case, the S&P 500 trades lower.

Any activity below the $3,867.25 LVNode puts into play the $3,831.00 VPOC. Initiative trade beyond the VPOC could reach as low as the $3,800.25 LVNode and $3,755.00 VPOC, or lower.

Click here to load today’s key levels into the web-based TradingView charting platform. Note that all levels are derived using the 65-minute timeframe. New links are produced, daily.
Graphic: 65-minute profile chart of the Micro E-mini S&P 500 Futures.

Considerations: Responsiveness near key-technical areas (that are discernable visually on a chart), suggests technically-driven traders with short time horizons are very active. 

Such traders often lack the wherewithal to defend retests and, additionally, the type of trade may be indicative of the other time frame participants waiting for more information to initiate trades.

Example: The below 65-minute S&P 500 chart with volume profiles was included in the July 8, 2022 edition of the newsletter. Prices were near an inflection (micro-composite point of control and two key volume-weighted average price levels). From thereon, selling surfaced.

This is what is meant by responsiveness near key-technical areas.
Graphic: Updated 7/2/22. 65-minute profile chart of the Micro E-mini S&P 500 Futures.

Definitions

Volume Areas: A structurally sound market will build on areas of high volume (HVNodes). Should the market trend for long periods of time, it will lack sound structure, identified as low volume areas (LVNodes). LVNodes denote directional conviction and ought to offer support on any test. 

If participants were to auction and find acceptance into areas of prior low volume (LVNodes), then future discovery ought to be volatile and quick as participants look to HVNodes for favorable entry or exit.

POCs: POCs are valuable as they denote areas where two-sided trade was most prevalent in a prior day session. Participants will respond to future tests of value as they offer favorable entry and exit.

MCPOCs: POCs are valuable as they denote areas where two-sided trade was most prevalent over numerous day sessions. Participants will respond to future tests of value as they offer favorable entry and exit.

Volume-Weighted Average Prices (VWAPs): A metric highly regarded by chief investment officers, among other participants, for quality of trade. Additionally, liquidity algorithms are benchmarked and programmed to buy and sell around VWAPs.

About

After years of self-education, strategy development, mentorship, and trial-and-error, Renato Leonard Capelj began trading full-time and founded Physik Invest to detail his methods, research, and performance in the markets.

Capelj also develops insights around impactful options market dynamics at SpotGamma and is a Benzinga reporter.

Some of his works include conversations with ARK Invest’s Catherine Wood, investors Kevin O’Leary and John Chambers, FTX’s Sam Bankman-Fried, former Bridgewater Associate Andy Constan, Kai Volatility’s Cem Karsan, The Ambrus Group’s Kris Sidial, among many others.

Disclaimer

In no way should the materials herein be construed as advice. Derivatives carry a substantial risk of loss. All content is for informational purposes only.

Categories
Commentary

Daily Brief For May 24, 2022

The daily brief is a free glimpse into the prevailing fundamental and technical drivers of U.S. equity market products. Join the 300+ that read this report daily, below!

What Happened

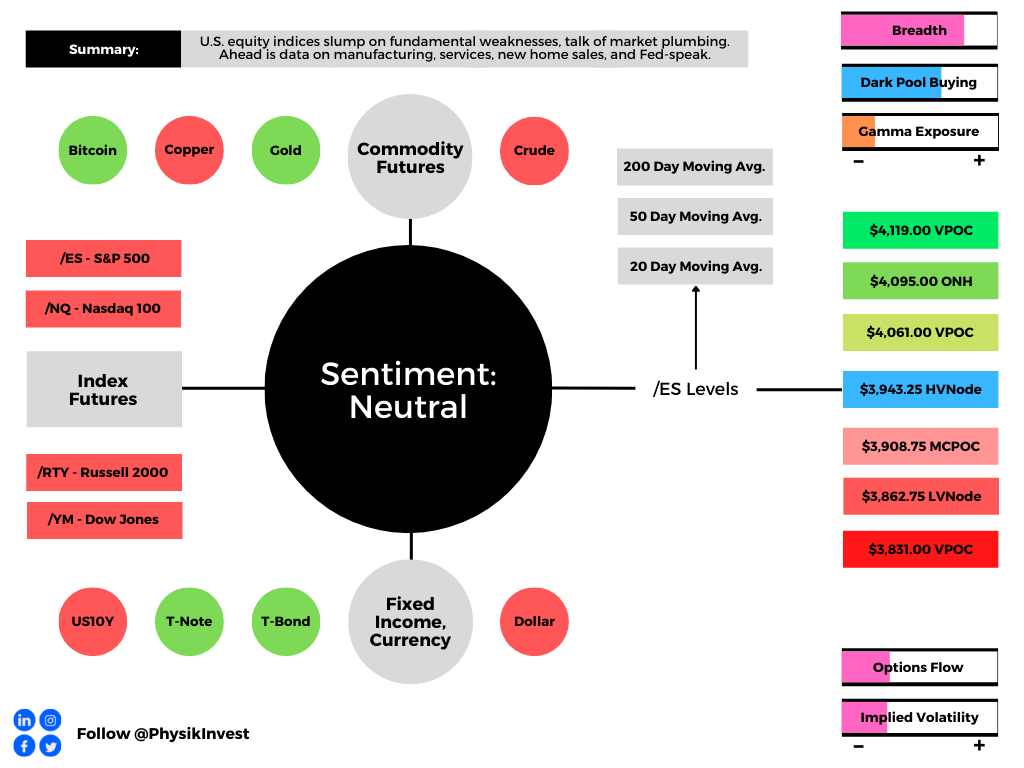
Overnight, equity index futures softened after what appeared to be continued covering of shorts into Monday’s close. Commodities were mixed, bonds higher, and implied volatility higher.

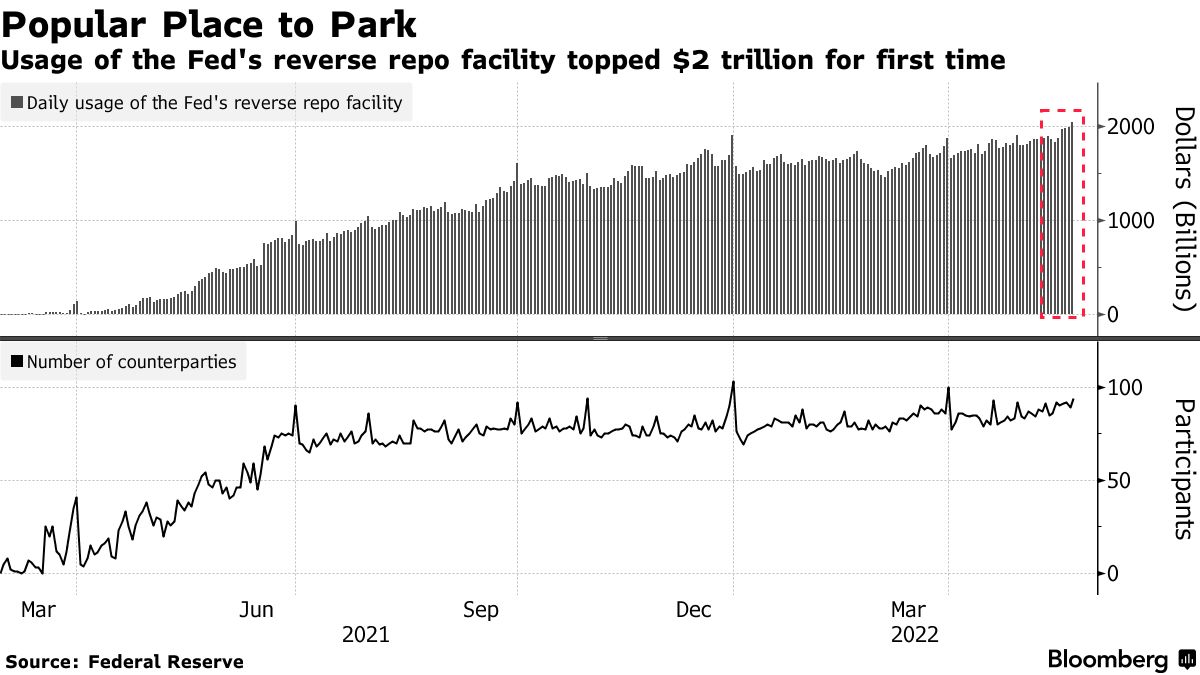
In the news the amount of money parked at major Federal Reserve facilities climbed to another all-time high, passing $2 trillion. JPMorgan Chase & Co’s (NYSE: JPM) CEO Jamie Dimon said recently that the Fed must do quantitative tightening since there’s too much liquidity in the pipes.

Adding, the Fed’s Raphael Bostic said policymakers may hike rates by 0.50 basis points after their next two meetings before pausing in September to allow for observation. This is as banks UBS Group AG (NYSE: UBS) and JPMorgan Chase & Co cut their expectations for growth here and abroad.

Ahead is data on S&P Global Inc (NYSE: SPGI) manufacturing and services (9:45 AM ET). Later, participants get updates on new home sales (10:00 AM ET) and Fed-speak by Chair Jerome Powell. Later this week, on Wednesday, participants will receive minutes of the Fed’s most recent meeting which may provide further insight into the central bank’s intent to tighten.

Graphic updated 6:15 AM ET. Sentiment Neutral if expected /ES open is inside of the prior day’s range. /ES levels are derived from the profile graphic at the bottom of the following section. Levels may have changed since initially quoted; click here for the latest levels. SqueezeMetrics Dark Pool Index (DIX) and Gamma (GEX) calculations are based on where the prior day’s reading falls with respect to the MAX and MIN of all occurrences available. A higher DIX is bullish. At the same time, the lower the GEX, the more (expected) volatility. Learn the implications of volatility, direction, and moneyness. SHIFT data used for S&P 500 (INDEX: SPX) options activity. Note that options flow is sorted by the call premium spent; if more positive, then more was spent on call options. Breadth reflects a reading of the prior day’s NYSE Advance/Decline indicator. VIX reflects a current reading of the CBOE Volatility Index (INDEX: VIX) from 0-100.

What To Expect

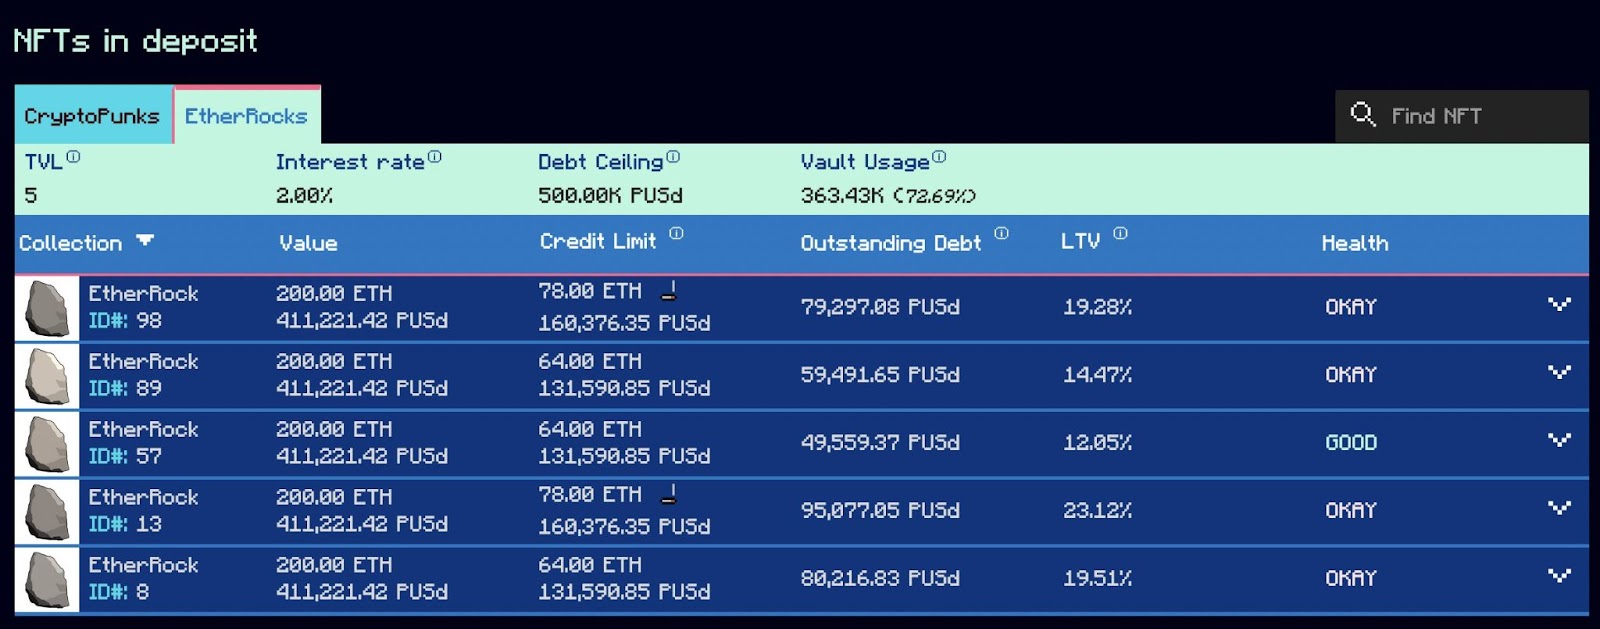
Fundamental: So long as market participants are using JPEG images of rocks as collateral for debt, it is likely we have not reached a more permanent bottom in the broad market. 

Kidding – just trying to lighten the mood, haha! Sorry to my crypto friends! 

For real, though, maybe the destruction of that market is what we’re to watch for.
Graphic: Via Corey Hoffstein. “You call it ‘tulip mania,’ but I’m gonna need to see evidence that the Dutch set up lending markets where they used paintings of rocks as collateral.”

Support of market excesses was liquidity in the financial system, a lot of which is now piling into the Fed’s overnight reverse repurchase agreement facility (RRPs).

Graphic: Via Bloomberg. Per the Federal Reserve Bank of New York: “A reverse repurchase agreement conducted by the Desk, also called a “reverse repo” or “RRP,” is a transaction in which the Desk sells a security to an eligible counterparty with an agreement to repurchase that same security at a specified price at a specific time in the future. The difference between the sale price and the repurchase price, together with the length of time between the sale and purchase, implies a rate of interest paid by the Federal Reserve on the transaction.”

Since the start of the year, however, the anticipation and pricing in of the removal of some of this liquidity have fed into market weaknesses.

Per the Damped Spring Advisors’ Andy Constan, the “Fed will reduce their balance sheet by choosing not to reinvest the proceeds of maturity payments of existing holdings back into the market. The U.S. Treasury will need to find new buyers for the bonds it issues.”

Please read our Daily Brief For May 5, 2022, here, for more on the Federal Reserve’s updates.

On June 1, the Fed will start the process of balance sheet reduction at $47.5 billion ($30B UST and $17.5B MBS) a month for the first three months. This will increase to $95 billion ($60B UST and $35B MBS), after, about double the maximum pace of $50 billion a month in 2017-2019.

Constan adds: “In June, that supply those markets will need to absorb will be $50 billion USD and will grow to $95 billion (of which some will be outright sales of mortgages by the Fed).”

Accordingly, “[j]ust as USD strength occurred as global investors chased U.S. assets, as the U.S. economy led the global economy out of the Covid chasm, the next leg of asset returns is more likely in countries that remain relatively easy and where the economy is still lagging.”

Goldman Sachs Group Inc’s (NYSE: GS) Vickie Chang notes: “Using history as a guide, in order for equities to come off their recent lows (and stop declining), this kind of monetary-tightening induced contraction is most likely to end when the Fed itself shifts.” 

“It may be that the market needs to see signs of the inflation deceleration that our US economists expect in the second half of the year in order to see sustained relief.”

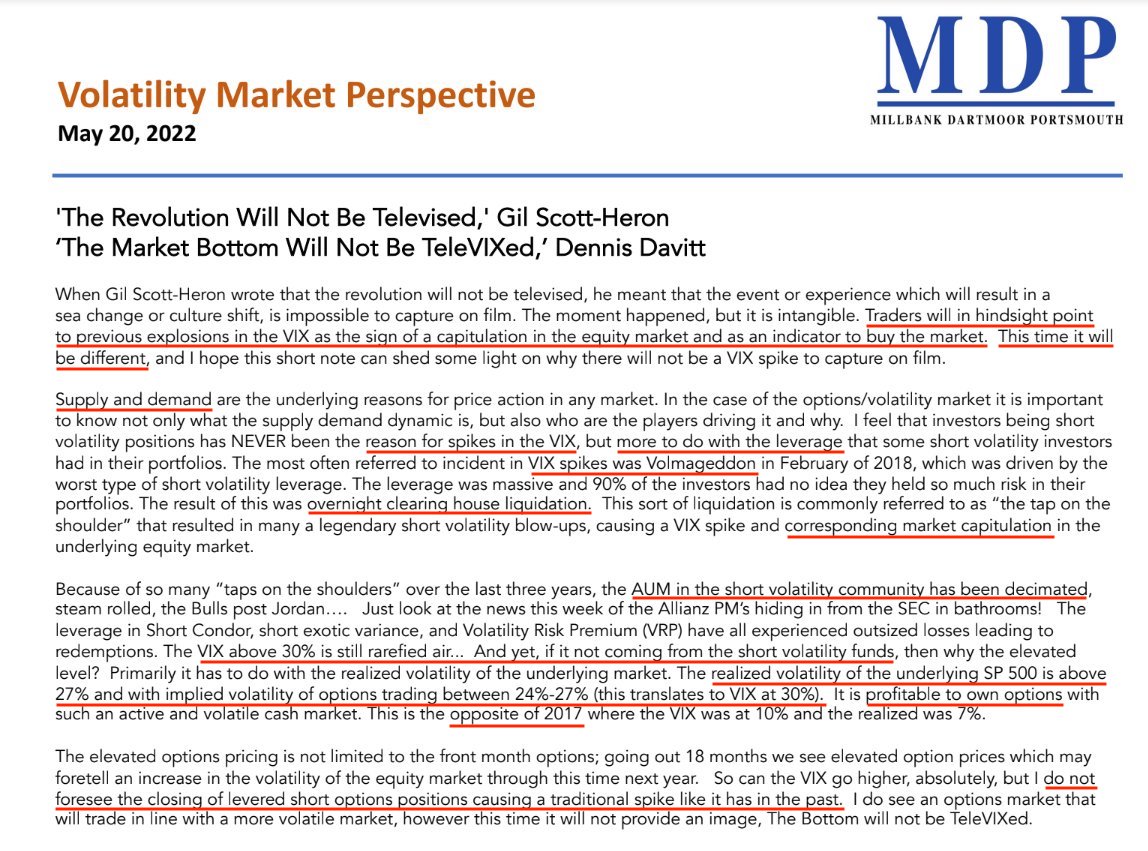
Positioning: Pursuant to comments established last week, Dennis Davitt of Millbank Dartmoor Portsmouth explains that the “realized volatility of the underlying S&P 500 is above 27% … with implied volatility of options trading between 24%-27%,” which translates to a VIX at 30%.

“It is profitable to own options with such an active and volatile cash market. This is the opposite of 2017 where the VIX was at 10% and the realized was 7%,” a trade that leverage poured into and resulted in the spectacular short-volatility ‘Volmageddon’ blow-up in February of 2018.

Graphic: Via Banco Santander SA (NYSE: SAN) research.

What does this mean?

Davitt concludes that “18 months” out there are “elevated option prices which may foretell an increase in the volatility of the equity market through this time next year.”

Though the Cboe Volatility Index (INDEX: VIX) may print higher, it is likely that it does not spike and point to an immediate market bottom, all else equal, like it has in the very near past.

Graphic: Via Millbank Dartmoor Portsmouth.

How to play?

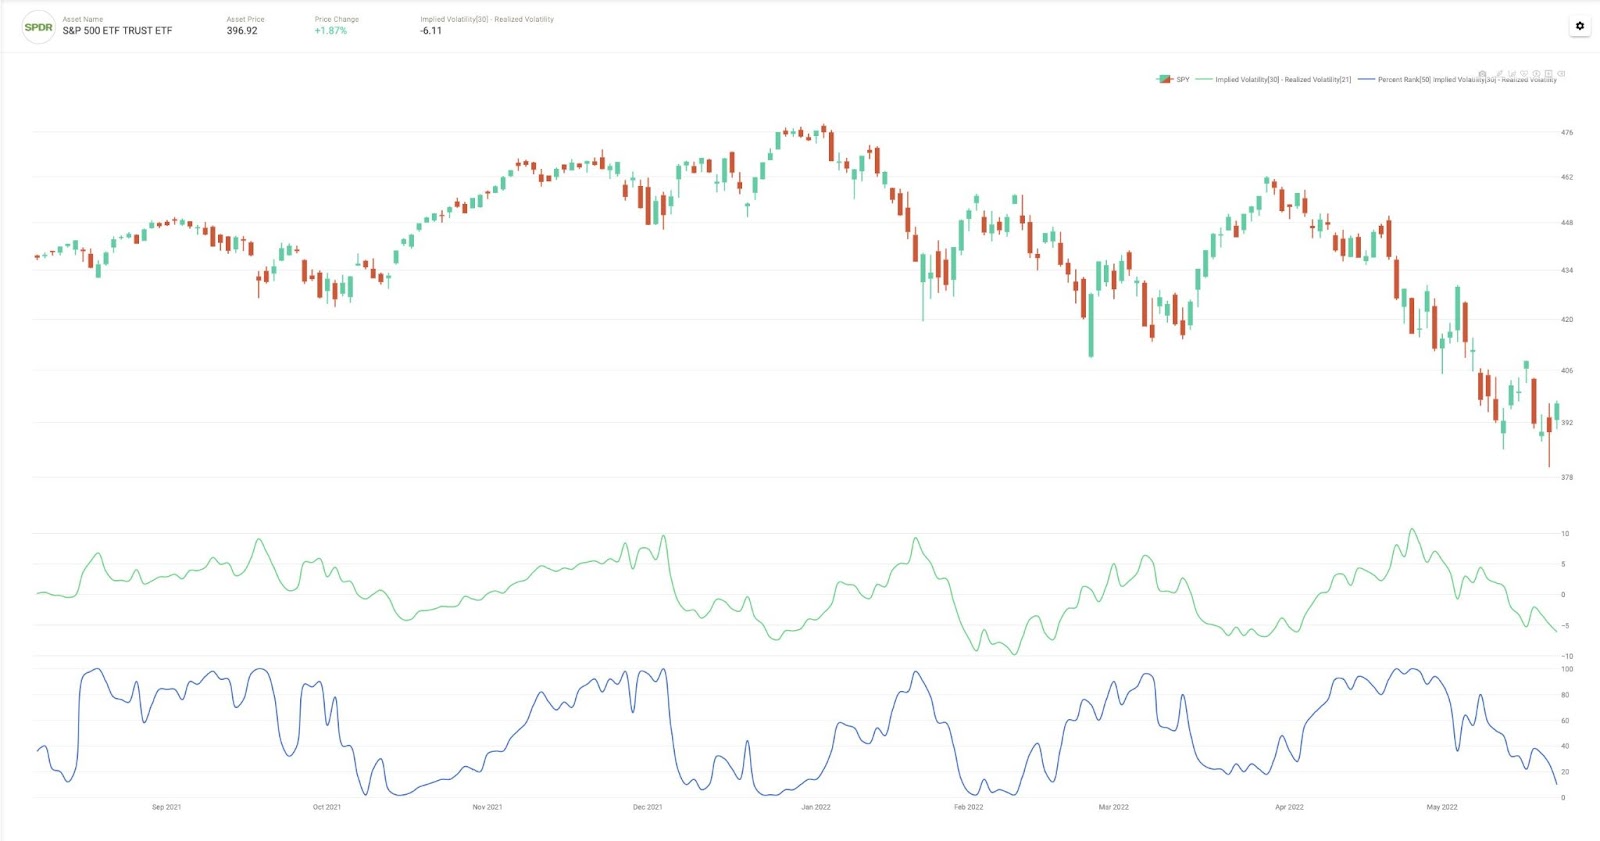
It makes more sense to have exposure to underlying markets, synthetically (i.e., own options). This is based on the current relationship between realized and implied volatility.

Graphic: Via Robson Chow, founder at Tradewell. “The spread between IV and RV remains quite low relative to the past 50 trading days and 1st decile in the historical data.  It is printing where, historically, the most forward realized volatility and the weakest relative mean returns over the next 60 days can be expected.”

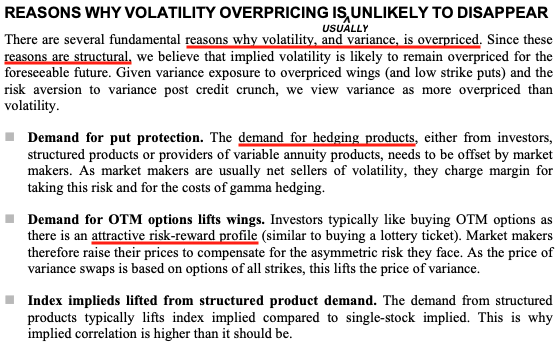
This is in contrast to the thesis that “long volatility is a poor equity hedge” because, on average, it’s overpriced and has less than a 100% negative correlation with the equity market.

Graphic: Via Banco Santander SA (NYSE: SAN) research.

Given fundamental contexts, many foresee continued weaknesses. Notwithstanding, markets are stretched to the downside and the path of least resistance, based on prior comments, is up.

This is with the caveat that traders should look at the current window of time as a period during which markets have less pressure to rally against. Per SpotGamma, this is due to the put-heavy options expiration (OPEX), Friday. 

Still, the rally into Monday “pulled forward some of the energy from [those] options that were to roll off,” and now, participants are “much less hedged than they were.” Should demand return, that will bid options prices and likely solicit liquidity provider pressures which, all else equal, start to cool into the $3,700.00 S&P 500 area.

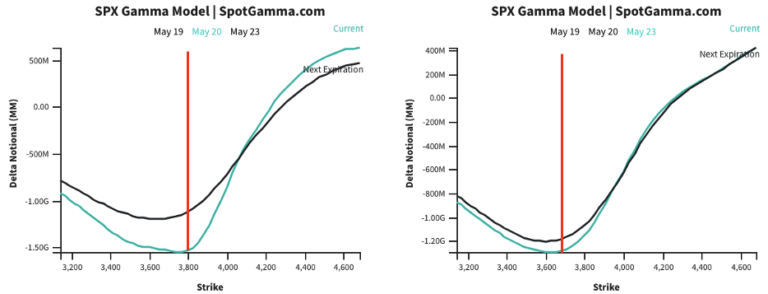
Graphic: Via SpotGamma.

Technical: As of 6:15 AM ET, Tuesday’s regular session (9:30 AM – 4:00 PM ET), in the S&P 500, will likely open in the middle part of a negatively skewed overnight inventory, inside of prior-range and -value, suggesting a limited potential for immediate directional opportunity.

In the best case, the S&P 500 trades higher; activity above the $3,943.25 HVNode puts in play the $3,969.00 VPOC. Initiative trade beyond the VPOC could reach as high as the $4,061.00 VPOC and $4,095.00 ONH, or higher.

In the worst case, the S&P 500 trades lower; activity below the $3,943.25 HVNode puts in play the $3,908.75 MCPOC. Initiative trade beyond the MCPOC could reach as low as the $3,862.75 LVNode and $3,831.00 VPOC, or lower.

Click here to load today’s key levels into the web-based TradingView charting platform. Note that all levels are derived using the 65-minute timeframe. New links are produced, daily.
Graphic: 65-minute profile chart of the Micro E-mini S&P 500 Futures.

Considerations: Push-and-pull, as well as responsiveness near key-technical areas (discernable visually on a chart), suggests technically-driven traders with shorter time horizons are very active.

Such traders often lack the wherewithal to defend retests.

Large participants (who often move by committee) seldom respond to key technical inflections. It is their activity that often results in poor reliability of our technical levels.

Sometimes, the better trade is to wait for the larger participants’ entry and use the expansion of the range as a confirmation of a new trend.

Catalysts to consider include the release of Federal Open Market Committee (FOMC) minutes, Wednesday.

Definitions

Overnight Highs And Lows (ONH and ONL): Typically, there is a low historical probability associated with overnight rally-highs (lows) ending the upside (downside) discovery process.

Volume Areas: A structurally sound market will build on areas of high volume (HVNodes). Should the market trend for long periods of time, it will lack sound structure, identified as low volume areas (LVNodes). LVNodes denote directional conviction and ought to offer support on any test. 

If participants were to auction and find acceptance into areas of prior low volume (LVNodes), then future discovery ought to be volatile and quick as participants look to HVNodes for favorable entry or exit.

POCs: POCs are valuable as they denote areas where two-sided trade was most prevalent in a prior day session. Participants will respond to future tests of value as they offer favorable entry and exit.

MCPOCs: POCs are valuable as they denote areas where two-sided trade was most prevalent over numerous day sessions. Participants will respond to future tests of value as they offer favorable entry and exit.

About

After years of self-education, strategy development, mentorship, and trial-and-error, Renato Leonard Capelj began trading full-time and founded Physik Invest to detail his methods, research, and performance in the markets.

Capelj also develops insights around impactful options market dynamics at SpotGamma and is a Benzinga reporter.

Some of his works include conversations with ARK Invest’s Catherine Wood, investors Kevin O’Leary and John Chambers, FTX’s Sam Bankman-Fried, Kai Volatility’s Cem Karsan, The Ambrus Group’s Kris Sidial, among many others.

Disclaimer

In no way should the materials herein be construed as advice. Derivatives carry a substantial risk of loss. All content is for informational purposes only.