Categories
Commentary

Daily Brief For October 15, 2021

Editor’s Note: Yesterday, it came to my attention that the top-most graphic quoted outdated levels. Great time for that to happen, knowing that all upside levels came into play, haha!

My apologies for failing to update that graphic, properly. In the future, if you have concerns over levels, scroll to the bottom where you see the text: “Click here to load today’s updated real-time key levels.” By clicking, you will be directed to a real-time, updated TradingView chart.

If any other questions (or you simply want to stay in touch throughout the session), email me at renato@physikinvest.com. Happy trading!

Market Commentary

Equity index futures trade sideways to higher with most commodities. Volatility ebbs.

  • Strong balance sheets, investment, labor.
  • Ahead: Retail sales, sentiment, and more.
  • Positioning for responsive trade, balance.

What Happened: U.S. stock index futures auctioned sideways to higher overnight alongside reports the economy will be supported by consumer balance sheets, business investment, and a healthy labor market.

Ahead is data on retail sales, the Import Price Index, the Empire State Index (8:30 AM ET), University of Michigan consumer sentiment and business inventories (10:00 AM ET), as well as Fed-speak by John Williams (12:20 PM ET). 

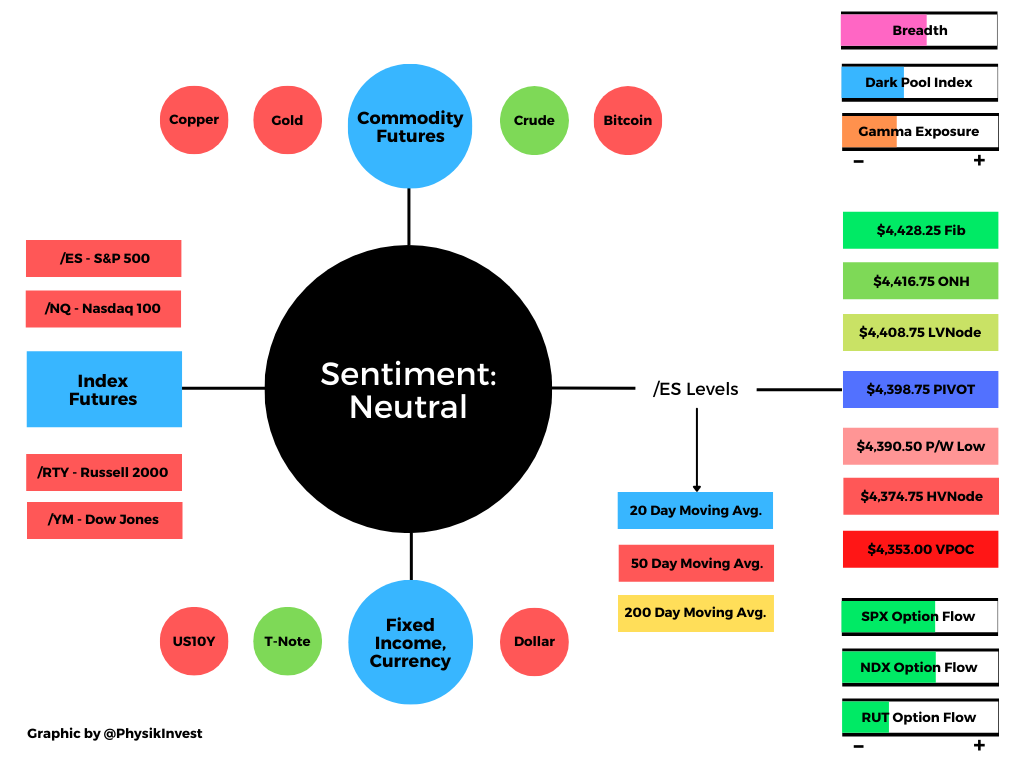
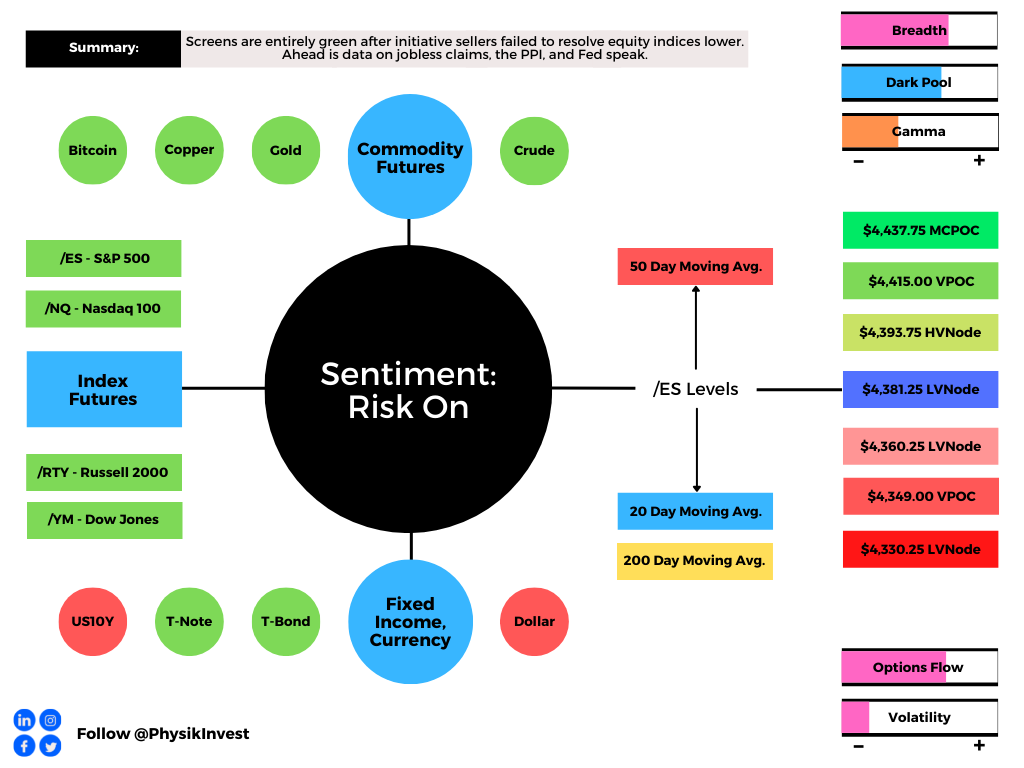
Graphic updated 6:00 AM ET. Sentiment Risk-On if expected /ES open is above the prior day’s range. /ES levels are derived from the profile graphic at the bottom of the following section. Levels may have changed since initially quoted; click here for the latest levels. SqueezeMetrics Dark Pool Index (DIX) and Gamma (GEX) calculations are based on where the prior day’s reading falls with respect to the MAX and MIN of all occurrences available. A higher DIX is bullish. At the same time, the lower the GEX, the more (expected) volatility. SHIFT data used for S&P 500 (INDEX: SPX) options activity. Note that options flow is sorted by the call premium spent; if more positive then more was spent on call options. Breadth reflects a reading of the prior day’s NYSE Advance/Decline indicator. VIX reflects a current reading of the CBOE Volatility Index (INDEX: VIX) from 0-100.

What To Expect: As of 6:30 AM ET, Friday’s regular session (9:30 AM – 4:00 PM EST) in the S&P 500 will likely open outside of prior-range and -value, suggesting a potential for immediate directional opportunity.

Gap Scenarios: Gaps ought to fill quickly. Should they not, that’s a signal of strength; do not fade. Leaving value behind on a gap-fill or failing to fill a gap (i.e., remaining outside of the prior session’s range) is a go-with indicator.

Auctioning and spending at least 1-hour of trade back in the prior range suggests a lack of conviction; in such a case, do not follow the direction of the most recent initiative activity.

Adding, during the prior day’s regular trade, on strong intraday breadth and divergent market liquidity metrics, the best case outcome occurred

After numerous sessions of a minimum separation in value (i.e., the area where 70% of the day’s volume occurred) failed to support downside price discovery, equity index futures established a rounded bottom before initiative buyers expanded range and value the opposite way.

In light of the recovery process, the S&P 500 – as evidenced by p-shaped emotional, multiple-distribution profile structures – finished, yesterday, just short of the $4,437.75 micro composite point of control (MCPOC) as momentum faded at key areas of resting liquidity.
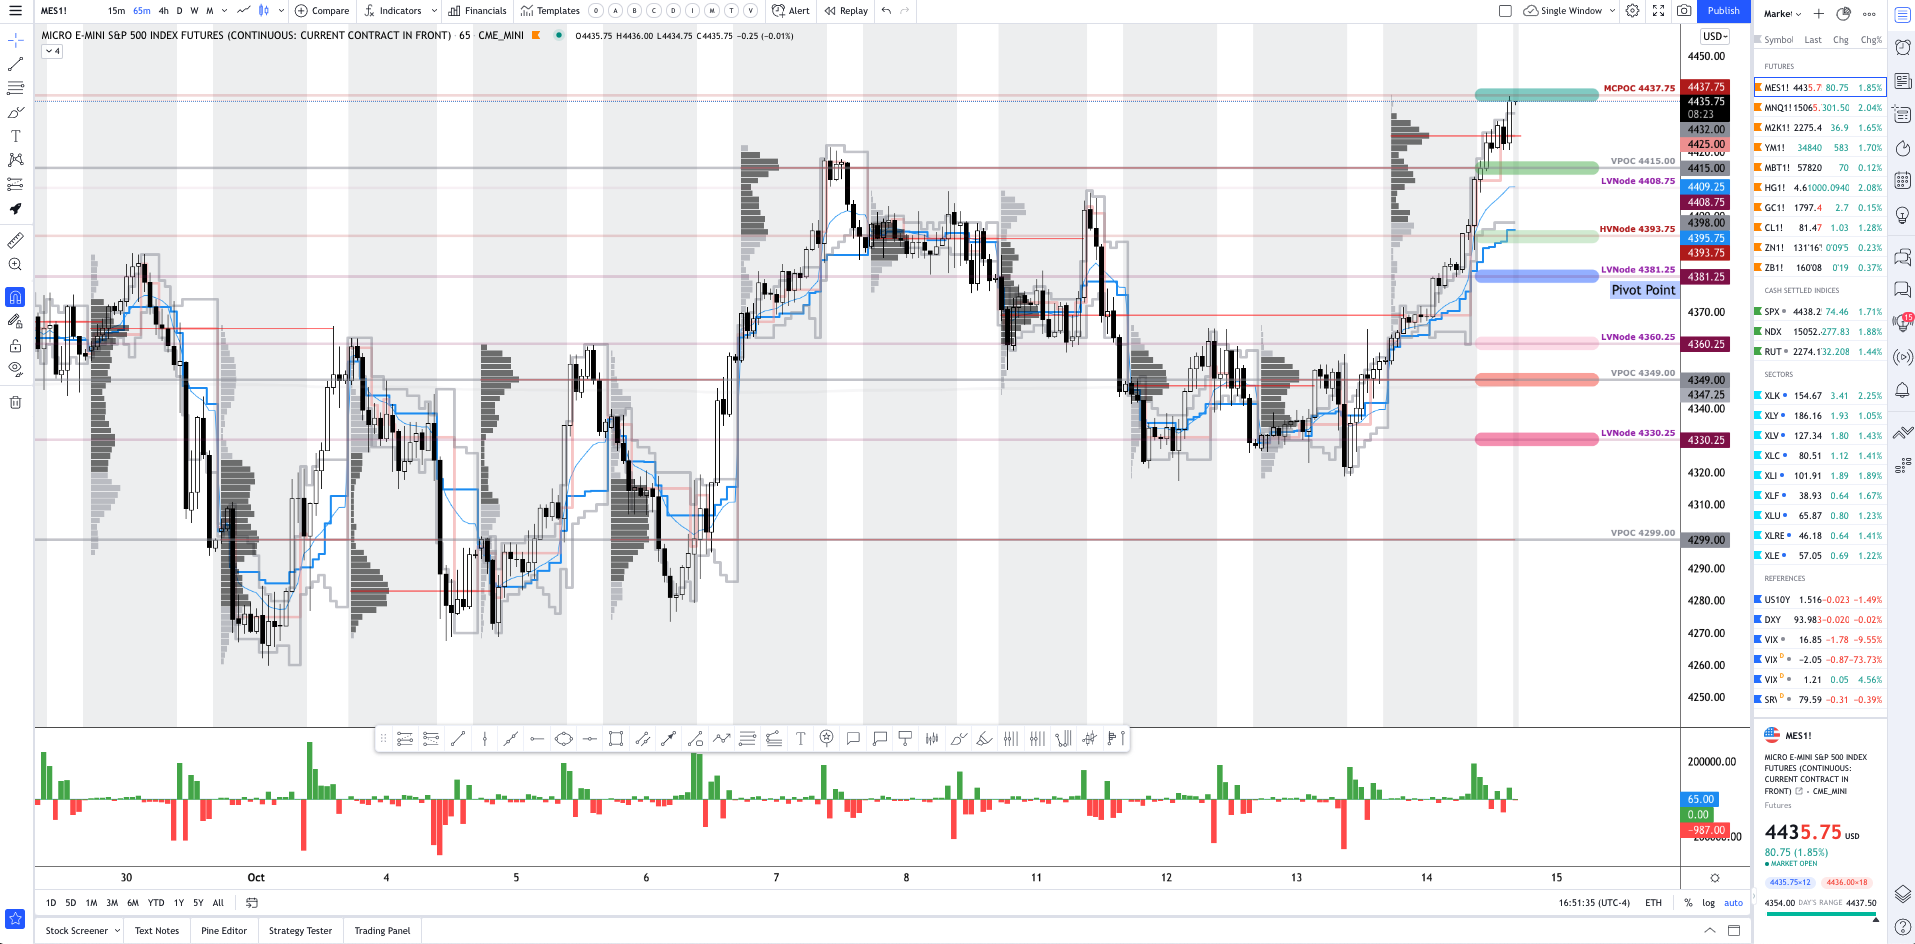
Graphic: Screenshot of conditions, end-of-day Thursday. Equity indices, commodities, and bonds ended sideways to higher. The Nasdaq 100 led the S&P 500, Russell 2000, and Dow Jones Industrial Average, a clear change in tone. All key levels to the upside, yesterday, came into play; the $4,437.75 micro-composite point of control (MCPOC), which corresponded with resting market liquidity, marked an end to the discovery process.

In other words, the near-vertical price rise was sold responsively. This activity comes after participants saw days of responsive buying into the dip, earlier this week.

Taken together, the status quo remains responsive trade as participants look to balance (i.e., build out a base) ahead of new information. Once new information comes to light, participants will have a base to resolve and build on, directionally, into the end of this year.
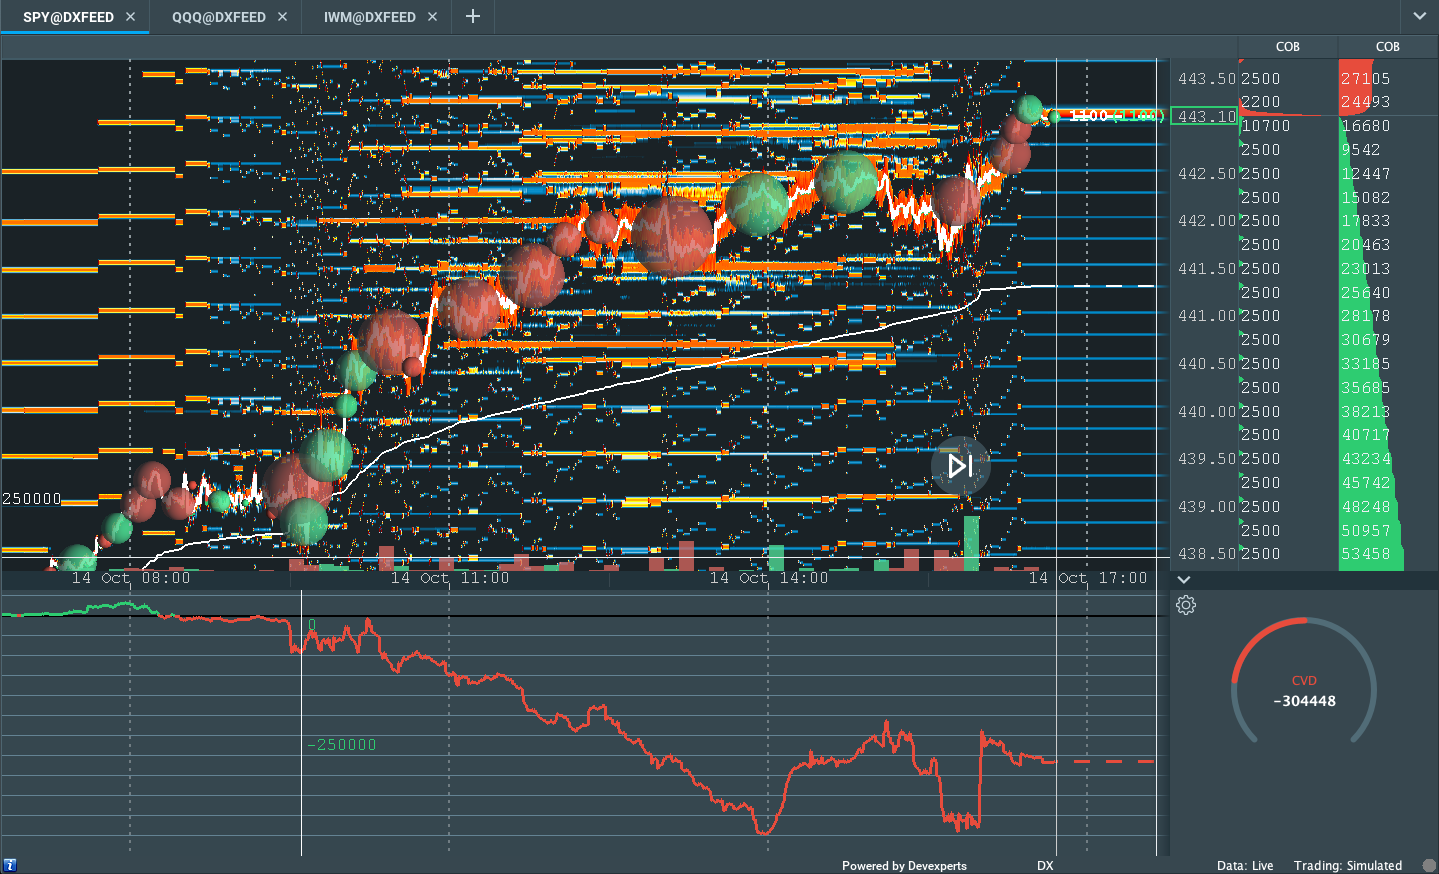
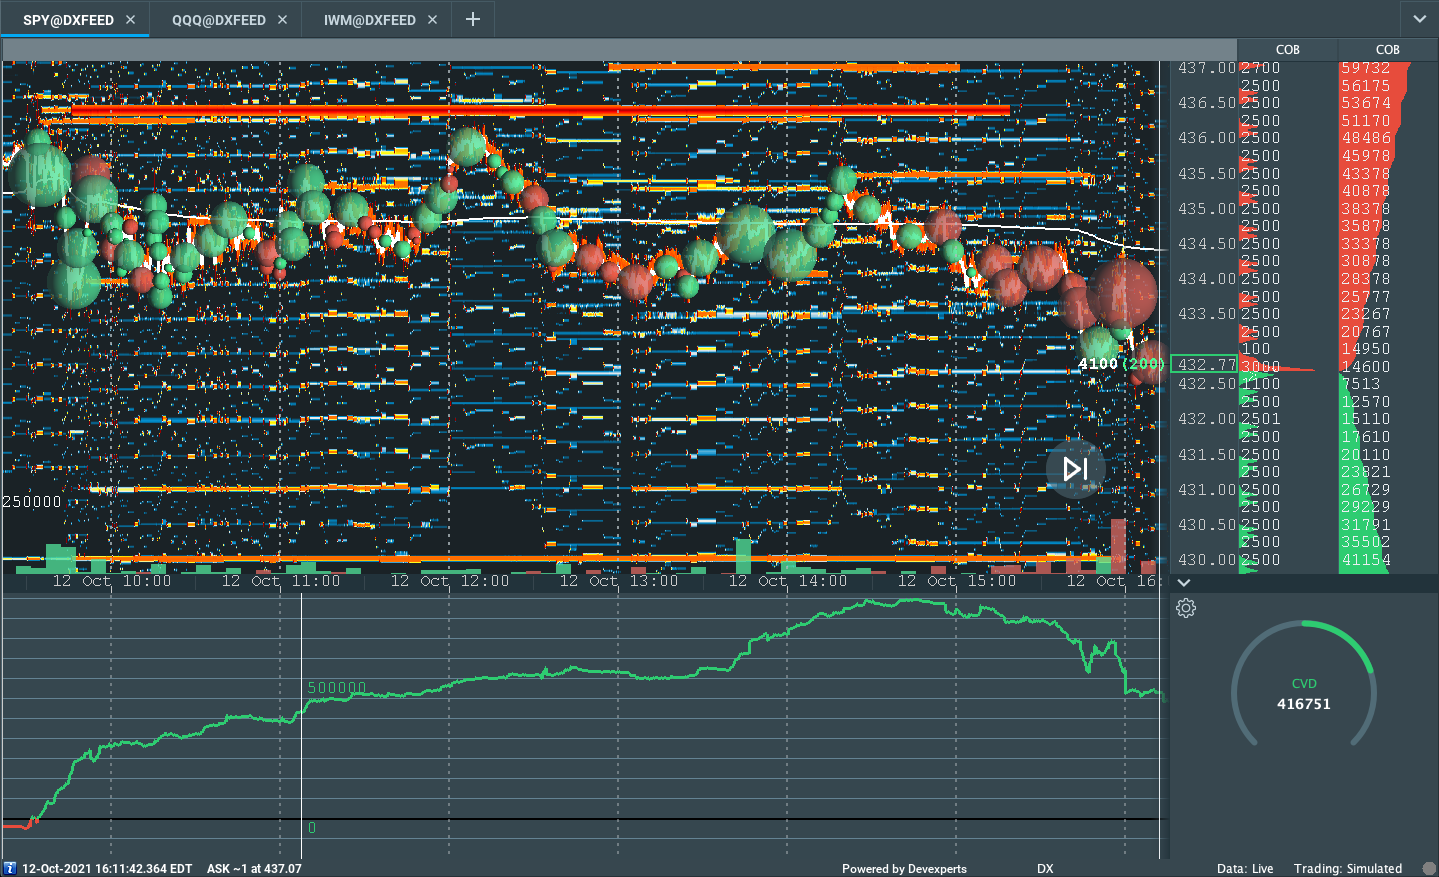
Graphic: Divergent delta (i.e., non-committed buying as measured by volume delta or buying and selling power as calculated by the difference in volume traded at the bid and offer) in SPDR S&P 500 ETF Trust (NYSE: SPY), one of the largest ETFs that track the S&P 500 index, via Bookmap. The readings are supportive of responsive trade or balance (i.e., rotational trade that suggests current prices offer favorable entry and exit).

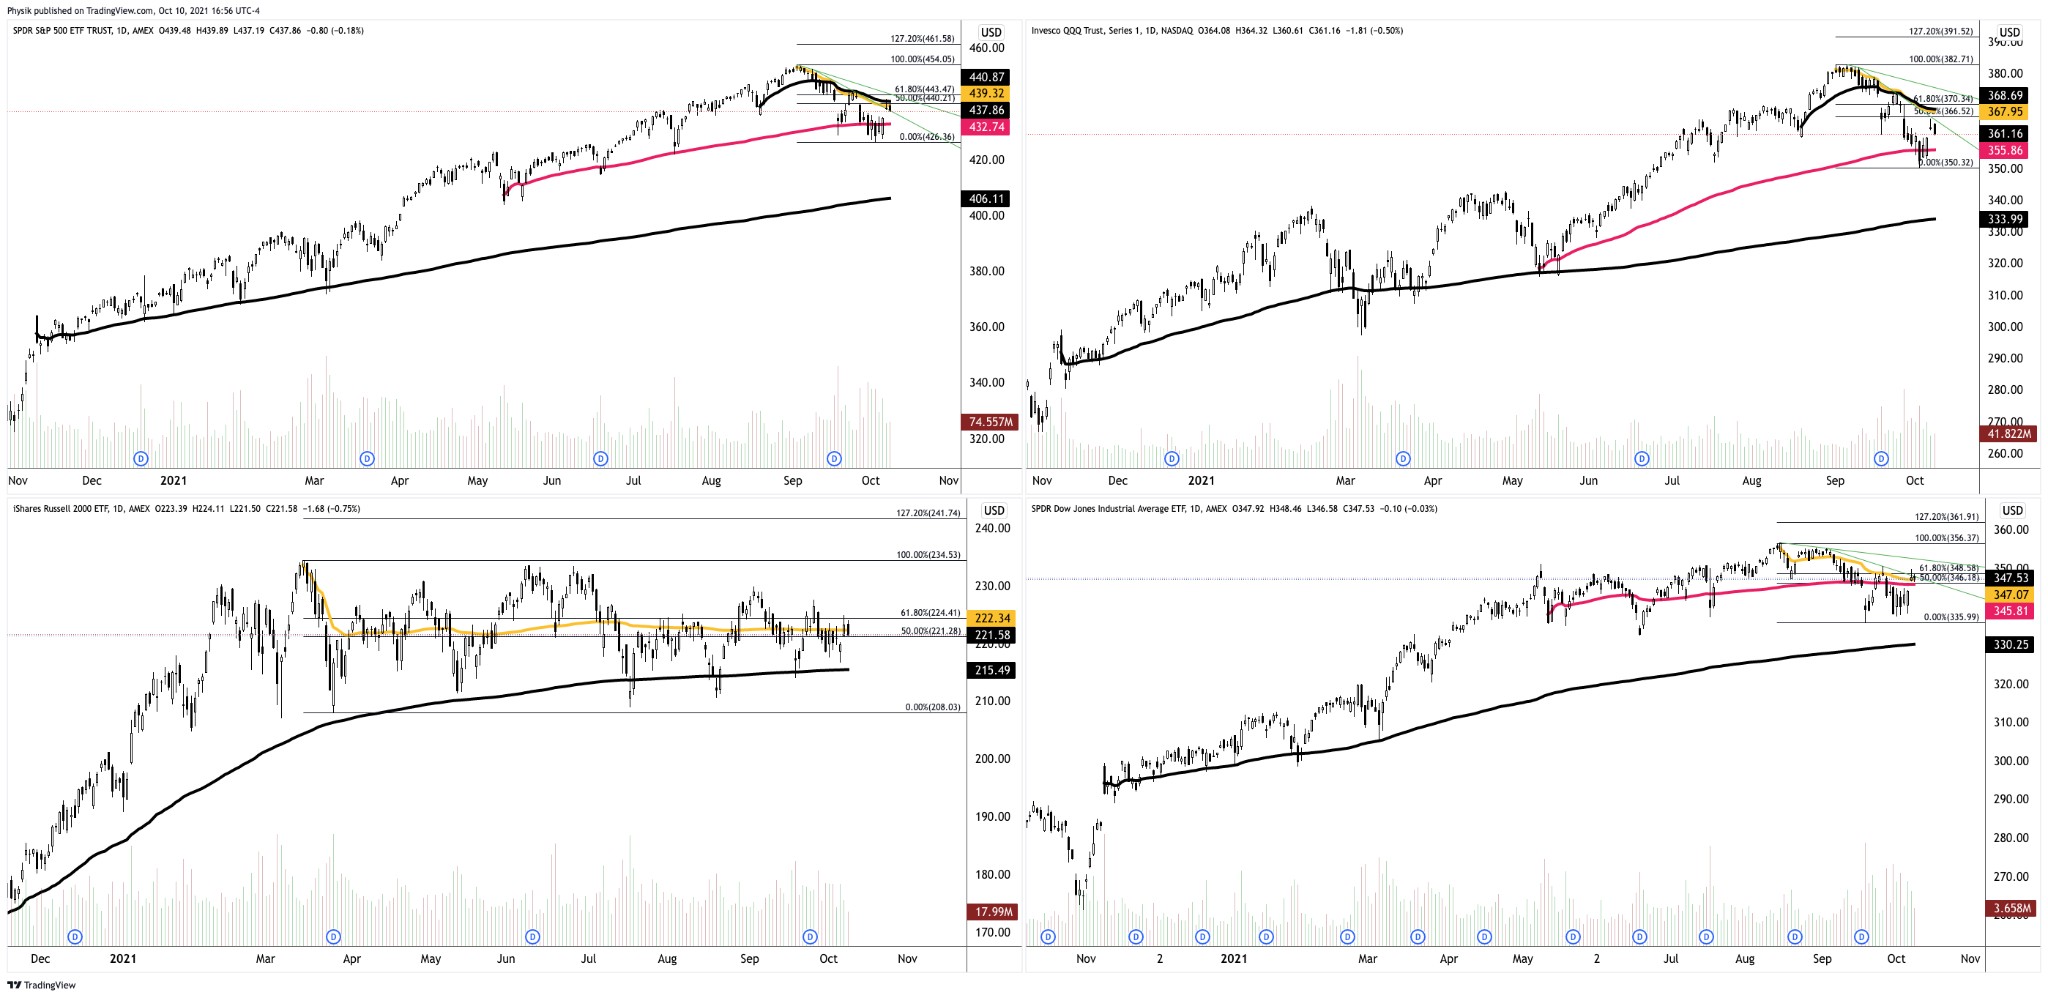
Zooming out, we see the Nasdaq 100 coming into trend, Fibonacci, and volume-weighted average price (VWAP) resistance. This dynamic, alongside poor structure and divergent market liquidity metrics, promotes the responsive trade thesis.
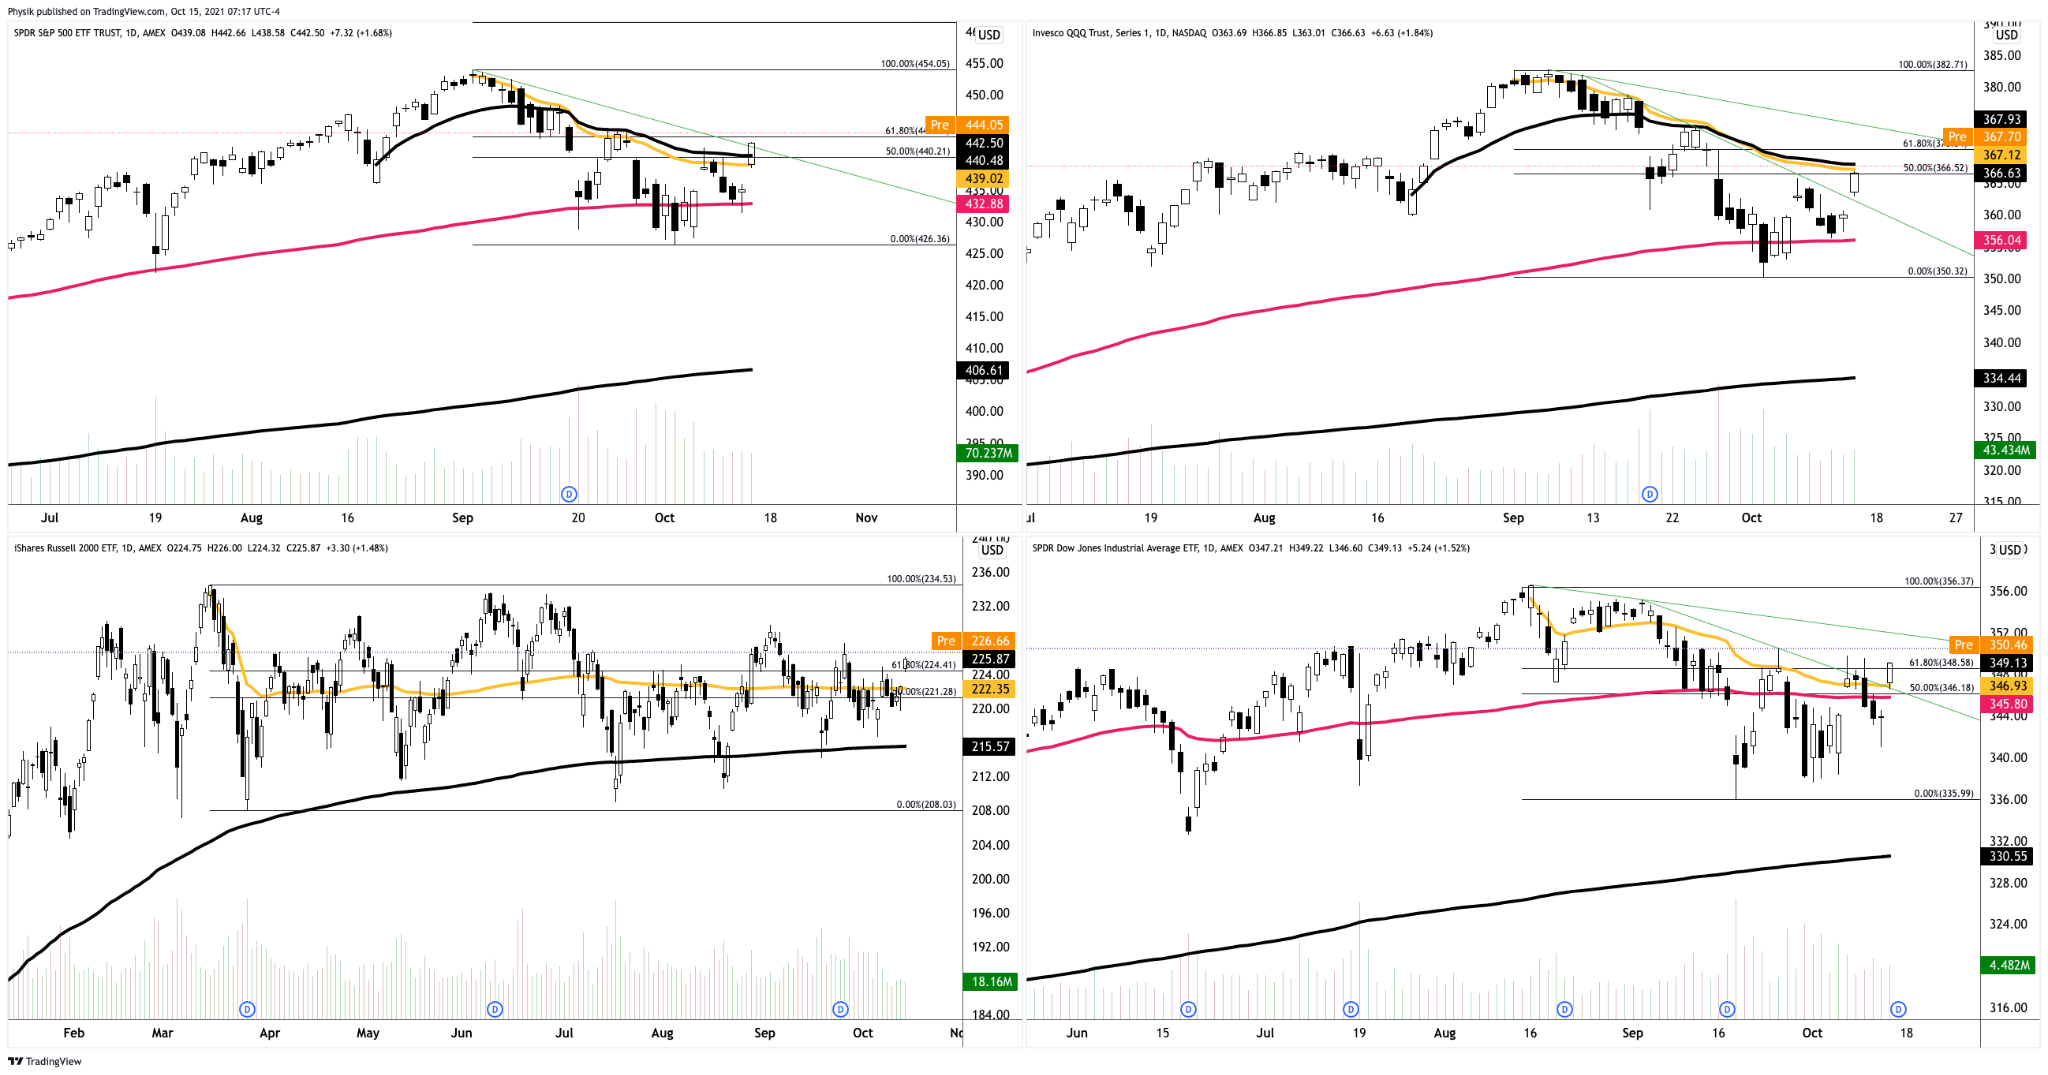
Graphic: SPDR S&P 500 ETF (NYSE: SPY) top left, Invesco QQQ Trust Series 1 (NASDAQ: QQQ) top right, iShares Russell 2000 ETF (NYSE: IWM) bottom left, SPDR Dow Jones Industrial Average ETF Trust (NYSE: DIA) bottom right. Spending more than a few hours of trade above trend, VWAP (yellow), and the 61.80% Fibonacci retracement suggest good odds of upside continuation.

Further, the aforementioned trade is happening in the context of a seasonally bullish cycle of rebalancing and earnings, as well as the risks associated with a taper in asset purchases and a hike in rates.

“The economy is being supported by robust consumer balance sheets, rebounding business investment and a healthy labor market,” adds Hugh Gimber, global strategist at J.P. Morgan Asset Management.

In terms of positioning, coming into October 14, according to SpotGamma, the decay of customers’ long put hedges implied those taking the other side – dealers who warehouse short put risk – would cover their underlying hedges, bolstering the violent move higher.

“[T]his was a vanna/charm type rally back into major resistance. Said another way: we see this as a short cover rally, and the market is unstable.” 

Moreover, for today, participants may make use of the following frameworks.

In the best case, the S&P 500 trades sideways or higher; activity above the $4,437.75 MCPOC puts in play the $4,463.75 low volume area (LVNode). Initiative trade beyond the LVNode could reach as high as the $4,481.75 high volume area (HVNode) and $4,510.00 LVNode, or higher.

In the worst case, the S&P 500 trades lower; activity below the $4,437.75 MCPOC puts in play the $4,425.00 untested point of control (VPOC). Initiative trade beyond the VPOC could reach as low as the $4,393.75 HVNode and $4,349.00 VPOC, or lower.

Click here to load today’s updated real-time key levels into the web-based TradingView charting platform. Please note that all levels are derived using the 65-minute timeframe.
Graphic: 65-minute profile chart of the Micro E-mini S&P 500 Futures updated 6:30 AM ET.

Definitions

Volume Areas: A structurally sound market will build on areas of high volume (HVNodes). Should the market trend for long periods of time, it will lack sound structure, identified as low volume areas (LVNodes). LVNodes denote directional conviction and ought to offer support on any test. 

If participants were to auction and find acceptance into areas of prior low volume (LVNodes), then future discovery ought to be volatile and quick as participants look to HVNodes for favorable entry or exit.

Short Covering: The profile shape suggests participants were “too” short and had poor location.

POCs: POCs are valuable as they denote areas where two-sided trade was most prevalent in a prior day session. Participants will respond to future tests of value as they offer favorable entry and exit.

MCPOCs: POCs are valuable as they denote areas where two-sided trade was most prevalent over numerous day sessions. Participants will respond to future tests of value as they offer favorable entry and exit.

Options Expiration (OPEX): Option expiries mark an end to pinning (i.e, the theory that market makers and institutions short options move stocks to the point where the greatest dollar value of contracts will expire worthless) and the reduction dealer gamma exposure.

Price Discovery (One-Timeframe Or Trend): Elongation and range expansion denotes a market seeking new prices to establish value, or acceptance (i.e., more than 30-minutes of trade at a particular price level). 

Balance (Two-Timeframe Or Bracket): Rotational trade that denotes current prices offer favorable entry and exit. Balance-areas make it easy to spot a change in the market (i.e., the transition from two-time frame trade, or balance, to one-time frame trade, or trend). 

Modus operandi is responsive trade (i.e., fade the edges), rather than initiative trade (i.e., play the break).

Value-Area Placement: Perception of value unchanged if value overlapping (i.e., inside day). Perception of value has changed if value not overlapping (i.e., outside day). Delay trade in the former case.

More On Volume-Weighted Average Prices (VWAPs): A metric highly regarded by chief investment officers, among other participants, for quality of trade. Additionally, liquidity algorithms are benchmarked and programmed to buy and sell around VWAPs.

Rates: Low rates have to potential to increase the present value of future earnings making stocks, especially those that are high growth, more attractive. To note, inflation and rates move inversely to each other. Low rates stimulate demand for loans (i.e., borrowing money is more attractive). In conjunction with the rapid recovery, lower rates may solicit hawkish commentary as policymakers look to inhibit inflation.

News And Analysis

Upgrades outpace downgrades for second consecutive quarter.

‘Prick this bubble’: Morgan Stanley’s CEO calling for rate hikes.

Bitcoin futures frenzy erupts as day traders pile into ETF plays.

Global energy squeeze triggers unusual decline at U.S. oil hub.

China broke its Evergrande silence and said risks are in check.

JPMorgan Chase suggests more M&A could be on the horizon.

What People Are Saying

About

After years of self-education, strategy development, and trial-and-error, Renato Leonard Capelj began trading full-time and founded Physik Invest to detail his methods, research, and performance in the markets. 

Additionally, Capelj is a finance and technology reporter. Some of his biggest works include interviews with leaders such as John Chambers, founder and CEO, JC2 Ventures, Kevin O’Leary, businessman and Shark Tank host, Catherine Wood, CEO and CIO, ARK Invest, among others.

Disclaimer

At this time, Physik Invest does not manage outside capital and is not licensed. In no way should the materials herein be construed as advice. Derivatives carry a substantial risk of loss. All content is for informational purposes only.

Categories
Commentary

Daily Brief For October 14, 2021

Update: This morning’s 7:55 AM ET release of the newsletter failed to include updated S&P 500 levels in the very first graphic, below. That graphic has been updated, now. Sorry!

Market Commentary

Equity index, commodity, bond futures trade sideways to higher. Volatility ebbs.

  • Consumer prices rose. Taper in play.
  • Ahead: Claims, PPI data, Fed speak.

What Happened: After news that consumer prices rose more than expected, alongside the release of Federal Open Market Committee (FOMC) minutes which revealed an intent to taper asset purchases, U.S. stock index futures auctioned higher.

Ahead is data on jobless claims and the producer price index (8:30 AM ET). After is Fed-speak by Lorie Logan (12:00 PM ET), Tom Barkin (1:00 PM ET), and Patrick Harker (6:00 PM ET).

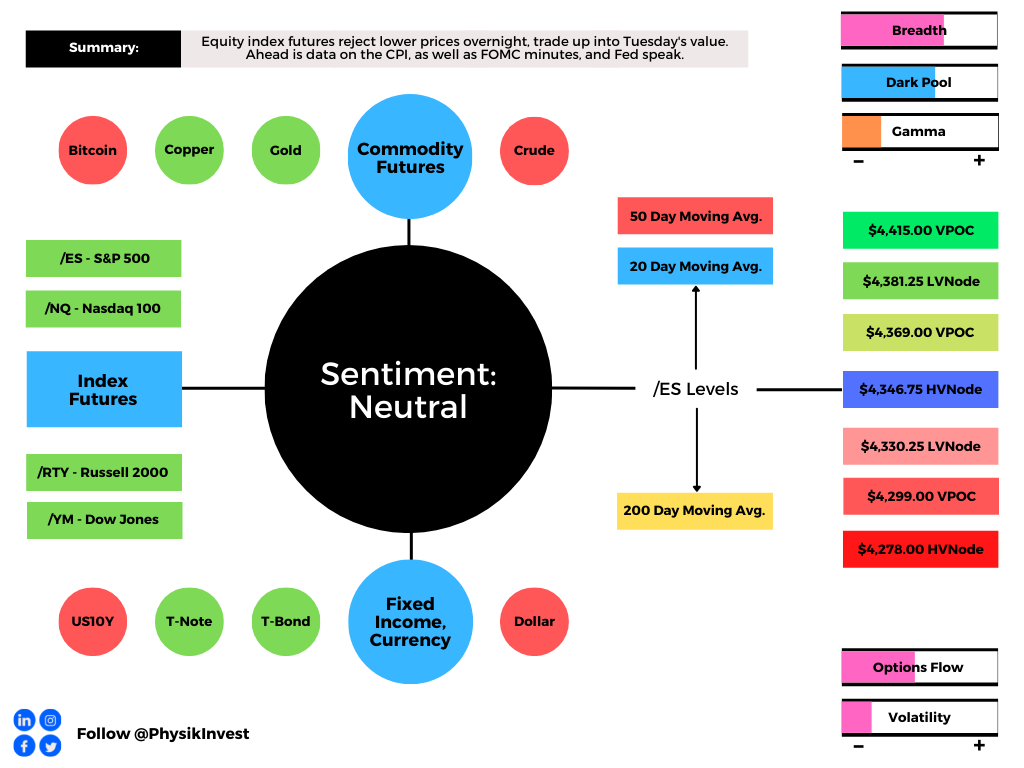
Graphic updated 6:30 AM ET. Sentiment Risk-On if expected /ES open is above the prior day’s range. /ES levels are derived from the profile graphic at the bottom of the following section. SqueezeMetrics Dark Pool Index (DIX) and Gamma (GEX) calculations are based on where the prior day’s reading falls with respect to the MAX and MIN of all occurrences available. A higher DIX is bullish. At the same time, the lower the GEX, the more (expected) volatility. SHIFT data used for S&P 500 (INDEX: SPX) options activity. Note that options flow is sorted by the call premium spent; if more positive then more was spent on call options. Breadth reflects a reading of the prior day’s NYSE Advance/Decline indicator. VIX reflects a current reading of the CBOE Volatility Index (INDEX: VIX) from 0-100.

What To Expect: As of 6:30 AM ET, Thursday’s regular session (9:30 AM – 4:00 PM EST) in the S&P 500 will likely open outside of prior-range and -value, suggesting a potential for immediate directional opportunity.

Gap Scenarios: Gaps ought to fill quickly. Should they not, that’s a signal of strength; do not fade. Leaving value behind on a gap-fill or failing to fill a gap (i.e., remaining outside of the prior session’s range) is a go-with indicator.

Auctioning and spending at least 1-hour of trade back in the prior range suggests a lack of conviction; in such a case, do not follow the direction of the most recent initiative activity.

Adding, during the prior day’s regular trade, on positive intraday breadth and divergent market liquidity metrics, the best case outcome occurred; after numerous sessions of a minimum separation in value (i.e., the area where 70% of the day’s volume occurred) failed to support downside price discovery, participants took back Monday’s spike and weak close

The activity now puts in play the minimal excess high just short of the $4,408.75 low volume area (LVNode), as well as the $4,415.00 untested point of control (VPOC), two areas where initiative buyers were unable to counter the fading momentum from short covering.

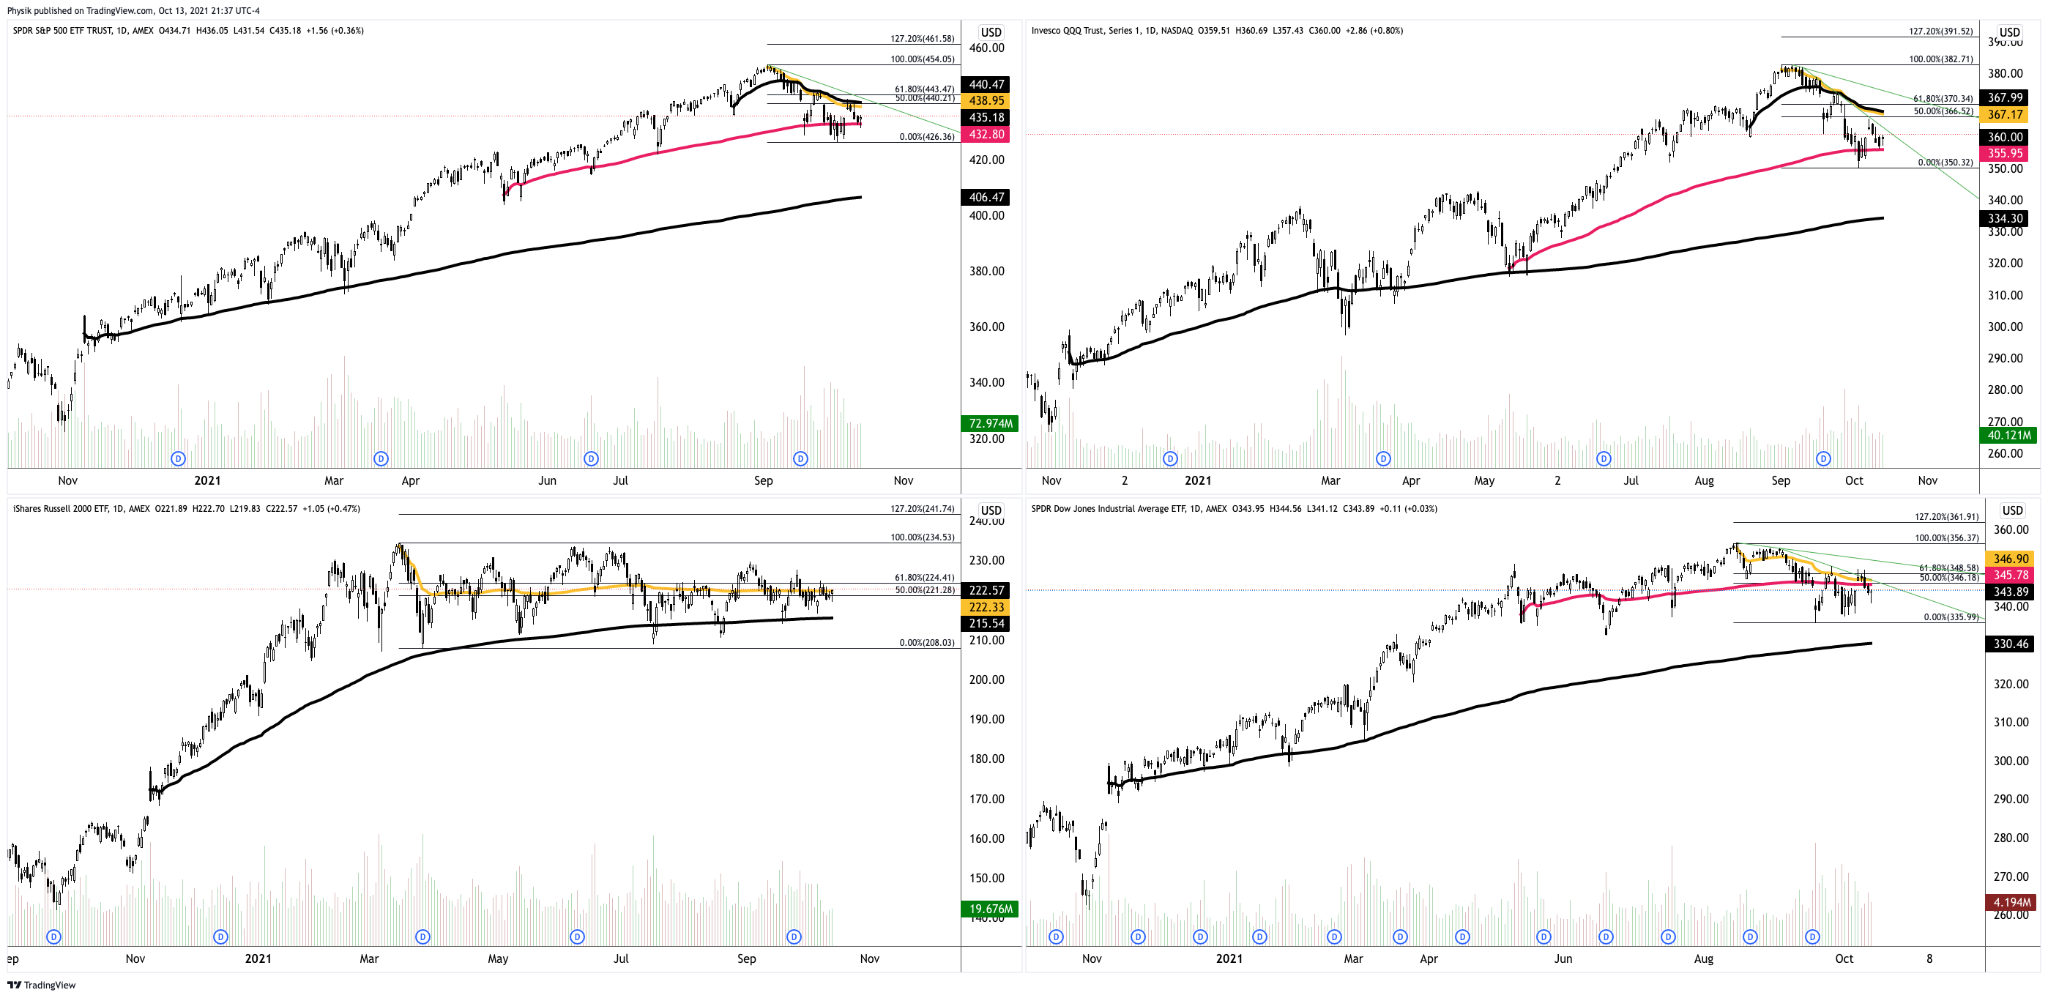
Looking across the spectrum, the Nasdaq 100 and Russell 2000 are firming, relative to the S&P 500 and Dow Jones Industrial Average, two indices that held the relative strength mantle, prior. 

This rotation, if we will, may support sideways-to-higher trade in the coming sessions as participants clash head-on with the 50.00% and 61.80% Fibonacci retracements, levels that overlap key anchored volume-weighted average price (AVWAP) levels.

Note: VWAP is a metric highly regarded by chief investment officers, among other participants, for quality of trade. Additionally, liquidity algorithms are benchmarked and programmed to buy and sell around VWAPs. We look to buy above a flat/rising VWAP pinch. Sell below a flat/declining VWAP pinch.
Graphic: SPDR S&P 500 ETF (NYSE: SPY) top left, Invesco QQQ Trust Series 1 (NASDAQ: QQQ) top right, iShares Russell 2000 ETF (NYSE: IWM) bottom left, SPDR Dow Jones Industrial Average ETF Trust (NYSE: DIA) bottom right. Spending more than a few hours of trade above trend, VWAP (yellow), and the 61.80% Fibonacci retracement suggest good odds of upside continuation.

Further, the aforementioned trade is happening in the context of weakness into a seasonally bullish cycle of rebalancing and earnings

Some risks include the prospects of tapering off asset purchases, next month, alongside dangerous inflation pressures, as indicated by minutes from the FOMC meeting last month.

“Markets took the hint. Two-year yields are their highest since March last year, when the pandemic first hit,” said Bloomberg’s John Authers. “Meanwhile, the 10-year yield retreated from an approach toward its post-pandemic high. The two-year reflects the now-strong likelihood that the Fed will raise rates within the next two years; the 10-year reflects concerns about growth.” 

In terms of positioning, conditions may be supportive. 

Moreover, for today, participants may make use of the following frameworks.

In the best case, the S&P 500 trades sideways or higher; activity above the $4,381.25 LVNode puts in play the $4,393.75 high volume area (HVNode). Initiative trade beyond the HVNode could reach as high as the $4,415.00 VPOC and $4,437.75 micro composite point of control (MCPOC), or higher.

In the worst case, the S&P 500 trades lower; activity below the $4,381.25 LVNode puts in play the $4,360.25 LVNode. Initiative trade beyond the $4,360.25 LVNode could reach as low as the $4,349.00 VPOC and $4,330.25 LVNode, or lower.

Click here to load today’s updated real-time key levels into the web-based TradingView charting platform. Please note that all levels are derived using the 65-minute timeframe.
Graphic: 65-minute profile chart of the Micro E-mini S&P 500 Futures updated 6:30 AM ET.

Definitions

Spikes: Spike’s mark the beginning of a break from value. Spikes higher (lower) are validated by trade at or above (below) the spike base (i.e., the origin of the spike).

Volume Areas: A structurally sound market will build on areas of high volume (HVNodes). Should the market trend for long periods of time, it will lack sound structure, identified as low volume areas (LVNodes). LVNodes denote directional conviction and ought to offer support on any test. 

If participants were to auction and find acceptance into areas of prior low volume (LVNodes), then future discovery ought to be volatile and quick as participants look to HVNodes for favorable entry or exit.

POCs: POCs are valuable as they denote areas where two-sided trade was most prevalent in a prior day session. Participants will respond to future tests of value as they offer favorable entry and exit.

MCPOCs: POCs are valuable as they denote areas where two-sided trade was most prevalent over numerous day sessions. Participants will respond to future tests of value as they offer favorable entry and exit.

Excess: A proper end to price discovery; the market travels too far while advertising prices. Responsive, other-timeframe (OTF) participants aggressively enter the market, leaving tails or gaps which denote unfair prices.

Value-Area Placement: Perception of value unchanged if value overlapping (i.e., inside day). Perception of value has changed if value not overlapping (i.e., outside day). Delay trade in the former case.

News And Analysis

Consumer prices rise more than expected as energy costs surge.

Global minimum tax pact ups the chance of multinational tax hike.

Global gas crisis is spilling over into the oil markets, IEA explains.

China’s power cuts stressing economic growth and supply chains.

Federal Reserve officials seeing mid-November, December taper.

What People Are Saying

About

After years of self-education, strategy development, and trial-and-error, Renato Leonard Capelj began trading full-time and founded Physik Invest to detail his methods, research, and performance in the markets. 

Additionally, Capelj is a finance and technology reporter. Some of his biggest works include interviews with leaders such as John Chambers, founder and CEO, JC2 Ventures, Kevin O’Leary, businessman and Shark Tank host, Catherine Wood, CEO and CIO, ARK Invest, among others.

Disclaimer

At this time, Physik Invest does not manage outside capital and is not licensed. In no way should the materials herein be construed as advice. Derivatives carry a substantial risk of loss. All content is for informational purposes only.
Categories
Commentary

Daily Brief For October 13, 2021

Editor’s Note: Tuesday’s newsletter tested a new feature to view real-time charts with key levels. From here on out, links to an updated layouts page will be found in the What To Expect section, below. Thanks!

Market Commentary

Equity index futures trade sideways to higher with bonds. Commodities were mixed.

  • Initiative sellers fail to expand the range.
  • Ahead is CPI, FOMC minutes, earnings.

What Happened: U.S. stock index futures auctioned sideways to higher ahead of data that would shed light on inflation and earnings.

Ahead is data on the Consumer Price Index (8:30 AM ET), FOMC minutes (2:00 PM ET), as well as Fed-speak (4:30 and 8:00 PM ET).

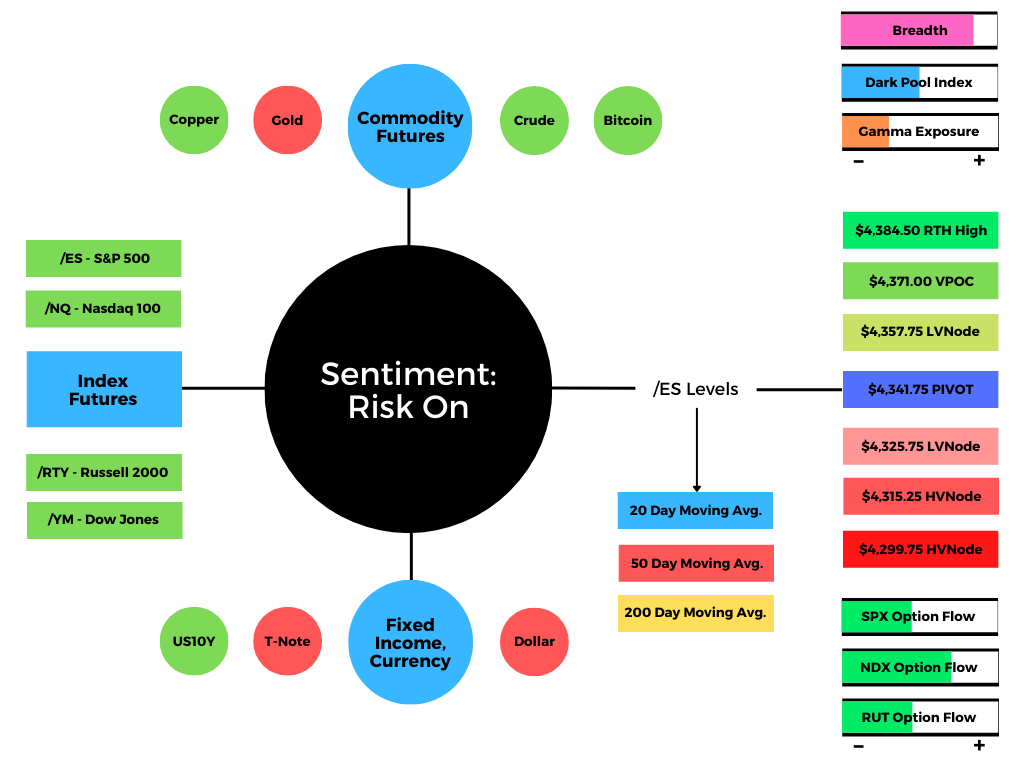
Graphic updated 6:30 AM ET. Sentiment Neutral if expected /ES open is inside of the prior day’s range. /ES levels are derived from the profile graphic at the bottom of the following section. SqueezeMetrics Dark Pool Index (DIX) and Gamma (GEX) calculations are based on where the prior day’s reading falls with respect to the MAX and MIN of all occurrences available. A higher DIX is bullish. At the same time, the lower the GEX, the more (expected) volatility. SHIFT data used for S&P 500 (INDEX: SPX) options activity. Note that options flow is sorted by the call premium spent; if more positive then more was spent on call options. Breadth reflects a reading of the prior day’s NYSE Advance/Decline indicator. VIX reflects a current reading of the CBOE Volatility Index (INDEX: VIX) from 0-100.

What To Expect: As of 6:30 AM ET, Wednesday’s regular session (9:30 AM – 4:00 PM EST) in the S&P 500 will likely open inside of prior-range and -value, suggesting a limited potential for immediate directional opportunity.

Adding, during the prior day’s regular trade, on positive intraday breadth and divergent market liquidity metrics, the worst-case outcome occurred, evidenced by another spike or knee-jerk, end-of-day move, after initiative buyers lacked the conviction to push for excess.

Graphic: Divergent delta (i.e., non-committed selling as measured by volume delta or buying and selling power as calculated by the difference in volume traded at the bid and offer) in SPDR S&P 500 ETF Trust (NYSE: SPY), one of the largest ETFs that track the S&P 500 index, via Bookmap. The readings are supportive of responsive trade or balance (i.e., rotational trade that suggests current prices offer favorable entry and exit).

Overnight exploration failed to provide validation of the spike; indices recovered the area where two-sided trade was most prevalent in Tuesday’s regular session.

Combining the activity over the past couple of sessions, we see an inability – on the part of sellers – to expand the range and value (i.e., the area where 70% of the day’s volume occurred). Trading above $4,360.00 in the S&P 500 invalidates Monday’s spike, likely forcing those short-term participants who sold the break to cover.

Further, the aforementioned trade is happening in the context of a seasonal cycle of rebalancing and earnings, improvement among some positioning metrics, among other things. 

Though these themes support (1) October volatility and (3) an increased potential for sideways to higher trade, some risks exist.

Nordea summarizes it well: “The combination of higher inflation risks and weaker activity data makes the near-term market outlook uncertain. We see more hawkish central banks, higher bond yields, and a stronger USD ahead.”

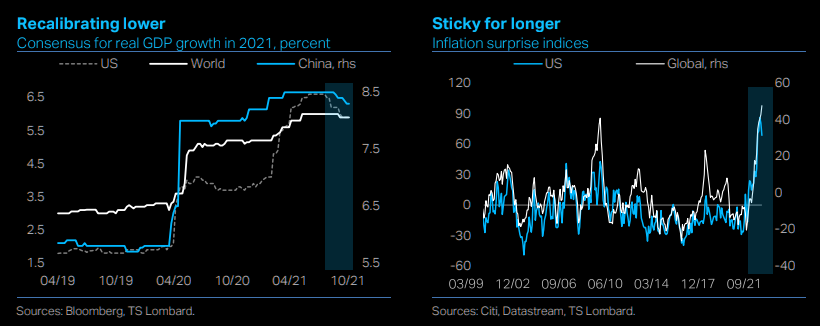
At the same time, according to a summary put out by The Market Ear, TS Lombard sees (1) China’s economic slowdown spilling over, (2) consumer confidence weakening amidst a bump in inflation expectations, (3) persistent inflationary pressures hastening the global monetary tightening, and (4) COVID-19 mutations leading to renewed lockdowns.

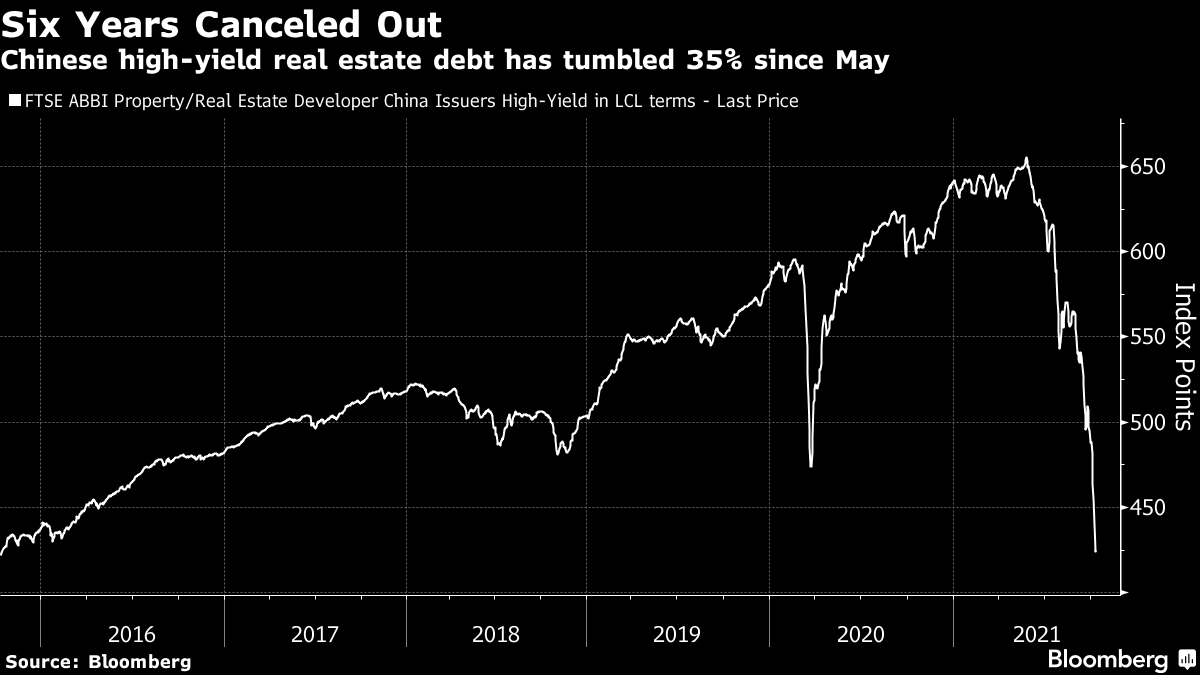
Graphic: Performance of the broad high-yield real estate sector in China, via Bloomberg.
Graphic: TS Lombard visualizes its estimates for slower growth, via The Market Ear.

Moreover, for today, participants may make use of the following frameworks.

In the best case, the S&P 500 trades sideways or higher; activity above the $4,346.75 high volume area (HVNode) pivot puts in play the $4,369.00 untested point of control (VPOC). Initiative trade beyond the VPOC could reach as high as the $4,381.25 low volume area (LVNode) and $4,415.00 VPOC, or higher.

In the worst case, the S&P 500 trades lower; activity below the $4,346.75 HVNode pivot puts in play the $4,330.25 LVNode. Initiative trade beyond the LVNode could reach as low as the $4,299.00 VPOC and $4,278.00 HVNode, or lower.

Click here to load today’s updated real-time key levels into the web-based TradingView charting platform. Please note that all levels are derived using the 65-minute timeframe.
Graphic: 65-minute profile chart of the Micro E-mini S&P 500 Futures updated 6:30 AM ET.

Definitions

Spikes: Spike’s mark the beginning of a break from value. Spikes higher (lower) are validated by trade at or above (below) the spike base (i.e., the origin of the spike).

Volume Areas: A structurally sound market will build on areas of high volume (HVNodes). Should the market trend for long periods of time, it will lack sound structure, identified as low volume areas (LVNodes). LVNodes denote directional conviction and ought to offer support on any test. 

If participants were to auction and find acceptance into areas of prior low volume (LVNodes), then future discovery ought to be volatile and quick as participants look to HVNodes for favorable entry or exit.

POCs: POCs are valuable as they denote areas where two-sided trade was most prevalent in a prior day session. Participants will respond to future tests of value as they offer favorable entry and exit.

Excess: A proper end to price discovery; the market travels too far while advertising prices. Responsive, other-timeframe (OTF) participants aggressively enter the market, leaving tails or gaps which denote unfair prices.

Value-Area Placement: Perception of value unchanged if value overlapping (i.e., inside day). Perception of value has changed if value not overlapping (i.e., outside day). Delay trade in the former case.

News And Analysis

Half of all delinquent homeowners have missed six payments.

China credit growth slows amid property, Evergrande troubles.

JPMorgan smashing estimates on M&A, wealth management.

Low vaccination rates exacerbate America’s caregiving crisis.

Apple finally fell victim to the never-ending supply chain crisis.

What People Are Saying

About

After years of self-education, strategy development, and trial-and-error, Renato Leonard Capelj began trading full-time and founded Physik Invest to detail his methods, research, and performance in the markets. 

Additionally, Capelj is a finance and technology reporter. Some of his biggest works include interviews with leaders such as John Chambers, founder and CEO, JC2 Ventures, Kevin O’Leary, businessman and Shark Tank host, Catherine Wood, CEO and CIO, ARK Invest, among others.

Disclaimer

At this time, Physik Invest does not manage outside capital and is not licensed. In no way should the materials herein be construed as advice. Derivatives carry a substantial risk of loss. All content is for informational purposes only.

Categories
Commentary

Daily Brief For October 12, 2021

Market Commentary

Equity index futures recover after Monday’s liquidation and brief overnight follow-through. Commodities were mixed and bonds were sideways to higher.

  • Market positioning for an EOY rally?
  • Ahead: Job openings, inflation data.
  • New feature to view real-time levels.

What Happened: U.S. stock index futures recover from earlier bearishness, absent impactful fundamental narratives.

Ahead is data on the job openings (10:00 AM ET) and the median expected 3-year inflation rate (11:00 AM ET). 

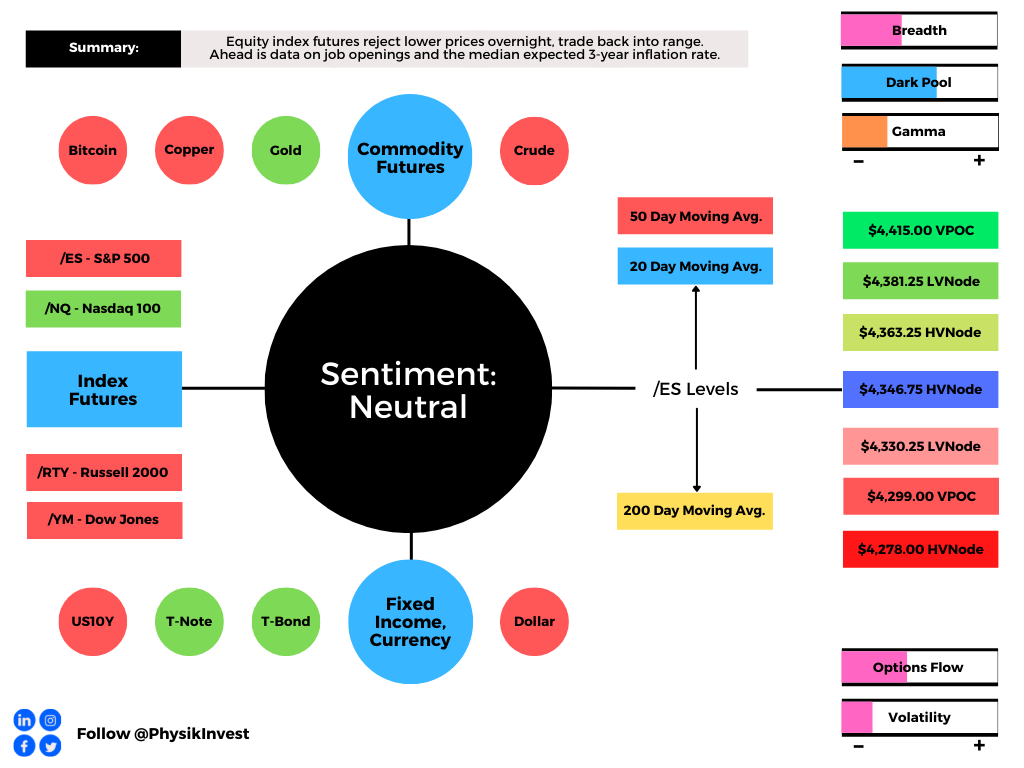
Graphic updated 6:30 AM ET. Sentiment Neutral if expected /ES open is inside of the prior day’s range. /ES levels are derived from the profile graphic at the bottom of the following section. SqueezeMetrics Dark Pool Index (DIX) and Gamma (GEX) calculations are based on where the prior day’s reading falls with respect to the MAX and MIN of all occurrences available. A higher DIX is bullish. At the same time, the lower the GEX, the more (expected) volatility. SHIFT data used for S&P 500 (INDEX: SPX) options activity. Note that options flow is sorted by the call premium spent; if more positive then more was spent on call options. Breadth reflects a reading of the prior day’s NYSE Advance/Decline indicator. VIX reflects a current reading of the CBOE Volatility Index (INDEX: VIX) from 0-100.

What To Expect: As of 6:30 AM ET, Tuesday’s regular session (9:30 AM – 4:00 PM EST) in the S&P 500 may open inside of prior-range and -value, suggesting a limited potential for immediate directional opportunity.

This comes after a volatile Monday.

At the outset, initiative sellers painted themselves into a corner at the convergence of the $4,363.25 high volume area (HVNode) pivot and an anchored volume-weighted average price.

Note: Liquidity algorithms are benchmarked and programmed to buy and sell around VWAPs, a metric highly regarded by chief investment officers, among others, for quality of trade.

After participants failed to muster the wherewithal to take prices lower, the S&P 500 then endured a rapid short-covering rally intraday – as evidenced by emotional, multiple distribution profile structures – before the momentum from covering shorts faded.

Thereafter, the S&P 500 liquidated, leaving behind a minimal excess high just south of the $4,408.75 low volume area (LVNode) and $4,415.00 untested point of control (VPOC).

Despite the spike and weak close, there was a minimal separation in value (i.e., the area where 70% of the day’s volume occurred); in other words, though participants valued lower prices, the knee-jerk, end-of-day move was not validated by increased trade at lower price levels.

Overnight exploration provided that validation before a massive change in tone after about 2:00 AM ET. Thereafter, indices recovered the prior day’s close.

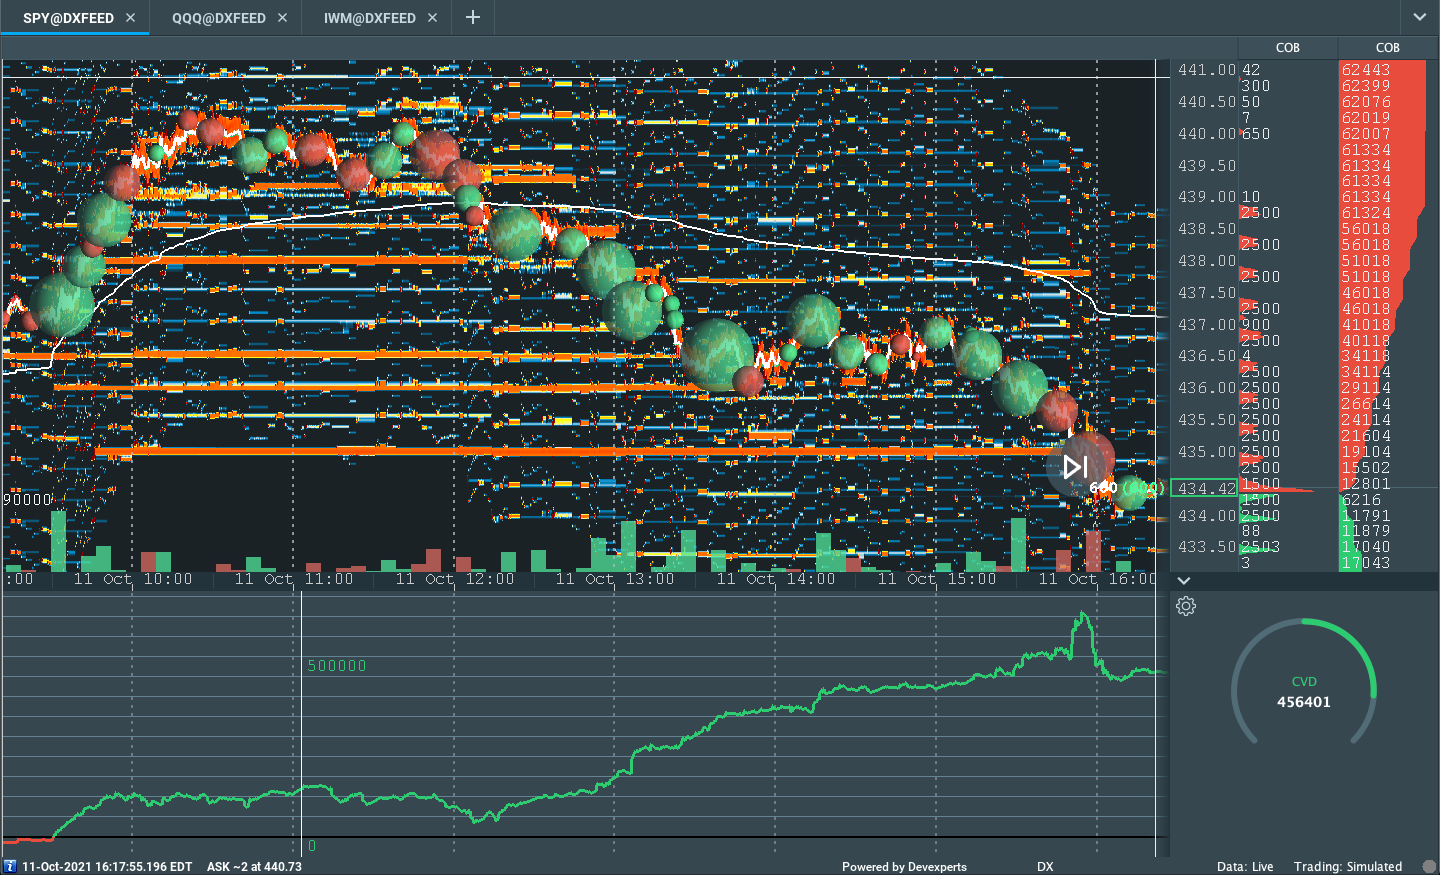
Graphic: Divergent delta (i.e., non-committed selling as measured by volume delta or buying and selling power as calculated by the difference in volume traded at the bid and offer) in SPDR S&P 500 ETF Trust (NYSE: SPY), one of the largest ETFs that track the S&P 500 index, via Bookmap. The readings are supportive of responsive trade or balance (i.e., rotational trade that suggests current prices offer favorable entry and exit).

Further, the aforementioned trade is happening in the context of a seasonal cycle of rebalancing and earnings, improvement among some positioning metrics, among other things. 

These themes support (1) October volatility and (2) an increased potential for sideways to higher trade.

In support is JPMorgan Chase & Co’s (NYSE: JPM) Marko Kolanovic, a big stock market bull; “We believe that this was the last significant wave, and an effective end to the pandemic,” he said.

Kolanovic prefers economically sensitive shares over technology and growth stocks. 

In opposition is Morgan Stanley’s (NYSE: MS) Mike Wilson who is on the side of pressured earnings, as a result of higher labor and material costs.

“Higher rates and a stronger USD have led to multiple compression, a process that remains unfinished, in our view,” he said in a note featured by The Market Ear. “Whether the final chapter of the mid-cycle transition ends with a 10% or 20% correction in the S&P 500 will be determined by how much earnings growth decelerates or has to outright decline (i.e., the Ice). We are gaining confidence in a sharper deceleration but the timing is more uncertain.”

Moreover, for today, participants may make use of the following frameworks.

In the best case, the S&P 500 trades sideways or higher; activity above the $4,346.75 HVNode invalidates Monday’s spike lower and puts in play the $4,363.25 HVNode. Initiative trade beyond the $4,363.25 HVNode could reach as high as the $4,381.25 LVNode and $4,415.00 VPOC, or higher.

In the worst case, the S&P 500 trades lower; activity below the $4,346.75 HVNode puts in play the $4,330.25 LVNode. Initiative trade beyond the LVNode could reach as low as the $4,299.00 VPOC and $4,278.00 HVNode, or lower.

Click here to load today’s real-time key levels into the web-based TradingView charting platform. Please note that all levels are derived using the 65-minute timeframe.
Graphic: 65-minute profile chart of the Micro E-mini S&P 500 Futures updated 6:30 AM ET.

Definitions

Spikes: Spike’s mark the beginning of a break from value. Spikes higher (lower) are validated by trade at or above (below) the spike base (i.e., the origin of the spike).

Volume Areas: A structurally sound market will build on areas of high volume (HVNodes). Should the market trend for long periods of time, it will lack sound structure, identified as low volume areas (LVNodes). LVNodes denote directional conviction and ought to offer support on any test. 

If participants were to auction and find acceptance into areas of prior low volume (LVNodes), then future discovery ought to be volatile and quick as participants look to HVNodes for favorable entry or exit.

POCs: POCs are valuable as they denote areas where two-sided trade was most prevalent in a prior day session. Participants will respond to future tests of value as they offer favorable entry and exit.

Balance (Two-Timeframe Or Bracket): Rotational trade that denotes current prices offer favorable entry and exit. Balance-areas make it easy to spot a change in the market (i.e., the transition from two-time frame trade, or balance, to one-time frame trade, or trend). 

Modus operandi is responsive trade (i.e., fade the edges), rather than initiative trade (i.e., play the break).

Excess: A proper end to price discovery; the market travels too far while advertising prices. Responsive, other-timeframe (OTF) participants aggressively enter the market, leaving tails or gaps which denote unfair prices.

Value-Area Placement: Perception of value unchanged if value overlapping (i.e., inside day). Perception of value has changed if value not overlapping (i.e., outside day). Delay trade in the former case.

News And Analysis

JPMorgan’s Kolanovic says stocks can handle $130 oil.

Chinese developers are faced with cuts to credit ratings.

Federal Reserve will wimp out on hikes despite inflation.

Evergrande skips 3rd round of bond coupon payments.

More clarity on inflation doesn’t mean the news is good.

What People Are Saying

About

After years of self-education, strategy development, and trial-and-error, Renato Leonard Capelj began trading full-time and founded Physik Invest to detail his methods, research, and performance in the markets. 

Additionally, Capelj is a finance and technology reporter. Some of his biggest works include interviews with leaders such as John Chambers, founder and CEO, JC2 Ventures, Kevin O’Leary, businessman and Shark Tank host, Catherine Wood, CEO and CIO, ARK Invest, among others.

Disclaimer

At this time, Physik Invest does not manage outside capital and is not licensed. In no way should the materials herein be construed as advice. Derivatives carry a substantial risk of loss. All content is for informational purposes only.

Categories
Commentary

Daily Brief For October 11, 2021

Editor’s Note: The newsletter schedule has changed.

From now on, you can expect to see Daily Briefs only – Monday through Friday – posted shortly before 8:00 AM ET. The Weekly Trade Idea will be packaged into Monday’s commentary, also.

Thanks again for your continued support. I strive to simplify and add value, as best I can.

Market Commentary

Equity index futures trade sideways to lower with bonds. Commodities were mixed.

  • October bottom; a rip up into EOY?
  • Ahead: No economic reports today.

What Happened: Ahead of a busy start to the third-quarter earnings season, this week, U.S. stock index futures auctioned sideways to lower overnight alongside some mixed narratives.

Last night, it was revealed that Goldman Sachs Group (NYSE: GS) cut its U.S. growth forecast on consumption and a fiscal slowdown. Not even a day later, there is news that Goldman, alongside JPMorgan Chase & Co (NYSE: JPM) strategists, suggests the recent dip is a buy.

Given the Columbus Day holiday, today, no economic reports are scheduled.

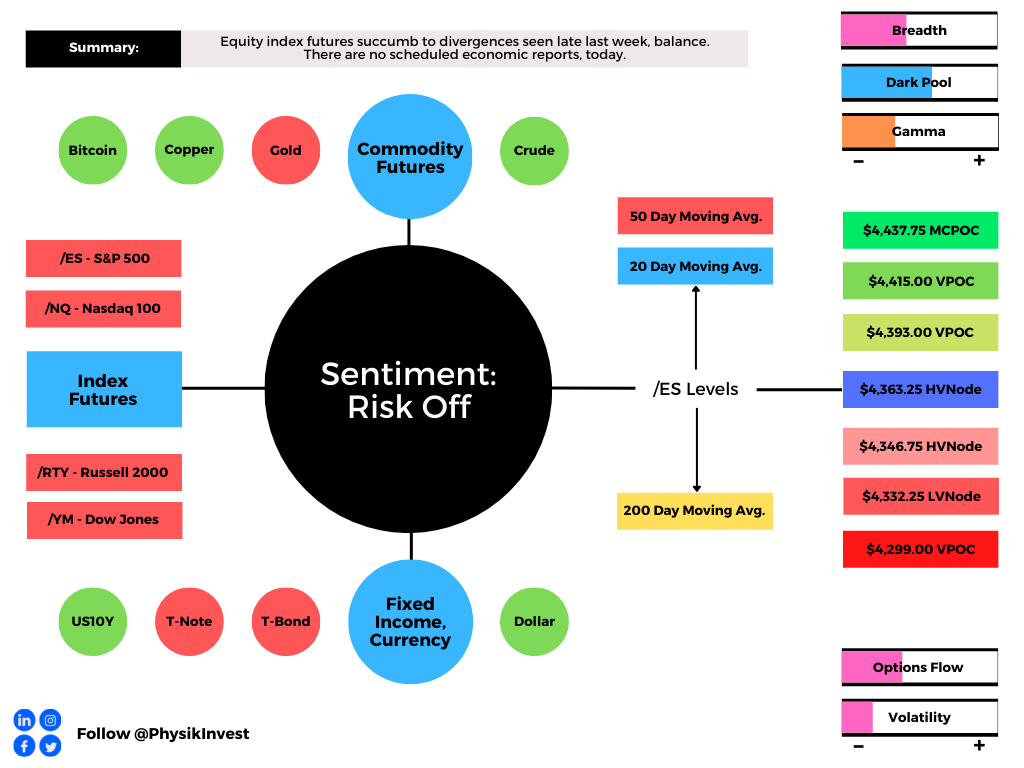
Graphic updated 6:20 AM ET. Sentiment Risk-Off if expected /ES open is below the prior day’s range. /ES levels are derived from the profile graphic at the bottom of the following section. SqueezeMetrics Dark Pool Index (DIX) and Gamma (GEX) calculations are based on where the prior day’s reading falls with respect to the MAX and MIN of all occurrences available. A higher DIX is bullish. At the same time, the lower the GEX, the more (expected) volatility. SHIFT data used for S&P 500 (INDEX: SPX) options activity. Note that options flow is sorted by the call premium spent; if more positive then more was spent on call options. Breadth reflects a reading of the prior day’s NYSE Advance/Decline indicator. VIX reflects a current reading of the CBOE Volatility Index (INDEX: VIX) from 0-100.

What To Expect: As of 6:20 AM ET, Monday’s regular session (9:30 AM – 4:00 PM EST) in the S&P 500 will likely open outside of prior-range and -value, suggesting a potential for immediate directional opportunity.

Gap Scenarios: Gaps ought to fill quickly. Should they not, that’s a signal of strength; do not fade. Leaving value behind on a gap-fill or failing to fill a gap (i.e., remaining outside of the prior session’s range) is a go-with indicator.

Auctioning and spending at least 1-hour of trade back in the prior range suggests a lack of conviction; in such a case, do not follow the direction of the most recent initiative activity.

Further, during the prior week’s trade, on mostly strong intraday breadth and divergent market liquidity metrics, equity index futures established a rounded bottom and minimal excess low.

Then, a swift recovery ensued; initiative sellers lacked the wherewithal to take prices lower, beyond the S&P 500’s $4,363.25-$4,278.00 balance area. Initiative buyers were then emboldened, expanding range and value the opposite way.

During this recovery process, the S&P 500 – as evidenced by p-shaped emotional, multiple-distribution profile structures – established a minimal excess high before momentum from covering shorts was overpowered by responsive selling at key areas of resting liquidity, at and around /ES $4,410.25 (SPY $441.00), the site of a key anchored volume-weighted average price (VWAP) level.

Note: Liquidity algorithms are benchmarked and programmed to buy and sell around VWAPs.

Friday’s session succumbed to divergences in buying and selling power as calculated by the difference in volume traded at the bid and offer, resolving some of the aforementioned emotional structures through what’s called the “cave-fill” process. 

During this process, participants revisited, repaired, and strengthened – building out areas of high volume (HVNodes), or value – areas low volume (LVNodes).

Note: The cave-fill process widened the area deemed favorable to transact at by an increased share of participants. This is a good development.

Moreover, September’s seasonally-aligned weakness saw the Nasdaq 100 lead lower. Last week – alongside improvement amongst some positioning metrics – the tone shifted with the cash-settled Nasdaq 100 (INDEX: NDX) rising 4.35% versus the S&P 500 (INDEX: SPX) rising 3.25%.

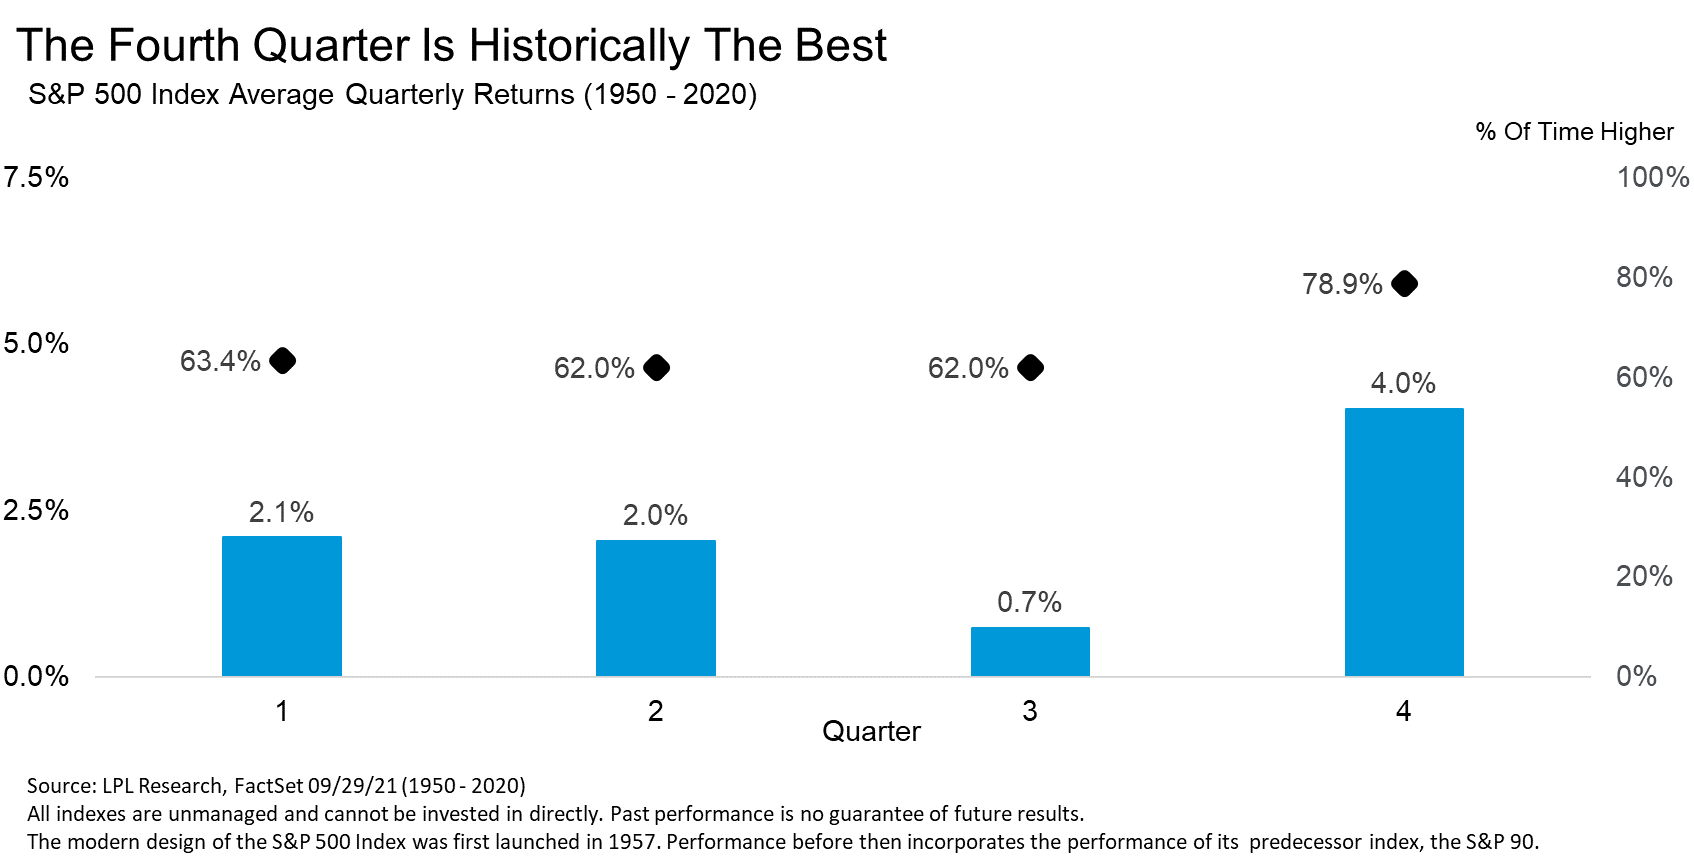
That comes as October traditionally marks an end to weakness amidst a cycle of rebalancing and earnings; according to LPL Financial Research, “Stocks rise 3.8% on average during the fourth quarter, but the past seven times the S&P 500 was up 15% year-to-date heading into the home stretch of the year, the fourth quarter was higher every single time, up a very impressive 5.8%.” 

“Earnings for the third quarter should again be strong and mostly outpace expectations,” Leuthold Group chief investment strategist Jim Paulsen adds. “Hours worked in the third quarter rose by about 5% suggesting real GDP for the quarter may be close to 7%. With most companies reporting strong pricing power, solid real GDP growth should result in another surprisingly strong corporate earnings season.”

Graphic: LPL Financial Research unpacks S&P 500 seasonality.
Graphic: SPDR S&P 500 ETF (NYSE: SPY) top left, Invesco QQQ Trust Series 1 (NASDAQ: QQQ) top right, iShares Russell 2000 ETF (NYSE: IWM) bottom left, SPDR Dow Jones Industrial Average ETF Trust (NYSE: DIA) bottom right. Spending more than a few hours of trade above trend, VWAP (yellow), and the 61.80% Fibonacci retracement suggest good odds of upside continuation.

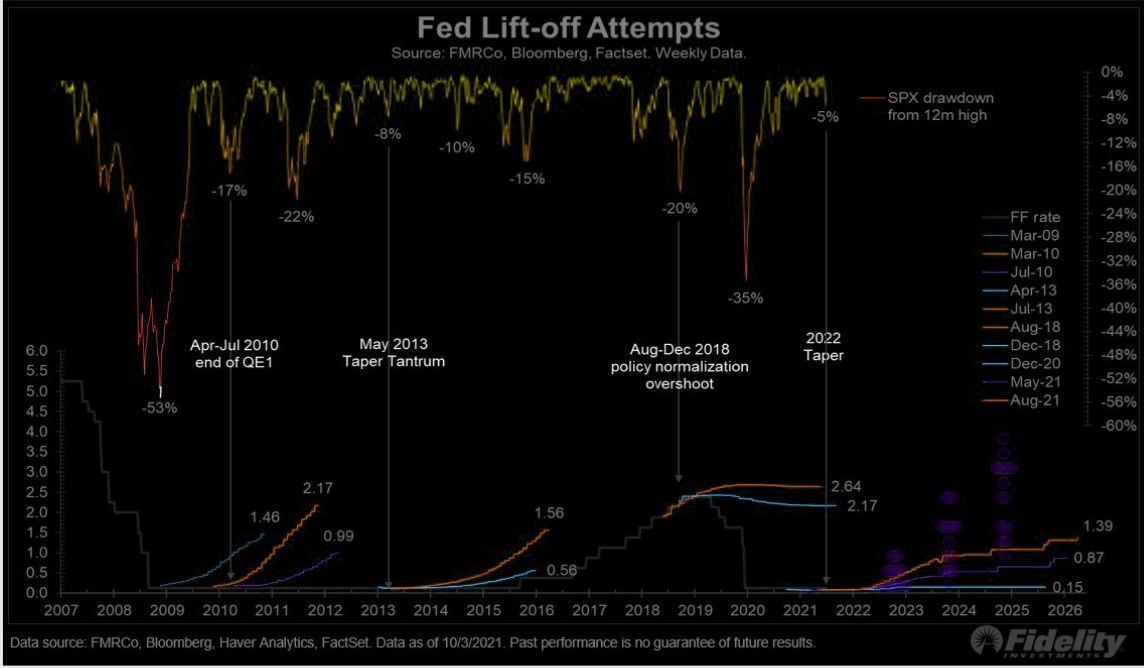
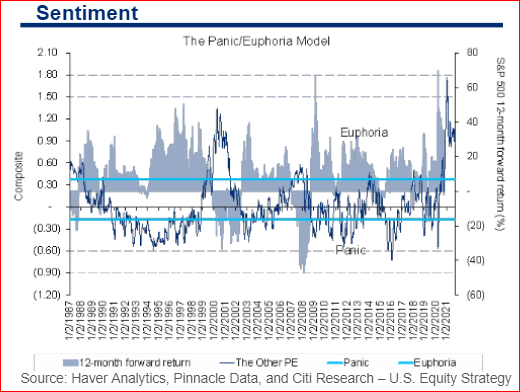
Notwithstanding, some risks to be aware of include the Federal Reserve’s tapering initiatives and the prospects of a rise in the Fed funds rate, amidst hot sentiment, a decline in top-of-book depth, as well as back and forth entry (exit) into (from) short-gamma.

“What we see in the equity space is a lot of sensitivity to higher real yields,” Joseph Little, chief global strategist at HSBC Holdings Plc (NYSE: HSBC) Asset Management, said. “We are seeing policy normalization everywhere. That creates a little bit of a challenge for [the] equity market because it does change the drivers of equity performance.”

Graphic: A “gentle reminder of the fact tapering matters,” via The Market Ear.
Graphic: Sentiment elevated, “generating a 96% historical probability of down markets in the next 12 months at current levels.”

In addition, to balance some of our Q4 bullishness, in a quote highlighted by The Market Ear, Bank of America Corporation (NYSE: BAC) explained: September 30 “was the 24th time since 1928 that the S&P experienced two or more 3-sigma shocks in 10 trading days, … [and] only in 3 of 23 episodes (and 1 in the last 50yrs) did the S&P surpass the prior month’s peak in the month following the second shock.”

Moreover, for today, participants may make use of the following frameworks.

In the best case, the S&P 500 trades sideways or higher; activity above the $4,363.25 high volume area (HVNode) puts in play the $4,393.00 untested point of control (VPOC). Initiative trade beyond the $4,393.00 VPOC could reach as high as the $4,415.00 VPOC and $4,437.75 micro composite point of control (MCPOC), or higher.

In the worst case, the S&P 500 trades lower; activity below the $4,363.25 HVNode puts in play the $4,346.75 HVNode. Initiative trade beyond the HVNode could reach as low as the $4,332.25 low volume area (LVNode) and $4,299.00 VPOC, or lower.

Graphic: 65-minute profile chart of the Micro E-mini S&P 500 Futures updated 6:20 AM ET.

Definitions

Volume Areas: A structurally sound market will build on areas of high volume (HVNodes). Should the market trend for long periods of time, it will lack sound structure, identified as low volume areas (LVNodes). LVNodes denote directional conviction and ought to offer support on any test. 

If participants were to auction and find acceptance into areas of prior low volume (LVNodes), then future discovery ought to be volatile and quick as participants look to HVNodes for favorable entry or exit.

Gamma: Gamma is the sensitivity of an option to changes in the underlying price. Dealers that take the other side of options trades hedge their exposure to risk by buying and selling the underlying. When dealers are short-gamma, they hedge by buying into strength and selling into weakness. When dealers are long-gamma, they hedge by selling into strength and buying into weakness. The former exacerbates volatility. The latter calms volatility.

POCs: POCs are valuable as they denote areas where two-sided trade was most prevalent in a prior day session. Participants will respond to future tests of value as they offer favorable entry and exit.

MCPOCs: POCs are valuable as they denote areas where two-sided trade was most prevalent over numerous day sessions. Participants will respond to future tests of value as they offer favorable entry and exit.

Excess: A proper end to price discovery; the market travels too far while advertising prices. Responsive, other-timeframe (OTF) participants aggressively enter the market, leaving tails or gaps which denote unfair prices.

Value-Area Placement: Perception of value unchanged if value overlapping (i.e., inside day). Perception of value has changed if value not overlapping (i.e., outside day). Delay trade in the former case.

News And Analysis

Banks bought epic amounts of safe assets; forget inflation.

The Fed is likely to side with growth and keep policy easy.

Merck seeks emergency use authorization for COVID pills.

Europe Economic Snapshot: Faster-than-expected restart.

Latin America settles into new post-pandemic slow growth.

S&P talking stock-flow confusion again – QE and tapering.

What People Are Saying

Weekly Trade Idea

About

After years of self-education, strategy development, and trial-and-error, Renato Leonard Capelj began trading full-time and founded Physik Invest to detail his methods, research, and performance in the markets. 

Additionally, Capelj is a finance and technology reporter. Some of his biggest works include interviews with leaders such as John Chambers, founder and CEO, JC2 Ventures, Kevin O’Leary, businessman and Shark Tank host, Catherine Wood, CEO and CIO, ARK Invest, among others.

Disclaimer

At this time, Physik Invest does not manage outside capital and is not licensed. In no way should the materials herein be construed as advice. Derivatives carry a substantial risk of loss. All content is for informational purposes only.
Categories
Commentary

Weekly Brief For August 1, 2021

Editor’s Note: On Thursday (8/5) and Friday (8/6) there will be no Daily Brief newsletter. Additionally, there will be no Weekly Brief Sunday (8/8), either. All commentaries to resume August 9, 2021.

If in the Miami, Florida area please contact renato@physikinvest.com if interested in connecting over markets, fintech, and the like.

PS: Added a new “Weekly Trade Ideas” section. Hope it provides added value!

Regards,

Renato Leonard Capelj

Market Commentary

Key Takeaways: Equity index futures to start the week off neutral, in prior-range and -value.

  • Debt limit, China, fiscal policy cloud outlook.
  • Expecting a heavy week for economic data.
  • Responsive trade until key levels are taken.
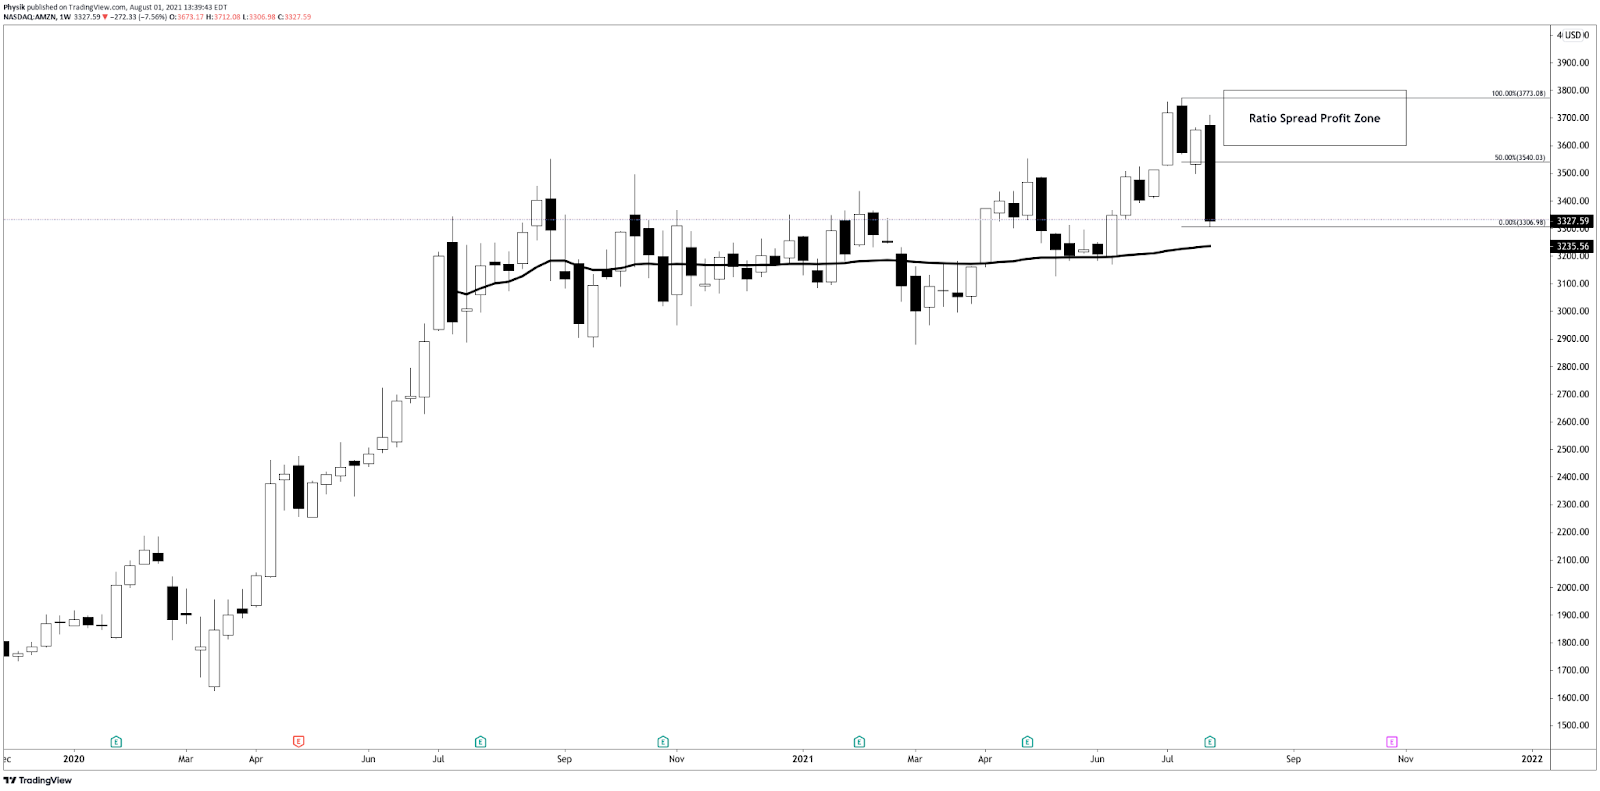
  • Amazon Inc (NASDAQ: AMZN) trade ideas.

What Happened: With respect to hot topic market risks, the week prior offered a ton of information to add to our narrative. We list for clarity.

  • Debt Limit: The August 1 reinstatement of the U.S. debt limit may have severe consequences, increasing the odds of a rating downgrade on government debt.
  • Monetary: Come September, participants will likely receive increased clarity over taper timelines with an official start early next year. Adding, Chairman Jerome Powell expressed inflation as temporary and the committee announced the creation of a pair of standing facilities to strengthen its ability to be the lender of last resort in the repo market.
  • China: Cross-asset volatility in China worsened, prompting talk of a yuan devaluation. A devaluation is something to fear; to note, The People’s Bank of China (PBOC) roiled global equity markets after its 2015 yuan devaluation.
  • Growth: U.S. economic data came in weaker suggesting growth likely peaked. Notwithstanding, consumer confidence improved markedly with sentiment recovering fully. Moody’s strategists look for real GDP to rise 6.7% this year, a downward revision on some fiscal policy assumptions.
  • Fiscal: Lawmakers debate another round of stimulus to ensure the strong long-term growth of lower- and middle-income households. The proposed legislation is receiving pushback with respect to its impact on inflation and taxes. Moody’s strategists note “higher taxes will weigh on economic growth, but the impact on the economy from the higher proposed taxes will be small.”
  • Pandemic: COVID-19 variants are a cause for concern – especially with respect to the Federal Reserve’s tapering of quantitative easing – but hospitalization ratios and mobility metrics suggest the crisis is likely over. In other areas, the CDC’s rental eviction moratorium and FHFA’s foreclosure moratorium expired with forbearance on government-backed mortgages and student loans ending September, also.
  • Yields: Technical factors – issuance, short coverings, a fading reflation trade, and peak growth – are to blame for lower Treasury yields. A longer-term deviation from the implied “economic fair value” of 1.6% and 1.65% for the 10-year yield would suggest other forces are driving long-term interest rates.
  • Earnings: Year-over-year profit growth of S&P 500 constituents stands at 85% with 88% of companies beating estimates for revenue and profit, according to Business Insider
  • Positioning: According to one Bank of America Corporation (NYSE: BAC) comment, highlighted by The Market Ear, “The average recovery time following 2-sigma one-day S&P declines has shortened significantly post-GFC, reaching an all-time low this year.” This has a lot to do with the inventory positioning of participants; volatility is oversupplied and associated heading forces make it so there is more liquidity and less movement. Should the market unpin, there’s “not enough liquidity” to absorb leverage on the tails.

Putting it all together, Goldman Sachs Group Inc (NYSE: GS) believes “[e]xpectations of higher interest rates and higher corporate tax rates by year-end are the primary reasons [to] forecast that the S&P 500 will trade sideways,” into end-of-year.

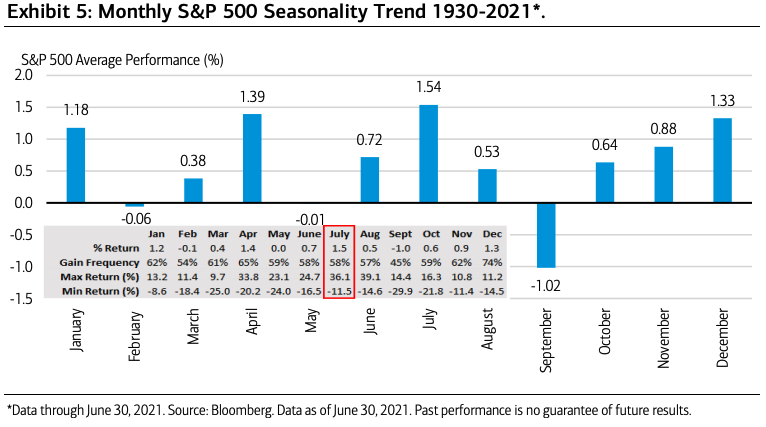
In support of that view is seasonality, also.

Graphic: Seasonality metrics via the Capital Market Outlook by Merrill.

What To Expect: The S&P 500, Nasdaq 100, and Dow Jones Industrial Average are above their key 20-, 50-, and 200-week moving averages while the Russell 2000 is stuck inside a multi-month trading range, between its 20- and 50-week moving averages.

Given the higher long-term trend, traders of the S&P 500, in particular, must contend with a week-long balance area, the result of participants finding higher prices valuable as they position themselves for a directional move, given increased clarity on earnings, taper, and more. 

Balance (Two-Timeframe Or Bracket): Rotational trade that denotes current prices offer favorable entry and exit. Balance-areas make it easy to spot a change in the market (i.e., the transition from two-time frame trade, or balance, to one-time frame trade, or trend).

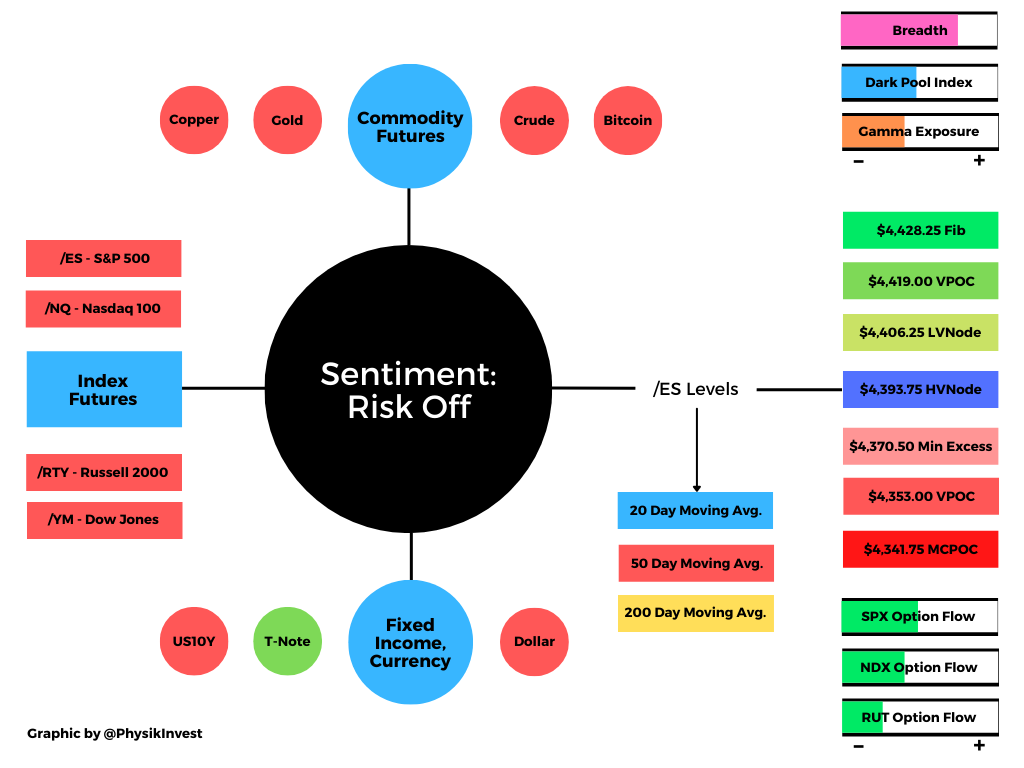
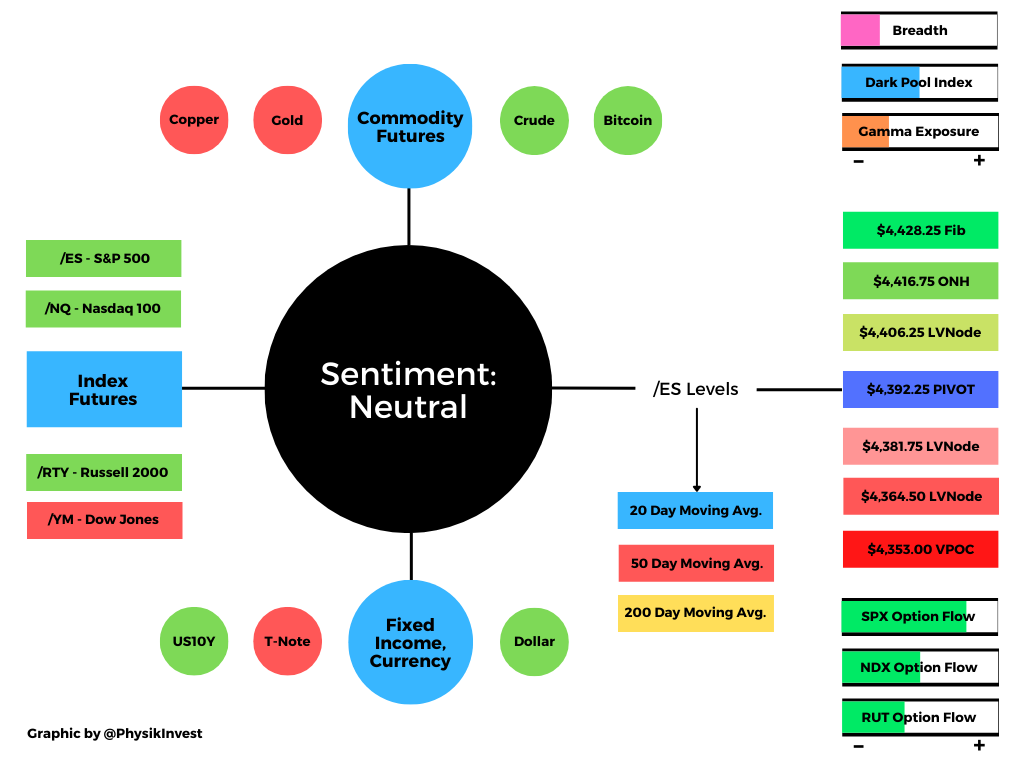
In the coming sessions, given that the modus operandi is responsive trade (i.e., fade the edges), rather than initiative trade (i.e., play the break), participants will want to focus their attention on where the S&P 500 trades in relation to the $4,392.25 high volume area (HVNode) pivot.

In the best case, the S&P 500 trades sideways or higher; activity above the $4,392.25 HVNode pivot puts in play the $4,406.25 low volume area (LVNode) and $4,419.00 untested point of control (VPOC). Initiative trade beyond the VPOC portends a potential breakout above the $4,422.75 minimal excess high, up to the $4,428.25 Fibonacci extension.

In the worst case, the S&P 500 trades lower; activity below the $4,392.25 HVNode pivot puts in play the $4,381.75 LVNode. Initiative trade beyond the LVNode portends a potential breakdown below the $4,370.50 minimal excess low, down to the $4,353.00 VPOC and $4,341.75 micro-composite point of control (MCPOC).

Volume Areas: A structurally sound market will build on past areas of high volume. Should the market trend for long periods of time, it will lack sound structure (identified as a low volume area which denotes directional conviction and ought to offer support on any test). 

If participants were to auction and find acceptance into areas of prior low volume, then future discovery ought to be volatile and quick as participants look to areas of high volume for favorable entry or exit.

POCs: POCs are valuable as they denote areas where two-sided trade was most prevalent. Participants will respond to future tests of value as they offer favorable entry and exit.

Excess: A proper end to price discovery; the market travels too far while advertising prices. Responsive, other-timeframe (OTF) participants aggressively enter the market, leaving tails or gaps which denote unfair prices.
Graphic: 65-minute profile chart of the Micro E-mini S&P 500 Futures. Note the blue anchored Volume Weighted Average Price (VWAP) which suggests the average buyer, since FOMC, is underwater. To note, VWAP is a metric highly regarded by chief investment officers, among other participants, for quality of trade. Additionally, liquidity algorithms are benchmarked and programmed to buy and sell around VWAPs.

Weekly Trade Idea

Please Note: In no way is the below a trade recommendation. It is a peek into the thought process here at Physik Invest. To cover my butt, so to speak, I say DO NOT take this trade. Also, if you would like to see this section included in future commentaries, email me at renato@physikinvest.com with the subject line “Please Include Weekly Trade Ideas”.

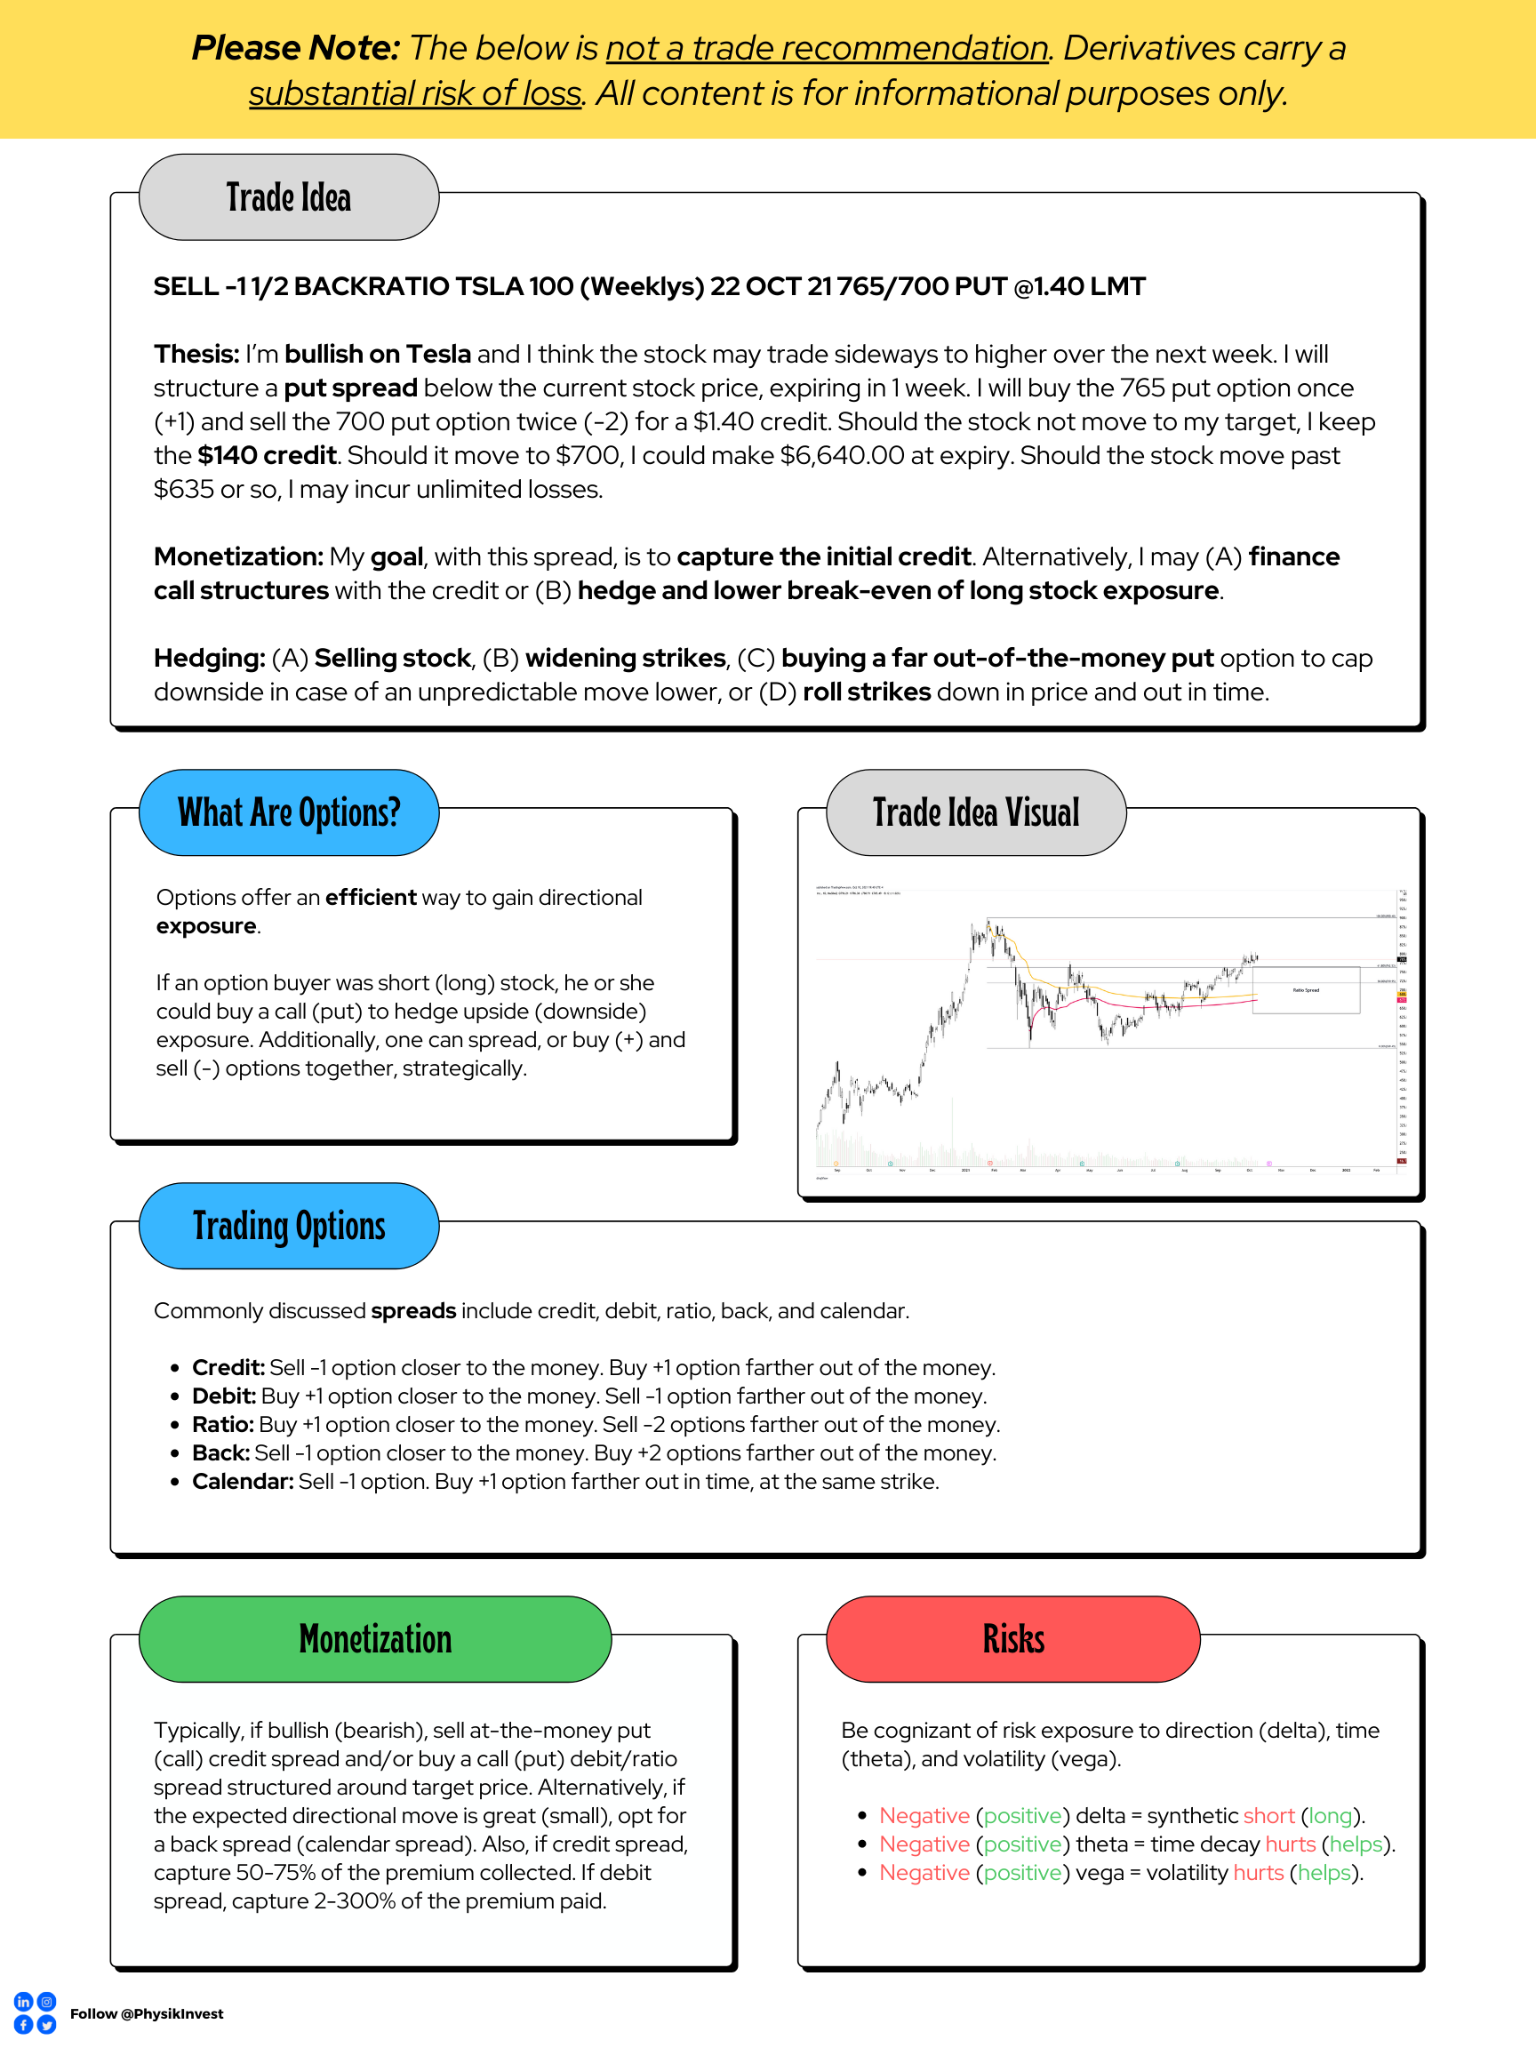
Options offer an efficient way to gain directional exposure. 

If an option buyer was short (long) stock, he or she could buy a call (put) to hedge upside (downside) exposure. Additionally, one can spread, or buy (+) and sell (-) options together, strategically.

Commonly discussed spreads include credit, debit, ratio, back, and calendar.

  • Credit: Sell -1 option closer to the money. Buy +1 option farther out of the money.
  • Debit: Buy +1 option closer to the money. Sell -1 option farther out of the money.
  • Ratio: Buy +1 option closer to the money. Sell -2 options farther out of the money. 
  • Back: Sell -1 option closer to the money. Buy +2 options farther out of the money.
  • Calendar: Sell -1 option. Buy +1 option farther out in time, at the same strike.

Typically, if bullish (bearish), sell at-the-money put (call) credit spread and/or buy a call (put) debit/ratio spread structured around target price. Alternatively, if the expected directional move is great (small), opt for a back spread (calendar spread). Also, if credit spread, capture 50-75% of the premium collected. If debit spread, capture 2-300% of the premium paid.

Be cognizant of risk exposure to direction (delta), time (theta), and volatility (vega). 

  • Negative (positive) delta = synthetic short (long). 
  • Negative (positive) theta = time decay hurts (helps).
  • Negative (positive) vega = volatility hurts (helps).

Trade Idea: SELL -1 1/2 BACKRATIO AMZN 100 (Weeklys) 6 AUG 21 3600/3700 CALL @.50 LMT

I’m bullish on Amazon and I think the stock may climb over the next week, toward $3,600. I will structure a spread above the current stock price, expiring in 1 week. I will buy the 3600 call option once (+1) and sell the 3700 call option twice (-2) for a $0.50 credit. Should the stock not move to my target, I keep the $50 credit. Should it move to $3,700, I could make $10,050.00 at expiry. Should the stock move past $3,850.00, I may incur unlimited losses. My goal, with this spread, is to capture the initial credit and close for additional credit if the stock moves higher. 

If necessary, I will hedge the position by either (A) buying long stock, (B) widening strikes, (C) buying a far out-of-the-money call option to cap upside in case of an unpredictable move higher, or (D) roll strikes up in price and out in time.

What People Are Saying

About

After years of self-education, strategy development, and trial-and-error, Renato Leonard Capelj began trading full-time and founded Physik Invest to detail his methods, research, and performance in the markets. 

Additionally, Capelj is a finance and technology reporter. Some of his biggest works include interviews with leaders such as John Chambers, founder, and CEO, JC2 Ventures, Kevin O’Leary, businessman and Shark Tank host, Catherine Wood, CEO and CIO, ARK Invest, among others.

Disclaimer

At this time, Physik Invest does not manage outside capital and is not licensed. In no way should the materials herein be construed as advice. Derivatives carry a substantial risk of loss. All content is for informational purposes only.
Categories
Commentary

Daily Brief For July 30, 2021

Market Commentary

Screens go red as equity index and commodity futures trade lower.

  • Mega-cap growth, China concerning.
  • Earnings, sentiment, and much more.
  • Favoring sideways, responsive trade.

What Happened: U.S. stock index futures auctioned lower overnight alongside narratives surrounding slowing mega-cap growth, China, and COVID-19. 

“The earnings season has delivered strong results so far, however, some investors are concerned that earnings growth will slow from here,” said Lewis Grant of Federated Hermes. “On the other hand, the economy is opening up as we move past the peak infections and consumer balance sheets are strong, and that should support the cyclical end of the market.”

Moreover, ahead is data on earnings, as well as the employment cost index, personal income, consumer spending, core inflation, Chicago PMI, and University of Michigan sentiment.

Graphic updated 6:40 AM ET. Sentiment Risk-Off if expected /ES open is below the prior day’s range. See here for more on the Dark Pool Index and Gamma. A positive Dark Pool Index reading is bullish. At the same time, the higher (lower) the gamma, the less (more) volatility. SHIFT Search data used for options activity. Note that options flow is sorted by the call premium spent; if green and more (less) positive then more (less) was spent on call options. Breadth reflects a reading of the prior day’s Advance/Decline indicator.

What To Expect: As of 6:40 AM ET, Friday’s regular session (9:30 AM – 4:00 PM EST) in the S&P 500 will likely open on a gap, outside of prior-range and -value, suggesting a potential for directional opportunity.

Gap Scenarios: Gaps ought to fill quickly. Should they not, that’s a signal of strength; do not fade. Leaving value behind on a gap-fill or failing to fill a gap (i.e., remaining outside of the prior session’s range) is a go-with indicator.

Auctioning and spending at least 1-hour of trade back in the prior range suggests a lack of conviction; in such a case, do not follow the direction of the most recent initiative activity.

That said, we take the word potential lightly, given the current technical juncture; the S&P 500 is trading within a larger balance area, the result of participants finding higher prices valuable as they position themselves for a directional move, given increased clarity on earnings, taper, and more. 

Balance (Two-Timeframe Or Bracket): Rotational trade that denotes current prices offer favorable entry and exit. Balance-areas make it easy to spot a change in the market (i.e., the transition from two-time frame trade, or balance, to one-time frame trade, or trend).

The modus operandi, in light of the above, is therefore responsive trade (i.e., fade the edges), rather than initiative trade (i.e., play the break).

In support of a fade are metrics with respect to breadth, market liquidity, and the options market. 

Breadth, at the exchange level, was positive yesterday with a steady, albeit soft inflow into the stocks that were up, versus those that were down. 

Similarly, into Thursday’s price rise, the cumulative volume delta became increasingly divergent, decreasing confidence in initiative trade beyond the $4,416.75 overnight high (ONH). 

In light of the decreased confidence, volume profiling also reveals a minimal excess high which could be construed as an improper end to price discovery. 

Volume Delta: Buying and selling power as calculated by the difference in volume traded at the bid and offer.

Excess: A proper end to price discovery; the market travels too far while advertising prices. Responsive, other-timeframe (OTF) participants aggressively enter the market, leaving tails or gaps which denote unfair prices.

Putting it all together, with options market activity supporting potential pinning into Friday’s weekly options expiry, odds favor sideways trade, more than anything else. 

Furthermore, for today, participants can trade from the following frameworks. 

In the best case, the S&P 500 trades sideways or higher; activity above the $4,393.75 high volume area (HVNode) pivot puts in play the $4,406.25 low volume area (LVNode). Initiative trade beyond the LVNode could reach as high as $4,419.00 untested point of control (VPOC) and $4,428.25 Fibonacci price extension.

In the worst case, the S&P 500 trades lower; activity below the $4,393.75 pivot puts in play the $4,370.50 minimal excess low. Initiative trade beyond the minimal excess low could reach as low as the $4,353.00 VPOC and $4,341.75 micro composite point of control (MCPOC).

Volume Areas: A structurally sound market will build on past areas of high volume. Should the market trend for long periods of time, it will lack sound structure (identified as a low volume area which denotes directional conviction and ought to offer support on any test). 

If participants were to auction and find acceptance into areas of prior low volume, then future discovery ought to be volatile and quick as participants look to areas of high volume for favorable entry or exit.

POCs: POCs are valuable as they denote areas where two-sided trade was most prevalent. Participants will respond to future tests of value as they offer favorable entry and exit.
Graphic: 65-minute profile chart of the Micro E-mini S&P 500 Futures. Graphic updated 6:40 AM ET.

News And Analysis

Industrial policy is back as the West dusts off old ideas to counter China.

Global financing condition – issuance strong despite modest contraction.

Nordea talks European-area GDP and inflation: country-level differences.

Fears of a U.S. market correction increase as stocks climb to new highs.

Robinhood got Catherine Wood’s backing despite miserable trading day.

Chinese stocks slipped, ending the wild week as traders price in realities.

What People Are Saying

About

After years of self-education, strategy development, and trial-and-error, Renato Leonard Capelj began trading full-time and founded Physik Invest to detail his methods, research, and performance in the markets. Additionally, Capelj is a finance and technology reporter. Some of his biggest works include interviews with leaders such as John Chambers, founder and CEO, JC2 Ventures, Kevin O’Leary, businessman and Shark Tank host, Catherine Wood, CEO and CIO, ARK Invest, among others.

Disclaimer

At this time, Physik Invest does not manage outside capital and is not licensed. In no way should the materials herein be construed as advice. Derivatives carry a substantial risk of loss. All content is for informational purposes only.
Categories
Commentary

Daily Brief For July 28, 2021

Market Commentary

Equity index futures trade higher ahead of key fundamental events.

  • ECB comments, COVID, geopolitics.
  • Ahead: Trade data, FOMC, earnings.
  • Mixed bag. No follow-through lower.

What Happened: U.S. stock index futures auctioned sideways to higher ahead of some key fundamental developments.

In addition to the 8:30 AM release on advance trade in goods, as well as key earnings from heavily-weighted index constituents like Facebook Inc (NASDAQ: FB), participants will look to also price in the 2:00 PM ET Federal Open Market Committee (FOMC) announcement and Fed Chair Jerome Powell’s press conference.

As stated in the Weekly Brief, the U.S. is in a different place from the rest of the world and is likely to eliminate its output gap this year which would call for a tightening in policy and dollar strengthening, helping douse inflation.

Moody’s strategists note: “The impressive growth in value across many asset classes is projected to taper off within the next couple of years as supportive policy is unwound. The 10-year Treasury yield will rise above 2% by 2022 and the fiscal tailwinds will also have faded by then.”

Graphic updated 7:00 AM ET. Sentiment Neutral if expected /ES open is inside of the prior day’s range. See here for more on the Dark Pool Index and Gamma. A positive Dark Pool Index reading is bullish. At the same time, the higher (lower) the gamma, the less (more) volatility. SHIFT Search data used for options activity. Note that options flow is sorted by the call premium spent; if green and more (less) positive then more (less) was spent on call options. Breadth reflects a reading of the prior day’s Advance/Decline indicator.

What To Expect: As of 7:00 AM ET, Wednesday’s regular session (9:30 AM – 4:00 PM EST) in the S&P 500 will likely open inside of prior-range and -value, suggesting a limited potential for immediate directional opportunity.

Adding, during Tuesday’s volatile trade, the best case outcome occurred, evidenced by the S&P 500’s trade above a developing Volume Weighted Average Price (VWAP) pinch. This suggests the average buyer since the overnight high – $4,416.76 ONH – is in a winning position.

Overnight Rally Highs (Lows): Typically, there is a low historical probability associated with overnight rally-highs (lows) ending the upside (downside) discovery process.

Moving on, it’s important to take note of some topline and internal divergences. 

After establishing the new ONH, weakness in China spilled over; U.S. equity index futures, led by the Russell 2000 and Nasdaq 100 sold fast and heavy up until the Nasdaq 100 found responsive buyers at a key technical level – the 20-day simple moving average – that corresponded with a thick base of resting liquidity. After, the entire market reversed and closed in range.

In terms of internal divergences, breadth was significantly weaker on the Nasdaq side.

Graphic: Equity indexes traded lower as internal metrics – like the ratio of advancers to decliners – weakened.

Given the technical context, for today, participants can trade from the following frameworks. 

In the best case, the S&P 500 trades sideways or higher; activity above the $4,392.25 high volume area (HVNode) pivot likely puts in play the $4,406.25 low volume area (LVNode). Trade beyond the LVNode could reach as high as the $4,416.75 ONH and $4,428.25 Fibonacci extension.

In the worst case, the S&P 500 trades lower; activity below the $4,392.25 HVNode pivot likely puts in play the $4,381.75 LVNode. Trade beyond the $4,381.75 figure could reach as low as the $4,364.50 LVNode and $4,353.00 untested Point of Control (VPOC).

Volume Areas: A structurally sound market will build on past areas of high volume. Should the market trend for long periods of time, it will lack sound structure (identified as a low volume area which denotes directional conviction and ought to offer support on any test). 

If participants were to auction and find acceptance into areas of prior low volume, then future discovery ought to be volatile and quick as participants look to areas of high volume for favorable entry or exit.

POCs: POCs are valuable as they denote areas where two-sided trade was most prevalent. Participants will respond to future tests of value as they offer favorable entry and exit.
Graphic: 65-minute profile chart of the Micro E-mini S&P 500 Futures. Graphic updated 6:55 AM ET.

News And Analysis

The COVID trauma has changed economics forever. 

Credit Suisse probe is showing due diligence failings.

Spiraling debt crisis confronts Evergrande billionaire.

American job market optimism reached 21-year high.

What People Are Saying

About

After years of self-education, strategy development, and trial-and-error, Renato Leonard Capelj began trading full-time and founded Physik Invest to detail his methods, research, and performance in the markets. Additionally, Capelj is a finance and technology reporter. Some of his biggest works include interviews with leaders such as John Chambers, founder and CEO, JC2 Ventures, Kevin O’Leary, businessman and Shark Tank host, Catherine Wood, CEO and CIO, ARK Invest, among others.

Disclaimer

At this time, Physik Invest does not manage outside capital and is not licensed. In no way should the materials herein be construed as advice. Derivatives carry a substantial risk of loss. All content is for informational purposes only.
Categories
Commentary

Daily Brief For July 27, 2021

Market Commentary

Led by the Russell 2000, U.S. equity index futures explored lower overnight.

  • Risk-off everything China-related.
  • Ahead: Data dump and earnings.
  • S&P stuck in range, VWAP pinch.

What Happened: U.S. stock index futures auctioned sideways to lower as equity weakness in China deepened. Chinese government bonds and the yuan fell also, alongside fears that U.S. funds are selling Hong Kong and China assets aggressively.

In light of the volatility, Crescat Capital portfolio manager Otavio Costa tweeted: “A yuan devaluation is one of the main deflationary risks today. I know you heard this over and over again… but something is indeed unraveling. Chinese banks and ADRs are in big trouble. PBOC will be forced to act.”

A devaluation is indeed something to fear. The People’s Bank of China (PBOC) roiled global equity markets after its 2015 yuan devaluation.

In addition to this context, ahead, participants will receive data on durable and nondefense capital good orders, the S&P Case-Shiller home price index, consumer confidence, housing vacancies, as well as Apple Inc (NASDAQ: AAPL), Microsoft Corporation (NASDAQ: MSFT), and Alphabet Inc (NASDAQ: GOOGL) earnings.

Graphic updated 6:40 AM ET. Sentiment Neutral if expected /ES open is inside of the prior day’s range. See here for more on the Dark Pool Index and Gamma. A positive Dark Pool Index reading is bullish. At the same time, the higher (lower) the gamma, the less (more) volatility. SHIFT Search data used for options activity. Note that options flow is sorted by the call premium spent; if green and more (less) positive then more (less) was spent on call options. Breadth reflects a reading of the prior day’s Advance/Decline indicator.

What To Expect: As of 6:40 AM ET, Tuesday’s regular session (9:30 AM – 4:00 PM EST) in the S&P 500 will likely open inside of prior-range and -value, suggesting a limited potential for immediate directional opportunity.

After establishing a new high – $4,416.75 – overnight, weakness in China spilled over; U.S. equity index futures, led by the Russell 2000, traded lower in conjunction with yields, a boost to the tech- and growth-heavy Nasdaq 100.

Rates: Low rates have to potential to increase the present value of future earnings making stocks, especially those that are high growth, more attractive. To note, inflation and rates move inversely to each other. Low rates stimulate demand for loans (i.e., borrowing money is more attractive). In conjunction with the rapid recovery, lower rates may solicit hawkish commentary as policymakers look to inhibit inflation.

To note, Monday’s trade happened on positive, albeit weak breadth, similar to Friday’s session. At the same time, a Volume Weighted Average Price pinch developed.

Volume Weighted Average Price (VWAP): A metric highly regarded by chief investment officers, among other participants, for quality of trade. Additionally, liquidity algorithms are benchmarked and programmed to buy and sell around VWAPs. ​​

Look to buy above a flat/rising VWAP pinch. Sell below a flat/declining VWAP pinch.

All that said, similar to Monday, a key thing to watch for is an auction failure and subsequent liquidation break, confirmed by trade below the $4,372.50 regular trade low (RTH Low).

Liquidation Breaks: The profile shape suggests participants were “too” long and had poor location.

Moreover, for today, participants can trade from the following frameworks. 

In the best case, the S&P 500 trades sideways or higher; activity above the $4,398.75 high volume area (HVNode) pivot puts in play the $4,408.75 low volume area (LVNode). Initiative trade beyond the LVNode could reach as high as the $4,416.75 overnight high (ONH) and $4,428.25 Fibonacci extension.

In the worst case, the S&P 500 trades lower; activity below the $4,398.75 HVNode pivot puts in play the $4,390.50 minimal excess low. Initiative trade beyond the $4,390.50 low could reach as low as the $4,374.25 HVNode and $4,353.00 untested Point of Control (VPOC).

Volume Areas: A structurally sound market will build on past areas of high volume. Should the market trend for long periods of time, it will lack sound structure (identified as a low volume area which denotes directional conviction and ought to offer support on any test). 

If participants were to auction and find acceptance into areas of prior low volume, then future discovery ought to be volatile and quick as participants look to areas of high volume for favorable entry or exit.

Overnight Rally Highs (Lows): Typically, there is a low historical probability associated with overnight rally-highs (lows) ending the upside (downside) discovery process.

Excess: A proper end to price discovery; the market travels too far while advertising prices. Responsive, other-timeframe (OTF) participants aggressively enter the market, leaving tails or gaps which denote unfair prices.

POCs: POCs are valuable as they denote areas where two-sided trade was most prevalent. Participants will respond to future tests of value as they offer favorable entry and exit.
Graphic: 65-minute profile chart of the Micro E-mini S&P 500 Futures. Graphic updated 6:40 AM ET.

News And Analysis

China’s yuan, bonds tank amid fears of foreign selling.

U.S. infrastructure talks are encountering some snags.

Bitcoin steady below $40,000 on Amazon speculation.

Hypothetical look at 35 years of SPX option strategies.

The Federal Reserve meeting starts today. Watch this.

What People Are Saying

About

After years of self-education, strategy development, and trial-and-error, Renato Leonard Capelj began trading full-time and founded Physik Invest to detail his methods, research, and performance in the markets. Additionally, Capelj is a finance and technology reporter. Some of his biggest works include interviews with leaders such as John Chambers, founder and CEO, JC2 Ventures, Kevin O’Leary, businessman and Shark Tank host, Catherine Wood, CEO and CIO, ARK Invest, among others.

Disclaimer

At this time, Physik Invest does not manage outside capital and is not licensed. In no way should the materials herein be construed as advice. Derivatives carry a substantial risk of loss. All content is for informational purposes only.

Categories
Commentary

Daily Brief For July 22, 2021

Market Commentary

Equity index futures trade higher as volatility implodes. Yields, commodities are higher, too. 

  • President Biden played down inflation.
  • Ahead: Claims, home sales, earnings.
  • Equity indices up on fantastic breadth.

What Happened: U.S. stock index futures auctioned higher alongside comments against inflation by President Joe Biden, yesterday. Virus fears ebbed as infections accelerated. 

Bitcoin extended its advance after Elon Musk, Catherine Wood, and Jack Dorsey talked cryptocurrency at a virtual event.

Ahead is data on weekly jobless claims, existing home sales, and corporate earnings. 

Graphic updated 6:30 AM ET. Sentiment Risk-On if expected /ES open is above the prior day’s range. See here for more on the Dark Pool Index and Gamma. A positive Dark Pool Index reading is bullish. At the same time, the higher (lower) the gamma, the less (more) volatility. SHIFT Search data used for options activity. Note that options flow is sorted by the call premium spent; if green and more (less) positive then more (less) was spent on call options. Breadth reflects a reading of the prior day’s Advance/Decline indicator.

What To Expect: As of 6:30 AM ET, Thursday’s regular session (9:30 AM – 4:00 PM EST) in the S&P 500 will likely open on a small gap, just outside of prior-range and -value, suggesting a potential for immediate directional opportunity.

Balance-Break and/or Gap Scenarios: Monitor for acceptance (i.e., more than 1-hour of trade) outside of the balance area.

Gaps ought to fill quickly. Should they not, that’s a signal of strength; do not fade. Leaving value behind on a gap-fill or failing to fill a gap (i.e., remaining outside of the prior session’s range) is a go-with indicator.

Auctioning and spending at least 1-hour of trade back in the prior range suggests a lack of conviction; in such a case, do not follow the direction of the most recent initiative activity.
Adding, during the prior day’s regular trade, the best case outcome occurred, evidenced by trade above the $4,334.25 spike base. As that happened, participants found increased acceptance at higher prices, moving the micro-composite Point of Control (MCPOC) up to $4,341.75, a pivot point (i.e., above = bullish, below = bearish) for today’s trade. This is noteworthy since it suggests the fairest price to do business, on a larger timeframe, is higher. 
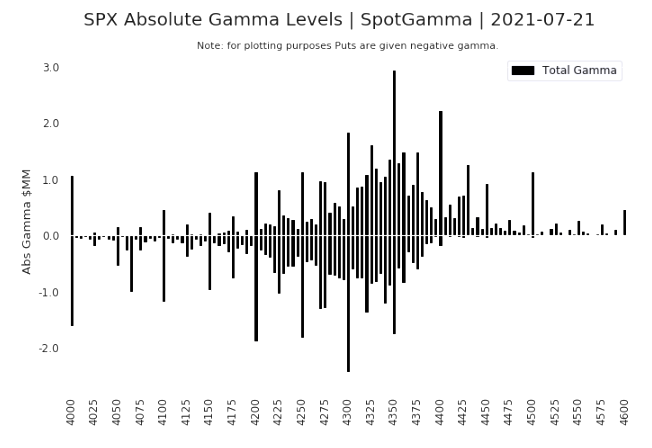
At the same time, in support of the price rise was fantastic breadth and dynamics with respect to the derivatives market; amidst a crash in volatility, associated hedging activities bolster the rally. 

Coming into the balance-area sellers initiated from the weak prior, however, certain mechanics may quell the upside volatility, potentially leading to a stall or slower advance. 

Graphic: SpotGamma data suggests the S&P 500 is back in so-called “long-gamma” territory. Gamma is the sensitivity of an option to changes in the underlying price. Dealers that take the other side of options trades hedge their exposure to risk by buying and selling the underlying. When dealers are short-gamma, they hedge by buying into strength and selling into weakness. When dealers are long-gamma, they hedge by selling into strength and buying into weakness. The former exacerbates volatility. The latter calms volatility.

Moreover, for today, participants can trade from the following frameworks. 

In the best case, the S&P 500 trades sideways or higher; activity above the $4,341.75 MCPOC puts participants just short of entry into a prior balance area, near the $4,357.75 low volume area (LVNode). Initiative trade beyond the $4,357.75 LVNode could reach as high as the $4,371.00 POC and $4,384.50 minimal excess regular trade high (RTH), the typical scenario on re-entry into balance. 

In the worst case, the S&P 500 trades lower; activity below the $4,341.75 MCPOC puts in play the $4,325.75 LVNode. Initiative trade beyond the $4,325.75 LVNode could reach as low as the $4,315.25 and $4,299.75 high volume areas (HVNodes). 

It is important to note also that the prior two HVNodes correspond with key Volume Weighted Average Price (VWAP) levels, a metric highly regarded by chief investment officers, among other participants, for quality of trade. Additionally, liquidity algorithms are benchmarked and programmed to buy and sell around VWAPs.

Balance (Two-Timeframe Or Bracket): Rotational trade that denotes current prices offer favorable entry and exit. Balance-areas make it easy to spot a change in the market (i.e., the transition from two-time frame trade, or balance, to one-time frame trade, or trend).

POCs: POCs are valuable as they denote areas where two-sided trade was most prevalent. Participants will respond to future tests of value as they offer favorable entry and exit.

Volume Areas: A structurally sound market will build on past areas of high volume. Should the market trend for long periods of time, it will lack sound structure (identified as a low volume area which denotes directional conviction and ought to offer support on any test). 

If participants were to auction and find acceptance into areas of prior low volume, then future discovery ought to be volatile and quick as participants look to areas of high volume for favorable entry or exit.

Excess: A proper end to price discovery; the market travels too far while advertising prices. Responsive, other-timeframe (OTF) participants aggressively enter the market, leaving tails or gaps which denote unfair prices.
Graphic: 65-minute profile chart of the Micro E-mini S&P 500 Futures. Updated 6:30 AM ET.

News And Analysis

Strong job and real estate markets support credit. (Moody’s)

Federal Reserve ramps up debate on taper timing. (WSJ)

China offers oil reserves in a move to cool oil rally. (BBG)

Biden dismisses inflation worries, warns on hiring. (BBG)

U.S.-China goods trade booms amid virus, tariffs. (BBG)

Powell has broad support among top Biden aides. (BBG)

PG&E plans to bury power lines in fire-risk areas. (WSJ)

EMEA economies recovering faster than thought. (S&P)

Structured finance sees issuances rising to $1.4T. (S&P)

What People Are Saying

About

After years of self-education, strategy development, and trial-and-error, Renato Leonard Capelj began trading full-time and founded Physik Invest to detail his methods, research, and performance in the markets. Additionally, Capelj is a finance and technology reporter. Some of his biggest works include interviews with leaders such as John Chambers, founder and CEO, JC2 Ventures, Kevin O’Leary, businessman and Shark Tank host, Catherine Wood, CEO and CIO, ARK Invest, among others.

Disclaimer

At this time, Physik Invest does not manage outside capital and is not licensed. In no way should the materials herein be construed as advice. Derivatives carry a substantial risk of loss. All content is for informational purposes only.