What Happened: U.S. stock index futures auctioned sideways to higher alongside an increased spread of COVID-19 variants, earnings, and tremendous bond market volatility.
The trade comes also as leading indicators for global economic growth show unusually strong readings, according to Merrill, “pointing to one of the strongest economic expansions of the past 70 years.” In line, strategists at JPMorgan Chase & Co (NYSE: JPM) revised higher their year-end S&P 500 price target from $4,400 to $4,600.
Ahead, participants are looking forward to data on oil market inventory and earnings.
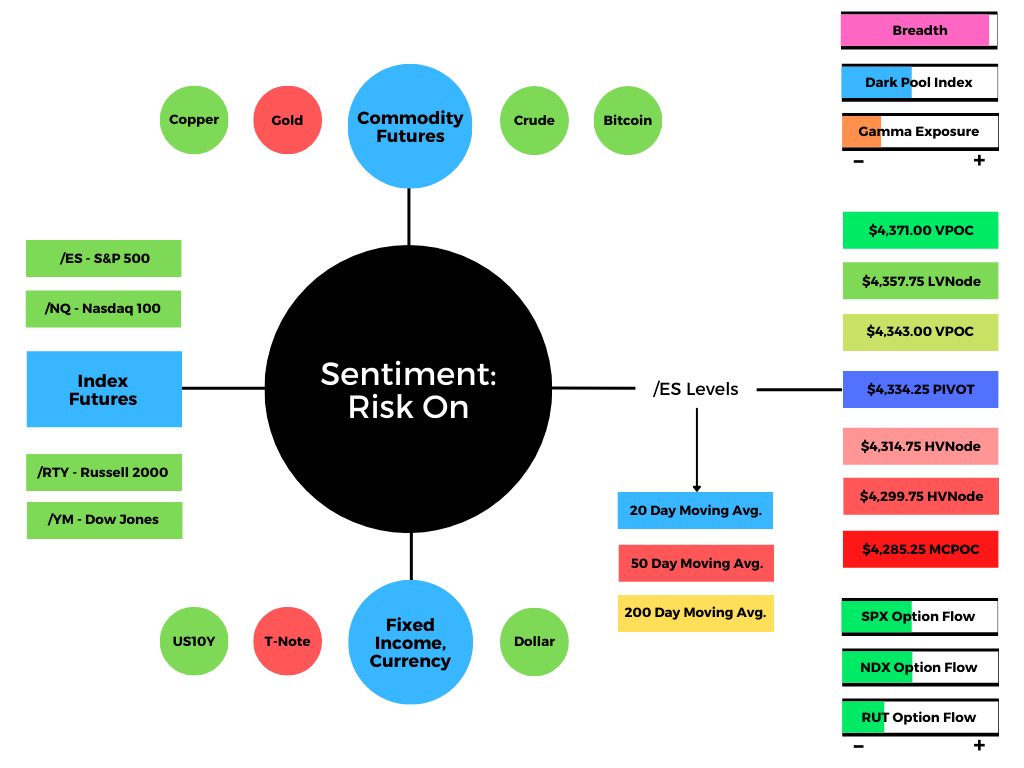
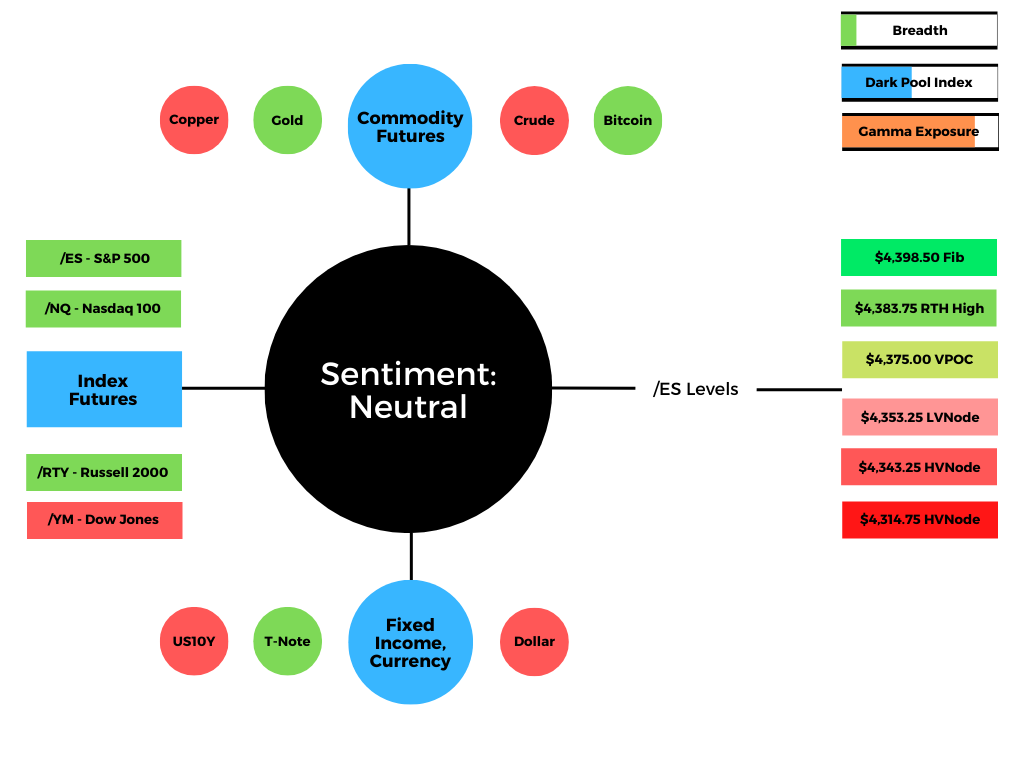
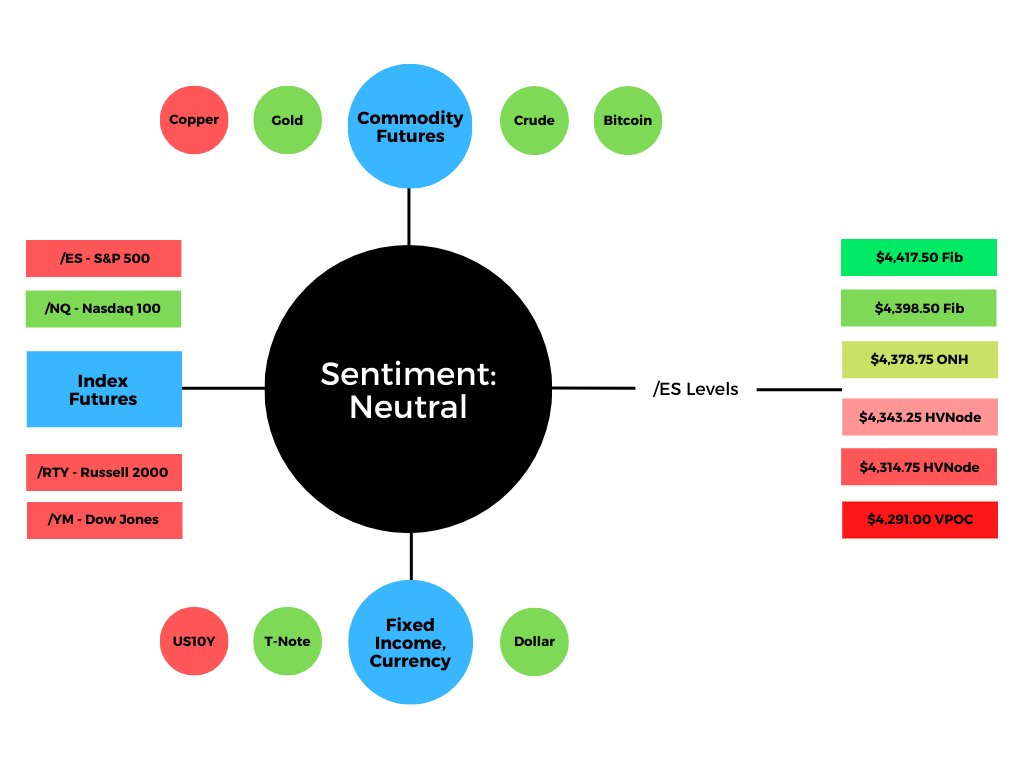
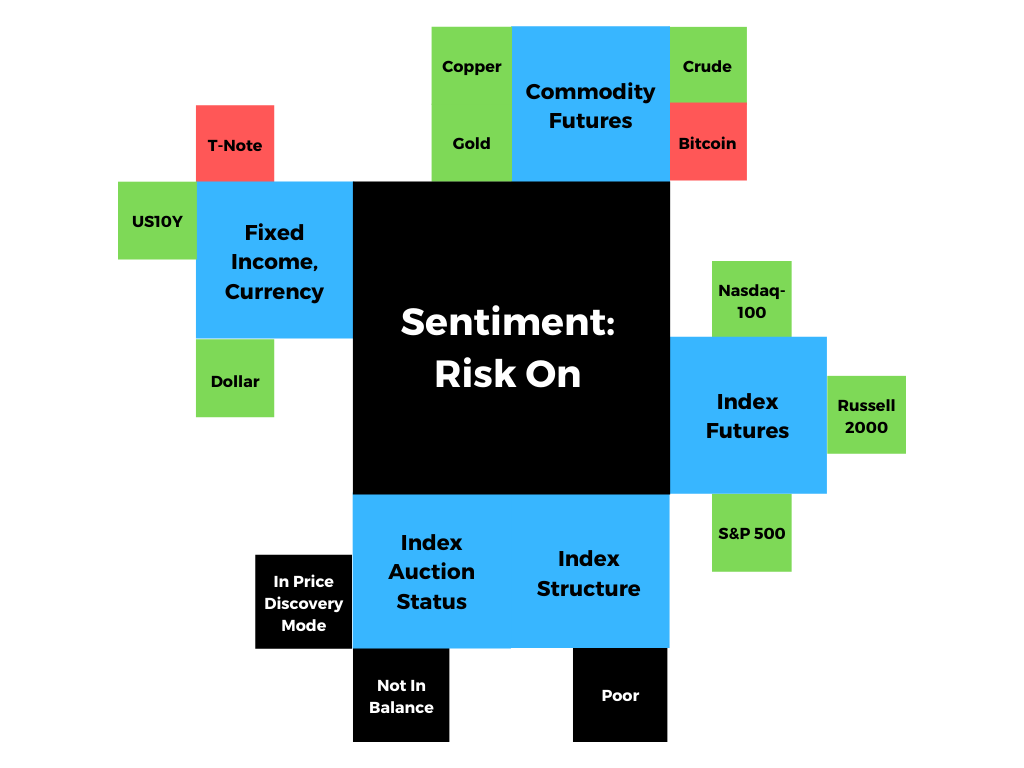
Graphic updated 6:30 AM ET. Sentiment Risk-On if expected /ES open is above the prior day’s range. A positive Dark Pool Index reading is bullish. At the same time, the higher (lower) the gamma, the less (more) volatility. SHIFT Search data used for options activity. Note that options flow is sorted by the call premium spent; if green and more (less) positive then more (less) was spent on call options. Breadth reflects a reading of the prior day’s Advance/Decline indicator.
What To Expect: As of 6:30 AM ET, Wednesday’s regular session (9:30 AM – 4:00 PM EST) in the S&P 500 will likely open on a small gap, just outside of prior-range and -value, suggesting a potential for directional opportunity.
Balance-Break and/or Gap Scenarios: Monitor for acceptance (i.e., more than 1-hour of trade) outside of the balance area.

Gaps ought to fill quickly. Should they not, that’s a signal of strength; do not fade. Leaving value behind on a gap-fill or failing to fill a gap (i.e., remaining outside of the prior session’s range) is a go-with indicator.

Auctioning and spending at least 1-hour of trade back in the prior range suggests a lack of conviction; in such a case, do not follow the direction of the most recent initiative activity.
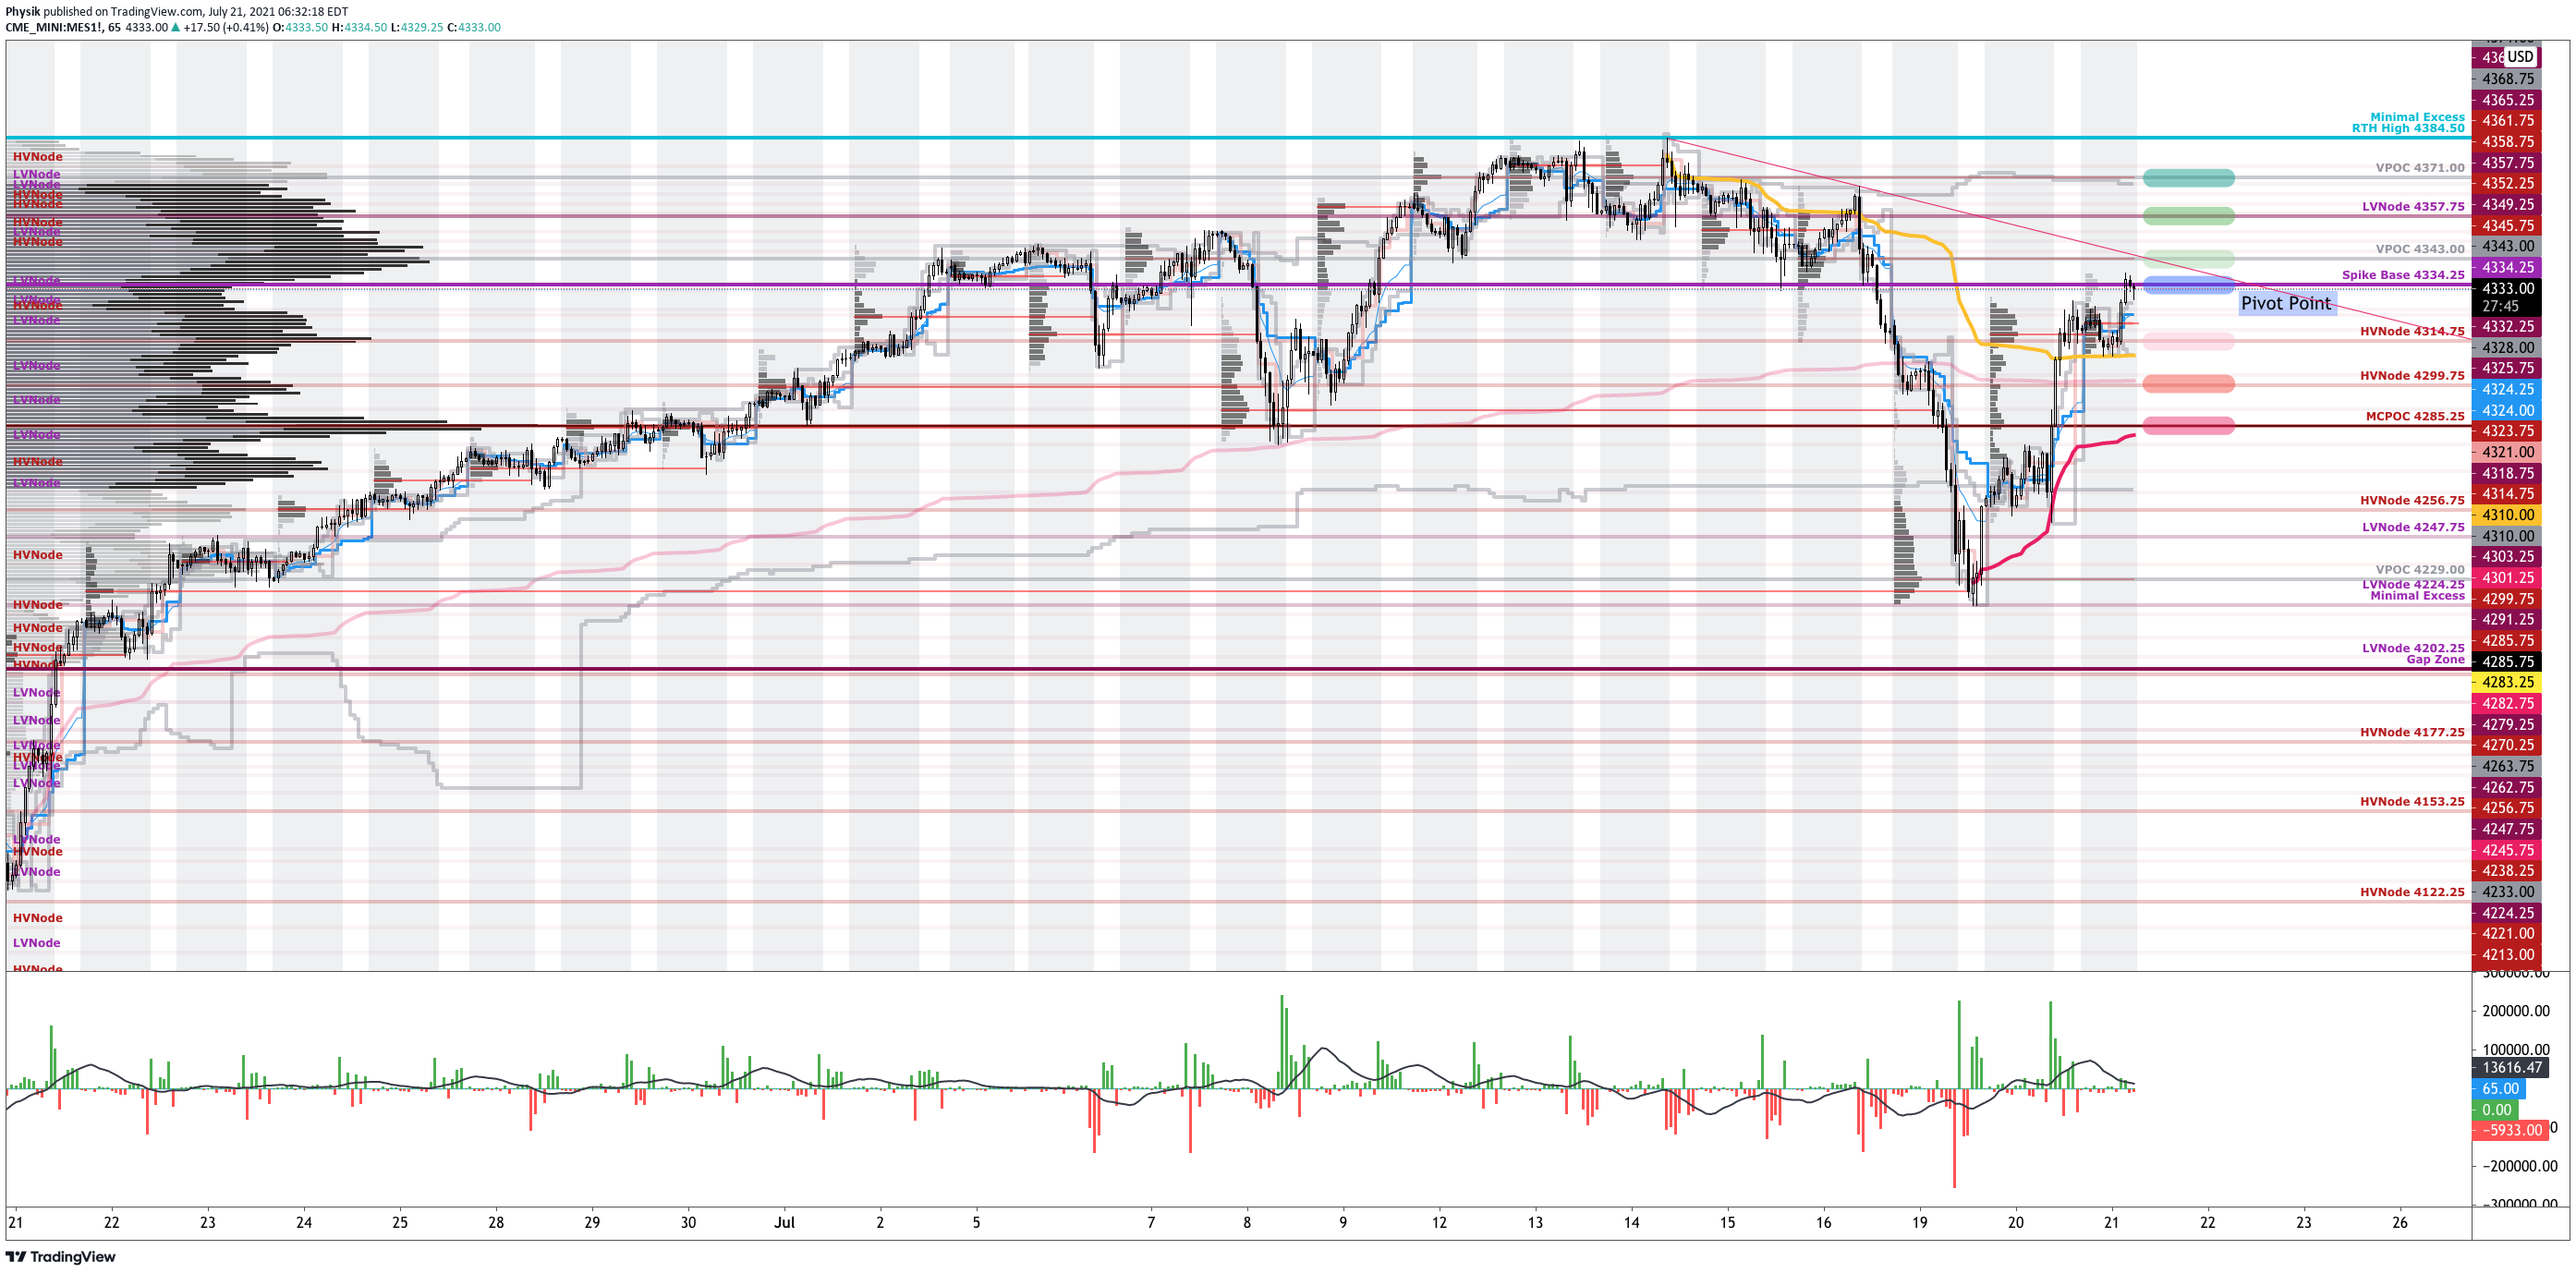
Adding, during the prior day’s regular trade, the best case outcome occurred, evidenced by trade above the $4,285.25 micro-composite Point of Control (MCPOC). This is significant because it denotes movement above the fairest price to do business since the June 20 swing low. Now, initiative sellers have a clear line in the sand – $4,285.25 – when it comes to making headway into areas of demand.
Further, the near-vertical price rise wasn’t without a warrant.
After breaking down, the S&P 500 came to a micro-composite LVNode and halted. Thereafter, prices rebounded. Why was this? Stock indexes were positioned for a vicious rebound as near-term downside discovery may have reached a limit, based on market liquidity metrics and the inventory positioning of participants.
According to SqueezeMetrics, the steepness of the GammaVol (GXV) curve suggested there was more risk to the upside than the downside, at that S&P 500 juncture.
There could be a Part Two to today's S&P 500 gamma squeeze. We're right on the cusp of it at SPX 4330. Note the characteristic GammaVol slip 'n slide.
Given this metric, strong breadth, and positive delta, as well as the resolve of a Volume Weighted Average Price (VWAP) pinch, the S&P 500 is positioned for higher.
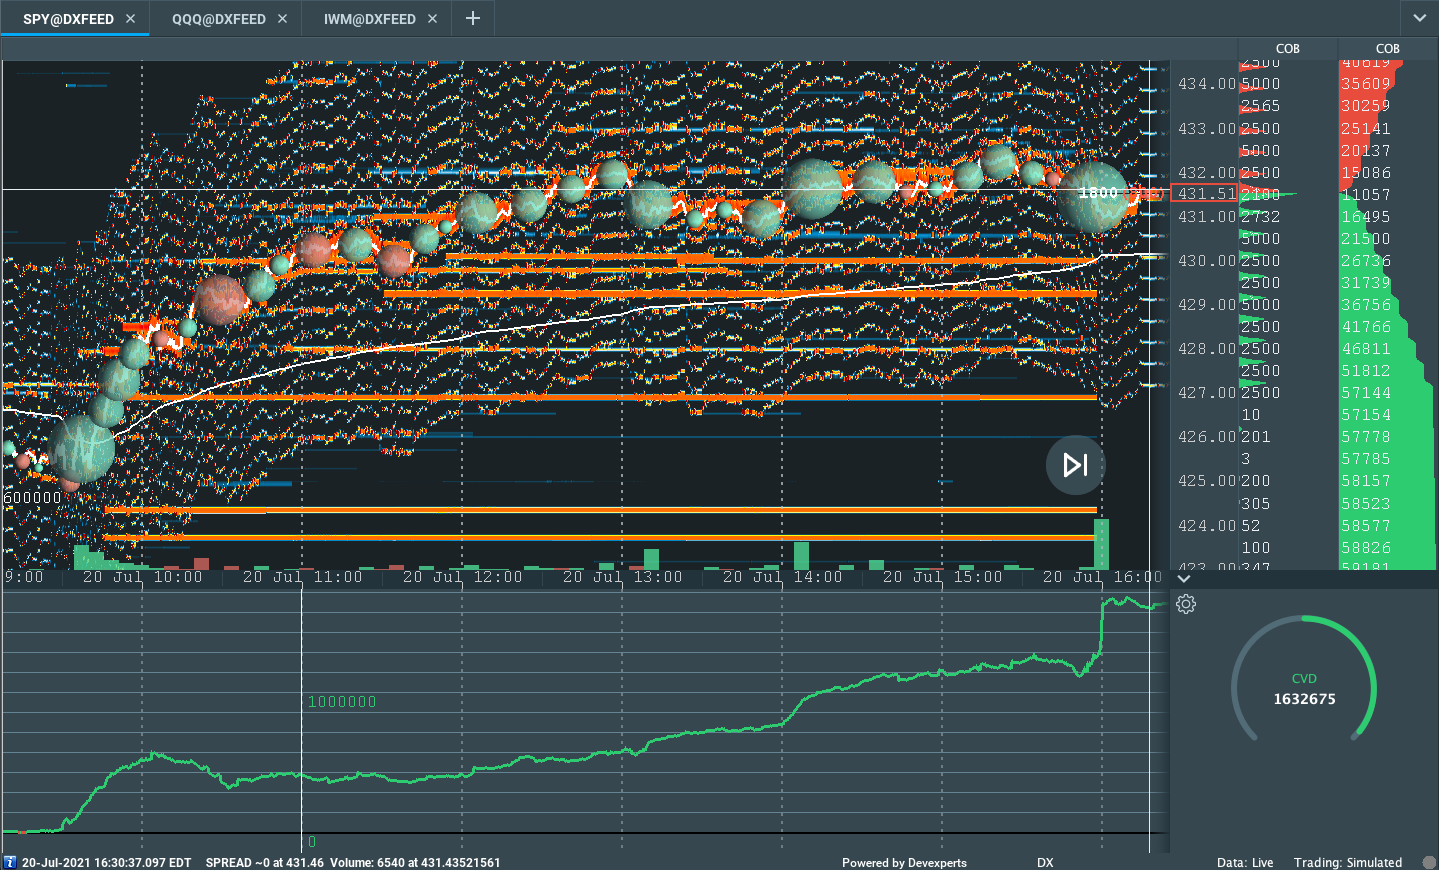
Graphic: SPDR S&P 500 ETF Trust (NYSE: SPY) market liquidity, via Bookmap. Note the supportive volume delta, a measure of buying and selling power as calculated by the difference in volume traded at the bid and offer.
Volume-Weighted Average Prices (VWAPs): A metric highly regarded by chief investment officers, among other participants, for quality of trade. Additionally, liquidity algorithms are benchmarked and programmed to buy and sell around VWAPs.
For today, participants can trade from the following frameworks.
In the best case, the S&P 500 trades sideways or higher; activity above the $4,334.25 spike base puts in play the $4,343.00 untested Point of Control (VPOC). Initiative trade beyond the VPOC could reach as high as the $4,357.75 low volume area (LVNode) and $4,371.00 VPOC.
In the worst case, the S&P 500 trades lower; activity below the $4,334.25 spike base puts in play the $4,314.75 HVNode. Initiative trade beyond the $4,314.75 HVNode could reach as low as the $4,299.75 HVNode and $4,285.25 micro-composite POC.
Spikes: Spike’s mark the beginning of a break from value. Spikes higher (lower) are validated by trade at or above (below) the spike base (i.e., the origin of the spike).

POCs: POCs are valuable as they denote areas where two-sided trade was most prevalent. Participants will respond to future tests of value as they offer favorable entry and exit.

Volume Areas: A structurally sound market will build on past areas of high volume. Should the market trend for long periods of time, it will lack sound structure (identified as a low volume area which denotes directional conviction and ought to offer support on any test).

If participants were to auction and find acceptance into areas of prior low volume, then future discovery ought to be volatile and quick as participants look to areas of high volume for favorable entry or exit.
Graphic: 65-minute profile chart of the Micro E-mini S&P 500 Futures.
News And Analysis
Work-in-progress U.S. infrastructure bill faces test in Senate. (REU)
Housing starts continuing to improve as permits lose ground. (MND)
Nasdaq to spin out market for pre-IPO shares in a bank deal. (WSJ)
Decentralized finance builds on three major waves of bitcoin. (Future)
Startups on a record acquisition spree buying other startups. (CBN)
U.S. and European consumer confidence and spending rise. (Moody’s)
Titan – Fidelity for Millennials – raised $58M Series B round. (CBN)
Survey showing U.S. majority supports more tech regulation. (Axios)
What People Are Saying
What happens when everyone flocks to buy puts and there is no follow through ….
The vol compresses, you get that vanna dynamic of dealer’s being short puts which means they will be covering their short stock/ futures hedges…. which leads to these hard upward rallies.
3/3 much of the positioning imbalance has been unwound & shorts have been caught on the wrong🦶, this short squeeze paired w/the power of historic buybacks, has provided fuel for the quick reversal rally we’re seeing.W/🍌’s on the way 7/28-30, 🕰 isn’t a🐻’s friend. Be💦. GL!🍀
After years of self-education, strategy development, and trial-and-error, Renato Leonard Capelj began trading full-time and founded Physik Invest to detail his methods, research, and performance in the markets. Additionally, Capelj is a finance and technology reporter. Some of his biggest works include interviews with leaders such as John Chambers, founder and CEO, JC2 Ventures, Kevin O’Leary, businessman and Shark Tank host, Catherine Wood, CEO and CIO, ARK Invest, among others.
Disclaimer
At this time, Physik Invest does not manage outside capital and is not licensed. In no way should the materials herein be construed as advice. Derivatives carry a substantial risk of loss. All content is for informational purposes only.
Equity index futures, commodities, and yields are all lower.
COVID resurgence, geopolitical tensions.
Ahead: Light day with only earnings data.
Stock indices are lower; RUT leads move.
What Happened: U.S. stock index futures auctioned lower overnight alongside news of COVID-19 resurgence and escalating tensions between China and NATO allies.
This trade comes ahead of a relatively light day in terms of releases. Today, participants will only get data on company earnings.
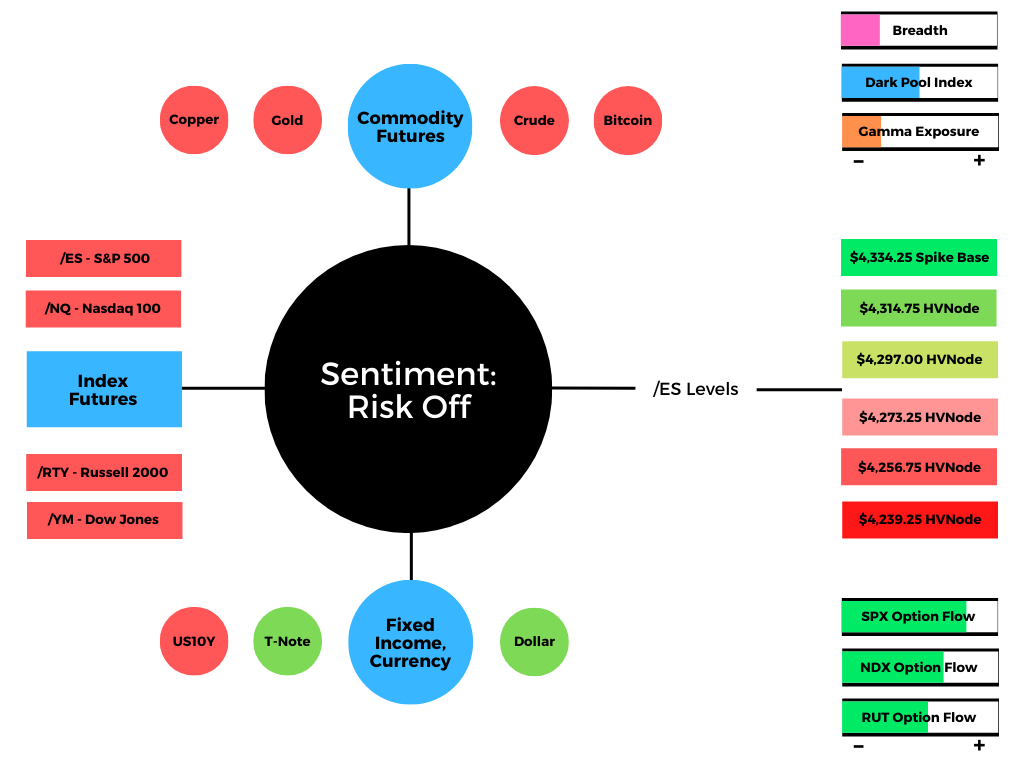
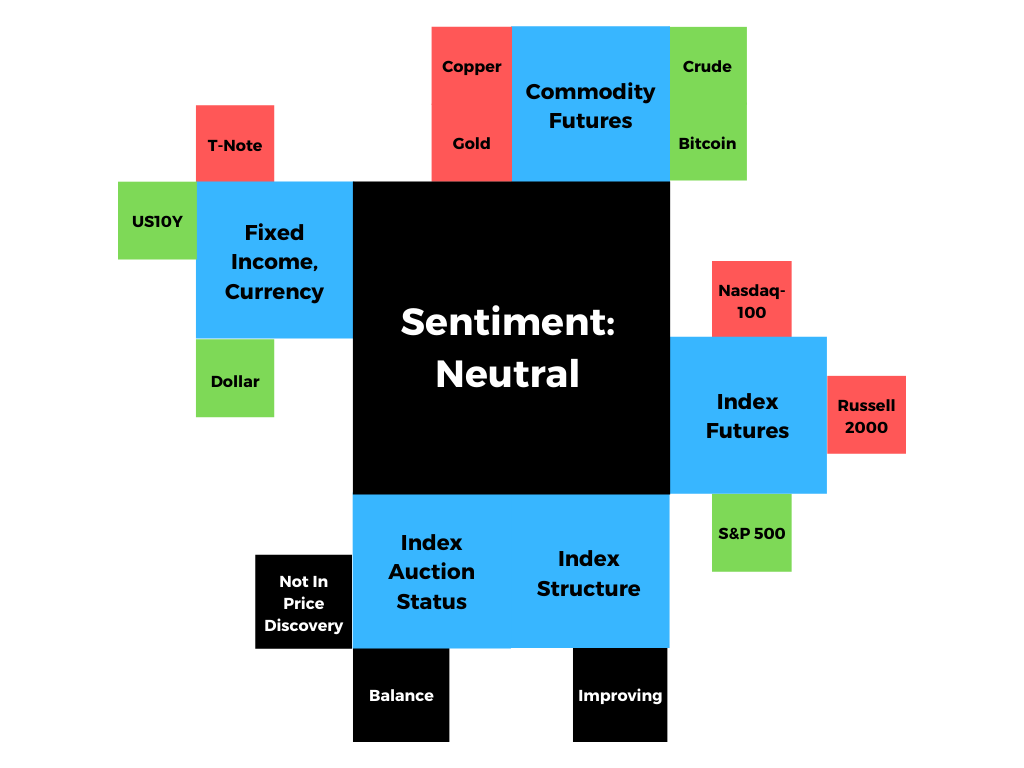
Graphic updated 6:45 AM ET. Sentiment Risk-Off if expected /ES open is below the prior day’s range. See here for more on the Dark Pool Index and Gamma. A positive Dark Pool Index reading is bullish. At the same time, the higher (lower) the gamma, the less (more) volatility. SHIFT Search data used for options activity. Note that options flow is sorted by the call premium spent; if green and more (less) positive then more (less) was spent on call options. Breadth reflects a reading of the prior day’s Advance/Decline indicator.
What To Expect: As of 6:45 AM ET, Monday’s regular session (9:30 AM – 4:00 PM EST) in the S&P 500 will likely open outside of prior-range and -value, suggesting an increased potential for directional opportunity.
Balance-Break and/or Gap Scenarios: Monitor for acceptance (i.e., more than 1-hour of trade) outside of the balance area.

Gaps ought to fill quickly. Should they not, that’s a signal of strength; do not fade. Leaving value behind on a gap-fill or failing to fill a gap (i.e., remaining outside of the prior session’s range) is a go-with indicator.

Auctioning and spending at least 1-hour of trade back in the prior range suggests a lack of conviction; in such a case, do not follow the direction of the most recent initiative activity.
Adding, during the prior day’s regular trade, the worst-case outcome occurred, evidenced by a spike from value.
Spikes: Spike’s mark the beginning of a break from value. Spikes higher (lower) are validated by trade at or above (below) the spike base (i.e., the origin of the spike).
This comes as Morgan Stanley (NYSE: MS) believes downside risks are compounded by equity and bond positioning, low short interest, and the involvement of systemic strategies which could intensify a sell-off.
Add to that last week’s monthly options expiry (OPEX), participants could be in for a volatile day as the market enters into so-called a short-gamma environment; in such a case, the opposing side of options trades hedge exposure by buying into strength and selling into weakness, exacerbating volatility.
Options Expiration (OPEX): Option expiries mark an end to pinning (i.e, the theory that market makers and institutions short options move stocks to the point where the greatest dollar value of contracts will expire worthless) and the reduction dealer gamma exposure.
Gamma's slightly negative and currently doesn't show any real +build until ~4400. pic.twitter.com/woXk4qtaxY
Further, for today, participants can trade from the following frameworks.
In the best case, the S&P 500 trades sideways or higher; activity above the $4,285.75 micro-composite POC puts in play the $4,297.00 HVNode. Initiative trade beyond the $4,297.00 HVNode could reach as high as the $4,314.75 HVNode and $4,334.25 spike base.
POCs: POCs are valuable as they denote areas where two-sided trade was most prevalent. Participants will respond to future tests of value as they offer favorable entry and exit.

Volume Areas: A structurally sound market will build on past areas of high volume. Should the market trend for long periods of time, it will lack sound structure (identified as a low volume area which denotes directional conviction and ought to offer support on any test).

If participants were to auction and find acceptance into areas of prior low volume, then future discovery ought to be volatile and quick as participants look to areas of high volume for favorable entry or exit.
If participants were to auction and find acceptance into areas of prior low volume, then future discovery ought to be volatile and quick as participants look to areas of high volume for favorable entry or exit.
In the worst case, the S&P 500 trades lower; activity below $4,285.75 puts in play the $4,273.25 HVNode. Trade beyond the $4,273.25 HVNode could reach as low as the $4,256.75 and $4,239.25 HVNode.
Graphic: 65-minute profile chart of the Micro E-mini S&P 500 Futures.
News And Analysis
Robinhood aims for up to $35B valuation in a U.S. IPO. (REU)
The CPI has not altered the Fed’s narrative on inflation. (Moody’s)
OPEC+ agrees oil supply boost after new compromise. (REU)
U.S., U.K. allies blame Chinese government for a hack. (BBG)
Infrastructure bill drops tax enforcement, Senator says. (BBG)
Florida leads U.S. in COVID cases amid variant surge. (Axios)
— Peter Reznicek | ShadowTrader.net (@PeterReznicek) July 17, 2021
Since May sell-off, $BTC remained in that range 30K-42.5K.
There needs to be symmetry between left shoulder and right shoulder of a possible H&S top. The longer the consolidation in the possible right shoulder, the less likely the we can treat it as H&S top. https://t.co/T21j2KIjkspic.twitter.com/ffrio03baf
This was entered in my notes in March 2004, just a few months after launching my futures prop shop. This struck me as an irrefutable truth about trading. I hope it flicks a lightbulb on for you. Click to expand. #Futures#tradingpic.twitter.com/ibmiITEeqm
After years of self-education, strategy development, and trial-and-error, Renato Leonard Capelj began trading full-time and founded Physik Invest to detail his methods, research, and performance in the markets. Additionally, Capelj is a finance and technology reporter. Some of his biggest works include interviews with leaders such as John Chambers, founder and CEO, JC2 Ventures, Kevin O’Leary, businessman and Shark Tank host, Catherine Wood, CEO and CIO, ARK Invest, among others.
Disclaimer
At this time, Physik Invest does not manage outside capital and is not licensed. In no way should the materials herein be construed as advice. Derivatives carry a substantial risk of loss. All content is for informational purposes only.
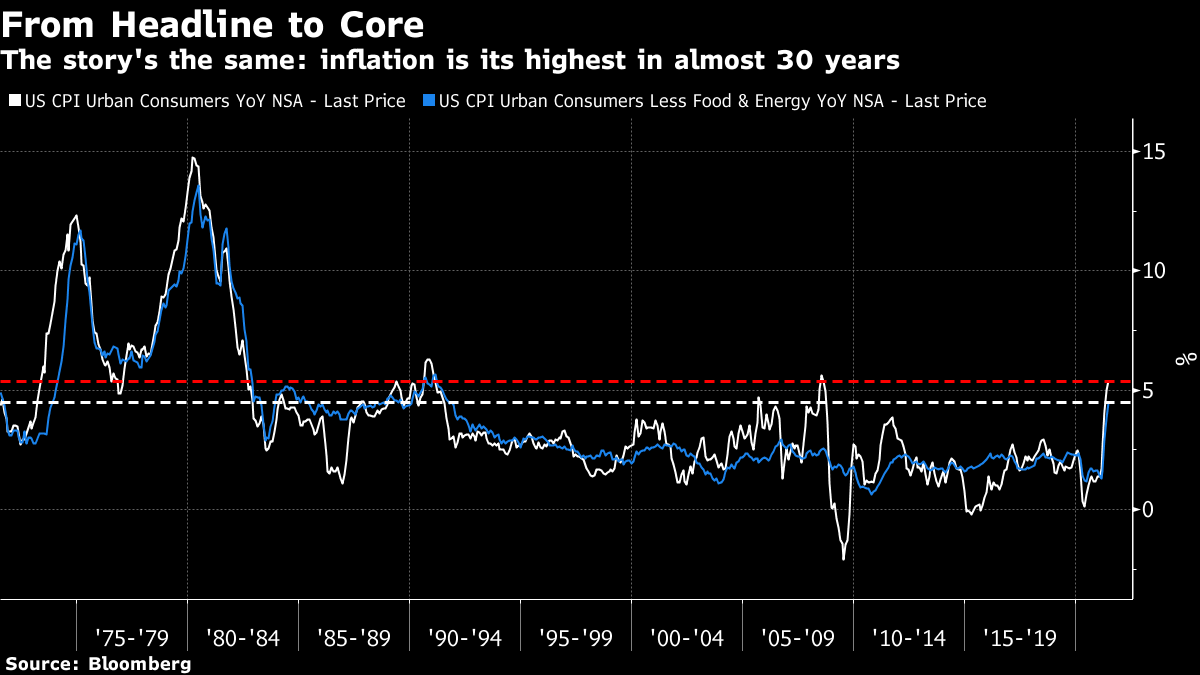
At the same time, a measure of inflation – via the Consumer Price Index (CPI) – rose the largest since the Global Financial Crisis. In response, the 5s30s curve resumed its flattening and the 10-year U.S. Treasury yield ended little changed.
Graphic: Inflation at its highest in almost 30 years via Bloomberg.
Simply put, it’s likely that bond market participants shrugged off the data and an acceleration in inflation will be temporary.
Still, yields could become further depressed due in part to fundamental and technical factors – issuance, short coverings, a fading reflation trade, peak growth – as well as the August 1 reinstatement of the U.S. debt limit.
“[I]f Congress idly stands by, the Treasury will eventually hit the debt limit on October 18. The consequences would be severe,” Moody’s strategists believe. Michael A. Gayed of the Lead-Lag Report adds the odds of a rating downgrade increase, as a result, also.
Is another downgrade at debt ceiling expiry coming soon? From the latest @leadlagreport Check out the dates at bottom of the list. S&P went down from April to September that year…Maybe Gayed should change his tagline from "few understand this" to "few even talk about this". pic.twitter.com/vl8aJysty3
— Peter Reznicek | ShadowTrader.net (@PeterReznicek) July 18, 2021
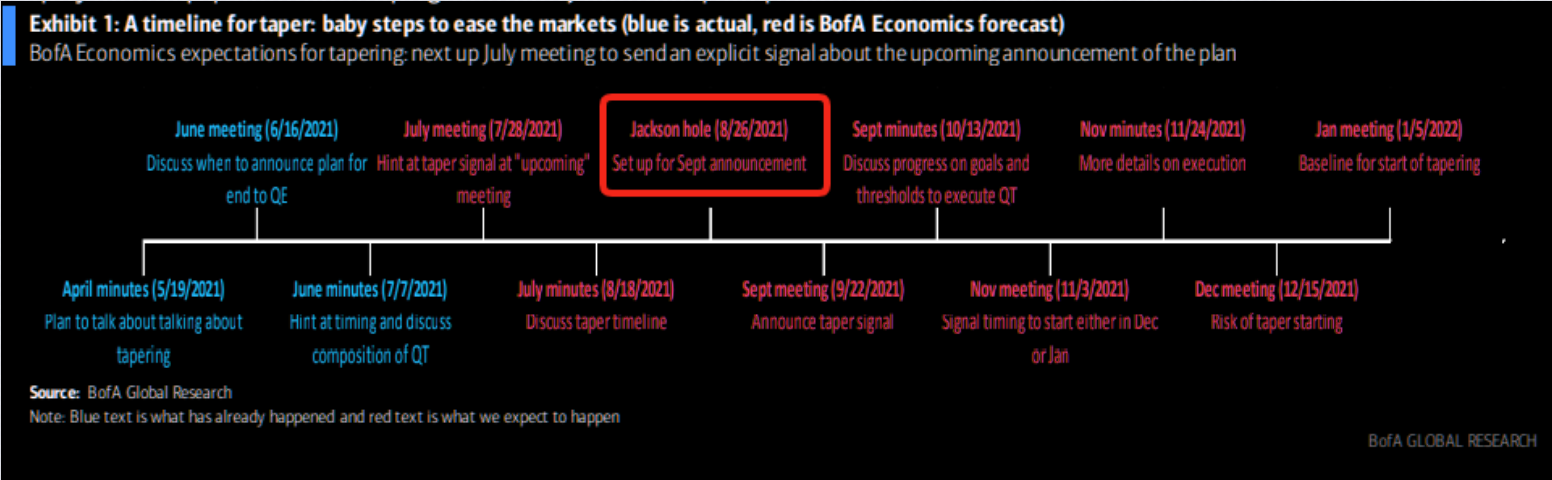
Moody’s concludes: “[T]apering earlier than the markets are pricing would risk causing yields to jump when some of the technical drags are easing.”
Graphic: Bank of America Corp’s (NYSE: BAC) timeline for taper via The Market Ear.
Adding, since inflation and rates move inversely to each other, a mistimed bump in rates – alongside increased nervousness over a COVID-19 resurgence and fading fiscal stimulus – would potentially take away from the commitment to keep inflation expectations closer to the Federal Reserve’s 2%-plus target.
In all, in support of the Fed’s target, COVID-19 must not become a problem, and the Biden administration, alongside Congress, must come to terms on another fiscal package – a few trillion in size – that looks to extend the Treasury debt ceiling.
As unemployment declines and labor force participation increases, expectations of rate normalization will solidify. This is a boon for beta sectors, according to JPMorgan Chase & Co’s (NYSE: JPM) Marko Kolanovic.
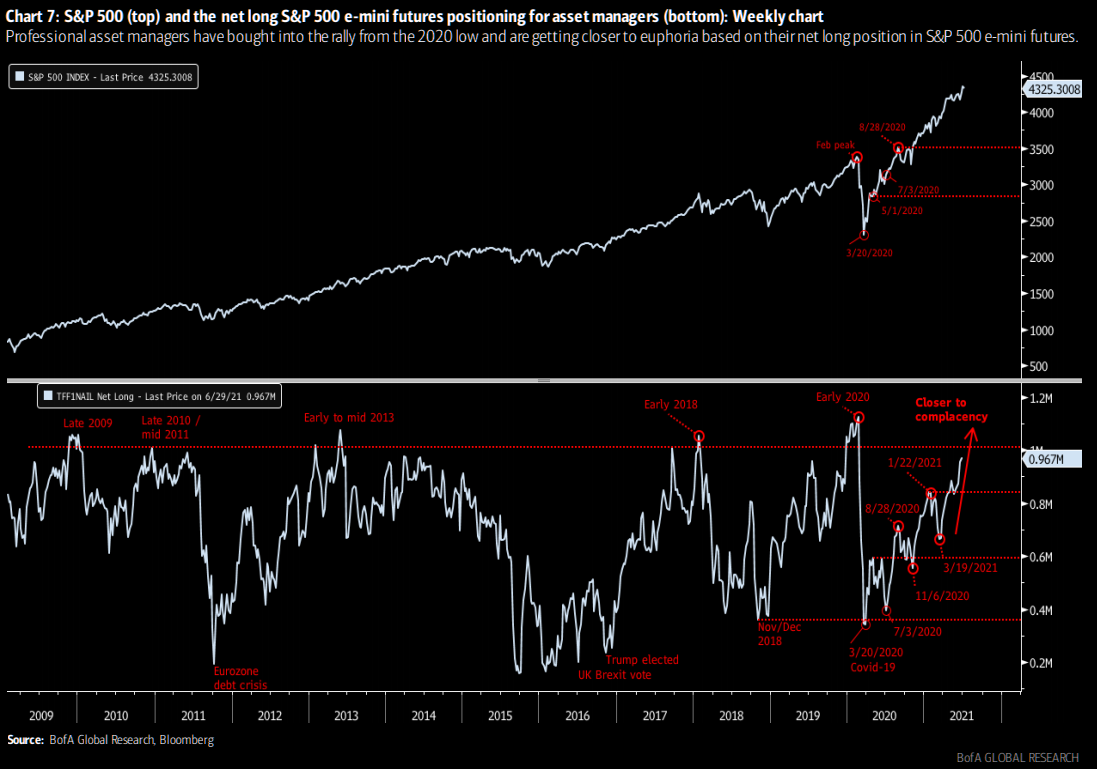
Considerations: Investment bank and financial services company Morgan Stanley (NYSE: MS) believes downside risks are compounded by equity and bond positioning, low short interest, and the involvement of systemic strategies which could intensify a sell-off.
Graphic: Bank of America Corp (NYSE: BAC) chart on futures positioning via The Market Ear.
MS says CTAs are still short bonds which, according to CityWire, could continue the bond rally, pressuring stocks as investors “fear the bond market may know[] something they don’t.”
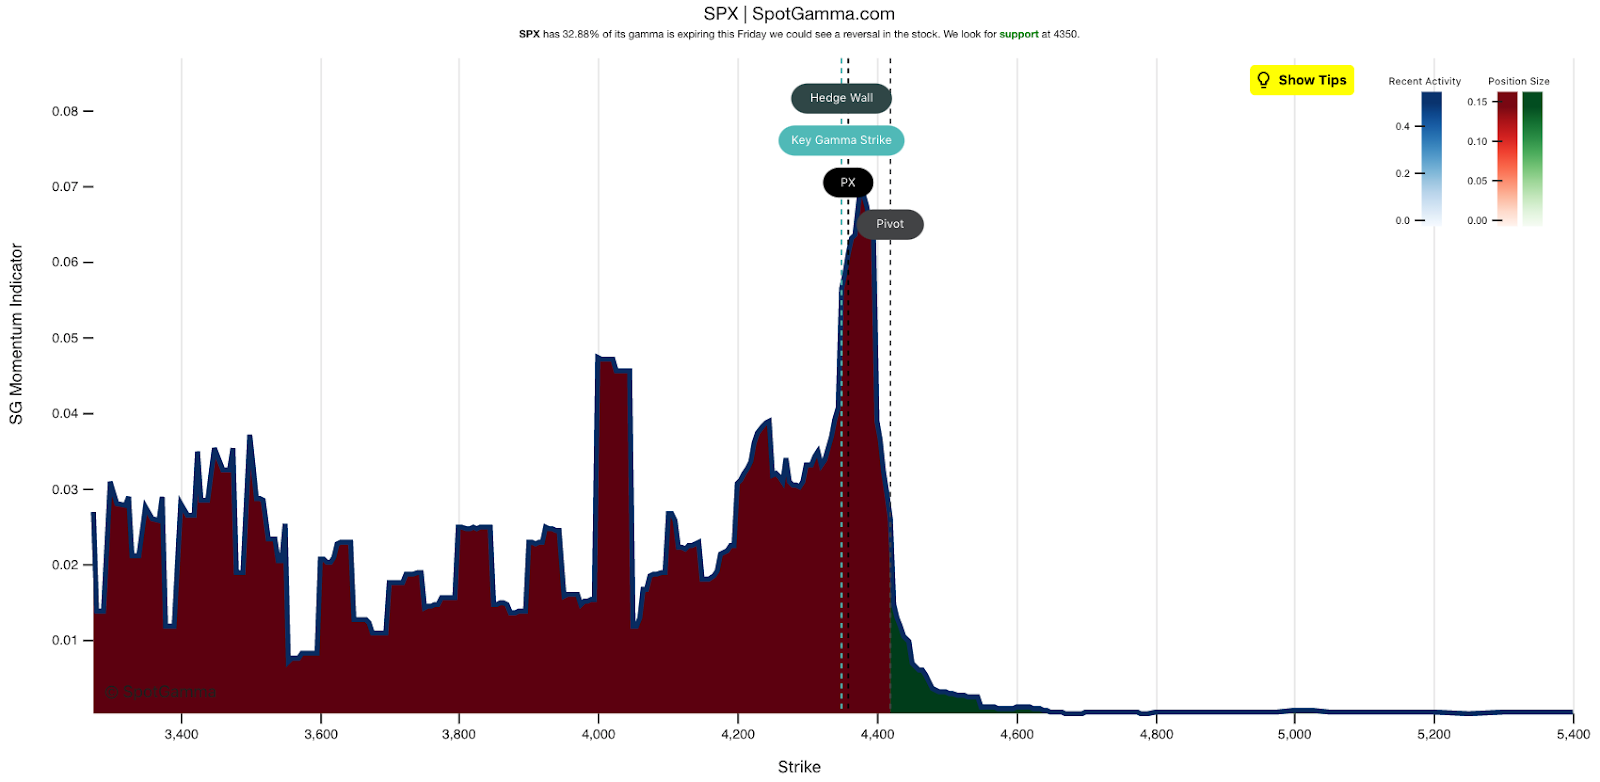
Add the passage of the July options expiration (OPEX), the window for the aforementioned dynamics (alongside a shift in preferences from saving and investing to spending, monetary tightening, seasonality, as well as a COVID-19 resurgence) to take over is opened.
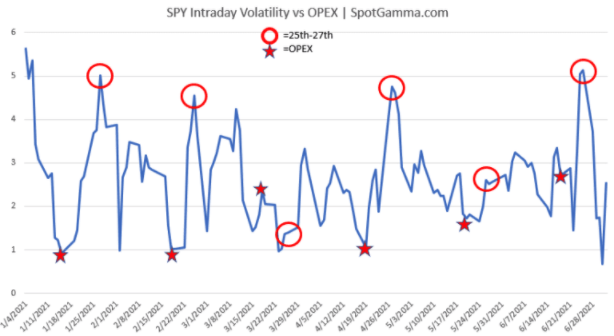
After OPEX, according to SpotGamma, “the market tends to experience its largest intraday volatility which corresponds to the reduction in large options positions, and the hedging associated with them.”
Graphic: SpotGamma’s EquityHub showed 30% of the S&P 500’s gamma expiring July 16 which, as SpotGamma has said in the past, “creates volatility because, as large options positions expire[], are closed and/or rolled, dealers have large hedges they need to adjust.”
What To Expect: In the coming sessions, participants will want to focus their attention on where the S&P 500 trades in relation to the $4,334.25 spike base.
Spikes: Spike’s mark the beginning of a break from value. Spikes higher (lower) are validated by trade at or above (below) the spike base (i.e., the origin of the spike).
In the best case, the S&P 500 trades sideways or higher; activity above $4,334.25 puts in play the $4343.00 VPOC. Trade beyond that signposts may then put in play the $4,346.75 HVNode – which corresponds with two anchored Volume Weighted Average Prices (VWAPs).
POCs: POCs are valuable as they denote areas where two-sided trade was most prevalent. Participants will respond to future tests of value as they offer favorable entry and exit.

More On Volume-Weighted Average Prices (VWAPs): A metric highly regarded by chief investment officers, among other participants, for quality of trade. Additionally, liquidity algorithms are benchmarked and programmed to buy and sell around VWAPs.

Volume Areas: A structurally sound market will build on past areas of high volume. Should the market trend for long periods of time, it will lack sound structure (identified as a low volume area which denotes directional conviction and ought to offer support on any test).

If participants were to auction and find acceptance into areas of prior low volume, then future discovery ought to be volatile and quick as participants look to areas of high volume for favorable entry or exit.
If higher, entry into an overhead supply area, above the $4,357.75 low volume area (LVNode), portends continuation to the $4,371.00 VPOC and$4,384.50 RTH High.
In the worst case, the S&P 500 trades lower; activity below $4,334.25 puts in play the $4,314.75 high volume area (HVNode). Initiative trade beyond $4,314.75 could reach as low as the $4,297.00 HVNode. Closeby is the $4,291.00 VPOC and $4,285.00 composite HVNode.
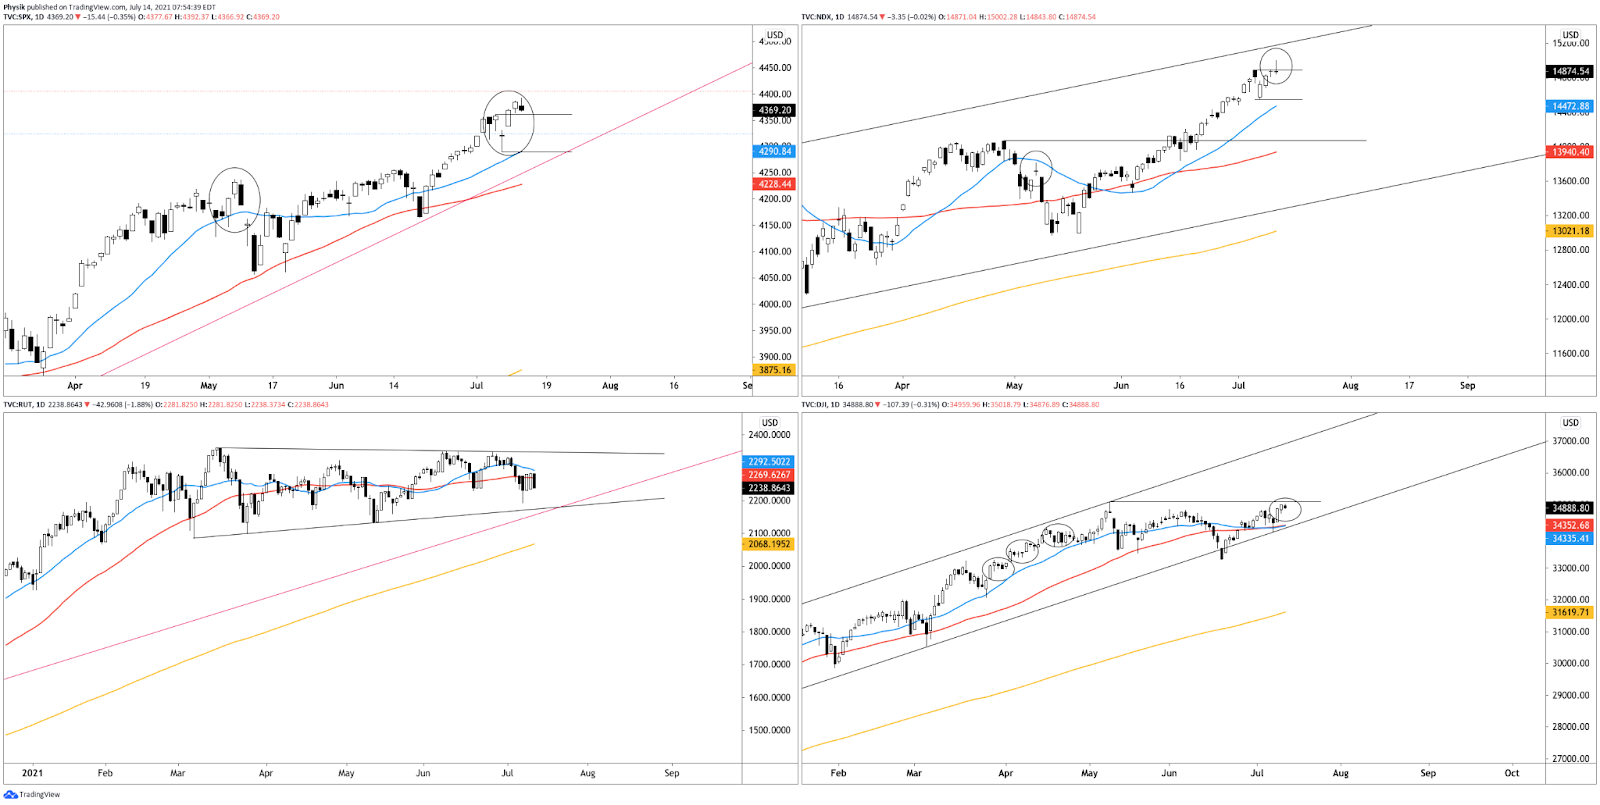
Graphic: 65-minute profile chart of the Micro E-mini S&P 500 Futures.Graphic: Daily candlestick charts of the S&P 500 (top left), Nasdaq 100 (top right), Russell 2000 (bottom left), and Dow Jones Industrial Average (bottom right).
News And Analysis
When VIX hits an extreme, options traders look to volatility arbitrage. (tasty)
Identifying gamma squeezes with SpotGamma’s options modeling. (BZ)
U.S. banks see loan, revenue pressure despite consumer spending. (Fitch)
The U.S. economy continued to strengthen as mobility trended up. (S&P)
‘A free put on the market’: Ambrus CIO talking volatility dislocations. (BZ)
OPEC+ agrees oil supply boost after UAE, Saudi reach compromise. (REU)
An unexpected tightening in policy would generate market volatility. (Moody’s)
Semiconductor supply shortage, inflation, and technology regulation. (S&P)
Frenzied retail investing boom has been cooling off in recent weeks. (Fortune)
Delta Air is seeing positive growth in business travel as offices open. (S&P)
After years of self-education, strategy development, and trial-and-error, Renato Leonard Capelj began trading full-time and founded Physik Invest to detail his methods, research, and performance in the markets. Additionally, Capelj is a finance and technology reporter. Some of his biggest works include interviews with leaders such as John Chambers, founder and CEO, JC2 Ventures, Kevin O’Leary, businessman and Shark Tank host, Catherine Wood, CEO and CIO, ARK Invest, among others.
Disclaimer
At this time, Physik Invest does not manage outside capital and is not licensed. In no way should the materials herein be construed as advice. Derivatives carry a substantial risk of loss. All content is for informational purposes only.
What Happened: U.S. stock index futures resolved lower after underlying breadth metrics failed to support the post-CPI recovery.
Thereafter, indices traded sideways overnight alongside news Senate Democrats on the Budget Committee agreed to a $3.5 trillion spending bill. The bill would carry President Biden’s economic agenda without Republican support.
Ahead, participants are expecting testimony by Federal Reserve Chair Jerome Powell, earnings releases from heavily weighted index constituents, as well as the latest Fed Beige Book.
Graphic updated 6:44 AM ET.
What To Expect: Wednesday’s regular session (9:30 AM – 4:00 PM EST) in the S&P 500 will likely open just inside of prior-range and -value, suggesting a limited potential for immediate directional opportunity.
Adding, during the prior day’s regular trade, the worst-case outcome occurred, evidenced by an intraday liquidation break and the subsequent acceptance below a Volume Weighted Average Price (VWAP) anchored from the CPI release (blue in color on the below profile graphic).
Liquidation Breaks: The profile shape suggests participants were “too” long and had poor location. Such dynamic offers responsive buyers (initiative sellers) favorable entry (exit).

Volume-Weighted Average Prices (VWAPs): A metric highly regarded by chief investment officers, among other participants, for quality of trade. Additionally, liquidity algorithms are benchmarked and programmed to buy and sell around VWAPs.
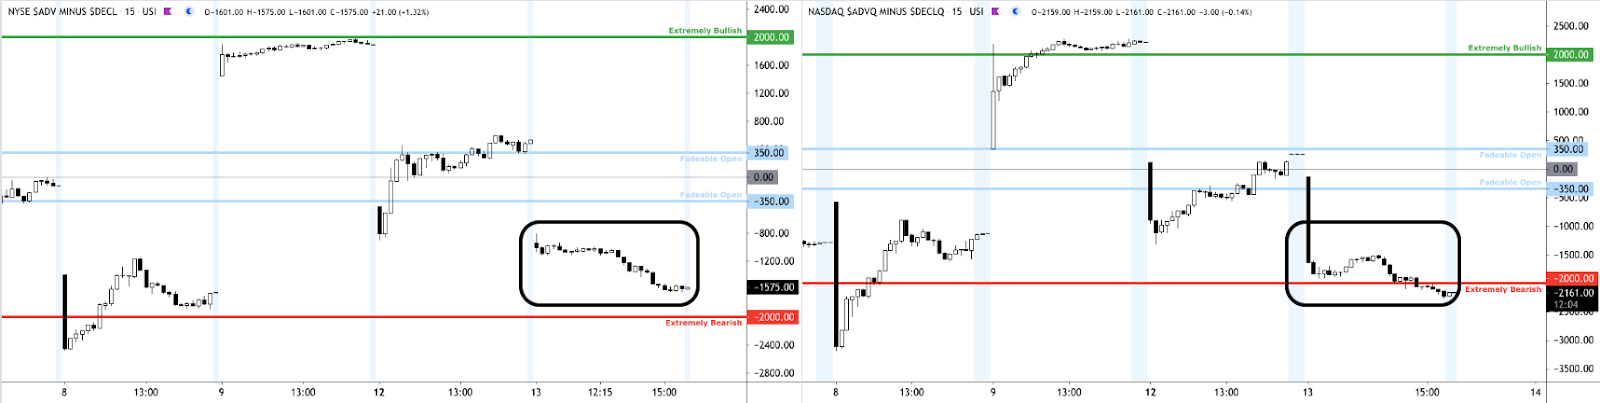
Prior to the liquidation, breadth metrics were firmly negative. Despite what appeared to be a strong recovery post-CPI, internal divergences via breadth metrics became more pronounced, while profile dynamics revealed weak commitment at higher prices and an abundance of poor structures (e.g., low-volume areas).
Graphic: Equity index leaders rose in price as internal divergences – like the ratio of advancers to decliners – grew. Noting a bigger divergence in internals tracking Nasdaq issues.
This push-pull and divergence comes ahead of the options expiration (OPEX) cycle which starts on the third Friday of each month (July 16). Associated hedging forces make it so there’s more liquidity and less movement. In other words, the market tends to pin.
Options Expiration (OPEX): Option expiries mark an end to pinning (i.e, the theory that market makers and institutions short options move stocks to the point where the greatest dollar value of contracts will expire worthless) and the reduction dealer gamma exposure.

Gamma: Gamma is the sensitivity of an option to changes in the underlying price. Dealers that take the other side of options trades hedge their exposure to risk by buying and selling the underlying. When dealers are short-gamma, they hedge by buying into strength and selling into weakness. When dealers are long-gamma, they hedge by selling into strength and buying into weakness. The former exacerbates volatility. The latter calms volatility.
Center chart is SPX intraday volatility, which is reaching a lower bound (ie tight trading ranges) as we approach Fridays OPEX. pic.twitter.com/19RnupzaBD
Thereafter, according to SpotGamma, “[t]he week after expiration the market tends to experience its largest intraday volatility which corresponds to the reduction in large options positions, and the hedging associated with them.”
Graphic: Volatility before and after OPEX, via SpotGamma.
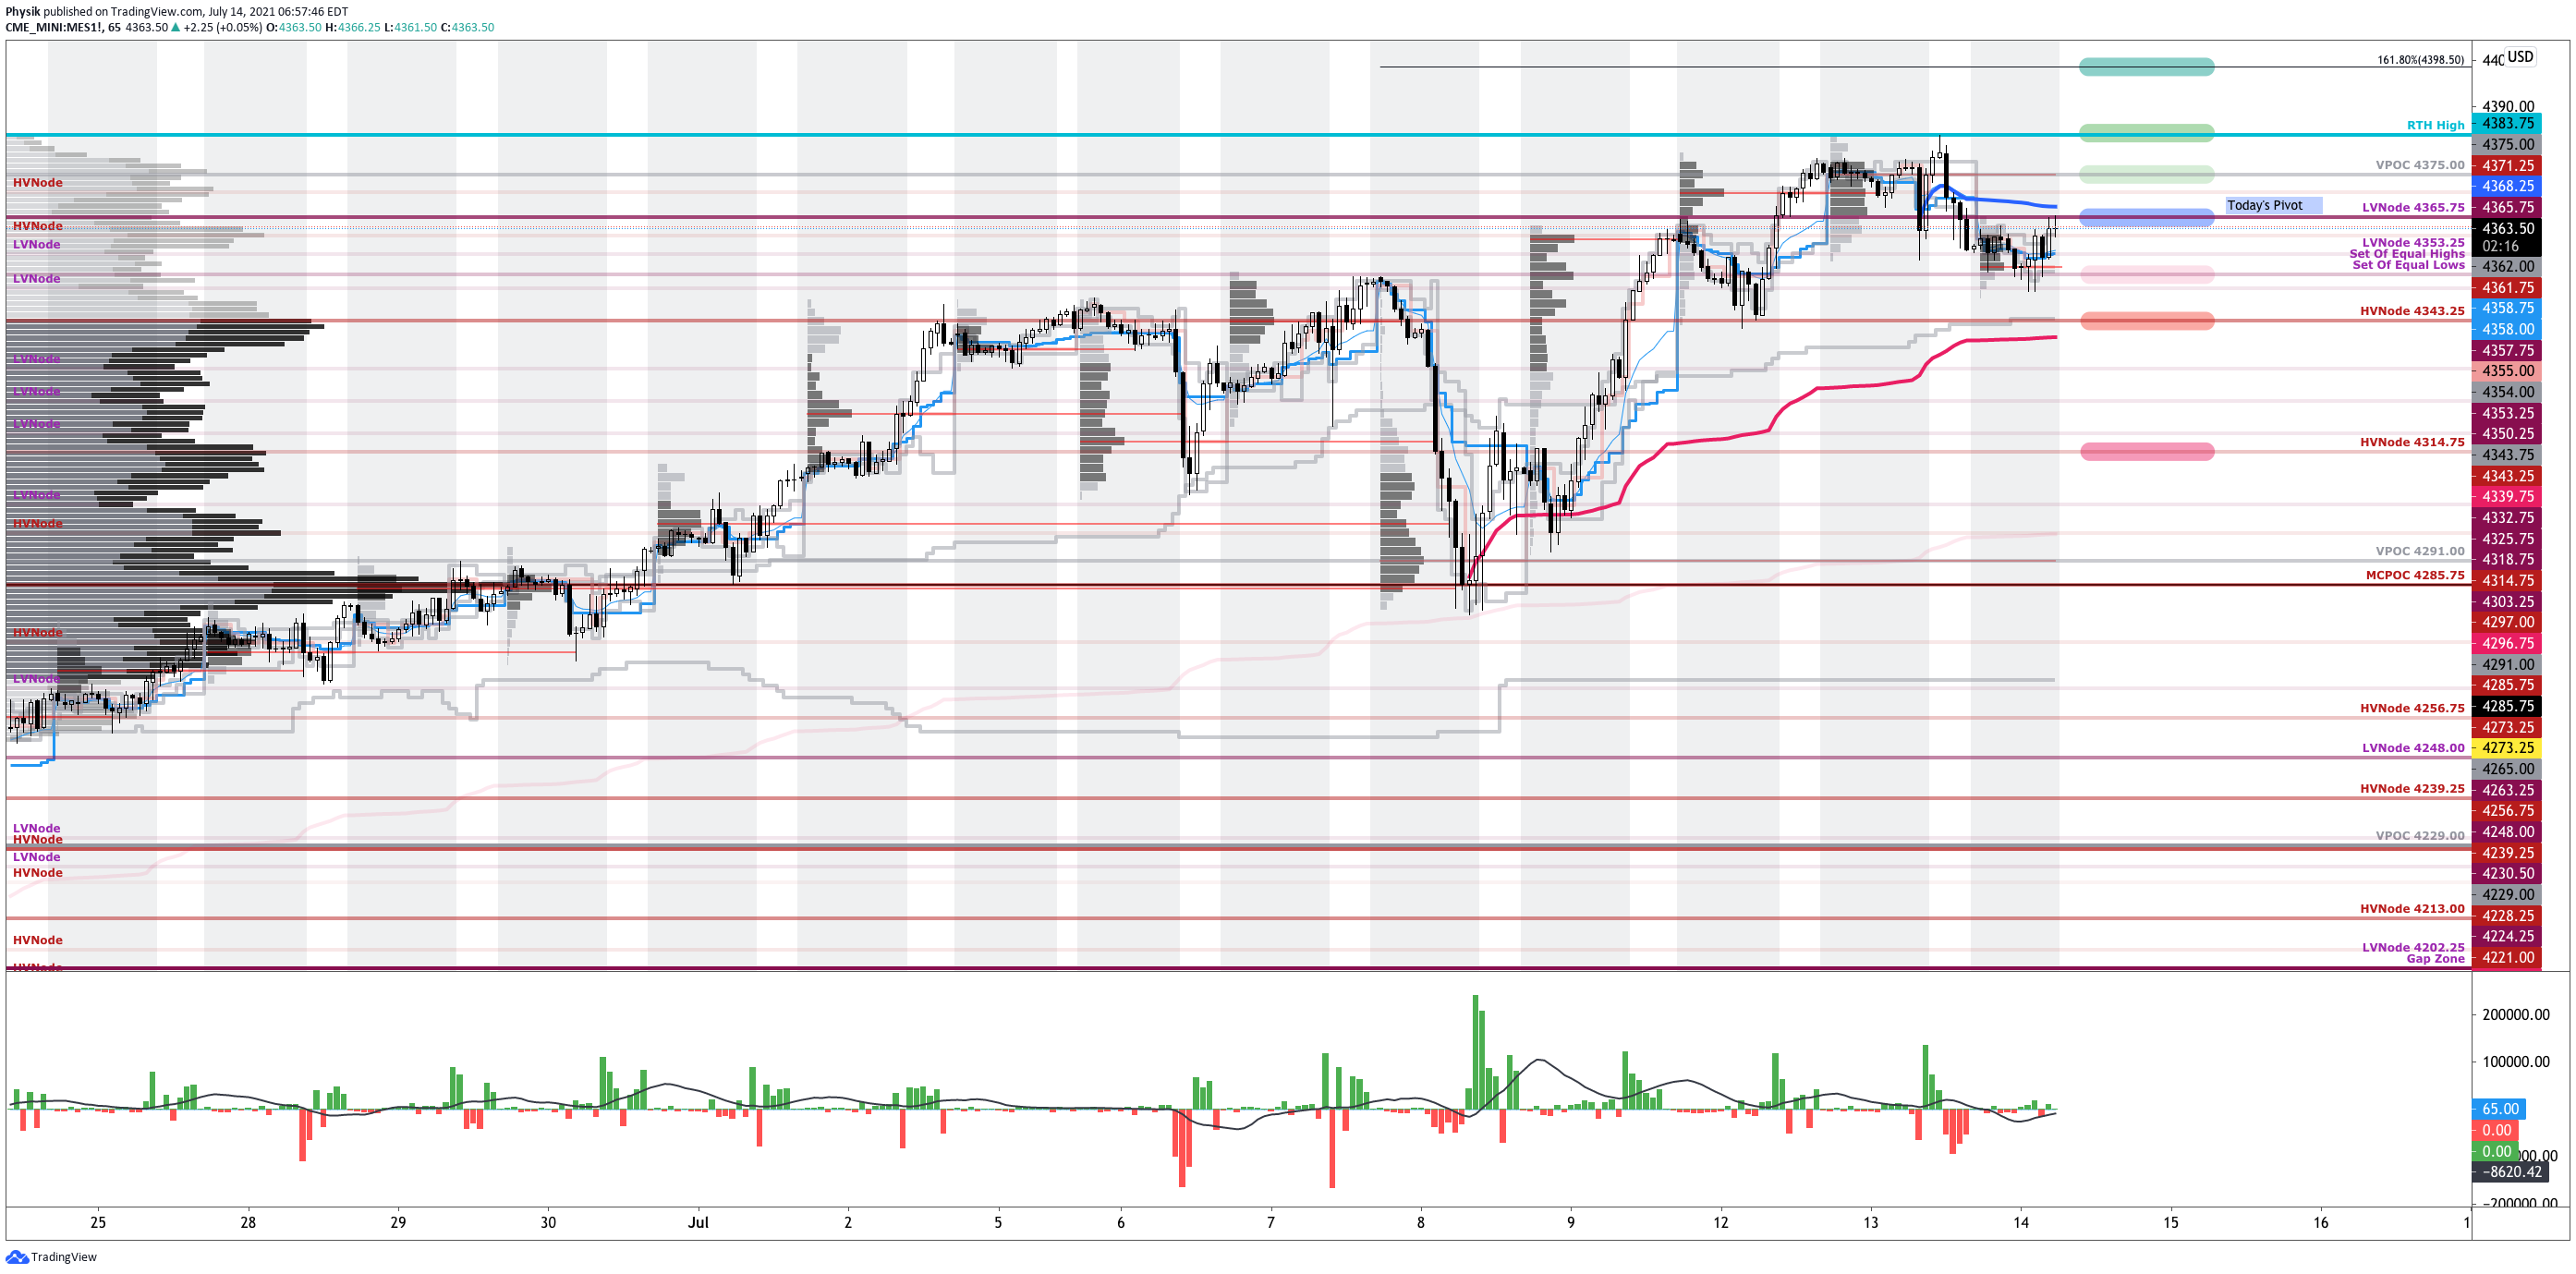
For today, participants can trade from the following frameworks.
In the best case, the S&P 500 trades sideways or higher; activity above the $4,365.75 low volume area (LVNode) pivot puts in play the $4,375.00 untested Point of Control (POC), first. Then, the $4,383.75 regular trade high (RTH High) and $4,398.50 Fibonacci extension come into play.
In the worst case, the S&P 500 trades lower; activity below the $4,365.75 LVNode pivot puts in play the $4,353.25 LVNode. Trade beyond that figure puts in play the high volume areas (HVNodes) at $4,343.25 and $4,314.75.
Significance Of Prior ATHs, ATLs: Prices often encounter resistance (support) at prior highs (lows) due to the supply (demand) of old business. These areas take time to resolve. Breaking and establishing value (i.e., trading more than 30-minutes beyond this level) portends continuation.

POCs: POCs are valuable as they denote areas where two-sided trade was most prevalent. Participants will respond to future tests of value as they offer favorable entry and exit.

Volume Areas: A structurally sound market will build on past areas of high volume. Should the market trend for long periods of time, it will lack sound structure (identified as a low volume area which denotes directional conviction and ought to offer support on any test).

If participants were to auction and find acceptance into areas of prior low volume, then future discovery ought to be volatile and quick as participants look to areas of high volume for favorable entry or exit.
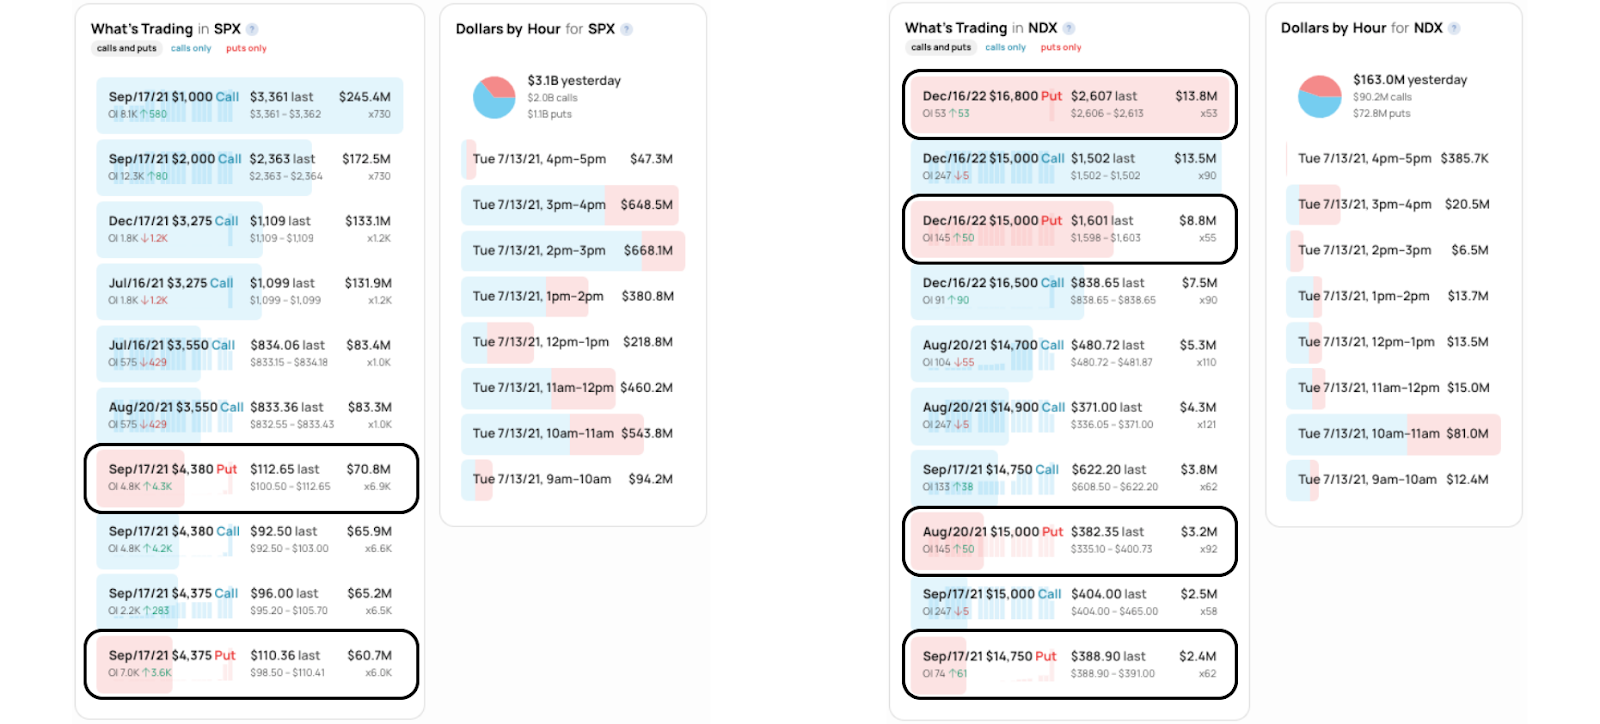
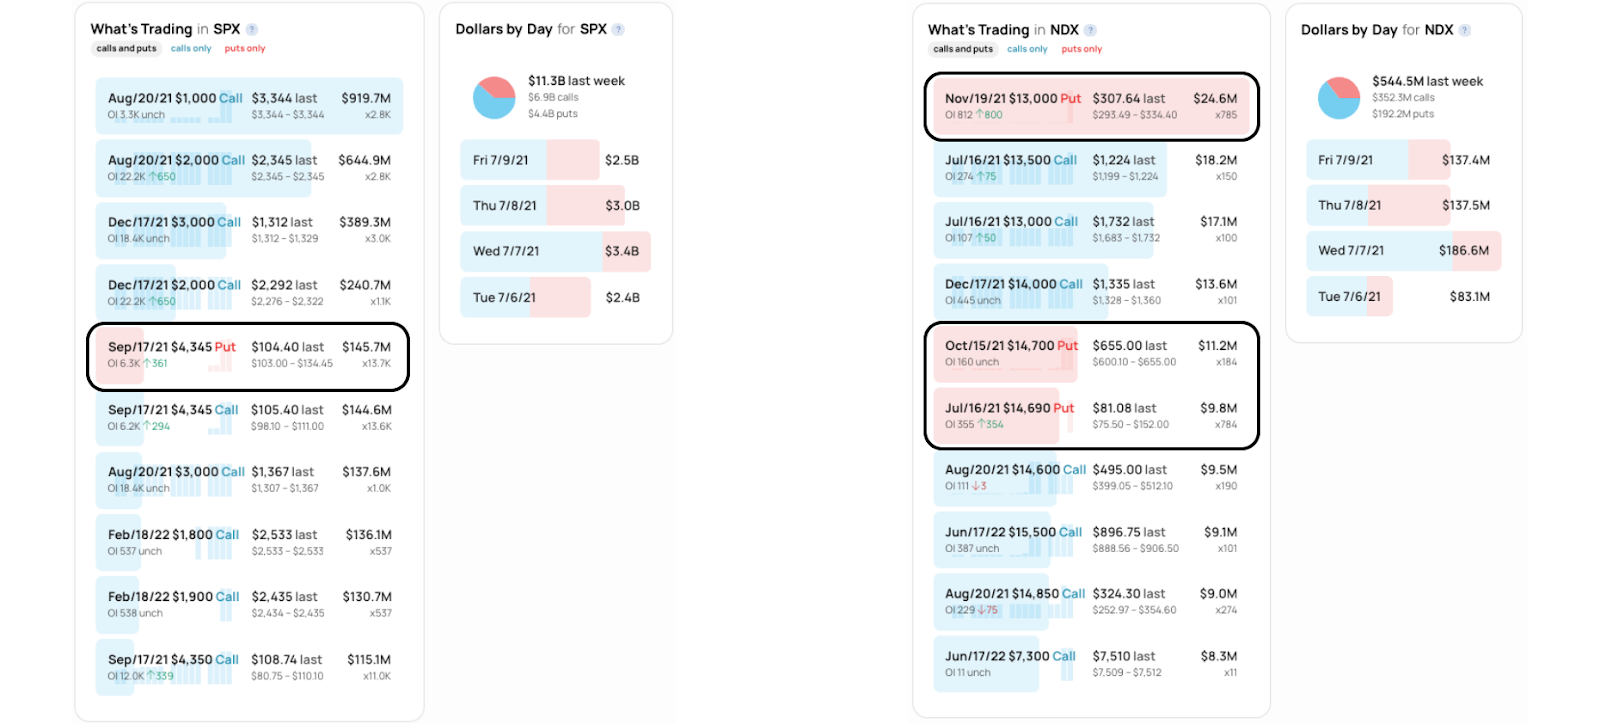
Graphic: 65-minute profile chart of the Micro E-mini S&P 500 Futures.Graphic: Daily candlestick charts of the S&P 500 (top left), Nasdaq 100 (top right), Russell 2000 (bottom left), and Dow Jones Industrial Average (bottom right).Graphic: SHIFT search suggests participants were most interested in call strikes at and below the price in the cash-settled S&P 500 (INDEX: SPX) and Nasdaq 100 (INDEX: NDX), yesterday. Noting, yesterday and over the past few weeks, there’s been increased activity in long-dated put options.
Renato founded Physik Invest after going through years of self-education, strategy development, and trial-and-error. His work reporting in the finance and technology space, interviewing leaders such as John Chambers, founder, and CEO, JC2 Ventures, Kevin O’Leary, businessman and Shark Tank host, Catherine Wood, CEO and CIO, ARK Invest, among others, afforded him the perspective and know-how very few come by.
Having worked in engineering and majored in economics, Renato is very detailed and analytical. His approach to the markets isn’t built on hope or guessing. Instead, he leverages the unique dynamics of time and volatility to efficiently act on opportunity.
Disclaimer
At this time, Physik Invest does not manage outside capital and is not licensed. In no way should the materials herein be construed as advice. Derivatives carry a substantial risk of loss. All content is for informational purposes only.
What Happened: U.S. stock index futures traded in different directions.
The S&P 500, Russell 2000, and Dow Jones Industrial Average traded relatively weak, in comparison to the technology and growth-focused Nasdaq 100.
This rotation is likely attributable to technical factors – issuance, short coverings, a fading reflation trade, and peak growth pushing lower Treasury yields – as well as the upcoming monthly options expiration and pre-earnings positioning.
Ahead is data on inflation and earnings with some Fed speak around noon Eastern time.
Graphic updated 7:20 AM ET.
What To Expect: Tuesday’s regular session (9:30 AM – 4:00 PM EST) in the S&P 500 will likely open inside of prior-range and -value, suggesting a limited potential for immediate directional opportunity.
Adding, during the prior day’s regular trade, the best case outcome occurred, evidenced by initiative trade up to the $4,373.00 Fibonacci-derived price target.
This price exploration comes amidst a divergence. As noted, the Nasdaq 100 is trading relatively strong in comparison to the S&P, Russell, and Dow. The holding pattern is not only attributable to positioning ahead of the monthly options expiration (OPEX), but second-quarter earnings, inflation expectations, and the like.
Options Expiration (OPEX): Option expiries mark an end to pinning (i.e, the theory that market makers and institutions short options move stocks to the point where the greatest dollar value of contracts will expire worthless) and the reduction dealer gamma exposure.
“The broad markets are settling back and awaiting U.S. inflation,” said Sebastien Galy, a senior macro strategist at Nordea Investment Funds SA. “We view the environment as one of gestation as earnings come in, before the risk-taking trend starts again, though a higher U.S. inflation print could create a temporary setback.”
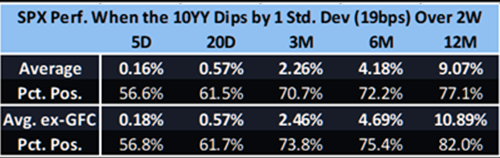
That said, the dip in the 10-year Treasury yield is not all too concerning.
Graphic: S&P 500 performance when 10-year Treasury yield slides via The Market Ear.
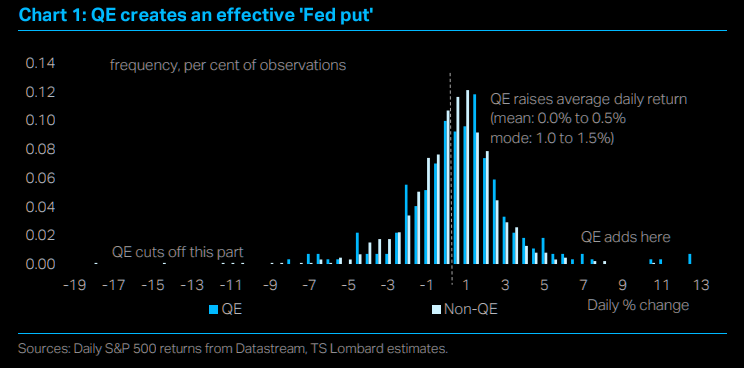
Obviously, that’s just one data point. Another consideration is the unwind of certain stimulus measures, like quantitative easing (QE) which shifts the returns distribution right.
Graphic: Impact of QE on S&P 500 returns via The Market Ear.
Knowing the above, for today, participants can trade from the following frameworks.
In the best case, the S&P 500 trades sideways or higher; activity above the $4,365.75 low volume area (LVNode) pivot puts in play the $4,378.75 minimal excess overnight high (ONH). Thereafter, if higher, the $4,398.50 and $4,417.50 Fibonacci price extensions come into play.
In the worst case, the S&P 500 trades lower; activity below $4,365.75 puts in play the $4,343.25 high volume area (HVNode). Initiative trade beyond the HVNode could reach as low as the $4,314.75 HVNode and $4,291.00 untested Point of Control (POC).
Volume Areas: A structurally sound market will build on past areas of high volume. Should the market trend for long periods of time, it will lack sound structure (identified as a low volume area which denotes directional conviction and ought to offer support on any test).

If participants were to auction and find acceptance into areas of prior low volume, then future discovery ought to be volatile and quick as participants look to areas of high volume for favorable entry or exit.

Excess: A proper end to price discovery; the market travels too far while advertising prices. Responsive, other-timeframe (OTF) participants aggressively enter the market, leaving tails or gaps which denote unfair prices.

Overnight Rally Highs (Lows): Typically, there is a low historical probability associated with overnight rally-highs (lows) ending the upside (downside) discovery process.

POCs: POCs are valuable as they denote areas where two-sided trade was most prevalent. Participants will respond to future tests of value as they offer favorable entry and exit.
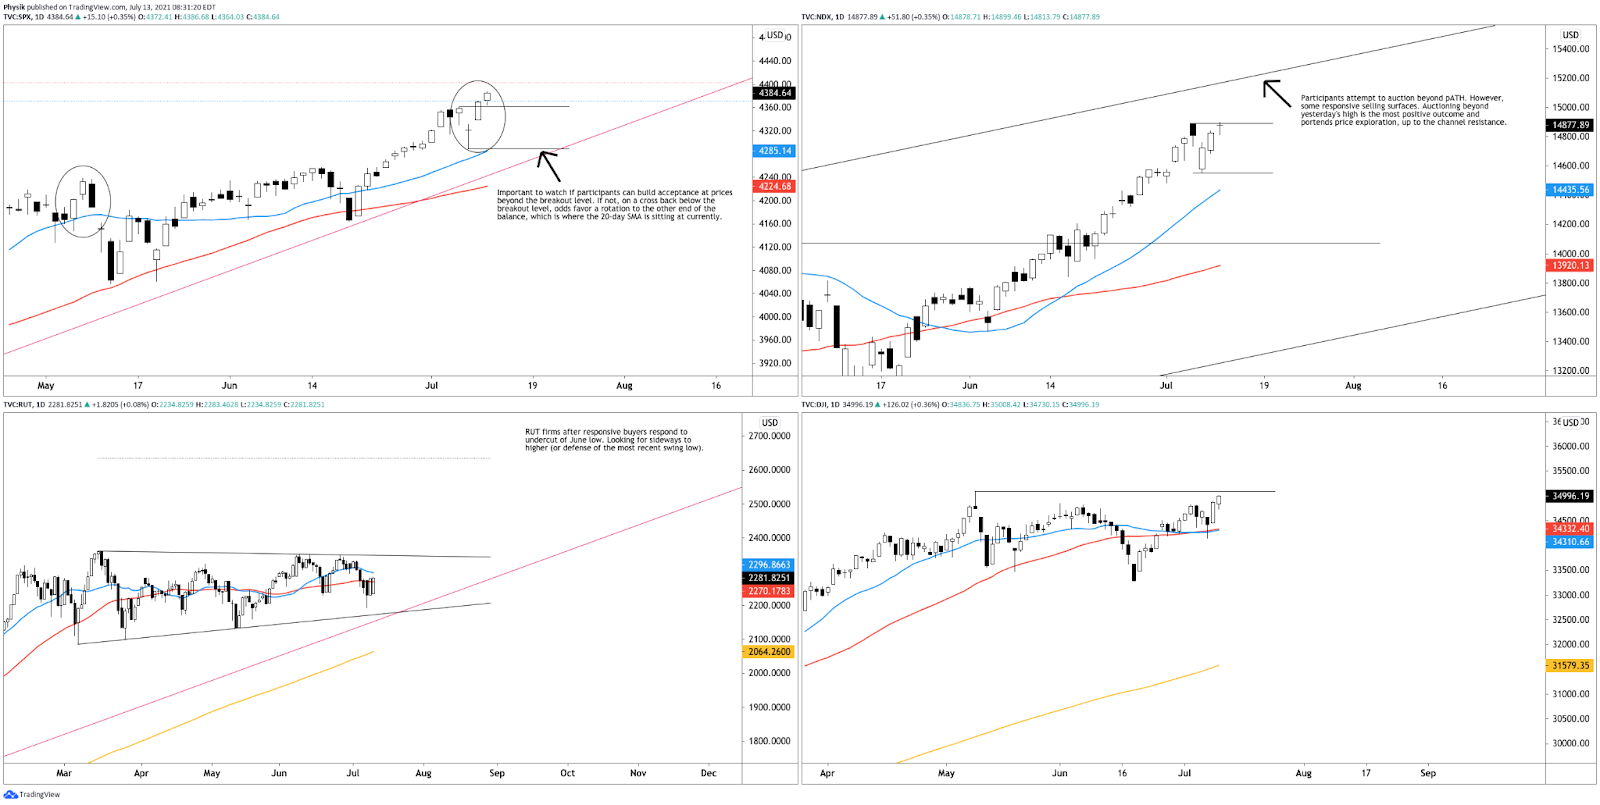
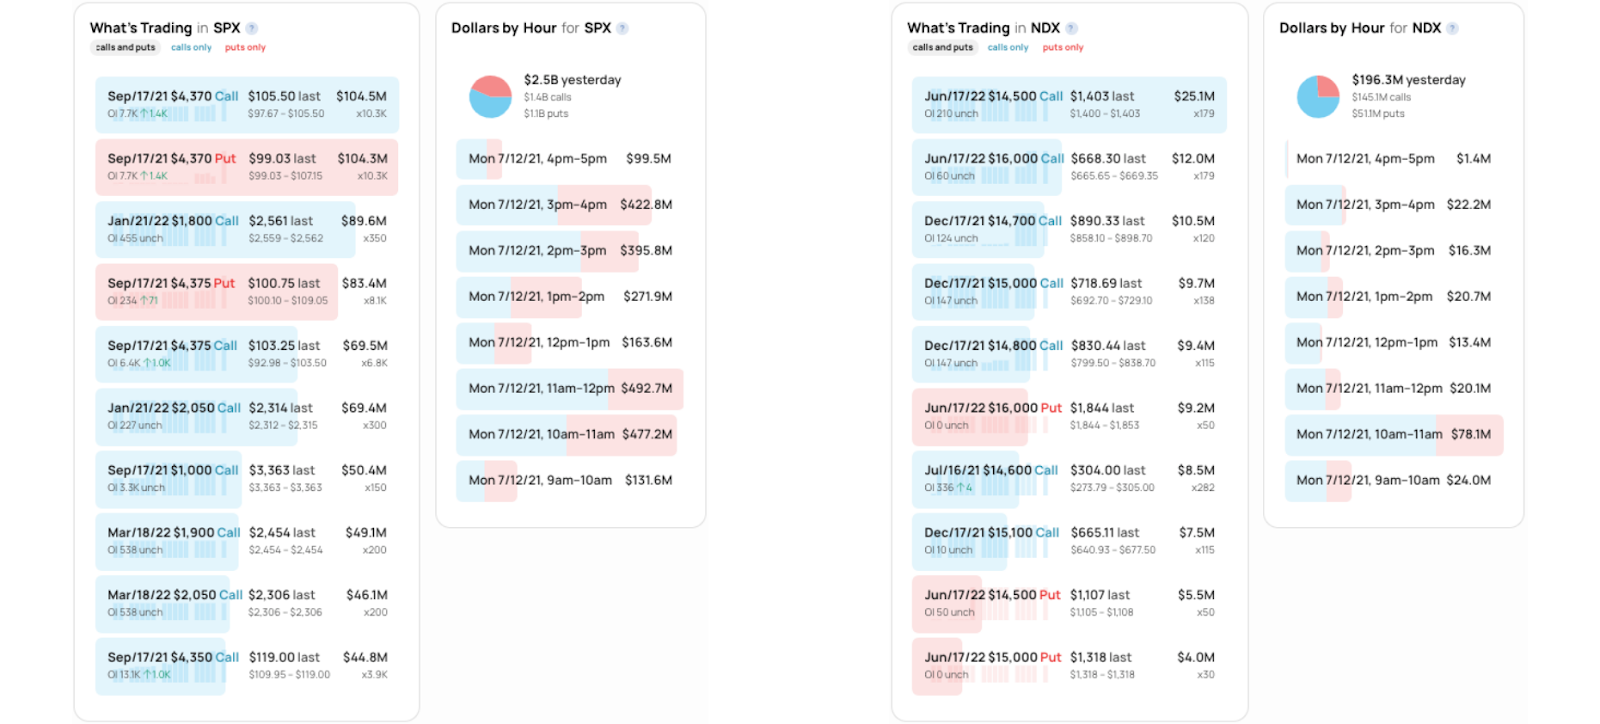
Graphic: 65-minute profile chart of the Micro E-mini S&P 500 Futures.Graphic: Daily candlestick charts of the S&P 500 (top left), Nasdaq 100 (top right), Russell 2000 (bottom left), and Dow Jones Industrial Average (bottom right).Graphic: SHIFT search suggests participants were most interested in call strikes at and below the price in the cash-settled S&P 500 (INDEX: SPX) and Nasdaq 100 (INDEX: NDX), yesterday. Noting, yesterday and over the past few weeks, there’s been increased activity in long-dated put options.
News And Analysis
Economy | Yellen sees U.S. companies pushing back global tax deal. (BBG)
Energy | OPEC+ impasse risks price war as demand keeps surging. (REU)
Politics | Biden team mulls digital trade deal to counter China in Asia. (BBG)
Politics | Biden to warn companies of risks of operating in Hong Kong. (FT)
Markets | Boeing cutting 787 production on new structural problems. (REU)
Investors have grown much less bullish on growth, profits & yield curve steepening, have big longs in tech stocks and have lower expectations for U.S. fiscal spending: BofA July fund manager survey. pic.twitter.com/jRwOVIndCP
— Christian Fromhertz 🇺🇸 (@cfromhertz) July 13, 2021
1/x here we are, after riding this rally long, & short Vol for almost 2 months, here we are @ our long awaited terminus: 7/12, the🪟is opening. Tomorrow is CPI. & As we pointed out on Fri , IVol is SO cheap…but invariably, when it’s THIS cheap, it’s usually ‘cheap for a reason.’ https://t.co/CIcKlqwmUzpic.twitter.com/sDbJQNAbOu
History shows us that when the common only A-D Line and the composite (all issues) one disagree, one is better off listening to the all issues version. The top before the Covid Crash was a notable exception, and not brought about by financial market illiquidity. Counterintuitive. https://t.co/sQJR4KVXUupic.twitter.com/lumwWNUldx
Renato founded Physik Invest after going through years of self-education, strategy development, and trial-and-error. His work reporting in the finance and technology space, interviewing leaders such as John Chambers, founder, and CEO, JC2 Ventures, Kevin O’Leary, businessman and Shark Tank host, Catherine Wood, CEO and CIO, ARK Invest, among others, afforded him the perspective and know-how very few come by.
Having worked in engineering and majored in economics, Renato is very detailed and analytical. His approach to the markets isn’t built on hope or guessing. Instead, he leverages the unique dynamics of time and volatility to efficiently act on opportunity.
Disclaimer
At this time, Physik Invest does not manage outside capital and is not licensed. In no way should the materials herein be construed as advice. Derivatives carry a substantial risk of loss. All content is for informational purposes only.
Key Takeaways: U.S. equity index futures diverge in their attempt to discover fair prices for two-sided trade.
Ahead: Economic data and earnings.
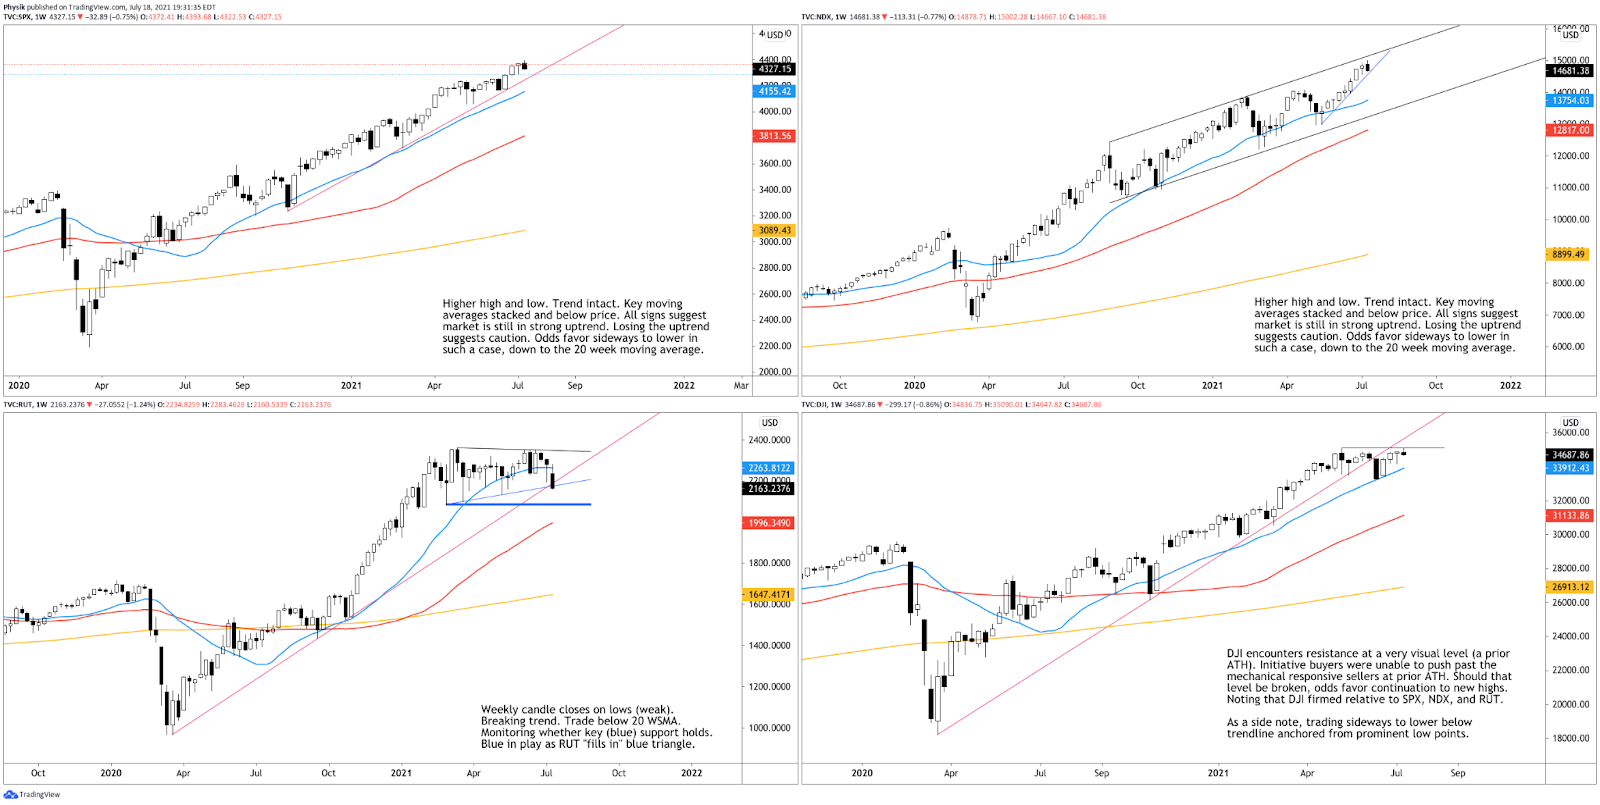
SPX, RUT, DJI firm. NDX tad weaker.
What Happened: Last week, U.S. stock index futures auctioned sideways to higher, only after enduring a brief liquidation alongside anxieties surrounding the spread of COVID-19 variants, as well as an evolution in monetary policy.
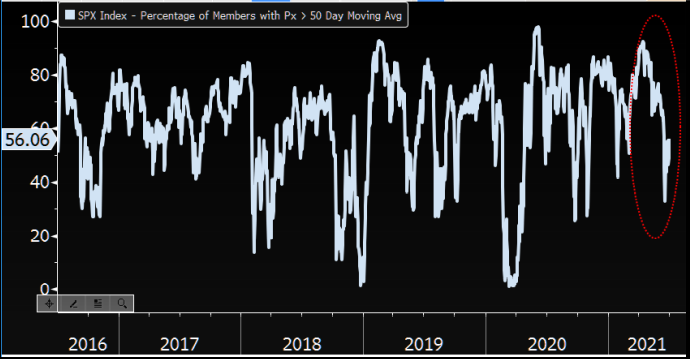
The liquidation, though, was not unwarranted. For weeks broad market indices, led by the Nasdaq 100, rose on narrowing breadth and tapering volumes.
Graphic: Breadth metrics from JPMorgan Chase & Co (NYSE: JPM), via The Market Ear.
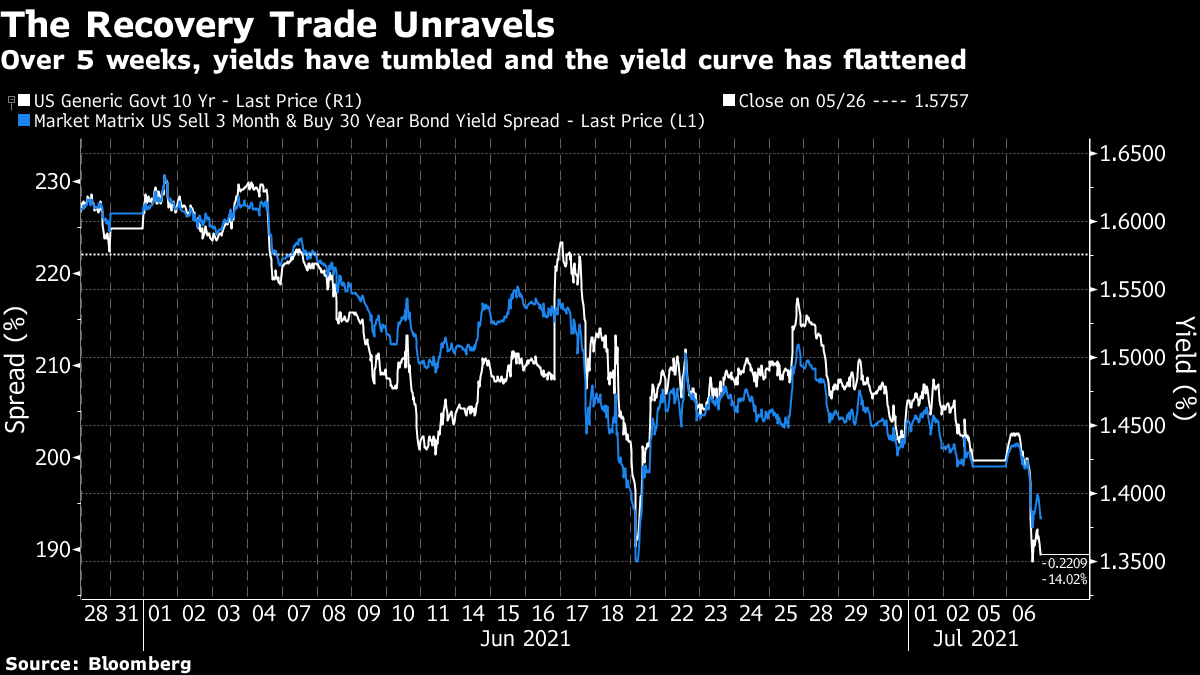
Then, during the unraveling, a meaningful divergence was observed with the Nasdaq 100 trading relatively weak. This came as rates on the 10 Year T-Note rebounded after testing trend support near 1.25%.
Graphic: In line with projections future inflation is easing, the yield curve flattened while bond yields fall substantially, via Bloomberg.
Technical factors – issuance, short coverings, a fading reflation trade, and peak growth – are to blame for lower Treasury yields.
“Technical factors appear to be pushing rates lower and this should be temporary as current 10-year Treasury yield of 1.3% is well below its economic fair value,” Moody’s Corporation (NYSE: MCO) strategists wrote July 8.
Through an ordinary least squares regression using an estimate of monthly real U.S. GDP, CPI, the current effective fed funds rate, the Fed’s balance sheet as a share of nominal GDP, and a Fed bias measure via fed funds futures, Moody’s comes up with an implied “economic fair value” of 1.6% and 1.65% for the 10-year yield.
Going into year-end, on the heels of the strongest and quickest recovery in history, Moody’s sees the 10-year rising to 1.9% as the Fed announces its intent to taper in September. Once monthly asset purchases have been reduced to zero, “the Fed will reinvest proceeds from maturing assets to ensure its balance sheet doesn’t contract, which would be contractionary monetary policy. [L]ook for the first-rate hike in the first quarter of 2023.”
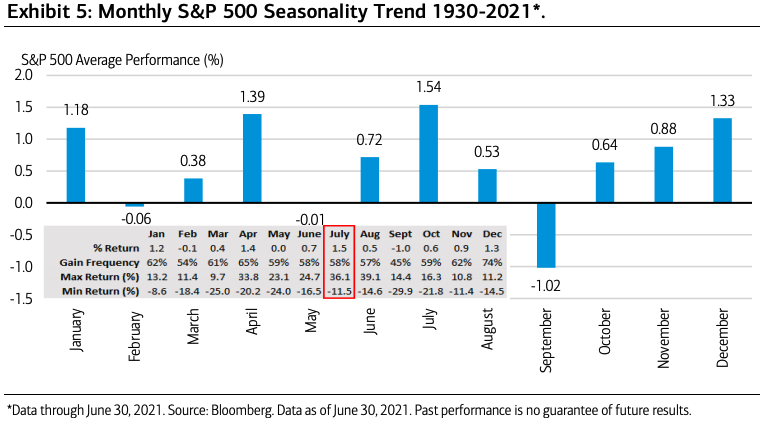
With that, Goldman Sachs Group Inc (NYSE: GS) suggests “[e]xpectations of higher interest rates and higher corporate tax rates by year-end are the primary reasons [to] forecast that the S&P 500 will trade sideways during the next six months.” Supporting that view are earnings estimates, the inventory positioning of participants, as well as early July seasonality metrics.
Risks Ahead: As discussed in prior commentaries, after mid-July, the window for fundamental dynamics (e.g., a shift in preferences from saving and investing to spending, monetary tightening, seasonality, or a COVID-19 resurgence) to take over is opened.
Why? Coming into the options expiration (OPEX) cycle, which starts on the third Friday of each month, associated hedging forces make it so there’s more liquidity and less movement. In other words, the market tends to pin.
Options Expiration (OPEX): Option expiries mark an end to pinning (i.e, the theory that market makers and institutions short options move stocks to the point where the greatest dollar value of contracts will expire worthless) and the reduction dealer gamma exposure.
Thereafter, according to SpotGamma, “[t]he week after expiration the market tends to experience its largest intraday volatility which corresponds to the reduction in large options positions, and the hedging associated with them.”
Graphic: Volatility before and after OPEX, via SpotGamma.
Considerations: Ahead are some releases on consumer, producer, and import prices, as well as industrial production, consumer sentiment, and retail sales. Also, big banks kick off the earnings season with reports on second-quarter results.
Moody’s notes: “data on inflation, retail sales and industrial production could alter … estimate[s] of second-quarter U.S. GDP, which [are] currently tracking 8.2% at an annualized rate.”
What To Expect: In the coming sessions, participants will want to focus their attention on where the S&P 500 trades in relation to the $4,341.75 high volume area (HVNode) pivot.
Volume Areas: A structurally sound market will build on past areas of high volume. Should the market trend for long periods of time, it will lack sound structure (identified as a low volume area which denotes directional conviction and ought to offer support on any test).

If participants were to auction and find acceptance into areas of prior low volume, then future discovery ought to be volatile and quick as participants look to areas of high volume for favorable entry or exit.
In the best case, the index trades sideways or higher; activity above $4,341.75 leaves in play the $4,363.50 regular trade high (RTH High). Initiative trade beyond the RTH High could reach as high as the Fibonacci-derived price targets at $4,373.00 and $4,398.50.
Significance Of Prior ATHs, ATLs: Prices often encounter resistance (support) at prior highs (lows) due to the supply (demand) of old business. These areas take time to resolve. Breaking and establishing value (i.e., trading more than 30-minutes beyond this level) portends continuation.
In the worst case, the index trades lower; activity below $4,341.75 puts in play the $4,312.25 HVNode. Thereafter, if lower, the $4,291.00 untested Point of Control (POC), $4,285.75 micro-composite HVNode, and $4,239.25 HVNode come into play.
POCs: POCs are valuable as they denote areas where two-sided trade was most prevalent. Participants will respond to future tests of value as they offer favorable entry and exit.
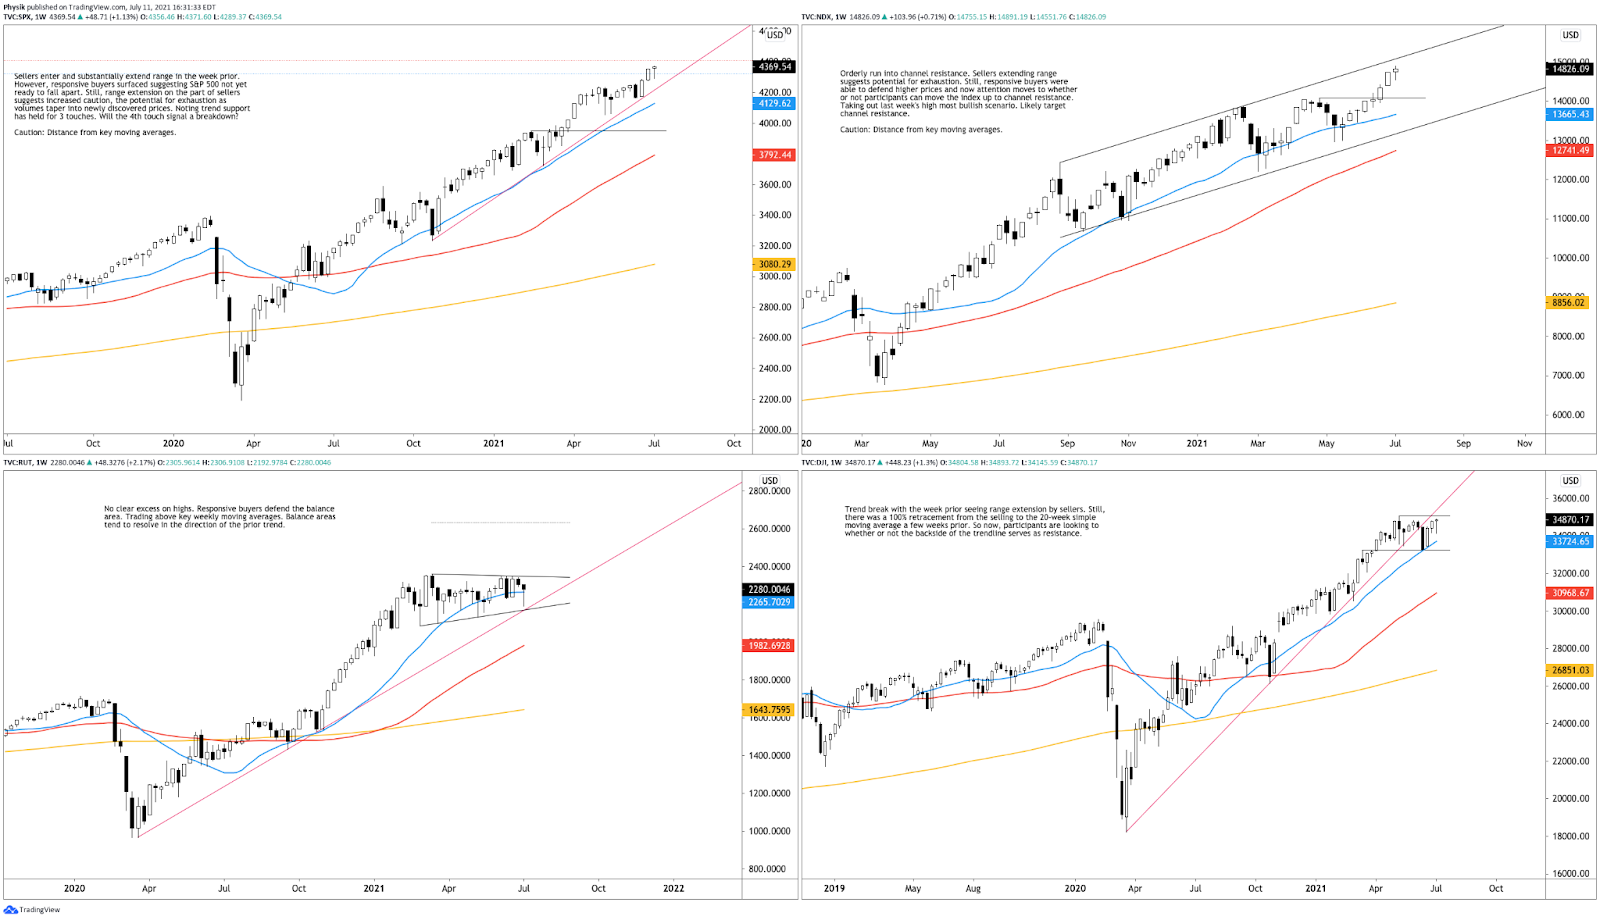
Graphic: 65-minute profile chart of the Micro E-mini S&P 500 Futures.Graphic: Weekly candlestick charts of the S&P 500 (top left), Nasdaq 100 (top right), Russell 2000 (bottom left), and Dow Jones Industrial Average (bottom right).Graphic: SHIFT search suggests participants were most interested in call strikes at and below the price in the cash-settled S&P 500 (INDEX: SPX) and Nasdaq 100 (INDEX: NDX), last week. Noting, over the past few weeks, there’s been increased activity in long-dated put options.
News And Analysis
Markets | Lower stress capital buffers a credit negative for many U.S. banks. (Moody’s)
Economy | A faster recovery boosting prices, but runaway inflation unlikely. (Fitch)
Economy | Is the Fed “tempting FAIT” by assuming inflation is just transitory? (BLK)
Economy | The Fed’s dot plots are not enough in a quantitative easing world. (S&P)
Economy | China’s fading ‘first-in first-out’ rebound sending a global warning. (BBG)
Markets | Commodity boom dwarfs oil spat as emerging markets set to win. (BBG)
Economy | Unpacking several paths to higher-than-expected interest rates. (Fitch)
FinTech | Meet Unbound, a new decentralized cross-chain liquidity protocol. (VV)
Travel | Richard Branson, Virgin Galactic pull-off key test for space tourism. (BBG)
What People Are Saying
I will write a couple of points on #VOLUME. It's a #THREAD. I get a lot of questions regarding volume confirmation on chart patterns. Here is my story with volume as a supporting indicator.
Renato founded Physik Invest after going through years of self-education, strategy development, and trial-and-error. His work reporting in the finance and technology space, interviewing leaders such as John Chambers, founder, and CEO, JC2 Ventures, Kevin O’Leary, businessman and Shark Tank host, Catherine Wood, CEO and CIO, ARK Invest, among others, afforded him the perspective and know-how very few come by.
Having worked in engineering and majored in economics, Renato is very detailed and analytical. His approach to the markets isn’t built on hope or guessing. Instead, he leverages the unique dynamics of time and volatility to efficiently act on opportunity.
Disclaimer
At this time, Physik Invest does not manage outside capital and is not licensed. In no way should the materials herein be construed as advice. Derivatives carry a substantial risk of loss. All content is for informational purposes only.
Happy Sunday! Markets were choppy, ending the week flat-to-down. This came after President Joe Biden’s joint session of Congress, Fed Chair Jerome Powell’s assessment of the economy, and blowout earnings by heavily weighted index constituents.
The following commentary on U.S. broad market equity indices will discuss what happened, why it matters, what to expect, and how participants can position themselves for the coming week.
Market Commentary
What Happened: U.S. broad market indices closed the week out flat-to-down after a failed attempt to break higher on Thursday, April 29. Last week’s action suggests participants are looking for information to initiate a directional move.
Ahead: Data on labor, manufacturing, and earnings.
Markets balancing, positions for directional resolve.
Updated: 10:00 AM EST Sunday.
Why It Matters: The sideways action during last week’s trade came after a lengthy run, higher.
The S&P 500, in particular, from its March 2020 low, is up over 90%.
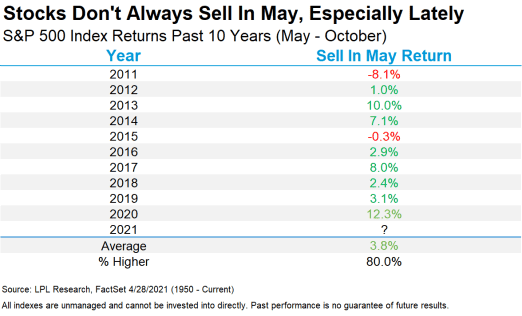
That said, as investors enter into a new month, popular news outlets are beating the drum of an old adage: “Sell in May and go away.”
Is there any truth to this statement? It depends on perspective.
Historically speaking, the period spanning May to October is generally weak. On average, the S&P 500 is up as high as +2% during this six-month period.
“Stocks are up more than 87% from the March lows, suggesting a well-deserved pullback during these troublesome months is quite possible,” LPL Financial Chief Market Strategist Ryan Detrick said in a recent blog post. “But with an accommodative Fed, fiscal and monetary policy, along with an economy that is opening faster than nearly anyone expected, we’d use any weakness as an opportunity to add to positions.”
Adding, trends are changing, though; stocks have been higher during these so-called weak months 8 out of the past 10 years, according to LPL Research.
So, with that, in maintaining objectivity, we zoom out and ask a few questions.
Where are we in relation to the prior week’s range? Overlapping.
Is the market’s attempt to go in a certain direction supported? No. After a failed balance-area breakout, participants rotated and accepted prices back in the prior range, as evidenced by unchanged value-area placement, the area where 70% of prior trade (i.e., 1 standard deviation) is conducted.
Is the technical and fundamental narrative supportive of current prices? Technically, the market is in an extended uptrend. However, despite value-area placement suggesting a validation of higher prices, market liquidity metrics point to distribution, the opposite of accumulation.
Now, we analyze other factors in play.
Real Yields: Alongside April’s FOMC — at which the Federal Reserve left rates unchanged and asset purchases steady — 10-year real yields are on track for their biggest drop since last summer. Low real rates may catalyze risk assets as the present value of their future earnings become more attractive.
Capital Gains Tax (CGT): The White House expressed its desire to raise the federal CGT rate to 43.4% for wealthy individuals. However, as Goldman Sachs Group (NYSE: GS) sees it, Congress is likely to settle on a more modest increase. Adding, weak S&P 500 returns, historically, going into CGT hikes are short-lived.
Low Rates, Debt Expansion: Such dynamics incent market participants to take risks, causing destabilizing factors to brew. As Ambrus Group’s Kris Sidial says, “The growth of structured products, passive investing, the regulatory standpoint that’s been implemented with Dodd-Frank and dealers needing to hedge off their risk more frequently than not” are all part of a regime change that’s affected the stability of markets.
Positioning: According to Nomura data presented by The Market Ear, CTAs have taken their positions too far on the long side, reaching levels last seen prior to the 2018 Volmageddon. Additionally, the (1) SPDR S&P 500 ETF Trust (NYSE: SPY) and the (2) Invesco QQQ Trust Series 1 (NASDAQ: QQQ) funds saw some of their biggest outflows. At the same time, certain breadth metrics are diverging from current prices while the SPDR S&P 500 ETF, cash-settled S&P 500 Index, and Invesco QQQ saw sizable call-side bets trade, Friday.
Earnings Reaction: Last week, heavily weighted index constituents reported blowout earnings. The reaction was muted, leaving broad market indices flat-to-down. One explanation is that the expectations, going into the events, were too high. Another is that the equity market is priced to perfection, at this stage of the recovery, and further advances will be supported by the rotation into cyclical parts of the market — financials, energy, and value.
Option Expiration (OPEX): Option expiries mark an end to pinning (i.e, the theory that market makers and institutions short options move stocks to the point where the greatest dollar value of contracts will expire worthless) and the reduction dealer gamma exposure. According to SpotGamma, a provider of actionable options insights, on Friday, up to 30% of the S&P 500 and Nasdaq 100’s gamma rolled off which may allow the indices an opportunity to directionally resolve.
As realized volatility falls from its peak around a year ago, more sold SPX options cluster at strikes nearer to spot. And as implied volatility falls with it, the gamma of those options increases.
More dealer long gamma means more liquidity. More liquidity means less movement. pic.twitter.com/712OAMq7iP
So, in summarizing this section, technically, the market is bullish, supported by the prospects of a healthy rotation. In the coming week, given increased clarity on policy and a sizable derivatives expiry, participants may see directional resolve.
What To Expect: An increased potential to resolve directionally.
In addition, metrics, like price movement, market liquidity, and speculative derivatives activity, confirm participants’ bullishness and opportunistic hedging in light of an acceleration in the global restart and a turn in flows, the result of an apparent shift in consumer preferences, from saving and investing to spending.
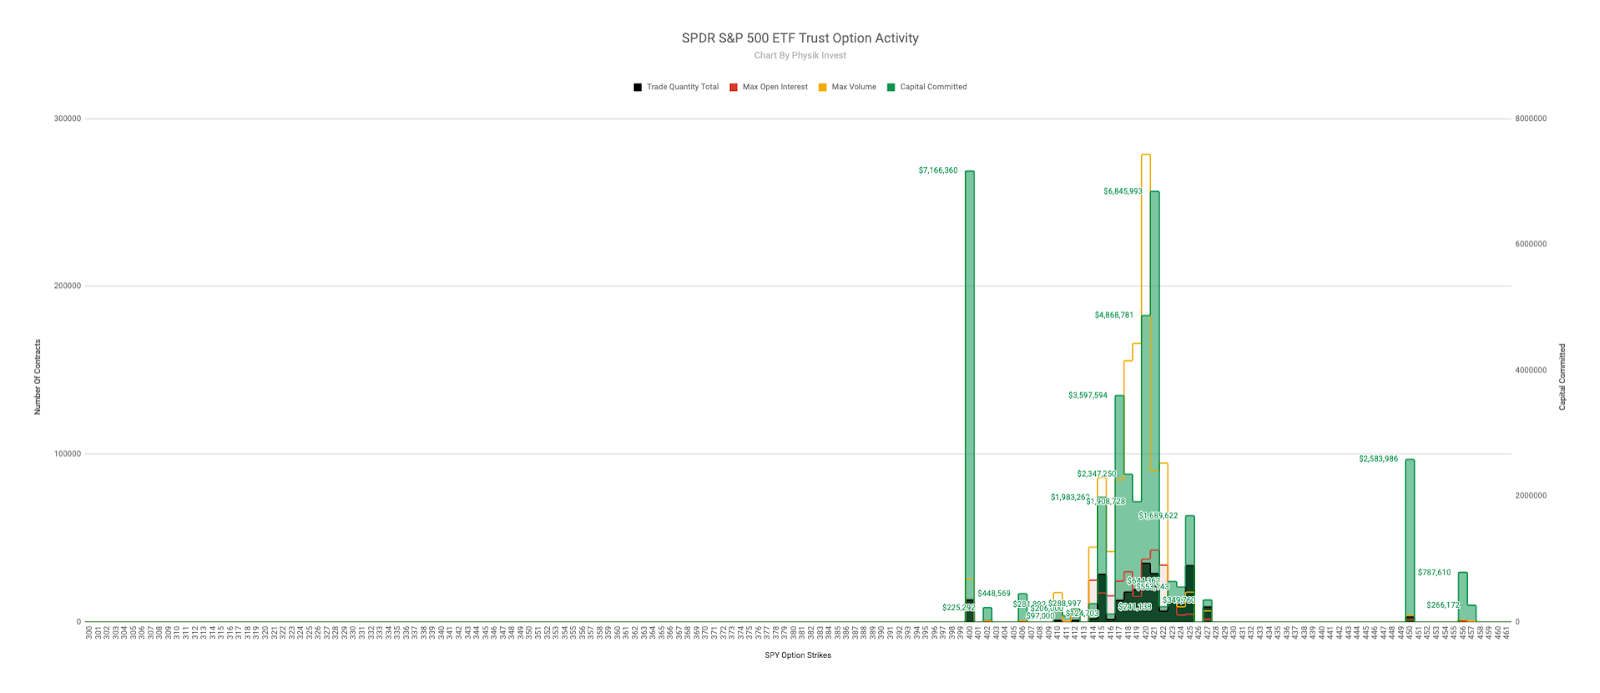
Graphic: Physik Invest maps out the purchase of call and put options in the SPDR S&P 500 ETF Trust (NYSE: SPY), for the week ending April 30. Activity in the options market was primarily concentrated in short-dated tenors, in strikes as low as $400.000, which corresponds with $4,000.00 in the cash-settled S&P 500 Index (INDEX: SPX).
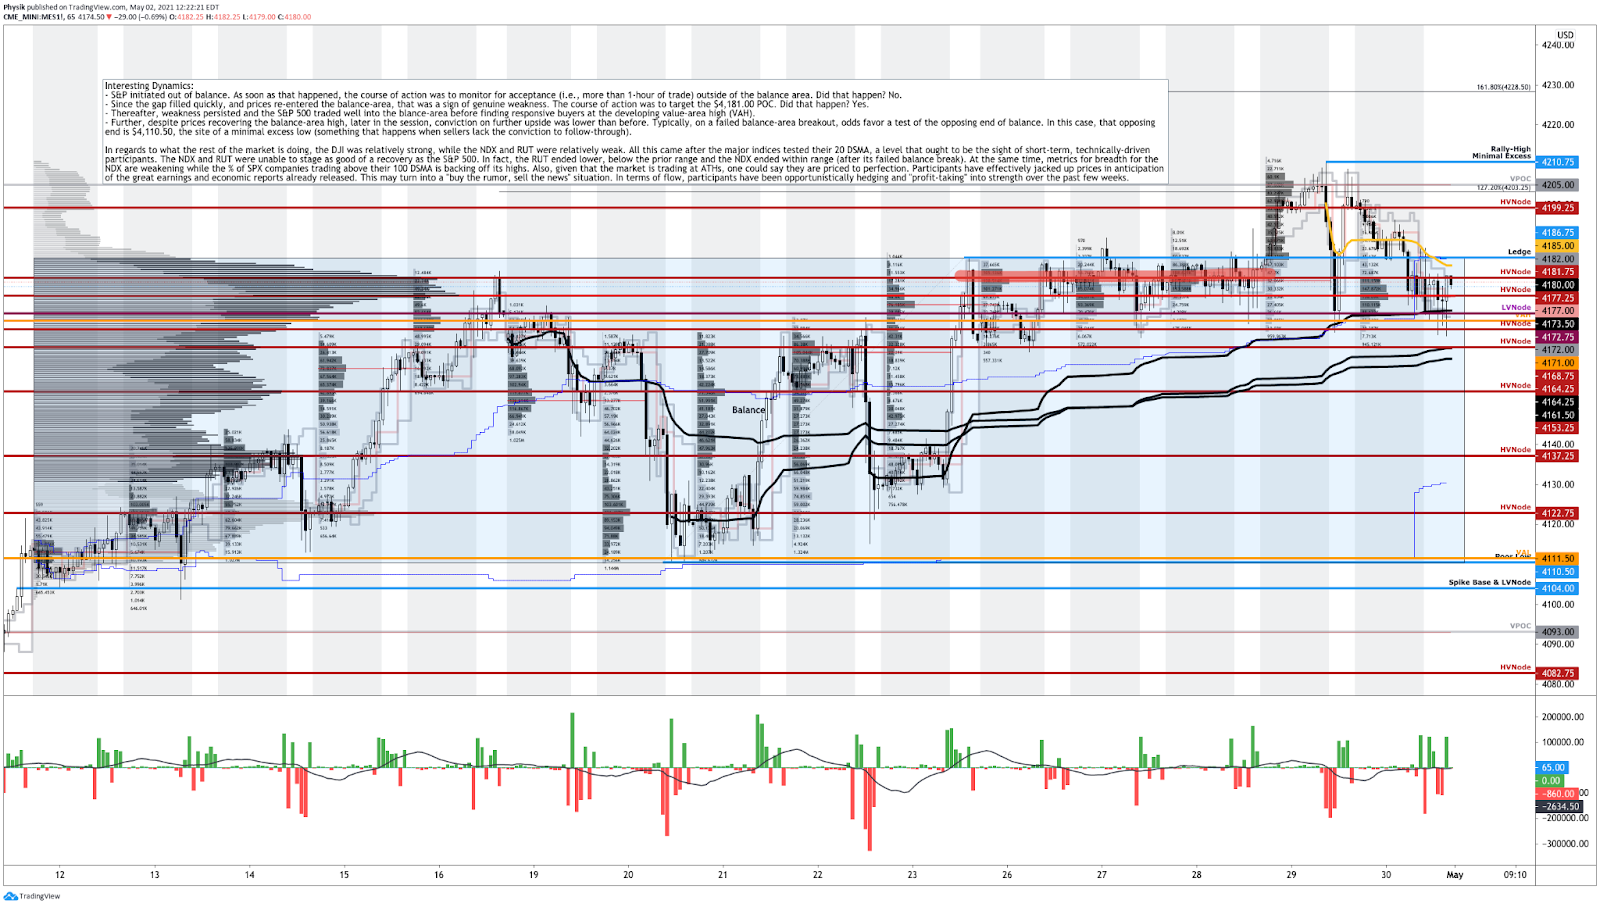
What To Do: In the coming sessions, participants will want to pay attention to where the S&P 500 trades in relation to its $4,186.75-$4,110.50 balance area.
Balance (Two-Timeframe Or Bracket): Rotational trade that denotes current prices offer favorable entry and exit. Balance-areas make it easy to spot change in the market (i.e., the transition from two-time frame trade, or balance, to one-time frame trade, or trend).

Any activity above (below) the balance-area high suggests participants are interested in discovering higher (lower) prices. Any activity within the balance area suggests participants are looking for more information to base their next move; in such case, responsive buying and selling is the course of action.

Responsive Buying (Selling): Buying (selling) in response to prices below (above) area of recent price acceptance.
Initiative trade below the balance-area low suggests an inclination by participants to revert to the mean and repair some of the poor structure left behind prior discovery. Initiative trade above the balance area puts in play the $4,210.75 minimal excess rally-high, and the cluster of price extensions at and above $4,200.00, typical price targets based on Fibonacci principles.
Initiative Buying (Selling): Buying (selling) within or above (below) previous price acceptance.

Excess: A proper end to price discovery; the market travels too far while advertising prices. Responsive, other-timeframe (OTF) participants aggressively enter the market, leaving tails or gaps which denote unfair prices.
So, in the best case, the S&P 500 makes an attempt to balance or discover prices as high as $4,300.00. In the worst case, participants look to auction the S&P 500 into prior poor structures and low-volume areas (LVNodes) that ought to offer little-to-no support.
More On Volume Areas: A structurally sound market will build on past areas of high-volume (HVNode). Should the market trend for long periods of time, it will lack sound structure (identified as a low-volume area (LVNode) which denotes directional conviction and ought to offer support on any test).

If participants were to auction and find acceptance into areas of prior low-volume, then future discovery ought to be volatile and quick as participants look to areas of high volume for favorable entry or exit.
Graphic: 65-minute profile chart of the Micro E-mini S&P 500 Futures.
News And Analysis
Markets | U.S. builders produced record share of homes with hot market. (BBG)
Following up on equity flow, traces of real distribution across equities have amplified from my note detecting it earlier this week –– note how the baskets I mentioned have traded since. Yuge offer imbalances popping up across single names too, which @Ksidiii has also been noting https://t.co/kBXTkAqgN5pic.twitter.com/126b4aV8p3
FinTech | Apex Fintech has blow-out earnings ahead of NYSE listing. (BZ)
FinTech | How to attract large investors to your direct investing platform? (TC)
FinTech | New fintech groups form as industry scrutiny is ramping up. (S&P)
FinTech | Cryptocurrency bank wins OCC approval to form de novo. (S&P)
Markets | CME eyes wider customer base with micro bitcoin futures. (TB)
FinTech | Coinbase plans to acquire data and analytics platform Skew. (TB)
FinTech | How U.K.-based Lendable is powering fintechs across EMs. (TC)
FinTech | Amid the IPO gold rush, how should we value fintech startups? (TC)
FinTech | 10 fintech headhunters you need to know for recruiting to talent. (BI)
FinTech | U.K. banks speed up plans to ax branches, switch to digital focus. (S&P)
Medicine | Kevin O’Leary-backed MindMed has uplisted on the Nasdaq. (BZ)
Media | Creators are making lots of money selling Google spreadsheets. (Mashable)
Media | As newsletter advertising grows, advertisers opting for quality. (ADWK)
About
Renato founded Physik Invest after going through years of self-education, strategy development, and trial-and-error. His work reporting in the finance and technology space, interviewing leaders such as John Chambers, founder, and CEO, JC2 Ventures, Kevin O’Leary, Canadian businessman and Shark Tank host, Catherine Wood, CEO and CIO, ARK Invest, among others, afforded him the perspective and know-how very few come by.
Having worked in engineering and majored in economics, Renato is very detailed and analytical. His approach to the markets isn’t built on hope or guessing. Instead, he leverages the unique dynamics of time and volatility to efficiently act on opportunity.
Disclaimer
At this time, Physik Invest does not manage outside capital and is not licensed. In no way should the materials herein be construed as advice. Derivatives carry a substantial risk of loss. All content is for informational purposes only.
What Happened: U.S. stock index futures auctioned higher overnight after President Joe Biden’s joint session of Congress, Fed Chair Jerome Powell’s assessment of the economy, and blowout earnings by heavily weighted index constituents.
Graphic updated at 8:20 AM ET.
What To Expect: Thursday’s regular session (9:30 AM – 4:00 PM EST) will likely open on a gap, outside of prior-range and -value, suggesting the potential for directional opportunity.
Balance-Break + Gap Scenarios: Monitor for acceptance (i.e., more than 1-hour of trade) outside of the balance area.

Gaps ought to fill quickly. Should they not, that’s a signal of strength; do not fade. Leaving value behind on a gap-fill or failing to fill a gap (i.e., remaining outside of the prior session’s range) is a go-with indicator.

Auctioning and spending at least 1-hour of trade back in the prior range suggests a lack of conviction; in such a case, do not follow the direction of the most recent initiative activity.
Adding, overnight, Wednesday’s best-case outcome occurred, evidence by initiative trade beyond the S&P 500’s $4,186.75 ledge. Thus far, the index has taken out all major upside references.
Initiative Buying: Buying within or above the previous day’s value area.

Ledges: Flattened area on the profile which suggests responsive participants are in control, or initiative participants lack the confidence to continue the discovery process. The ledge will either hold and force participants to liquidate (cover) their positions, or crack and offer support (resistance).

Initiative Buying: Buying within or above the previous day’s value area.
To note, the Fed strengthened its assessment of the economy and reaffirmed the need for aggressive support.
Charlie Ripley, Senior Investment Strategist for Allianz Investment Management states: “With no meaningful change to monetary policy or communication, this meeting was simply a message to market participants to sit back and observe as the economic recovery continues to unfold.”
“For now, the Fed is maintaining a tight grip on the bond market, but it appears like a discussion on tapering bond purchases is right around the corner.”
Moving on, for today, participants can trade from the following frameworks.
In the best case, the S&P 500 trades sideways or higher; activity between the $4,203.25 Fibonacci-derived price extension and $4,186.75 ledge calls for balance or responsive trade. Initiative trade beyond the $4,203.25 price extension could reach as high as $4,228.00 and $4,263.00.
Responsive Buying (Selling): Buying (selling) in response to prices below (above) area of recent price acceptance.

Balance (Two-Timeframe Or Bracket): Rotational trade that denotes current prices offer favorable entry and exit. Balance-areas make it easy to spot change in the market (i.e., the transition from two-time frame trade, or balance, to one-time frame trade, or trend).
In the worst case, the S&P 500 trades lower; activity below the $4,186.75 ledge targets the $4,181.00 POC.
POCs: POCs (like HVNodes described above) are valuable as they denote areas where two-sided trade was most prevalent. Participants will respond to future tests of value as they offer favorable entry and exit.
Thereafter, if lower, participants should look for a rotation to the other balance, or $4,110.50.
Graphic: 65-minute profile chart of the Micro E-mini S&P 500 Futures.Graphic: Physik Invest maps out the purchase of call and put options in the SPDR S&P 500 ETF Trust (NYSE: SPY), for April 28. Impactful activity in the options market was primarily concentrated on the call side, in short-dated tenors, in strikes as high as $425.00, which corresponds with $4,250.00 in the cash-settled S&P 500 Index (INDEX: SPX).
When thinking about human behavioral patterns you have to look at the market buying power switching to the millennials, who view things in a speculative manner naturally.
Us millennials have never experienced real inflation, nor a “losing market”.
FinTech | State Of Fintech Q1 2021 Report: Investment, Sector Trends. (CBI)
MiamiTech | ‘Miami Tech Week’ wasn’t planned. But the hype is infectious. (Wired)
FinTech | Ethereum jumps to high on a report of EIB digital bond issuance. (REU)
About
Renato founded Physik Invest after going through years of self-education, strategy development, and trial-and-error. His work reporting in the finance and technology space, interviewing leaders such as John Chambers, founder, and CEO, JC2 Ventures, Kevin O’Leary, Canadian businessman and Shark Tank host, Catherine Wood, CEO and CIO, ARK Invest, among others, afforded him the perspective and know-how very few come by.
Having worked in engineering and majored in economics, Renato is very detailed and analytical. His approach to the markets isn’t built on hope or guessing. Instead, he leverages the unique dynamics of time and volatility to efficiently act on opportunity.
Disclaimer
At this time, Physik Invest does not manage outside capital and is not licensed. In no way should the materials herein be construed as advice. Derivatives carry a substantial risk of loss. All content is for informational purposes only.
What Happened: Ahead of key economic developments, U.S. stock index futures auctioned sideways-to-lower overnight. Yields and the dollar rose.
This activity comes alongside reports of strong earnings from heavily weighted index constituents. Alphabet Inc (NASDAQ: GOOGL), Microsoft Corporation (NASDAQ: MSFT), and Pinterest (NYSE: PINS) were some of the most anticipated reports.
Today, Joe Biden will unveil his “American Families Plan” in an address to Congress, the Federal Reserve will provide clarity on its monetary easing plan, and Apple Inc (NASDAQ: AAPL), among others, will report their earnings.
Graphic updated at 8:20 AM EST.
What To Expect: Wednesday’s regular session (9:30 AM – 4:00 PM EST) will likely open inside of prior-range and -value, suggesting a limited potential for immediate directional opportunity.
Adding, over the past few sessions, volumes have dwindled and responsive trade has been the course of action. This is in anticipation of impactful fundamental developments, like the FOMC meeting, today.
Responsive Buying (Selling): Buying (selling) in response to prices below (above) area of recent price acceptance.
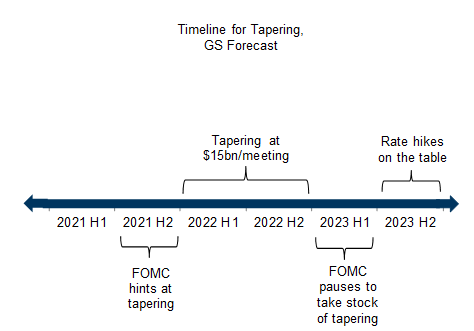
Goldman Sachs Group Inc (NYSE: GS) expects the Fed to keep rate hikes off the table until mid-2023. Given that labor slack remains high, the odds of tapering are rather slim.
Graphic: Goldman Sachs’ timeline for Federal Reserve tapering, via ForexLive.
That said, today’s trade will likely be volatile and participants can trade from the following frameworks.
In the best case, the S&P 500 trades sideways or higher; activity above the $4,186.75 ledge targets the $4,191.75 overnight high (ONH). Initiative trade beyond the ONH may introduce excess and could reach as high as the Fibonacci-derived price targets, $4,197.25-$4,263.00.
Ledges: Flattened area on the profile which suggests responsive participants are in control, or initiative participants lack the confidence to continue the discovery process. The ledge will either hold and force participants to liquidate (cover) their positions, or crack and offer support (resistance).

Overnight Rally Highs (Lows): Typically, there is a low historical probability associated with overnight rally-highs (lows) ending the upside (downside) discovery process.

Excess: A proper end to price discovery; the market travels too far while advertising prices. Responsive, other-timeframe (OTF) participants aggressively enter the market, leaving tails or gaps which denote unfair prices.
In the worst case, the S&P 500 trades lower; activity below $4,166.75 regular-trade low (RTH Low) targets the $4,164.25 high-volume area (HVNode). Thereafter, if lower, participants can look for responses at the $4,163.25, $4,137.25, and $4,122.75 HVNodes.
Volume Areas: A structurally sound market will build on past areas of high volume. Should the market trend for long periods of time, it will lack sound structure (identified as a low-volume area which denotes directional conviction and ought to offer support on any test).

If participants were to auction and find acceptance into areas of prior low-volume, then future discovery ought to be volatile and quick as participants look to areas of high volume for favorable entry or exit.
As long as prices remain within the prior day’s range, responsive trade is the course of action. Participants should approach today’s session with extra caution, given the potential for headline-driven initiative activity. Big picture, though, the bullish narrative remains intact unless the S&P 500 is able to auction and spend time below the $4,110.50 minimal excess low (also the balance-area low).
Initiative Buying (Selling): Buying (selling) within or above (below) the previous day’s value area.

Balance (Two-Timeframe Or Bracket): Rotational trade that denotes current prices offer favorable entry and exit. Balance-areas make it easy to spot change in the market (i.e., the transition from two-time frame trade, or balance, to one-time frame trade, or trend).
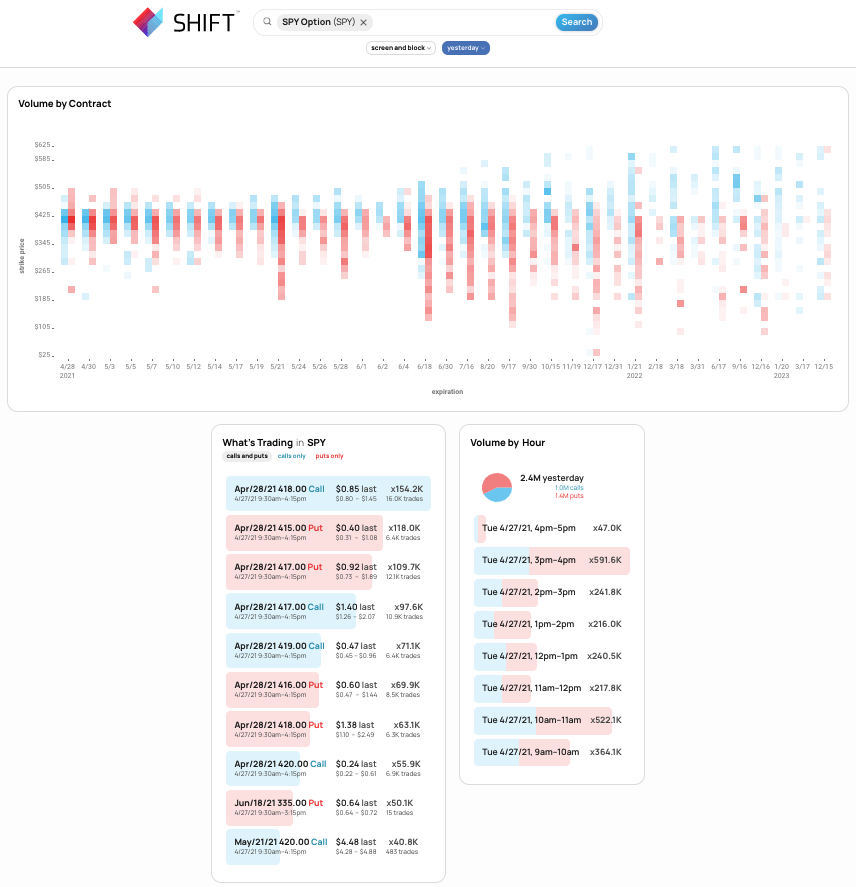
Graphic: 4-hour profile chart of the Micro E-mini S&P 500 Futures.Graphic: SHIFT search maps out the trade of call and put options in the SPDR S&P 500 ETF Trust (NYSE: SPY), for April 27. Activity in the options market was primarily concentrated in short-dated tenors, in strikes near current prices. Data suggests participants, in insignificant amounts, added call-side exposure into the beginning of May. Sentiment flips into the end of May, beginning of June.
News And Analysis
Economy | Biden unveils a massive family aid plan funded by taxing the rich. (BBG)
Economy | Fed to stay patient as U.S. outlook improves: decision-day guide. (BBG)
Commodities | Goldman sees commodities rallying over the next six months. (FP)
Markets | Tesla accused by EPA of auto-coating emissions reporting failure. (BBG)
Markets | Airbus unit has pleaded guilty to corruption over Saudi contracts. (BBG)
Commodities | OPEC+ is sticking to plan to ease oil output cuts from May 1. (REU)
Markets | Local banks, like their giant rivals, are finding loan growth elusive. (BBG)
1/x A short & sweet midweek 🥐… Everything from Mon👇 still applies. Despite every reason to see a price decline, Gary 🦍, Vanna 👸, & Charm 🦥 have other plans. SPX IVol is getting the💩squeezed out of it. With the 1 day event straddle at only $20 w/ Fed & SOTU tomorrow, https://t.co/Bb2qV0wIubpic.twitter.com/tYlk3ZIhZJ
Markets | Chatting with Cathie Wood, the CEO, and CIO at ARK Invest. (MM)
FinTech | Trader-inspired brokerage Edge Clear launches new platform. (BZ)
FinTech | Barclays taps amount over end-to-end digital banking solutions. (BZ)
Financing | IRR in emerging tech hubs starting to overtake Silicon Valley. (TC)
FinTech | ICE introduces ultra-low-latency wireless services in Europe. (MM)
About
Renato founded Physik Invest after going through years of self-education, strategy development, and trial-and-error. His work reporting in the finance and technology space, interviewing leaders such as John Chambers, founder, and CEO, JC2 Ventures, Kevin O’Leary, Canadian businessman and Shark Tank host, Catherine Wood, CEO and CIO, ARK Invest, among others, afforded him the perspective and know-how very few come by.
Having worked in engineering and majored in economics, Renato is very detailed and analytical. His approach to the markets isn’t built on hope or guessing. Instead, he leverages the unique dynamics of time and volatility to efficiently act on opportunity.
Disclaimer
At this time, Physik Invest does not manage outside capital and is not licensed. In no way should the materials herein be construed as advice. Derivatives carry a substantial risk of loss. All content is for informational purposes only.
Index futures auction sideways, validating higher prices.
80% of companies beat expectations.
Ahead: FOMC, Biden Address, GDP.
Indices balance and correct with time.
What Happened: U.S. stock index futures auctioned sideways, overnight, while Treasury yields and commodities posted substantive gains.
This price action comes as nearly 80% of companies that reported their earnings have either met or beaten expectations. The muted response suggests much the optimism has already been priced in. Now, participants are looking for more information to base their next move.
See here for information on how to read an earnings report.
Ahead, is data on home prices, consumer confidence, and manufacturing. On Wednesday, Federal Reserve Chair Jerome Powell will hold a conference on central bank policy. On the same day, Joe Biden will address Congress. Thursday, U.S. GDP will likely show improvement in the first quarter, 2021.
Graphic updated 8:30 AM EST.
What To Expect: Tuesday’s regular session (9:30 AM – 4:00 PM EST) will likely open inside of prior-range and -value, suggesting a limited potential for immediate directional opportunity.
Adding, during the prior day’s regular trade, the best case outcome occurred, evidenced by sideways trade just shy of the $4,186.75 balance-area high.
Balance (Two-Timeframe Or Bracket): Rotational trade that denotes current prices offer favorable entry and exit. Balance-areas make it easy to spot change in the market (i.e., the transition from two-time frame trade, or balance, to one-time frame trade, or trend).
All this comes after a substantial advance. The S&P 500 is up nearly 13% since the start of March and it could be said that the product has been marked up, enough. Given the busy calendar, the odds favor sideways trade. The reason being: a market in balance tends to stay in balance unless some exogenous factor provides participants more information to base their next move.
Adding, Jeff Buchbinder, Equity Strategist for LPL Financial says: “[W]hile sentiment may be overly optimistic and a pickup in volatility would be totally normal, strong breadth measures suggest stocks still may have more upside. This week we tackle that same topic of peak optimism, but by looking at some valuation metrics. While valuations are elevated, they still appear reasonable when factoring in interest rates and inflation.”
Moving on, for today, participants can trade from the following frameworks.
In the best case, the S&P 500 trades sideways or higher; activity above the $4,186.75 ledge targets the $4,191.75 overnight high (ONH). Initiative trade beyond the ONH may introduce excess and could reach as high as the Fibonacci-derived price targets, $4,197.25-$4,263.00.
In the worst case, the S&P 500 trades lower; activity below $4,173.25 regular-trade low (RTH Low) targets the $4,164.25 high-volume area (HVNode). Thereafter, if lower, participants can look for responses at the $4,163.25, $4,137.25, and $4,122.75 HVNodes.
Ledges: Flattened area on the profile which suggests responsive participants are in control, or initiative participants lack the confidence to continue the discovery process. The ledge will either hold and force participants to liquidate (cover) their positions, or crack and offer support (resistance).

Overnight Rally Highs (Lows): Typically, there is a low historical probability associated with overnight rally-highs (lows) ending the upside (downside) discovery process.

Initiative Trade: Buying (selling) within or above (below the previous day’s value area.

Excess: A proper end to price discovery; the market travels too far while advertising prices. Responsive, other-timeframe (OTF) participants aggressively enter the market, leaving tails or gaps which denote unfair prices.

Volume Areas: A structurally sound market will build on past areas of high volume. Should the market trend for long periods of time, it will lack sound structure (identified as a low-volume area which denotes directional conviction and ought to offer support on any test).

If participants were to auction and find acceptance into areas of prior low-volume, then future discovery ought to be volatile and quick as participants look to areas of high volume for favorable entry or exit.
As long as the S&P 500 remains in the $4,186.75-$4,110.50 balance area, the course of action is responsive trade.
Graphic: 65-minute profile chart of the Micro E-mini S&P 500 Futures.Graphic: SHIFT search maps out the trade of call and put options in the SPDR S&P 500 ETF Trust (NYSE: SPY), for April 26. Activity in the options market was primarily concentrated in short-dated tenors, in strikes near current prices. To put it simply, not much is going on, yet.
News And Analysis
Banking | Nomura, UBS take global banks’ Archegos hit to $10B. (BBG)
Economy | U.S. auto dealers are winners as chip shortage lifts profit. (REU)
Markets | Goldman Sachs watching total margin loans after blow-ups. (REU)
M&A | New York Community Bancorp will buy Flagstar Bancorp. (REU)
Economy | France, and Germany support U.S. 21% corporate tax plan. (BBG)
Travel | The E.U. set to let vaccinated U.S. tourists visit this summer. (NYT)
Darrin brings up a problem that a lot of traders have
I’m a big believer in monetizing in tiers. Once you hit your initial forecast, you cut some of the trade down. It could be 1/4th , 1/6th etc..just make sure you pay yourself for being correct. Especially when long convexity https://t.co/egShL4PzeT
FinTech | Citi eyes mortgage tech in push to close the wealth gap. (BBG)
Innovation | Germany to spend recovery money on green, digital goals. (REU)
FinTech | Mobile bank Current raises $220M Series D, tripling value. (TC)
FinTech | S!NG wants creators to lean on NFTs to protect their IP. (TC)
About
Renato founded Physik Invest after going through years of self-education, strategy development, and trial-and-error. His work reporting in the finance and technology space, interviewing leaders such as John Chambers, founder, and CEO, JC2 Ventures, Kevin O’Leary, Canadian businessman and Shark Tank host, Catherine Wood, CEO and CIO, ARK Invest, among others, afforded him the perspective and know-how very few come by.
Having worked in engineering and majored in economics, Renato is very detailed and analytical. His approach to the markets isn’t built on hope or guessing. Instead, he leverages the unique dynamics of time and volatility to efficiently act on opportunity.
Disclaimer
At this time, Physik Invest does not manage outside capital and is not licensed. In no way should the materials herein be construed as advice. Derivatives carry a substantial risk of loss. All content is for informational purposes only.