What Happened
Overnight, equity index futures auctioned sideways to higher alongside an absence in impactful fundamental developments and news catalysts.
Ahead, today, there are no major data releases scheduled.
In the following section, I unpack, in-depth, the fundamental and technical context shadowing recent trade. If you like what is said, consider sharing!
What To Expect
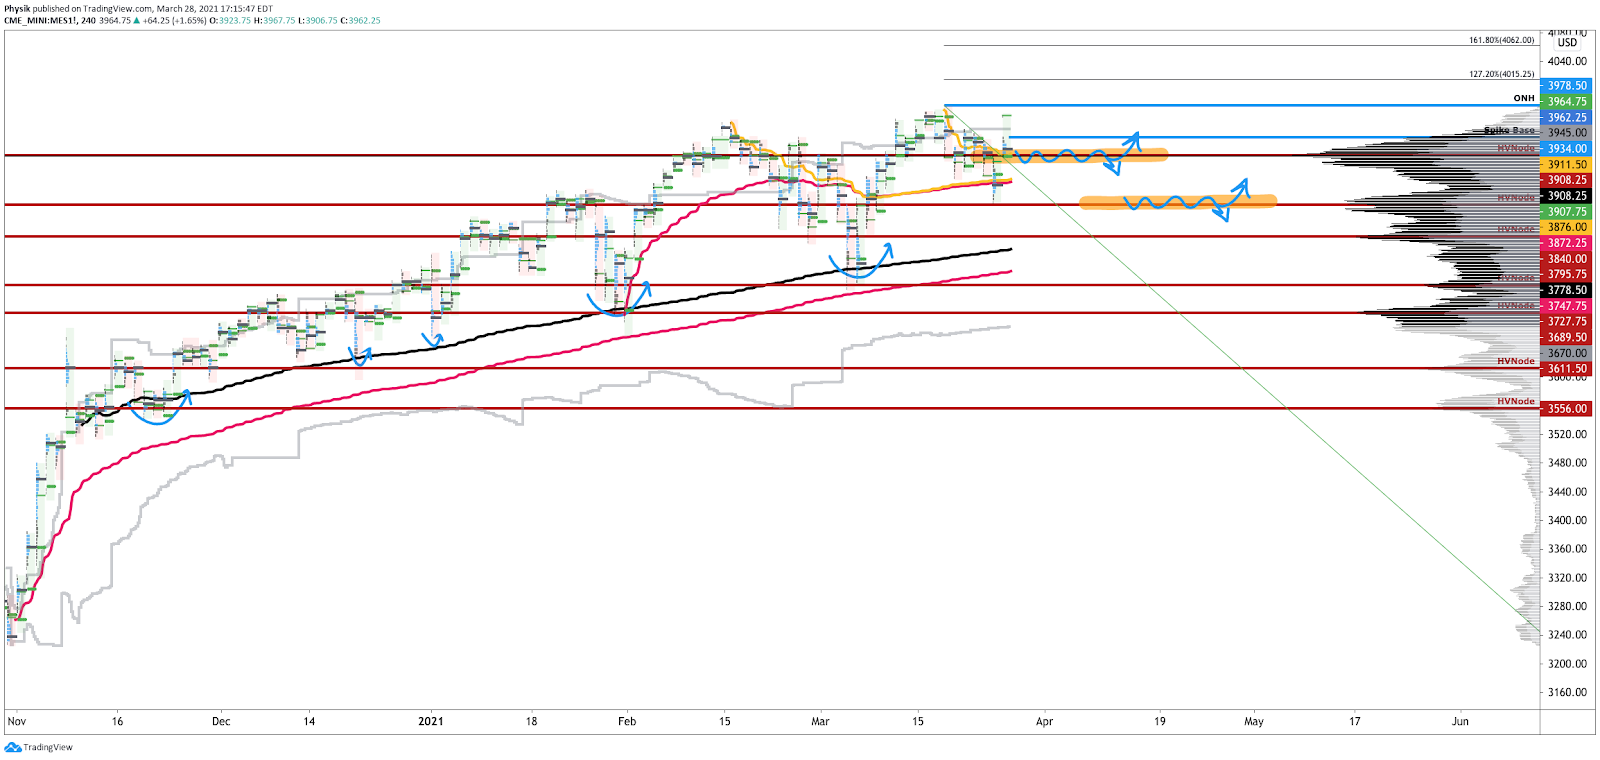
On supportive intraday breadth and lackluster market liquidity metrics, the best case outcome occurred, evidenced by a gap and hold of newly discovered S&P 500 prices.
This activity, which marks a potential willingness to continue the trend, coincides with poor structure, a dynamic that adds to technical instability.
Context: The aforementioned trade is happening in the context of interesting developments with respect to fiscal and monetary policy, as well as supply and demand imbalances.
To start, in regards to fiscal policy, ARK Invest’s Cathie Wood thinks that there will be no capital gains tax rate increases and an installment of a minimum corporate tax (about 15%).
“I think that is one reason the market’s been rallying,” she said in an episode of In The Know.
In sticking with Wood’s theses, why would the market be rallying if all that we (i.e., the market participants) see, in the news, is heavily focused around fears of inflation, so to speak? It wouldn’t; Wood feels that inflation is on its way out.
Major reasons?
(1) Productivity increases will offset dented margins and therefore not lead to impactful price increases; (2) turmoil, with respect to China’s housing and financial sector, ought to depress commodity pricing further as “when China has caught a cold, commodity prices get pneumonia”; (3) at-home inventory build-ups may takeaway from consumption during the holidays (for which businesses are scrambling to increase inventories), and this ultimately should be reflected in commodity prices, given excess inventory; (4) disruptive innovation and declining cost curves.
“The markets are conflicting,” she explains. “You’ve got energy and financials at the top for the year, 54% and 35%, respectively. Those two sectors are associated with very strong boom time economies with a yield curve steepening, meaning long rates are rising faster than short rates.”
“That would be consistent with inflation, but the other two top-performing sectors are real estate and consumer discretionary, and those do not benefit from inflation. They benefit from inflation coming down and lower interest rates.”
The bond market, on the other hand, is in the lower inflation camp. At the same time, the dollar is going up alongside assets like bitcoin, often construed as an inflation hedge.
“Could this mean that the velocity of money is going down,” she asks. “Velocity of money has been coming down because people have been saving and putting money into assets.”
This dynamic is supported by disappointing GDP figures with growth coming mostly from inventories; “Real final sales were slightly negative. Could it be … that [millennials] would prefer not to spend on goods and services, but to invest?”
It seems that participants are increasingly extending moneyness to nonmonetary assets – given monetary policies and an environment of debt and leverage that ultimately cuts into asset price volatility – adding to the prevailing risks of carry when volatility does rise and the demand for money pushes deflation.
A great explainer on the growth of global carry is the book titled The Rise of Carry: The Dangerous Consequences of Volatility Suppression and the New Financial Order of Decaying Growth and Recurring Crisis.
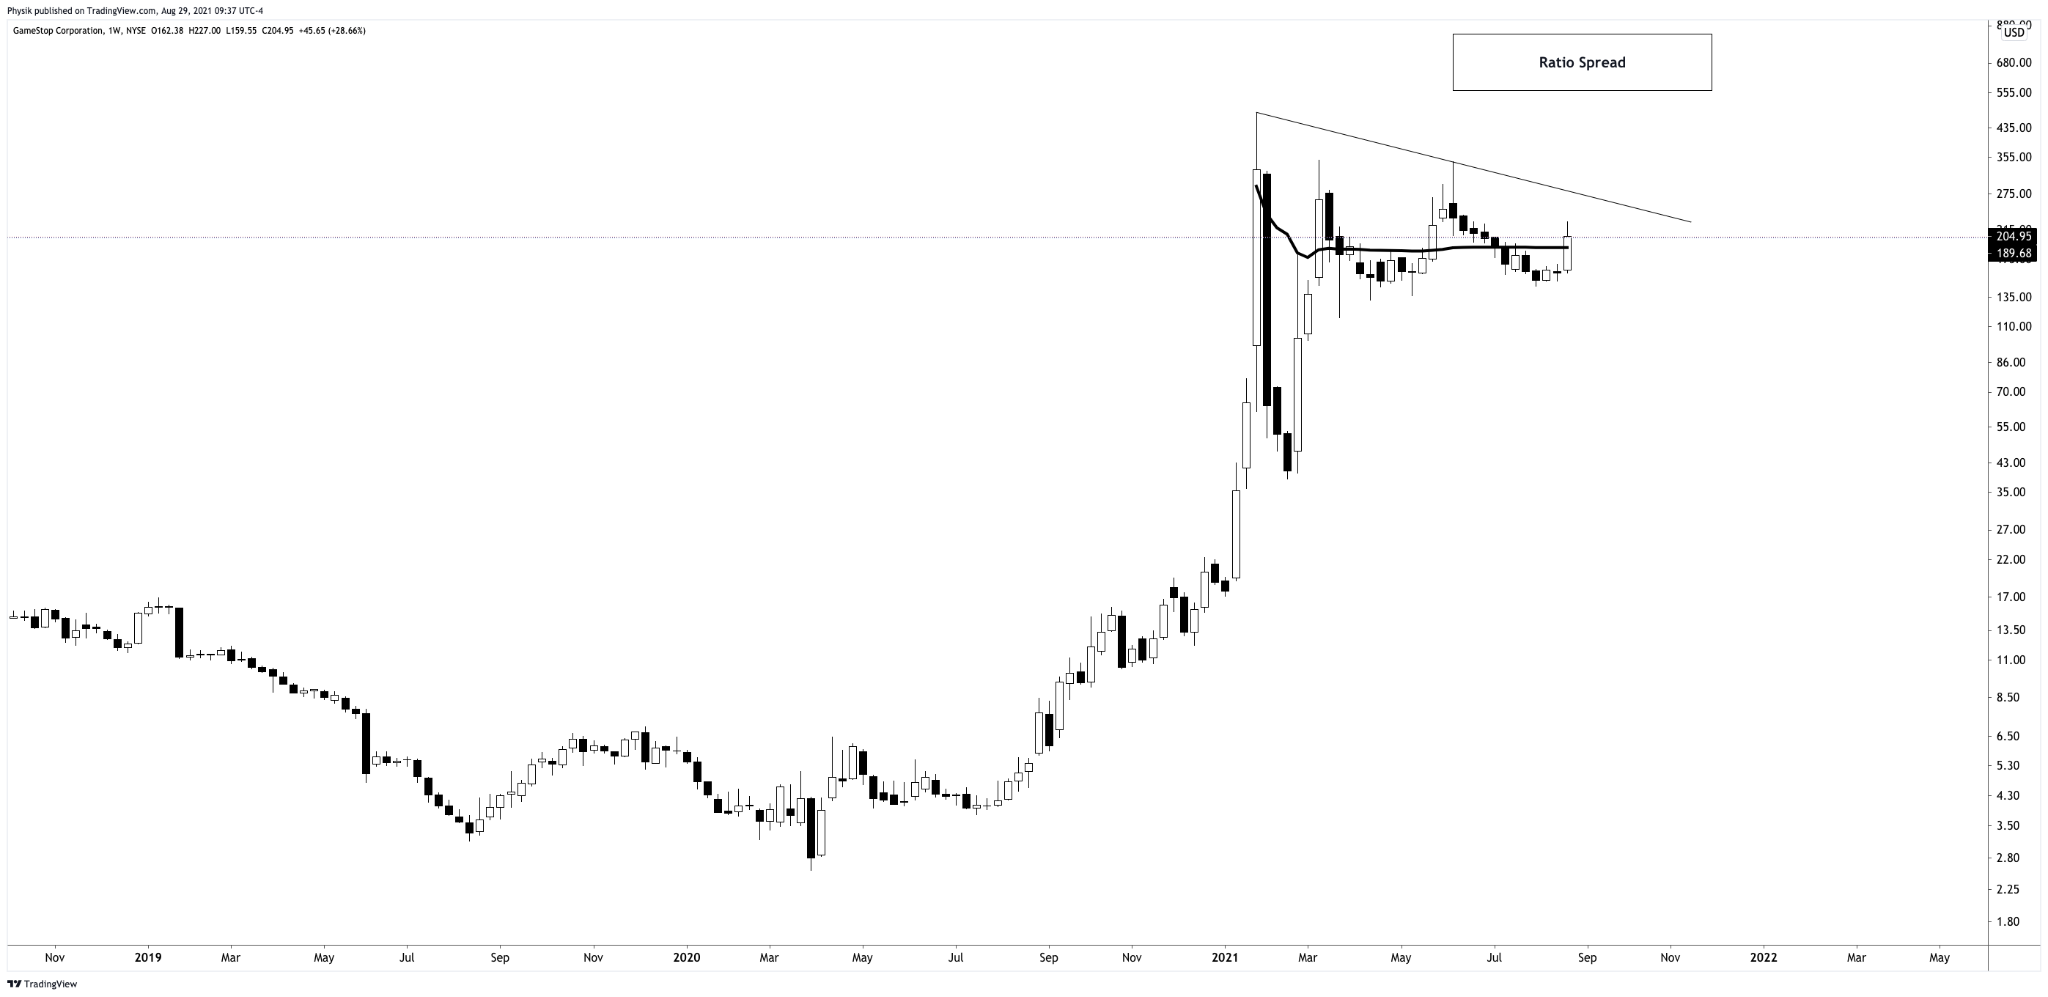
“Ivy Zelman of Zelman Research came out this week. She made a fantastic call on the housing bubble and bust starting in 05-06, and she was right, just a little early. She is very concerned that the housing prices we’re seeing right now are not sustainable,” because of speculation, as well as iBuying and private equity participation.
For instance, just last week, Zillow Group Inc (NASDAQ: Z), a major iBuyer, sought to raise liquidity, dumping properties en masse.
“This is unsustainable … and I’m wondering if even the housing market inflation is going to give way, here,” Wood added.
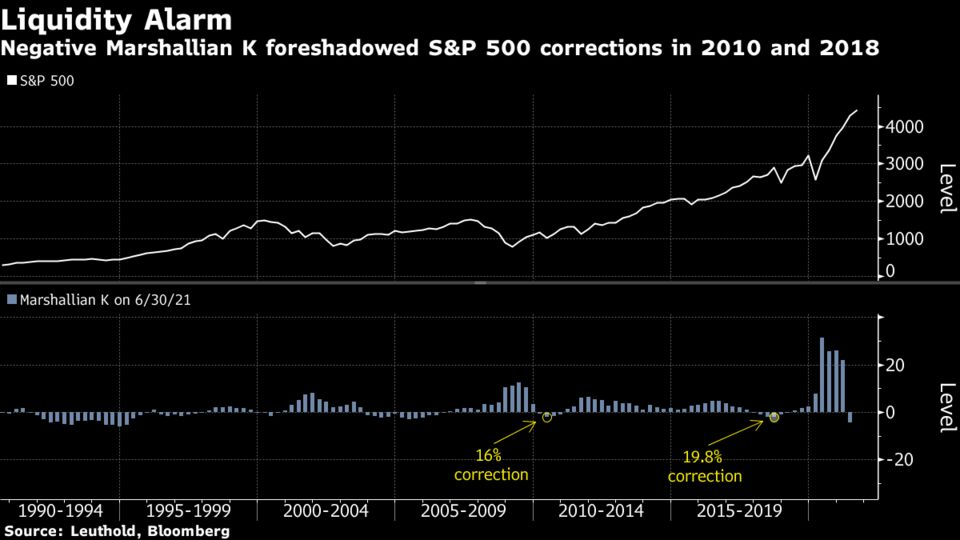
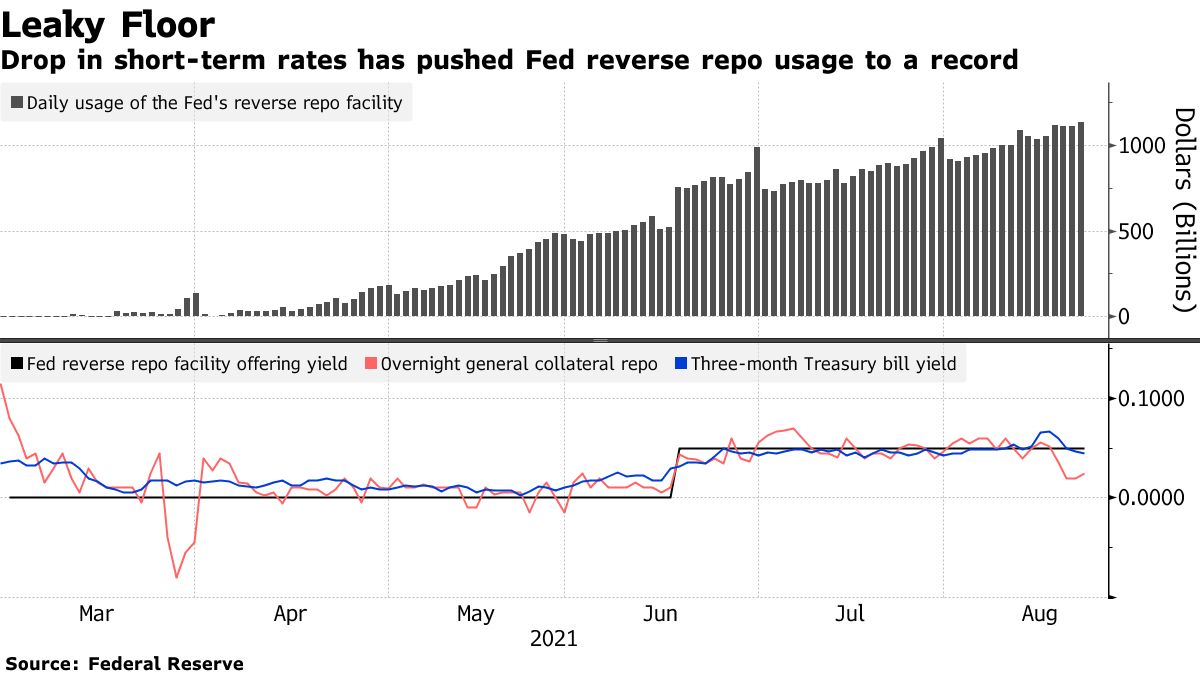
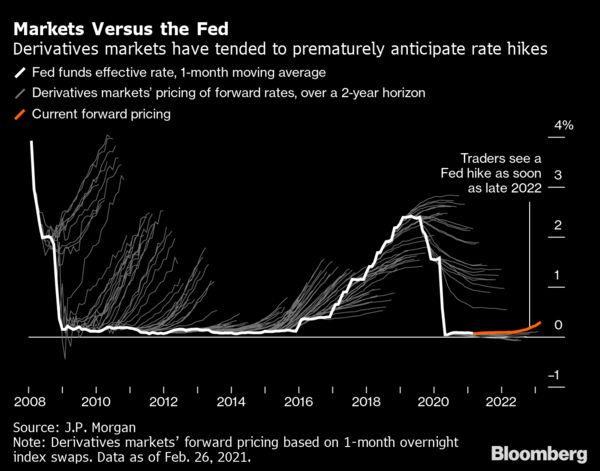
That leads to the question: what effects will a taper and the eventual reduction in the Federal Reserve’s balance sheet – a removal of liquidity – have?
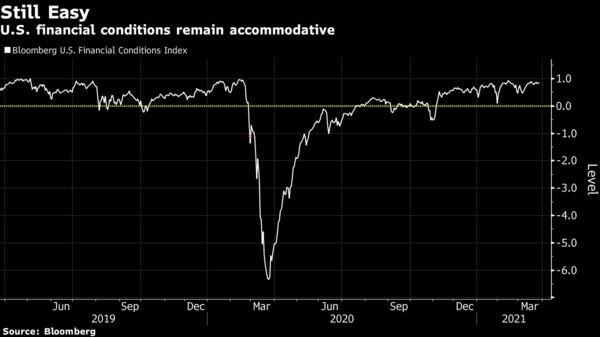
Thus far, given monetary frameworks and max liquidity, markets rallies have been enforced by some of the processes embedded within the volatility market.
To quote Cem Karsan of Kai Volatility: “There’s this constant structural positioning that naturally drives markets higher as long as volatility is compressed, or there’s a supply of volatility.”
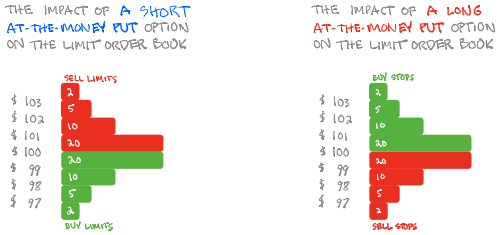
“As volatility is compressed, … the hedging vanna and charm flows, and whatnot will push the markets higher,” Karsan added in reference to options sliding down their term structure (vanna) and skew decaying (charm). Both dynamics have counterparties covering their hedges to the most dominant customer positioning in the market (i.e., short call, long put).
With option volumes now comparable to stock volumes, related hedging flows can represent an increased share of volume in underlying stocks; “It’s not a coincidence that the mid-February to mid-March 2020 downturn literally started the day after February expiration and ended the day of March quarterly expiration. These derivatives are incredibly embedded in how the tail reacts and there’s not enough liquidity, given the leverage, if the Fed were to taper.”
Learn more about the implications of convexity, edge, and risk management, as well as Liquidity Cascades: The Coordinated Risk of Uncoordinated Market Participants.
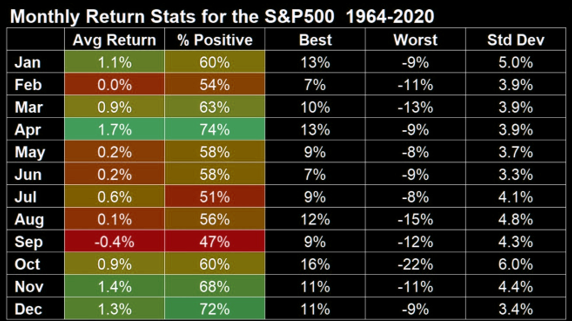
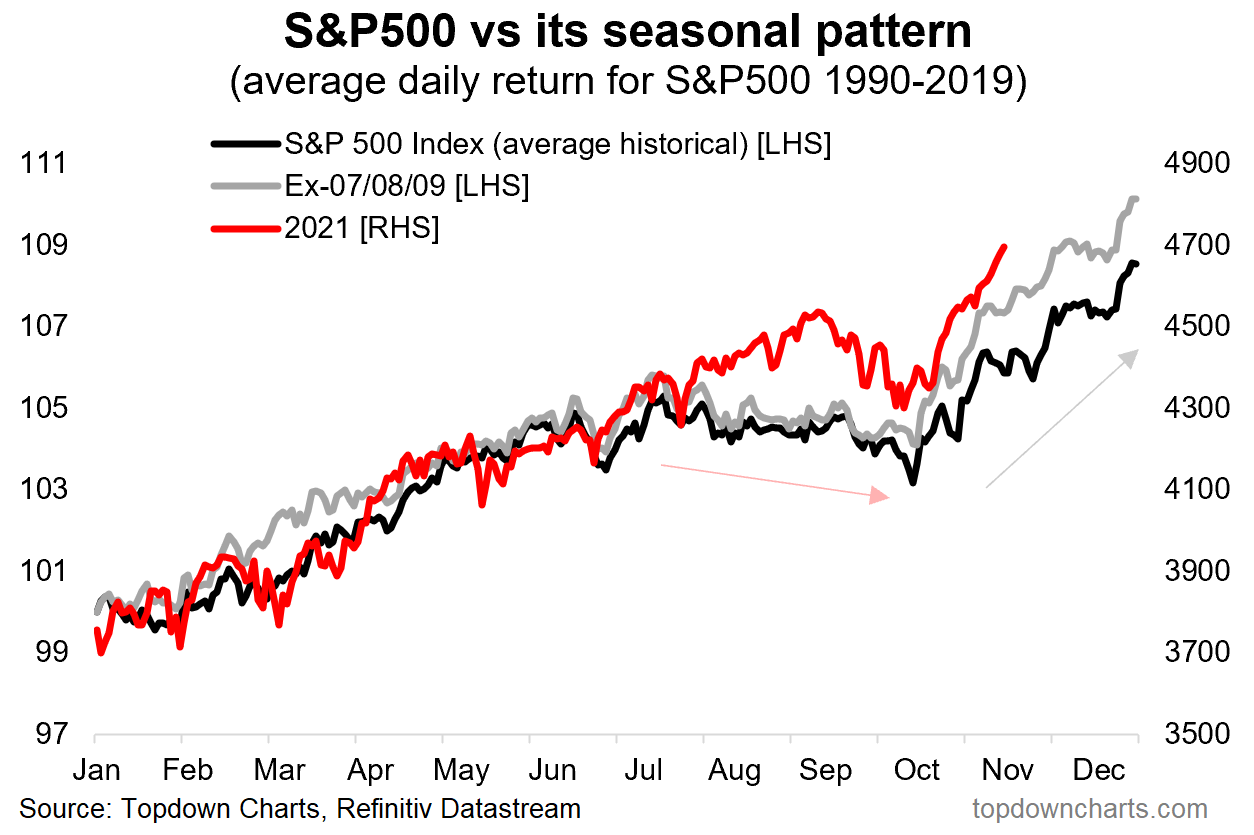
Aside from a lot of these big picture dynamics – growing derivatives markets and tail risk, the heightened moneyness of nonmonetary assets, trends in seasonality, earnings surprises, and more – we have some more impactful near-term happenings to be aware of.
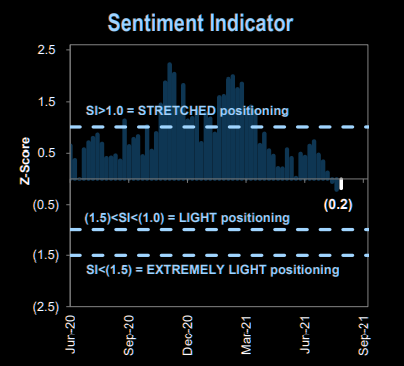
The first is fragile positioning. The second is the monthly options expiration (OPEX).
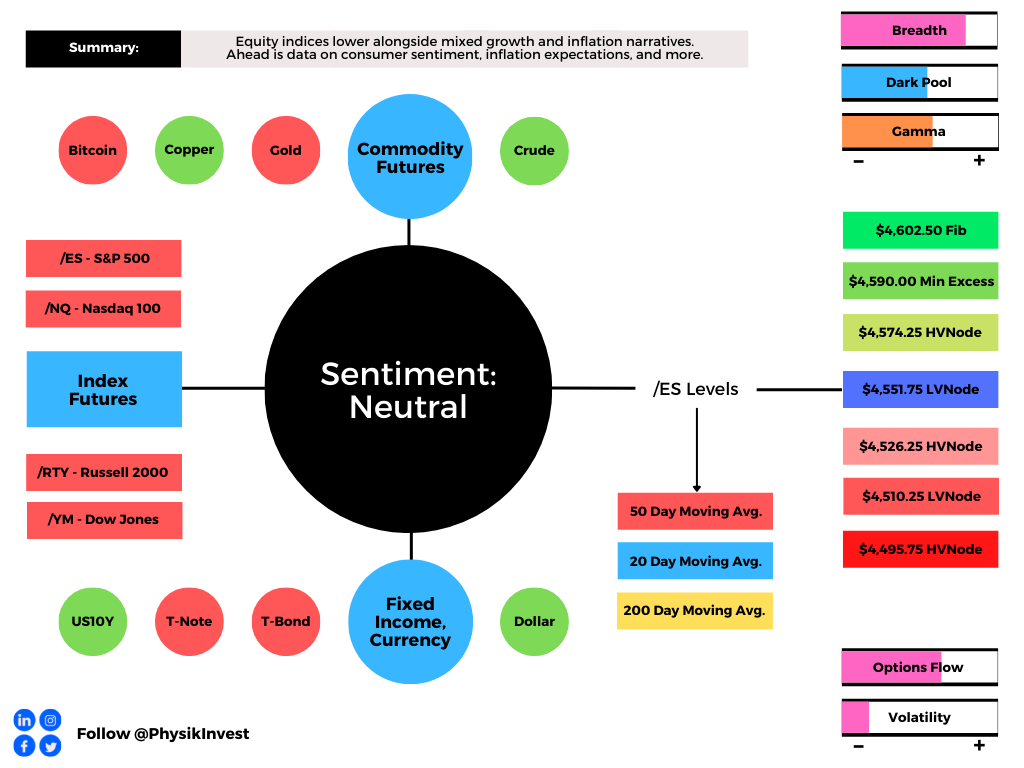
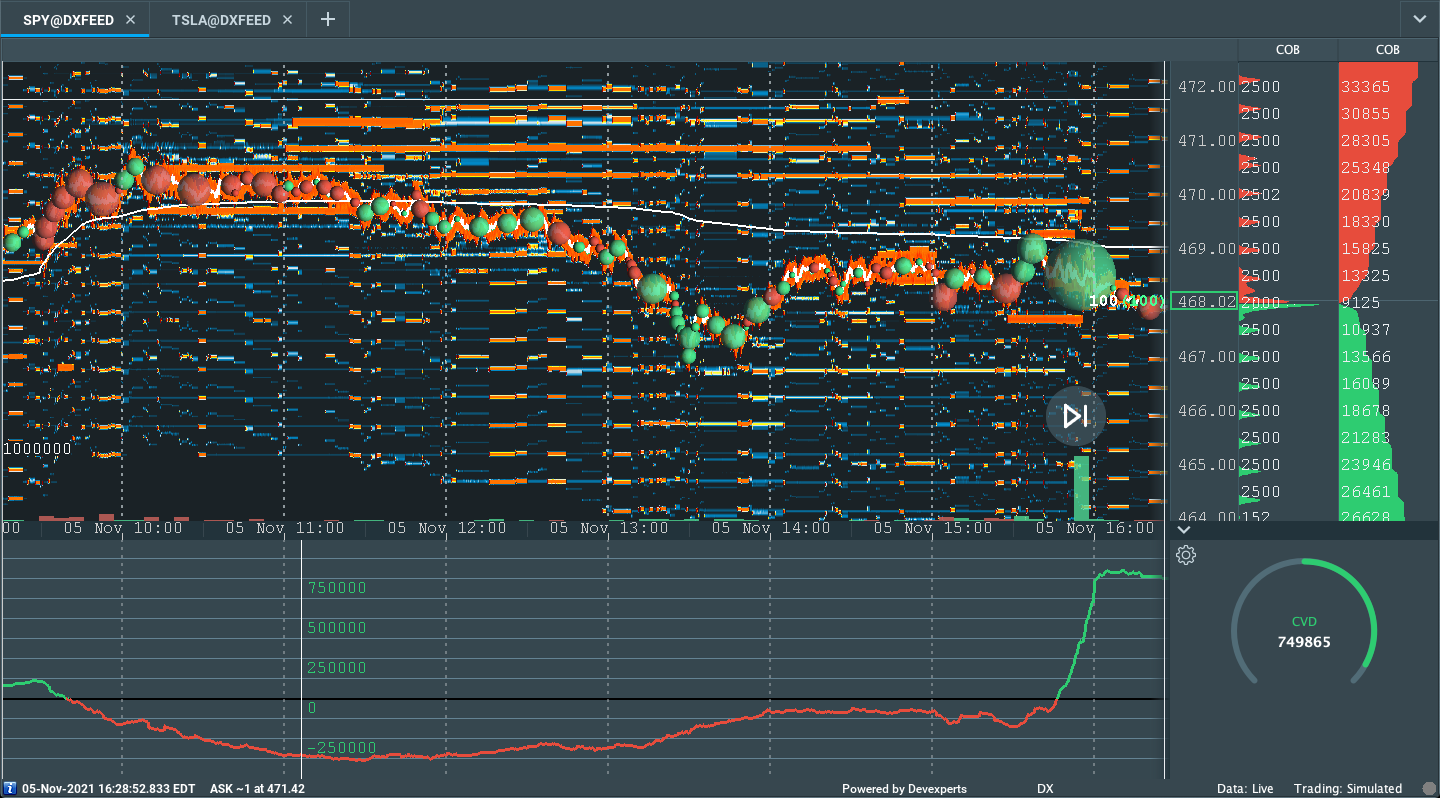
According to SqueezeMetrics analyses, “middling dark pool sentiment and middling gamma exposure [portends] … 1-month negative returns.”
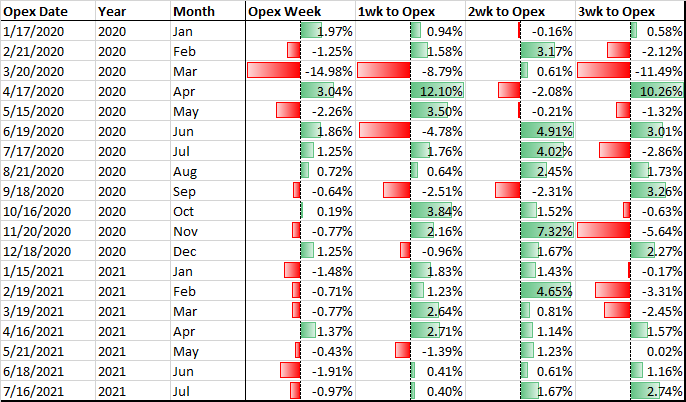
Alongside that, according to data compiled and analyzed by Pat Hennessy, “2 weeks prior to OPEX (e.g., 7/30/21 to 8/6/21 in this late-cycle) [have] been extremely bullish,” while “OPEX week returns peaked in 2016 and have trended lower since.”
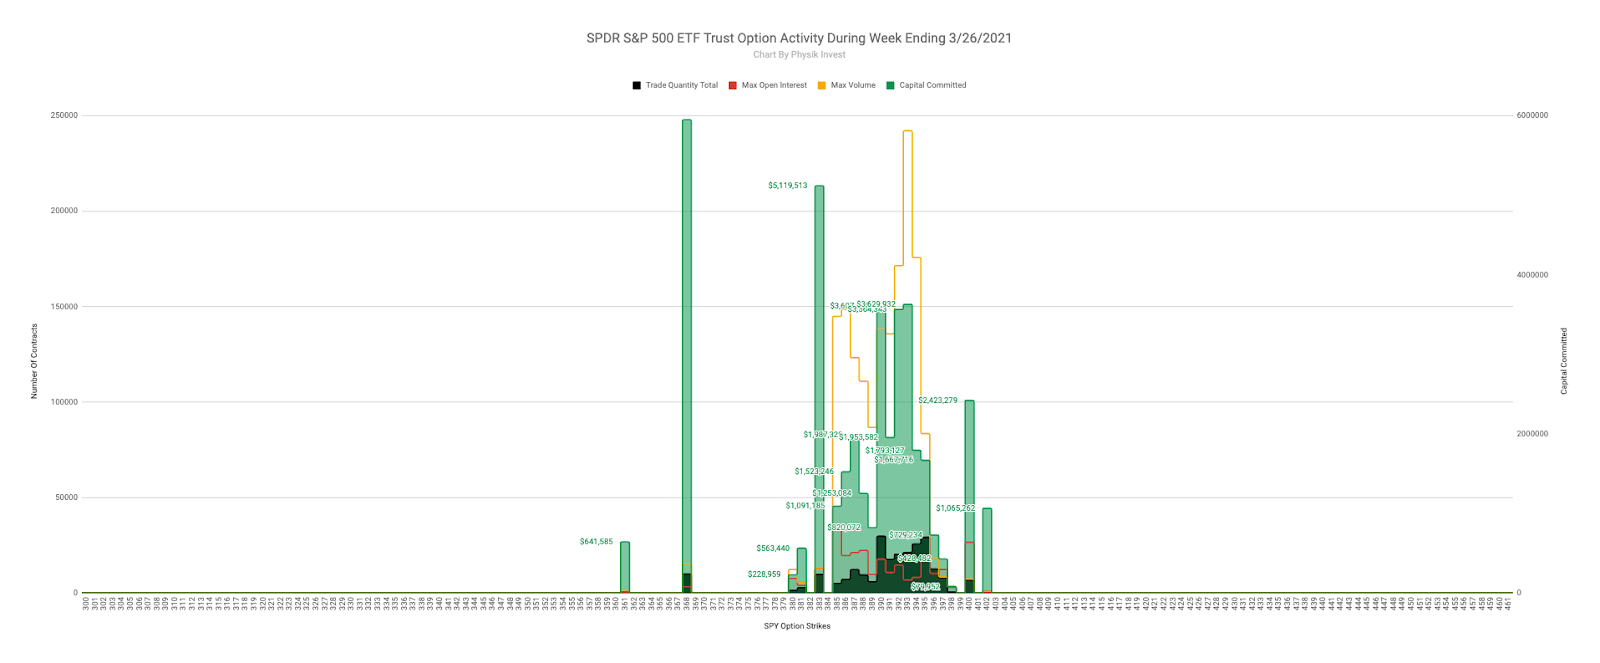
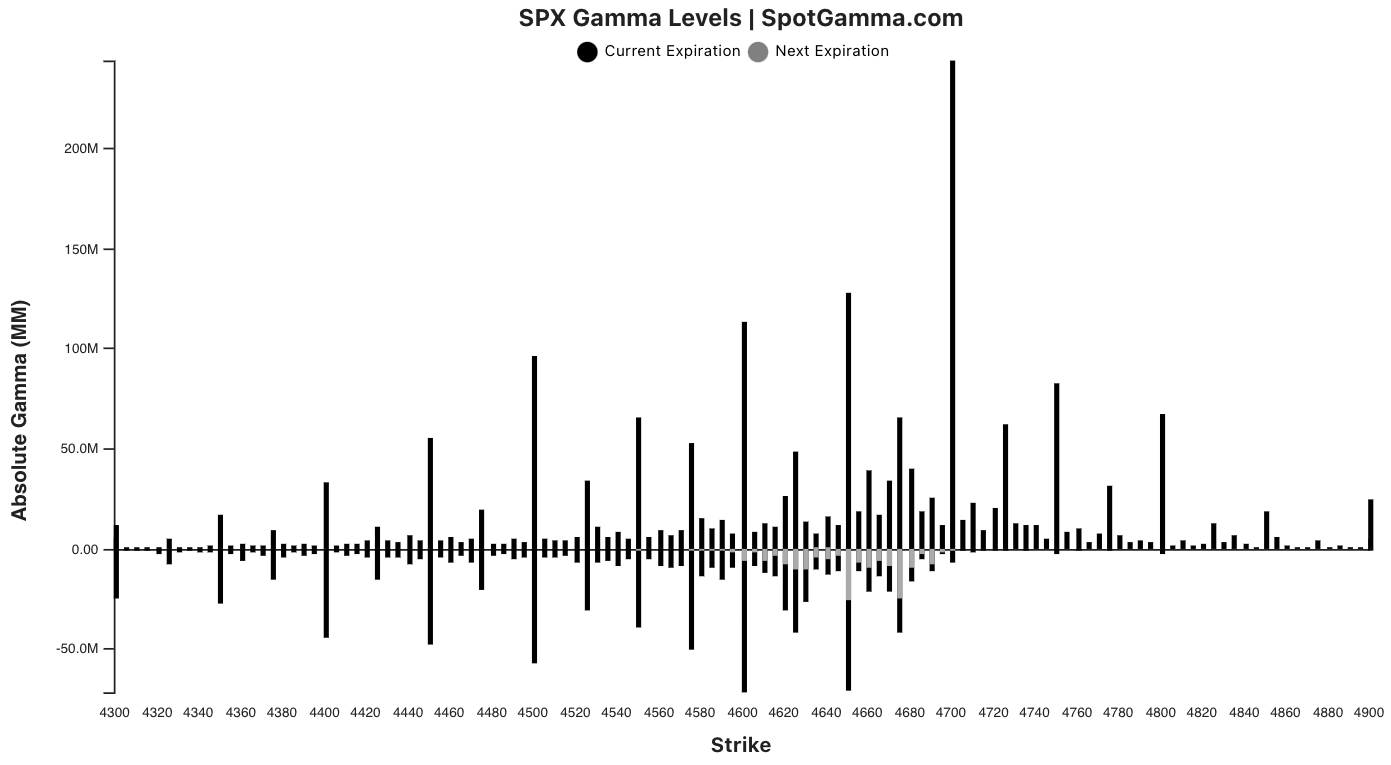
This comes as investors marked the S&P 500 up to the $4,700.00 strike, at which positive gamma – delta sensitivity to underlying price – is highest.
In referencing a note I wrote for SpotGamma, “as volatility continues to decline, the gamma of those options, which are now at the money, ought to increase, forcing counterparties to supply more liquidity.”
Ultimately, $4,700.00 ought to be a magnet (or resistance) into that aforementioned pre-OPEX weakness.
This is unless (1) volatility declines markedly, “a tailwind for the S&P complex as options slid[ing] down their term structure would cause dealers to continue covering their hedges in an asymmetric manner,” or (2) more capital is committed to options at higher strikes.
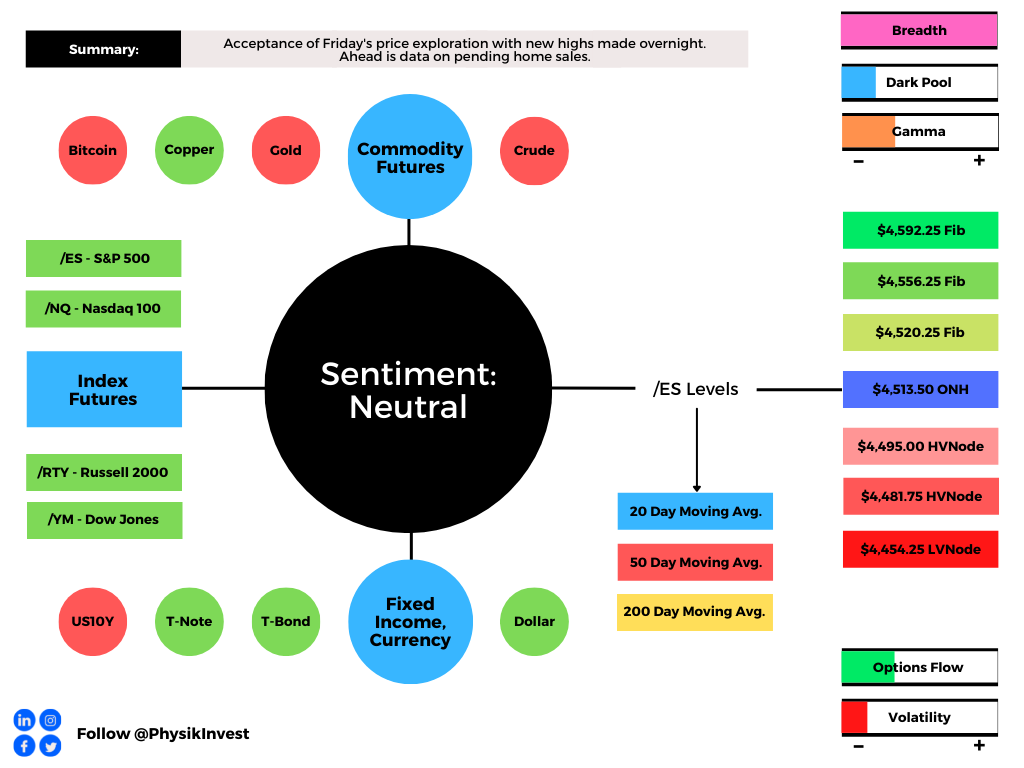
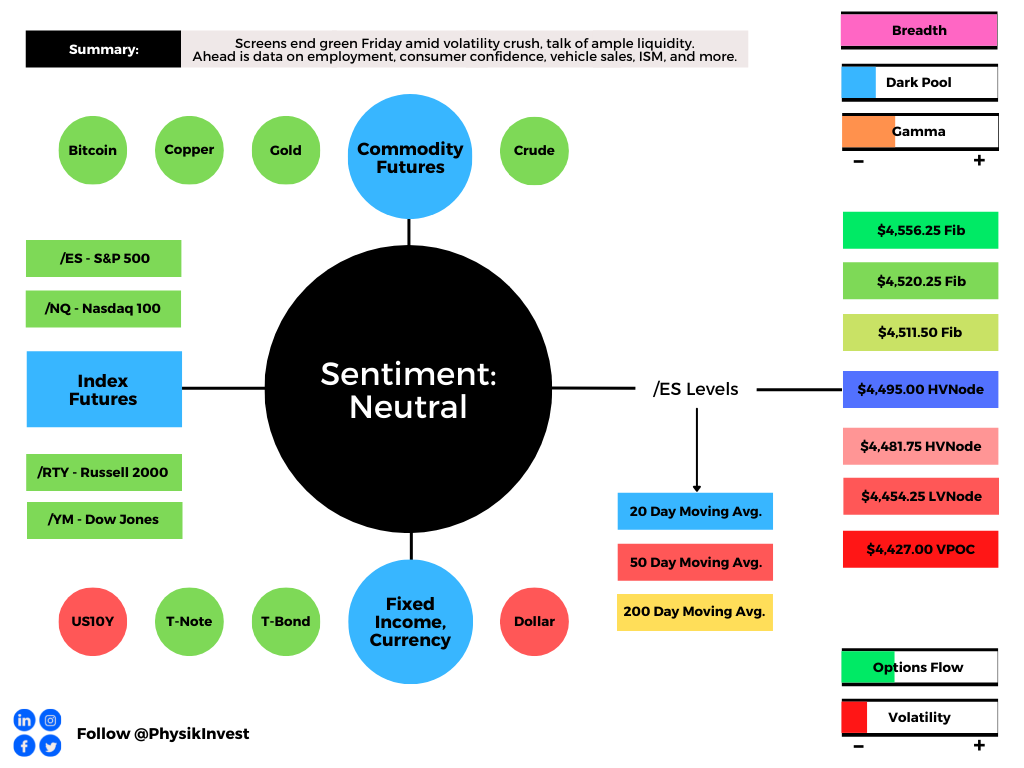
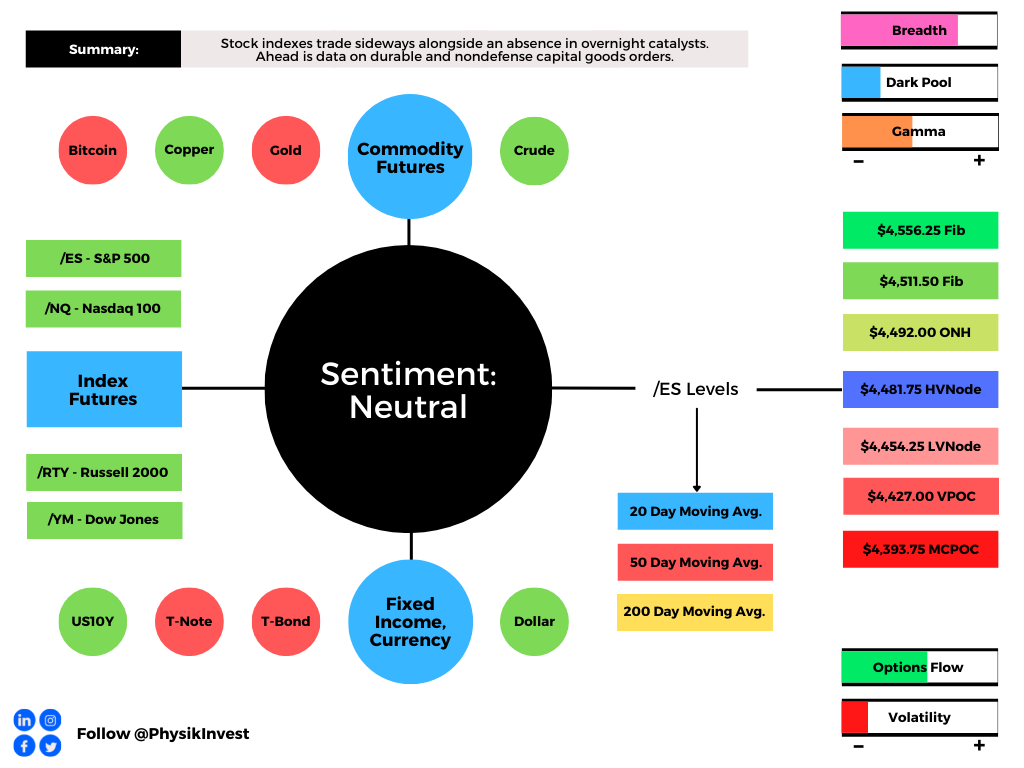
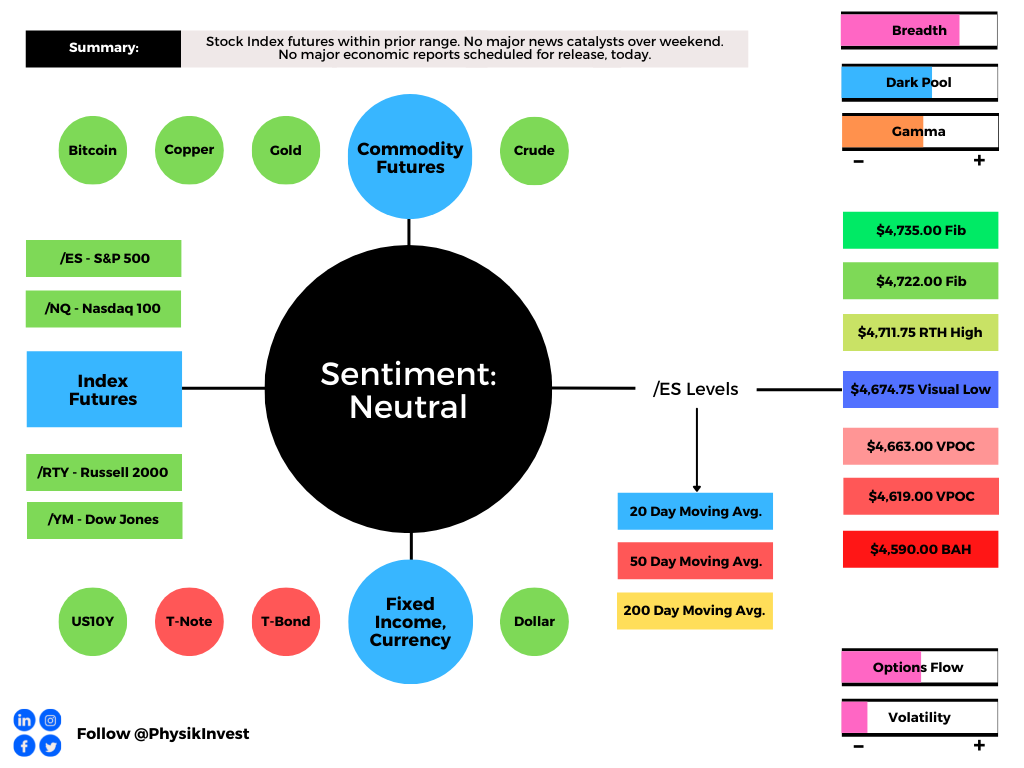
Expectations: As of 6:30 AM ET, Monday’s regular session (9:30 AM – 4:00 PM ET), in the S&P 500, will likely open in the upper part of a positively skewed overnight inventory, inside of prior-range and -value, suggesting a limited potential for immediate directional opportunity.
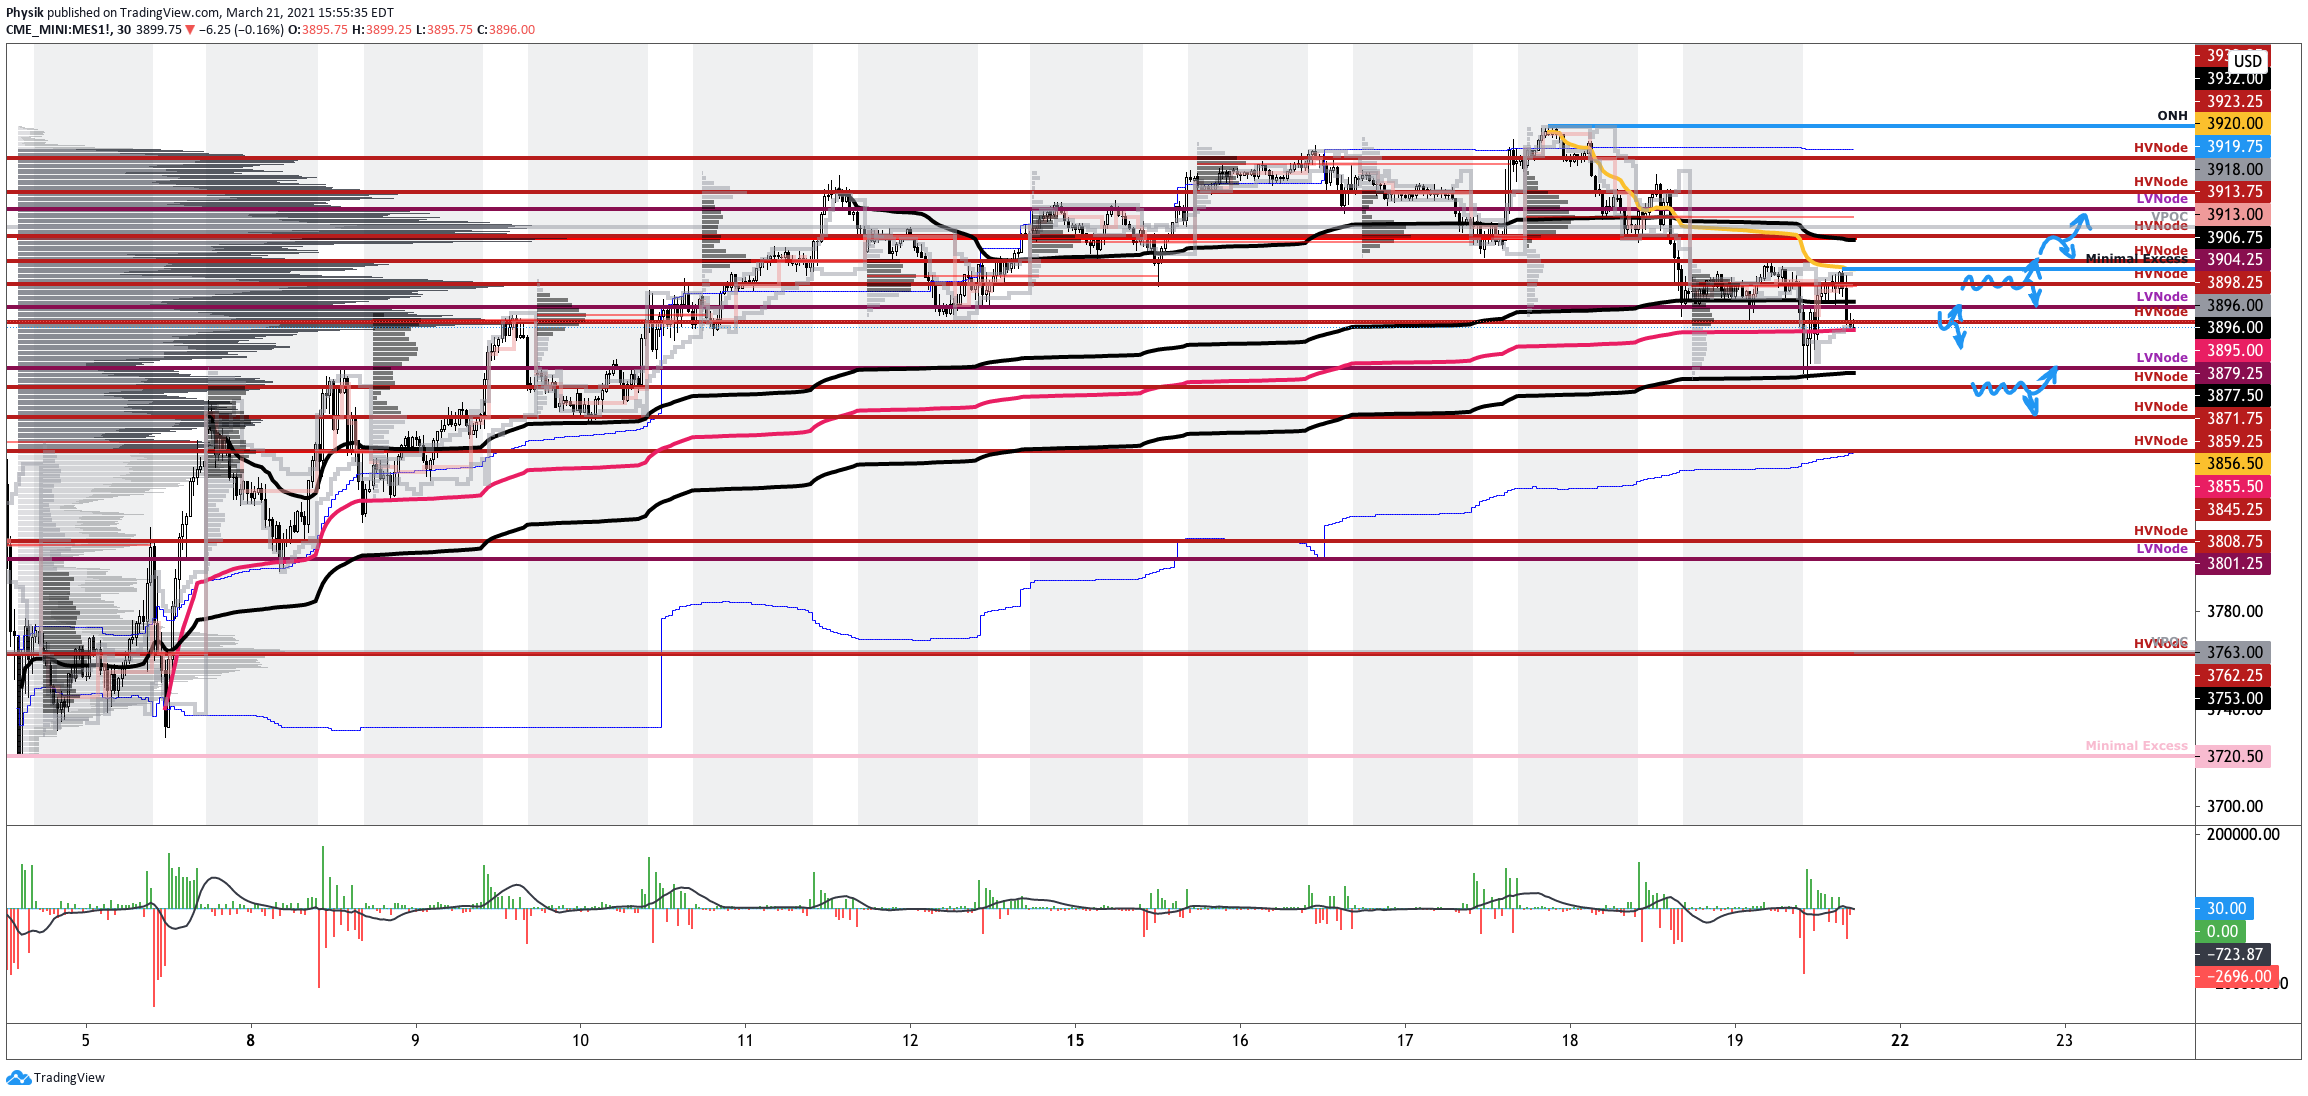
Market Is In Balance: Current prices offer favorable entry and exit. Modus operandi is responsive trade (i.e., fade the edges), rather than initiative trade (i.e., play the break).
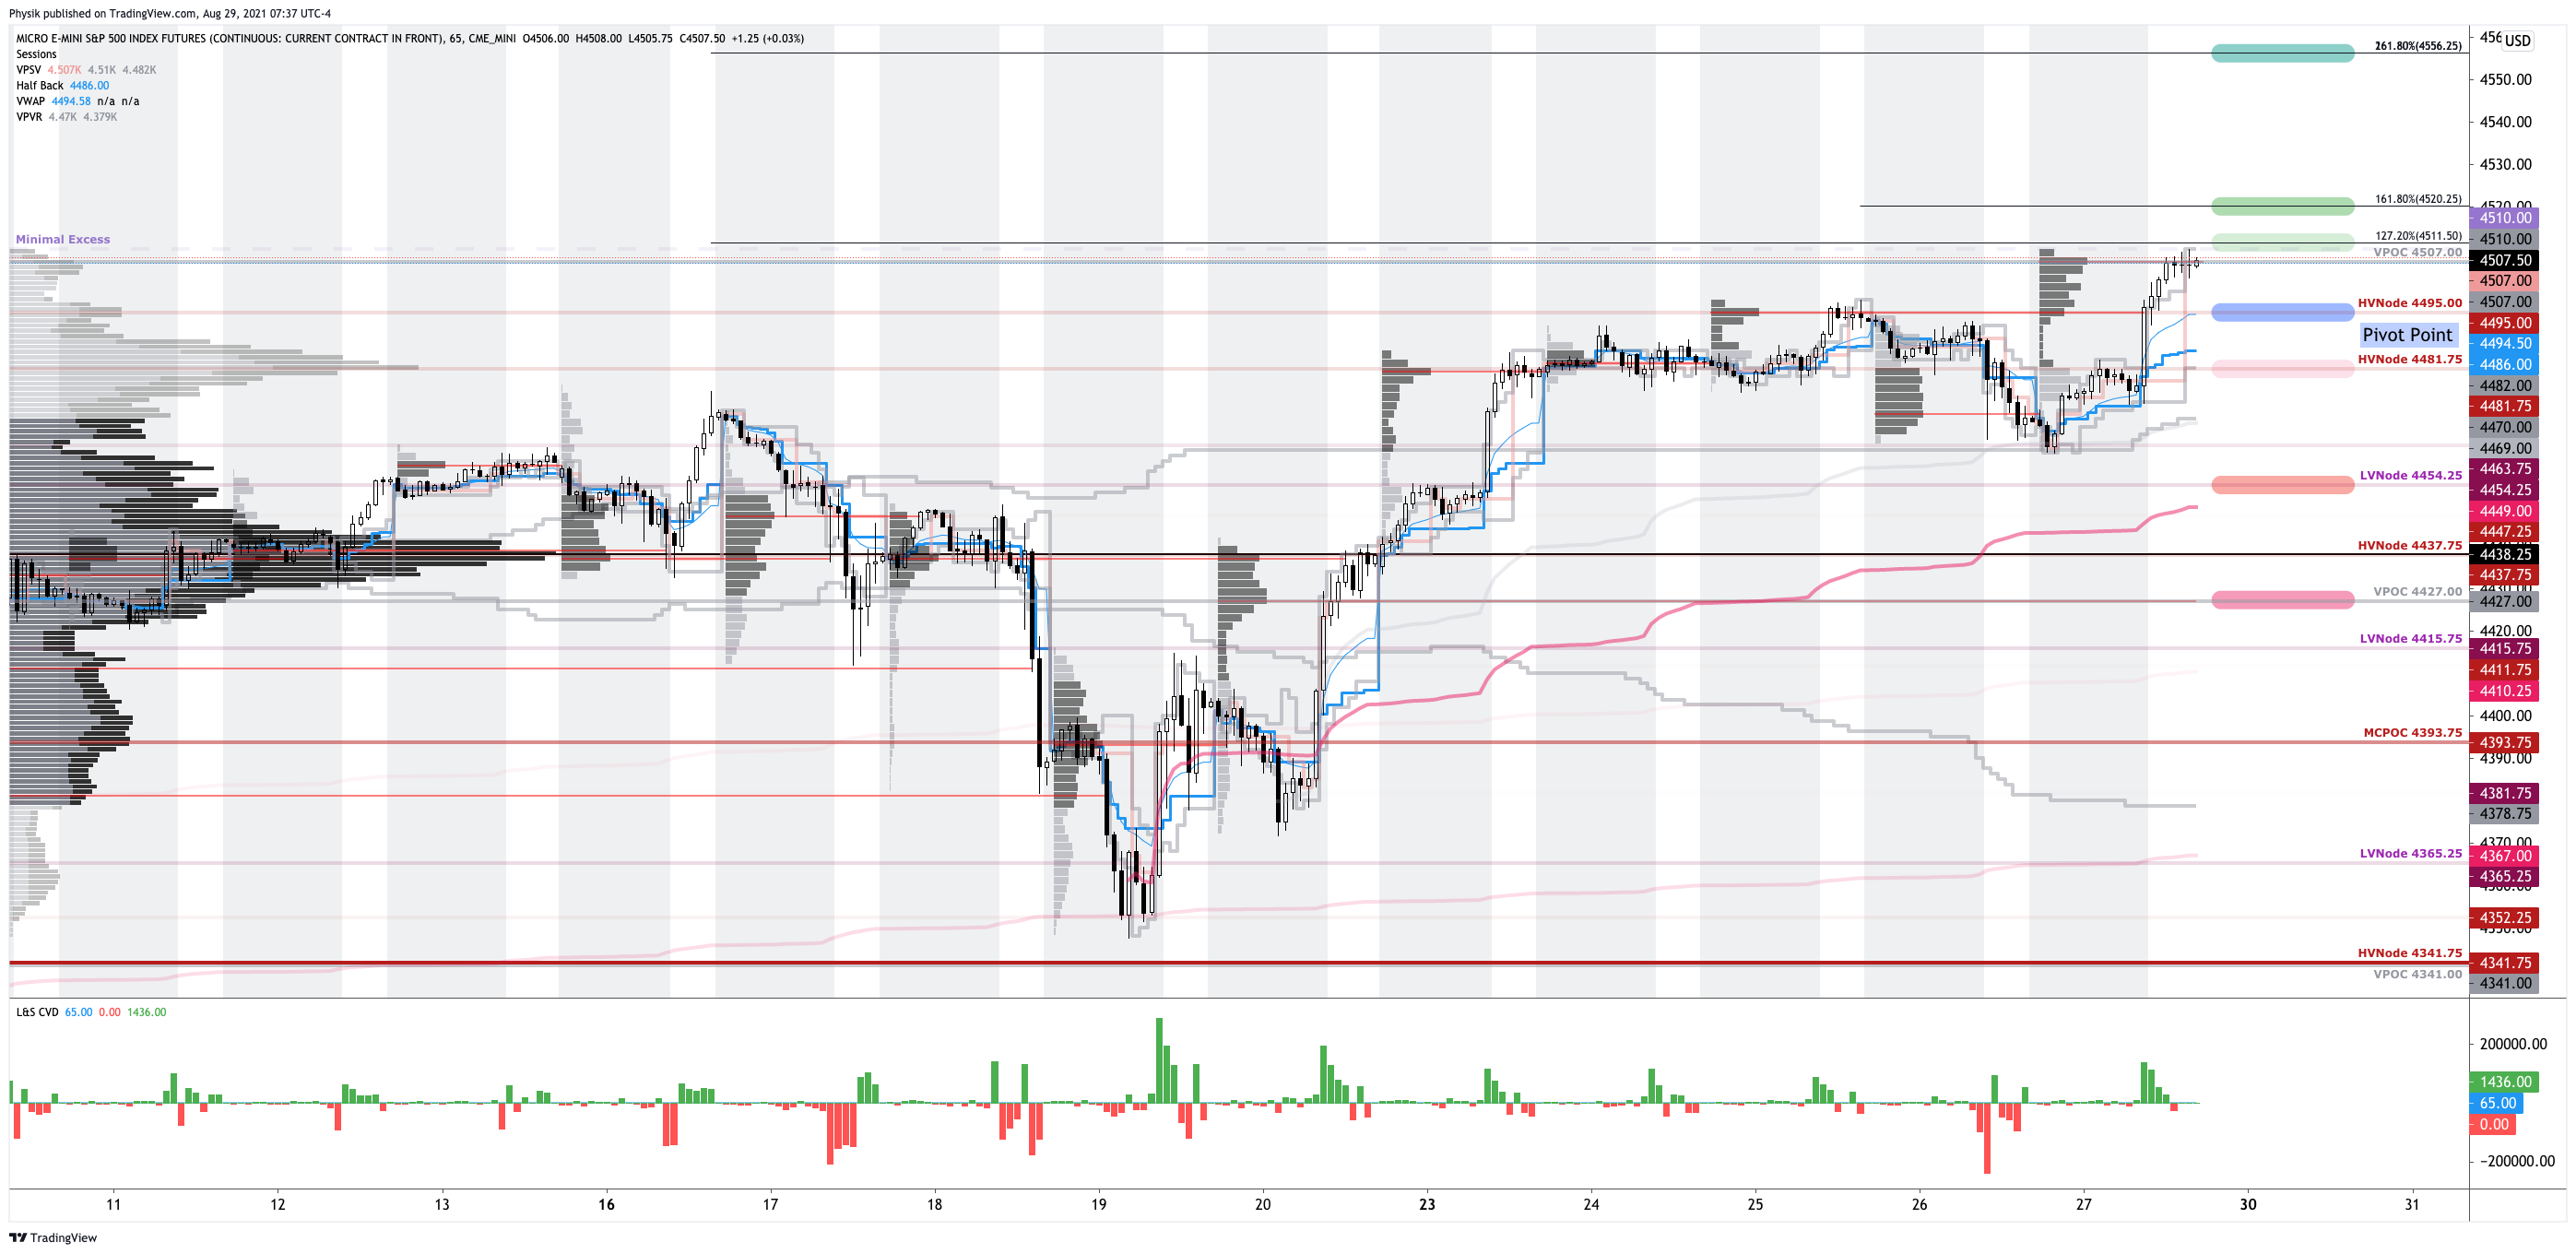
In the best case, the S&P 500 trades sideways or higher; activity above the $4,674.75 visual low (likely paid attention to by short-term, technically driven market participants who seldom defend retests) puts in play the $4,711.75 regular trade high (RTH High). Initiative trade beyond the RTH High could reach as high as the $4,722.00 and $4,735.00 Fibonacci, or higher.
In the worst case, the S&P 500 trades lower; activity below the $4,674.75 visual low puts in play the $4,663.00 untested point of control (VPOC). Initiative trade beyond the VPOC could reach as low as the $4,619.00 VPOC and $4,590.00 balance area boundary (BAH), or lower.
As an aside, the $4,674.75 visual low corresponds with the volume-weighted average price (VWAP) anchored at last week’s Federal Open Market Committee (FOMC) meeting.
This is a metric highly regarded by chief investment officers, among other participants, for quality of trade. Additionally, liquidity algorithms are benchmarked and programmed to buy and sell around VWAPs.
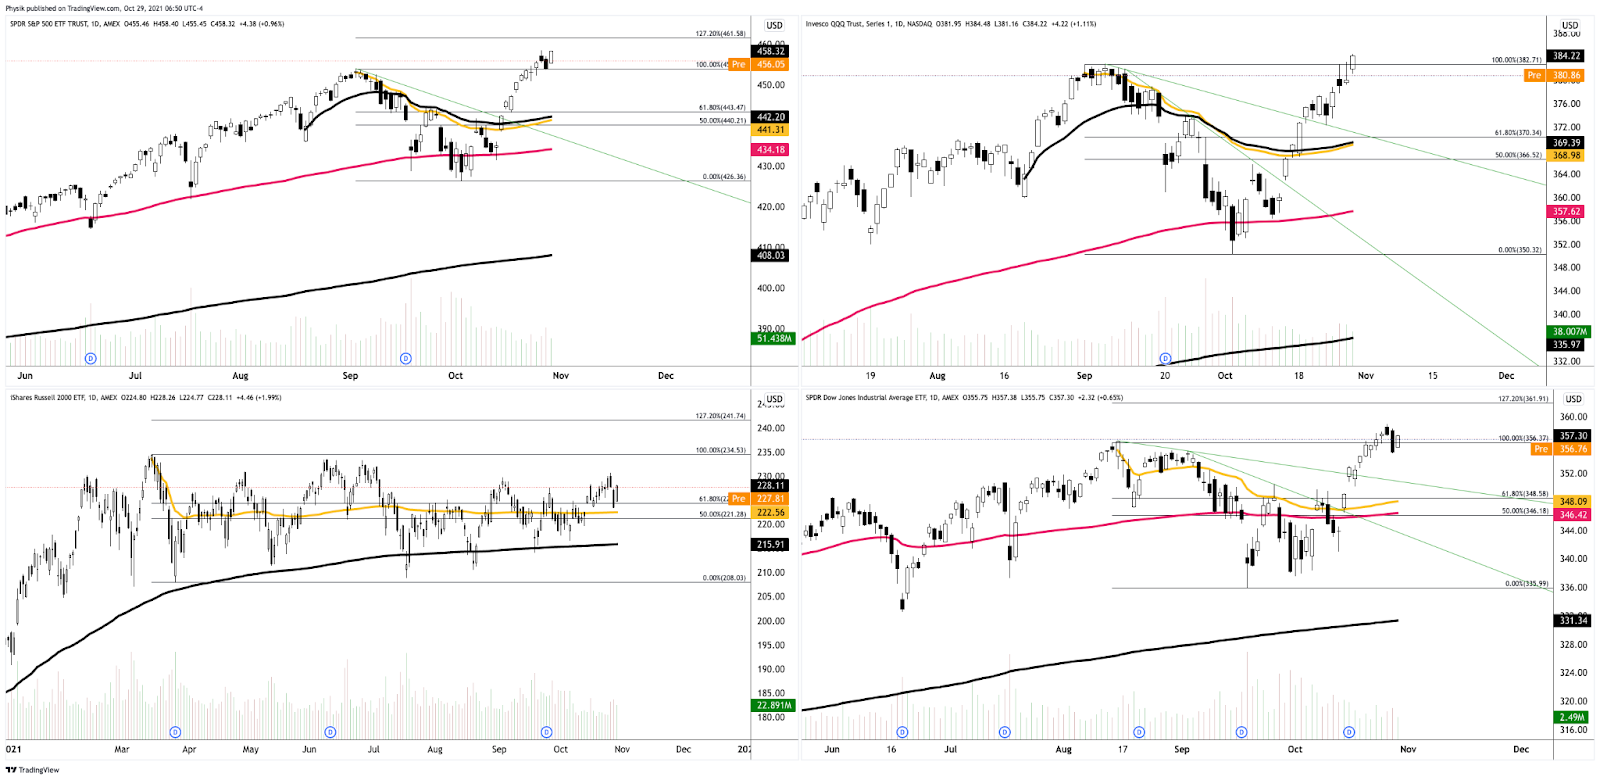
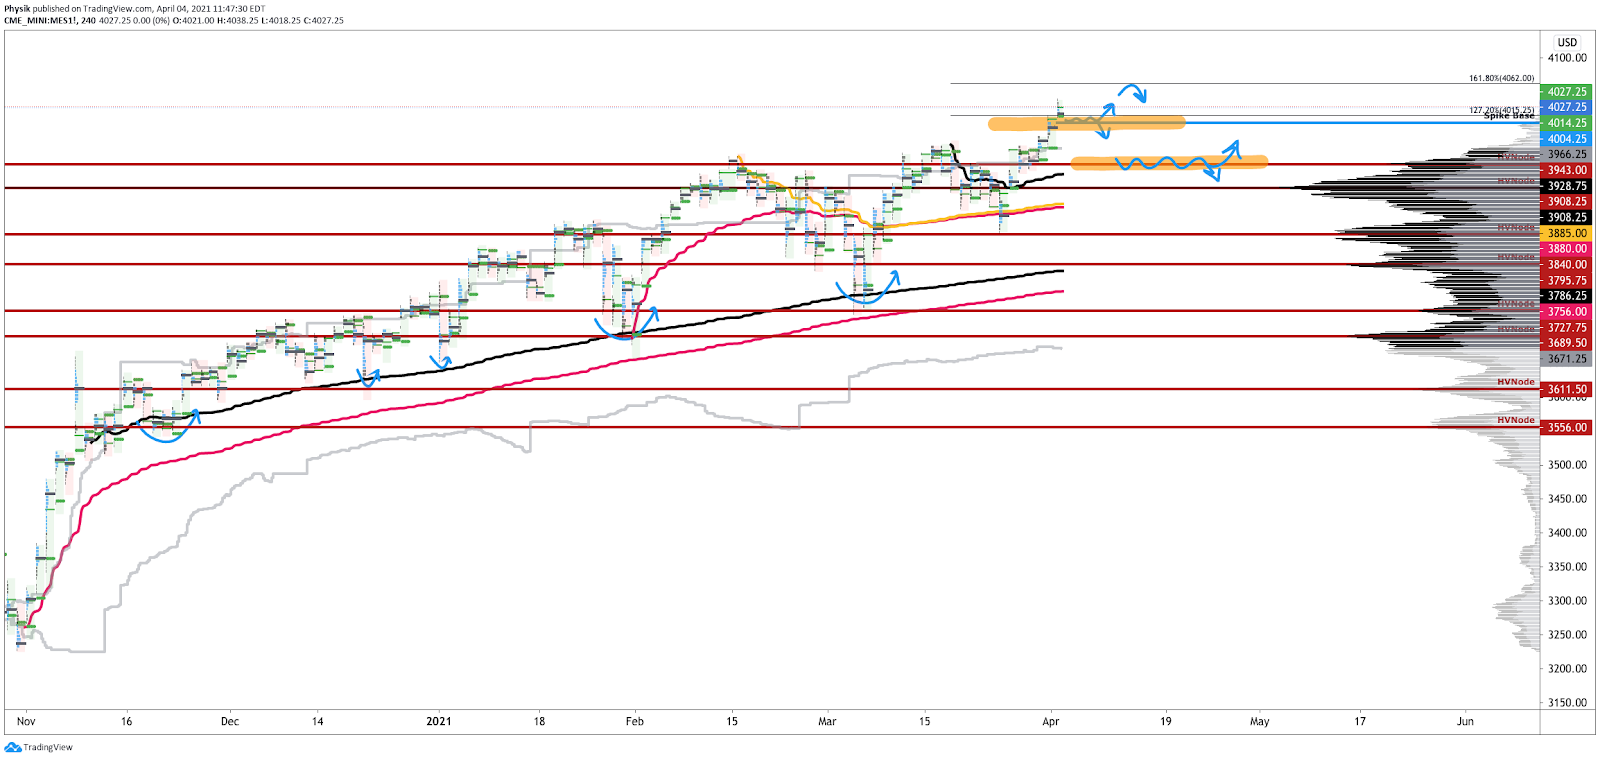
Click here to load today’s updated key levels into the web-based TradingView charting platform. Note that all levels are derived using the 65-minute timeframe. New links are produced, daily.

Definitions
Gamma: Gamma is the sensitivity of an option to changes in the underlying price. Dealers that take the other side of options trades hedge their exposure to risk by buying and selling the underlying. When dealers are short-gamma, they hedge by buying into strength and selling into weakness. When dealers are long-gamma, they hedge by selling into strength and buying into weakness. The former exacerbates volatility. The latter calms volatility.
Vanna: The rate at which the delta of an option changes with respect to volatility.
Charm: The rate at which the delta of an option changes with respect to time.
POCs: POCs are valuable as they denote areas where two-sided trade was most prevalent in a prior day session. Participants will respond to future tests of value as they offer favorable entry and exit.
Options Expiration (OPEX): Traditionally, option expiries mark an end to pinning (i.e, the theory that market makers and institutions short options move stocks to the point where the greatest dollar value of contracts will expire) and the reduction dealer gamma exposure. In recent history, this reset in dealer positioning has been front-run; prior, there was an increase in volatility after the removal of large options positions and associated hedging.
About
After years of self-education, strategy development, and trial-and-error, Renato Leonard Capelj began trading full-time and founded Physik Invest to detail his methods, research, and performance in the markets.
Additionally, Capelj is a Benzinga finance and technology reporter interviewing the likes of Shark Tank’s Kevin O’Leary, JC2 Ventures’ John Chambers, and ARK Invest’s Catherine Wood, as well as a SpotGamma contributor, developing insights around impactful options market dynamics.
Disclaimer
At this time, Physik Invest does not manage outside capital and is not licensed. In no way should the materials herein be construed as advice. Derivatives carry a substantial risk of loss. All content is for informational purposes only.