
Key Takeaways:
- March dips prior to bullishness.
- Bears threw towel. Crash now?
- Protect when you can afford to.
- A heightened risk of corrections.
- Bond traders are terrible timers.
- Reflation to support a recovery.
What Happened: U.S. stock index futures closed higher, last week.
What Does It Mean: In the face of stretched sentiment and positioning — a heightened appetite for risk — investors shifted their focus from the risks of rapidly rising inflation to the increasing pace of COVID-19 coronavirus vaccinations and a rebound in economic activity.
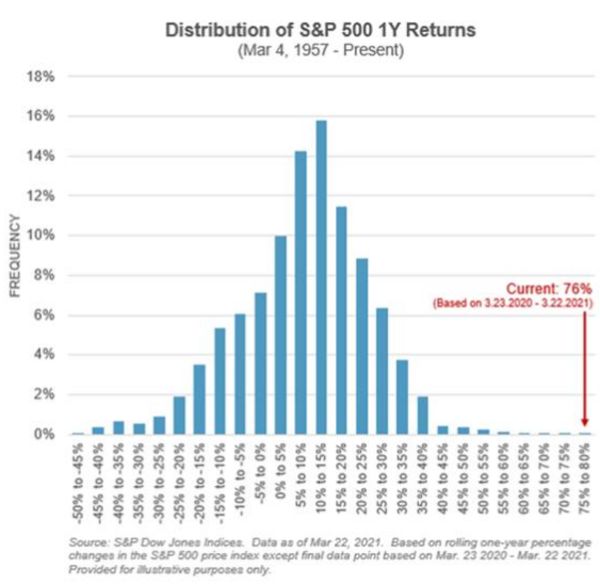
This comes after an outlier 2020; the distribution of S&P 500 1-year returns was ‘unexpected,’ sitting in the far end of the right tail.
Adding, according to S&P Global Ratings, concerns over inflation appear “overblown and [] orderly reflation, around a return to sustainable growth, is a healthy development for both macro and credit outcomes.”
This notion is further validated by history; according to Bloomberg, “Since 2008, markets have consistently priced in a more aggressive path of Fed rate hikes than what ultimately happened. Consider the situation in late 2008: traders were already bracing for several hikes in the years ahead, according to data crunched by JPMorgan Chase & Co. (NYSE: JPM), but policy makers held off on tightening until 2015.”
Due to this mispricing, traders are behind the curve when the Fed finally hikes. Between 2017, through 2018, traders were scrambling to keep up with the Fed’s seven hikes.
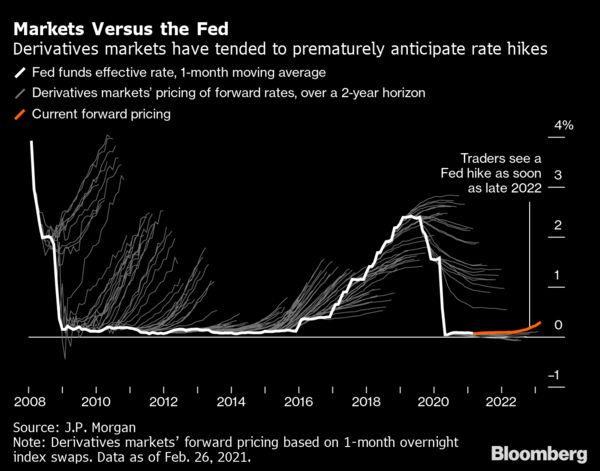
“The market has its pricing and perceptions, and what happens can differ from that and has,” Alex Roever, head of U.S. rates strategy at JPMorgan, told Bloomberg News. The market has been testing the Fed by “trying to push further forward the first hike. But Fed officials don’t seem to be having any of it.”
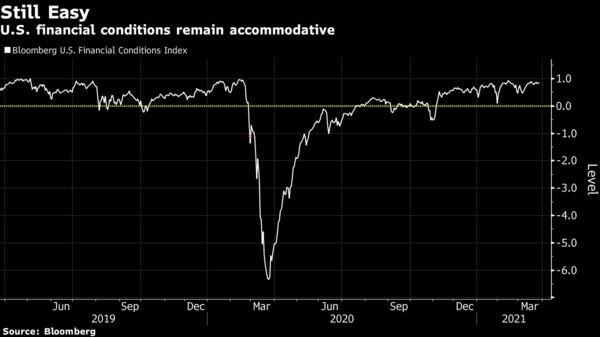
The Fed’s hesitancy to change its stance is warranted; broadly speaking, financial conditions haven’t budged.
Analysts at S&P Global Ratings put it best: “Our bottom line is that orderly reflation is, on balance, a healthy development for macro and credit outcomes. This narrative implies that moderate demand and wage pressures have reemerged after a lost decade and that the interest rate structure has the potential to return to more normal levels. While there will inevitably be some market adjustments as credit is repriced, this will lead to better outcomes.”
A natural evolution — trend in rates toward normalcy — would provide monetary authorities ammunition in another downturn, and price credit in a way that rebalances the natural supply and demand dynamics of the market (i.e., non-productive firms are forced out of business).
What To Expect: Directional resolve.
Why? During prior trade, participants lacked conviction. This is evidenced by a failure, by participants, to introduce excess (e.g., tails or range expansion past historical turning points) in the S&P 500.
More On Excess: A proper end to price discovery; the market travels too far while advertising prices. Responsive, other-timeframe (OTF) participants can aggressively enter the market, leaving tails or gaps which denote unfair prices.
Adding, metrics, like DIX, suggest increased buying pressure. This comes after what appears to have been opportunistic buying or short covering into weakness, and some bearish trades in the cash-settled S&P 500 Index (INDEX: SPX), among other products like Chinese technology stocks and U.S. media companies.
More On DIX: For every buyer is a seller (usually a market maker). Using DIX — which is derived from short sales (i.e., liquidity provision on the market making side) — we can measure buying pressure.
What To Do: In the coming sessions, participants will want to pay attention to where the S&P 500 trades in relation to Friday’s end-of-day spike higher, which was likely the result of hedging.
More On Spikes: Spike’s mark the beginning of a break from value. Spikes higher (lower) are validated by trade at or above (below) the spike base (i.e., the origin of the spike).
In the best case, the S&P 500 remains above the $3,934.00 spike base, taking out Friday’s minimal excess high. Doing so means that the participants are finding higher prices, above the VWAP anchored from the March 17 rally-high, valuable (i.e., buyers, on average, are in control and winning since the March 17 rally-high).
More On Volume-Weighted Average Prices (VWAPs): A metric highly regarded by chief investment officers, among other participants, for quality of trade. Additionally, liquidity algorithms are benchmarked and programmed to buy and sell around VWAPs.
In case of higher prices, participants can target the $3,978.50 overnight rally-high, as well as the $4,015.25 and $4,062.00 price extensions.
More On Overnight Rally Highs (Lows): Typically, there is a low historical probability associated with overnight rally-highs (lows) ending the upside (downside) discovery process.
Any activity below the VWAP anchored from the $3,978.50 peak may (1) leave the $3,900.00 HVNode as an area of supply, offering initiative sellers favorable entry and responsive buyers favorable exit.
More On Volume Areas: A structurally sound market will build on past areas of high-volume (HVNode). Should the market trend for long periods of time, it will lack sound structure (identified as a low-volume area (LVNode) which denotes directional conviction and ought to offer support on any test).

If participants were to auction and find acceptance into areas of prior low-volume, then future discovery ought to be volatile and quick as participants look to areas of high-volume for favorable entry or exit.
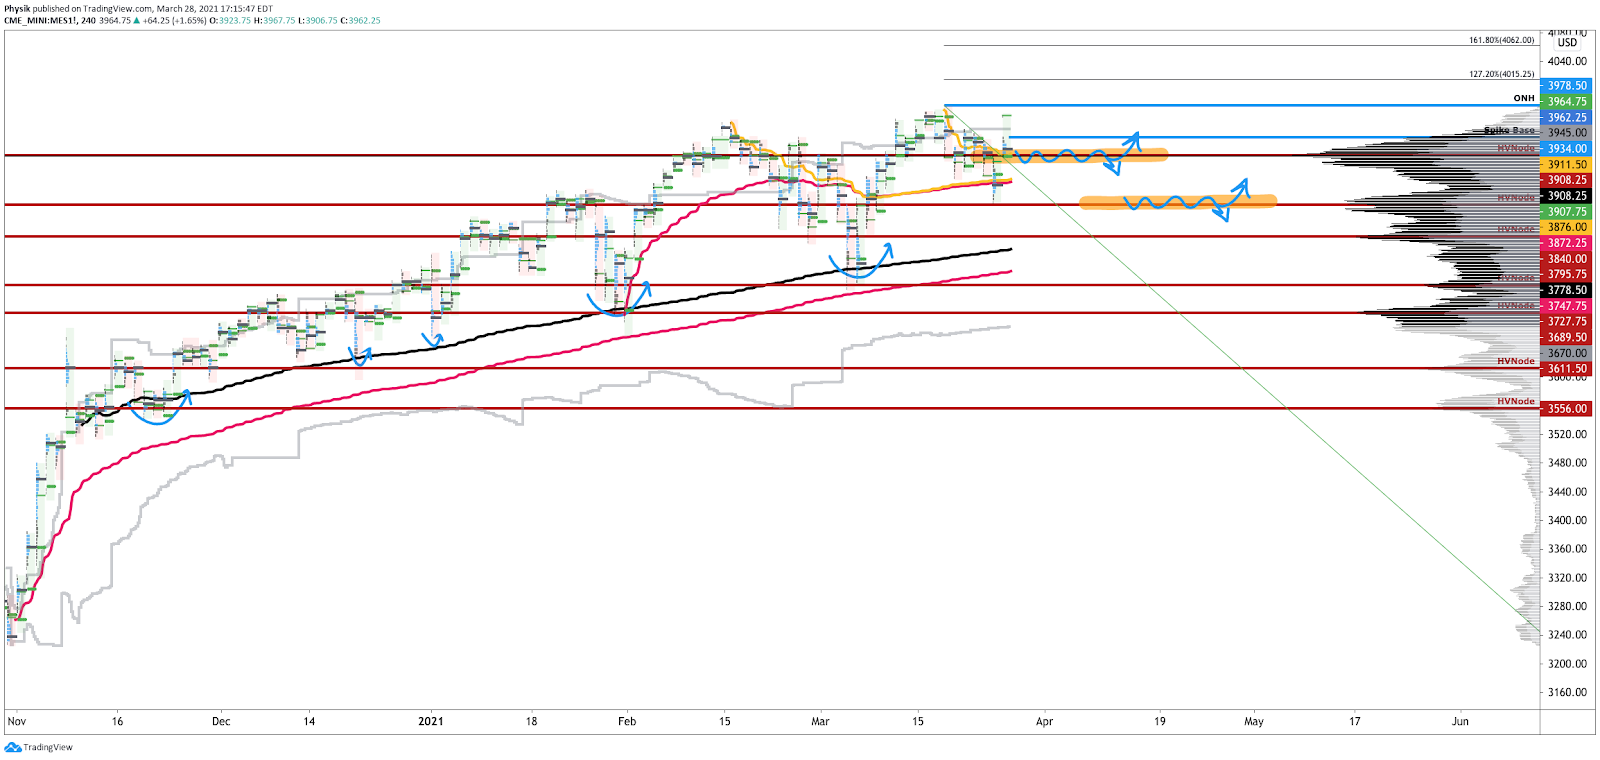
Conclusions: The go/no-go level for next week’s trade is $3,934.00.
Any activity above this level confirms the bullishness of last Friday’s end-of-day spike.
Levels Of Interest: $3,934.00 Spike Base.