What Happened
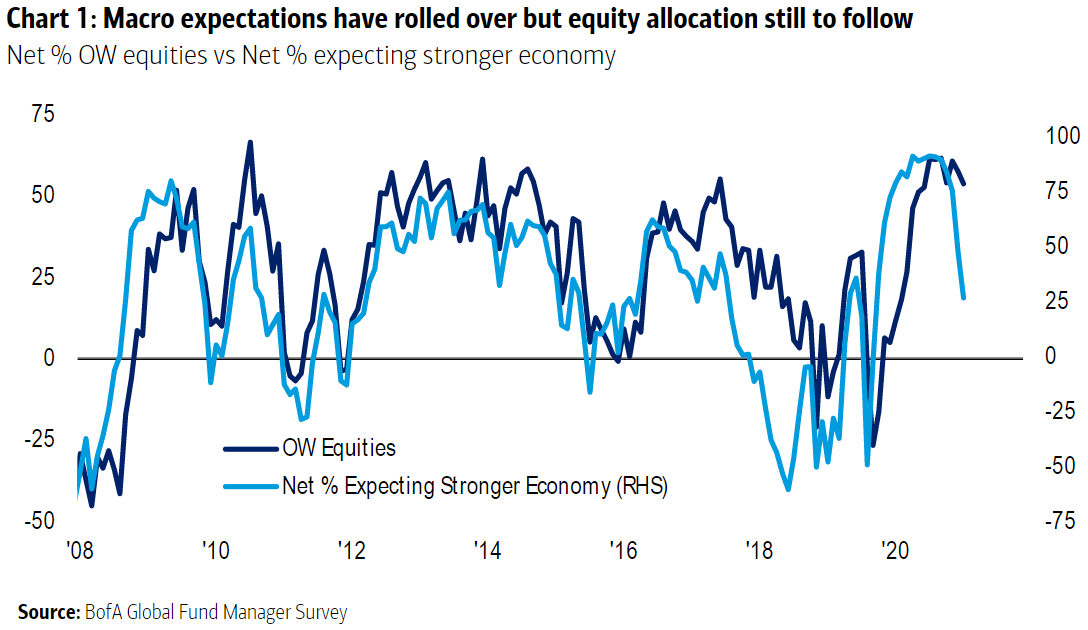
Overnight, equity index futures traded sideways to higher, led by the once-weak Russell 2000.
The shift in relative strength is one obvious change in tone in the face of hawkish news from the Federal Reserve (Fed) and COVID-19 uncertainty.
Ahead is data on ADP employment (8:15 AM ET), Markit manufacturing PMI (9:45 AM ET), ISM manufacturing index, construction spending, as well as testimony by Federal Reserve’s Jerome Powell and Treasury Secretary Janet Yellen (10:00 AM ET).
Later is a release of the Beige Book (2:00 PM ET).
What To Expect
On lackluster breadth and supportive market liquidity metrics, the worst-case outcome occurred, evidenced by an expansion of the S&P 500’s range, as well as increased participation at lower prices, as evidenced by lower value (i.e., the prices at which 70% of the day’s volume occurred).
Though yesterday marked a willingness to continue the trend lower, there are some caveats.
The first of which comes back to simple market profile principles. Value ended on the day overlapping lower. This suggests balance and an unchanged perception of value from Friday.
This dynamic ties into what was discussed yesterday. Given a push-pull environment between the big indices (i.e., strength in Nasdaq 100 versus weakness in Russell 2000), in the face of lackluster breadth and market liquidity metrics, there were increased odds of sideways trade; “participants were likely to base for a directional move in anticipation of new information.”
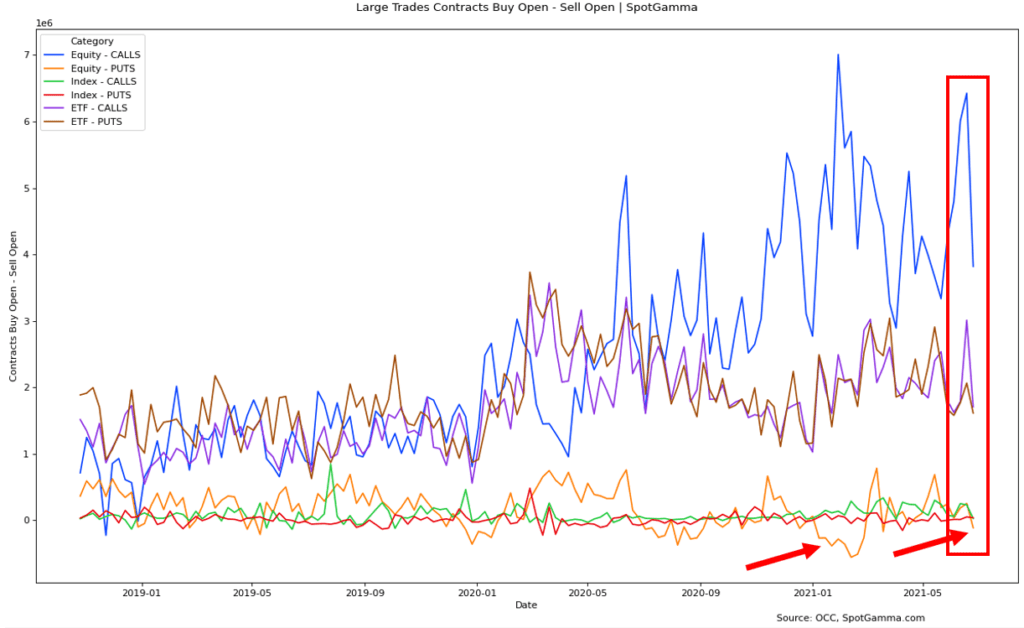
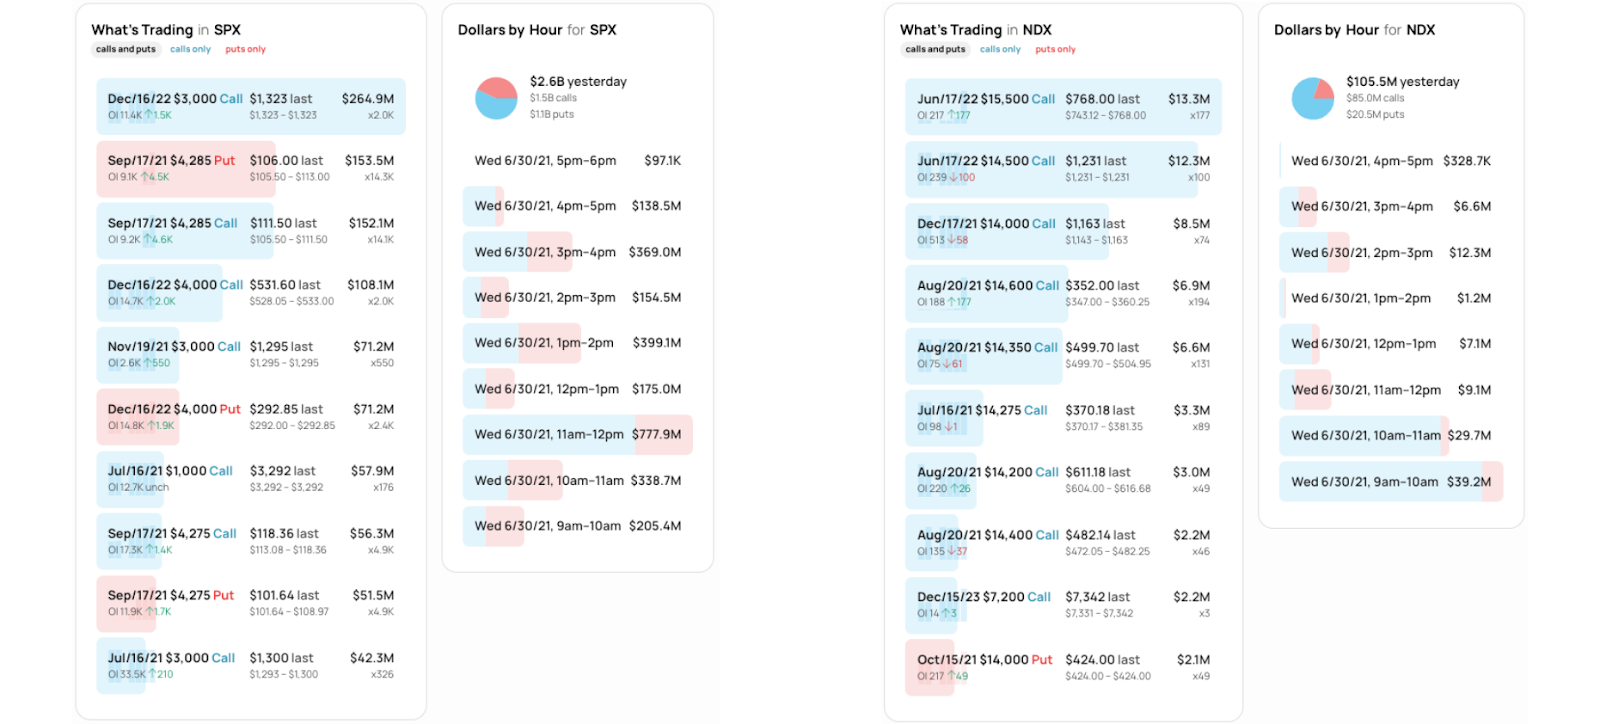
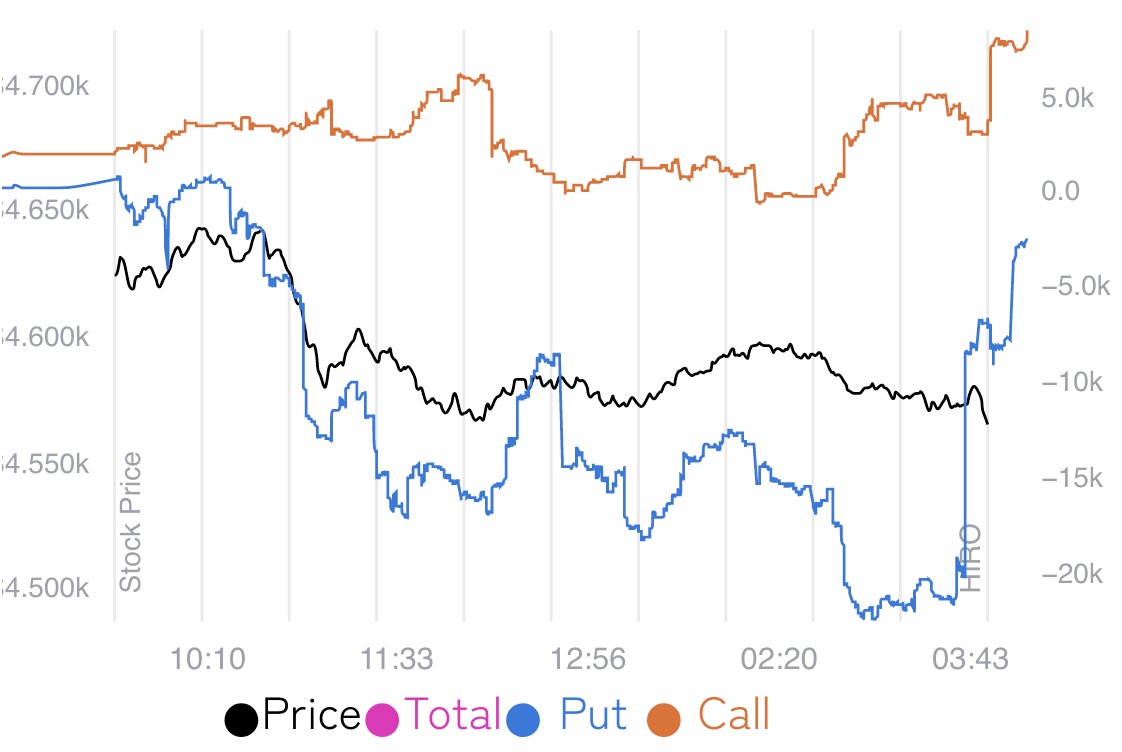
Second, according to SpotGamma, “in the face of a massive -$8bn market-on-close order, dealers likely were covering their hedges to customers’ short-delta options exposure.”
The implications of the latter are staggering. Let’s unpack, below.
Context: The Fed’s Powell changed his tone around inflation, yesterday, becoming more open to a faster taper in bond-buying and rate hikes.
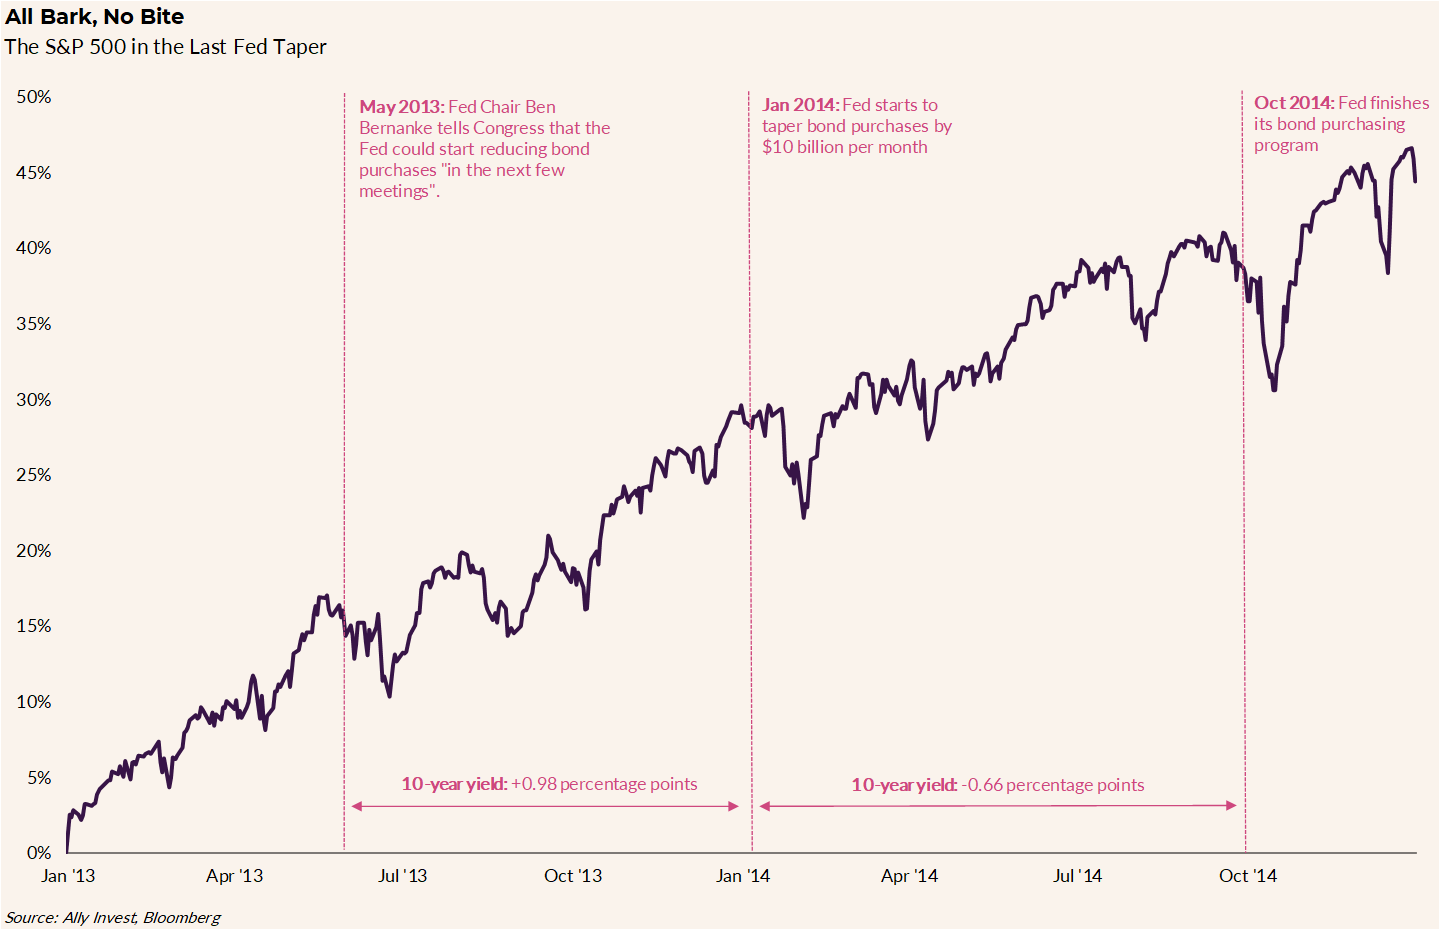
As Bloomberg’s John Authers put it: “This looks like inconsistency, and it also looks to some as if Powell has lost his nerve — just as he did three years ago, when the stock market’s horrified reaction to his statement that the Fed’s balance sheet would be reduced ‘on autopilot,’ meaning ever tighter money, prompted a U-turn. In market lore, the ‘Christmas Eve Massacre’ of a cathartic stock sell-off was followed by the ‘Powell Pivot.’”
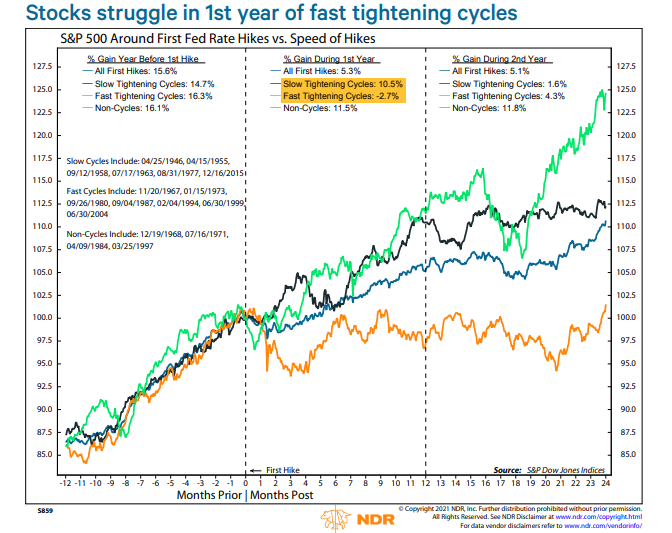
Stocks have recovered markedly, since the news.
At the outset, as we typically see with news, selling appeared knee-jerk; a b-shaped profile distribution suggested long liquidation (i.e., [1] participants who bought the dip, Friday, were unable to gather the financial and/or emotional wherewithal to defend a retest of local lows and [2] capitulation on the part of larger other time frame participants, potentially).
In regards to the latter, if funds were to sell the market, they would do so methodically, into strength, throughout a session.
Couple the aforementioned with a decline in volatility (despite S&P 500 prices reaching lower lows), it’s clear as to why I started off the commentary suggesting an “obvious change in tone.”
Last week, we saw the market enter into a destabilizing environment characterized by counterparties to options trades selling into weakness and buying into strength.
Note: Options are so important. Volatility is a growing asset class. Its implications can’t be discounted (e.g., index pinned in the face of single-stock volatility and declining correlations).
After a brief exit from that environment, on Tuesday the market made another attempt lower. With options activity most concentrated in shorter-dated tenors where the sensitivity of options to direction is higher, then the expectation was that we would realize more volatility.
That happened.
However, volatility, despite spiking, failed to breach Friday levels; in such a case, the short-dated, out-of-the-money protection participants were initially demanding bled.
Given decreased exposure to risk, at least for those participants (e.g., dealers) warehousing this risk, associated hedging flows (i.e., the buy-back of short stock/futures hedges) came onto the market.
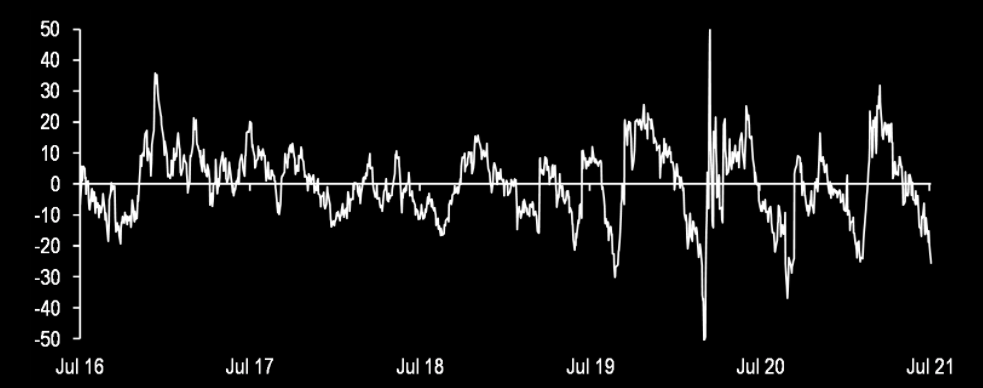
This is clearly visualized by SpotGamma’s HIRO indicator, above.
In conclusion, should participants continue to markdown volatility, as well as commit more capital to the call side, fears will have been assuaged.
In such a case, the odds of a seasonally-aligned rally, into Christmas, are supported.
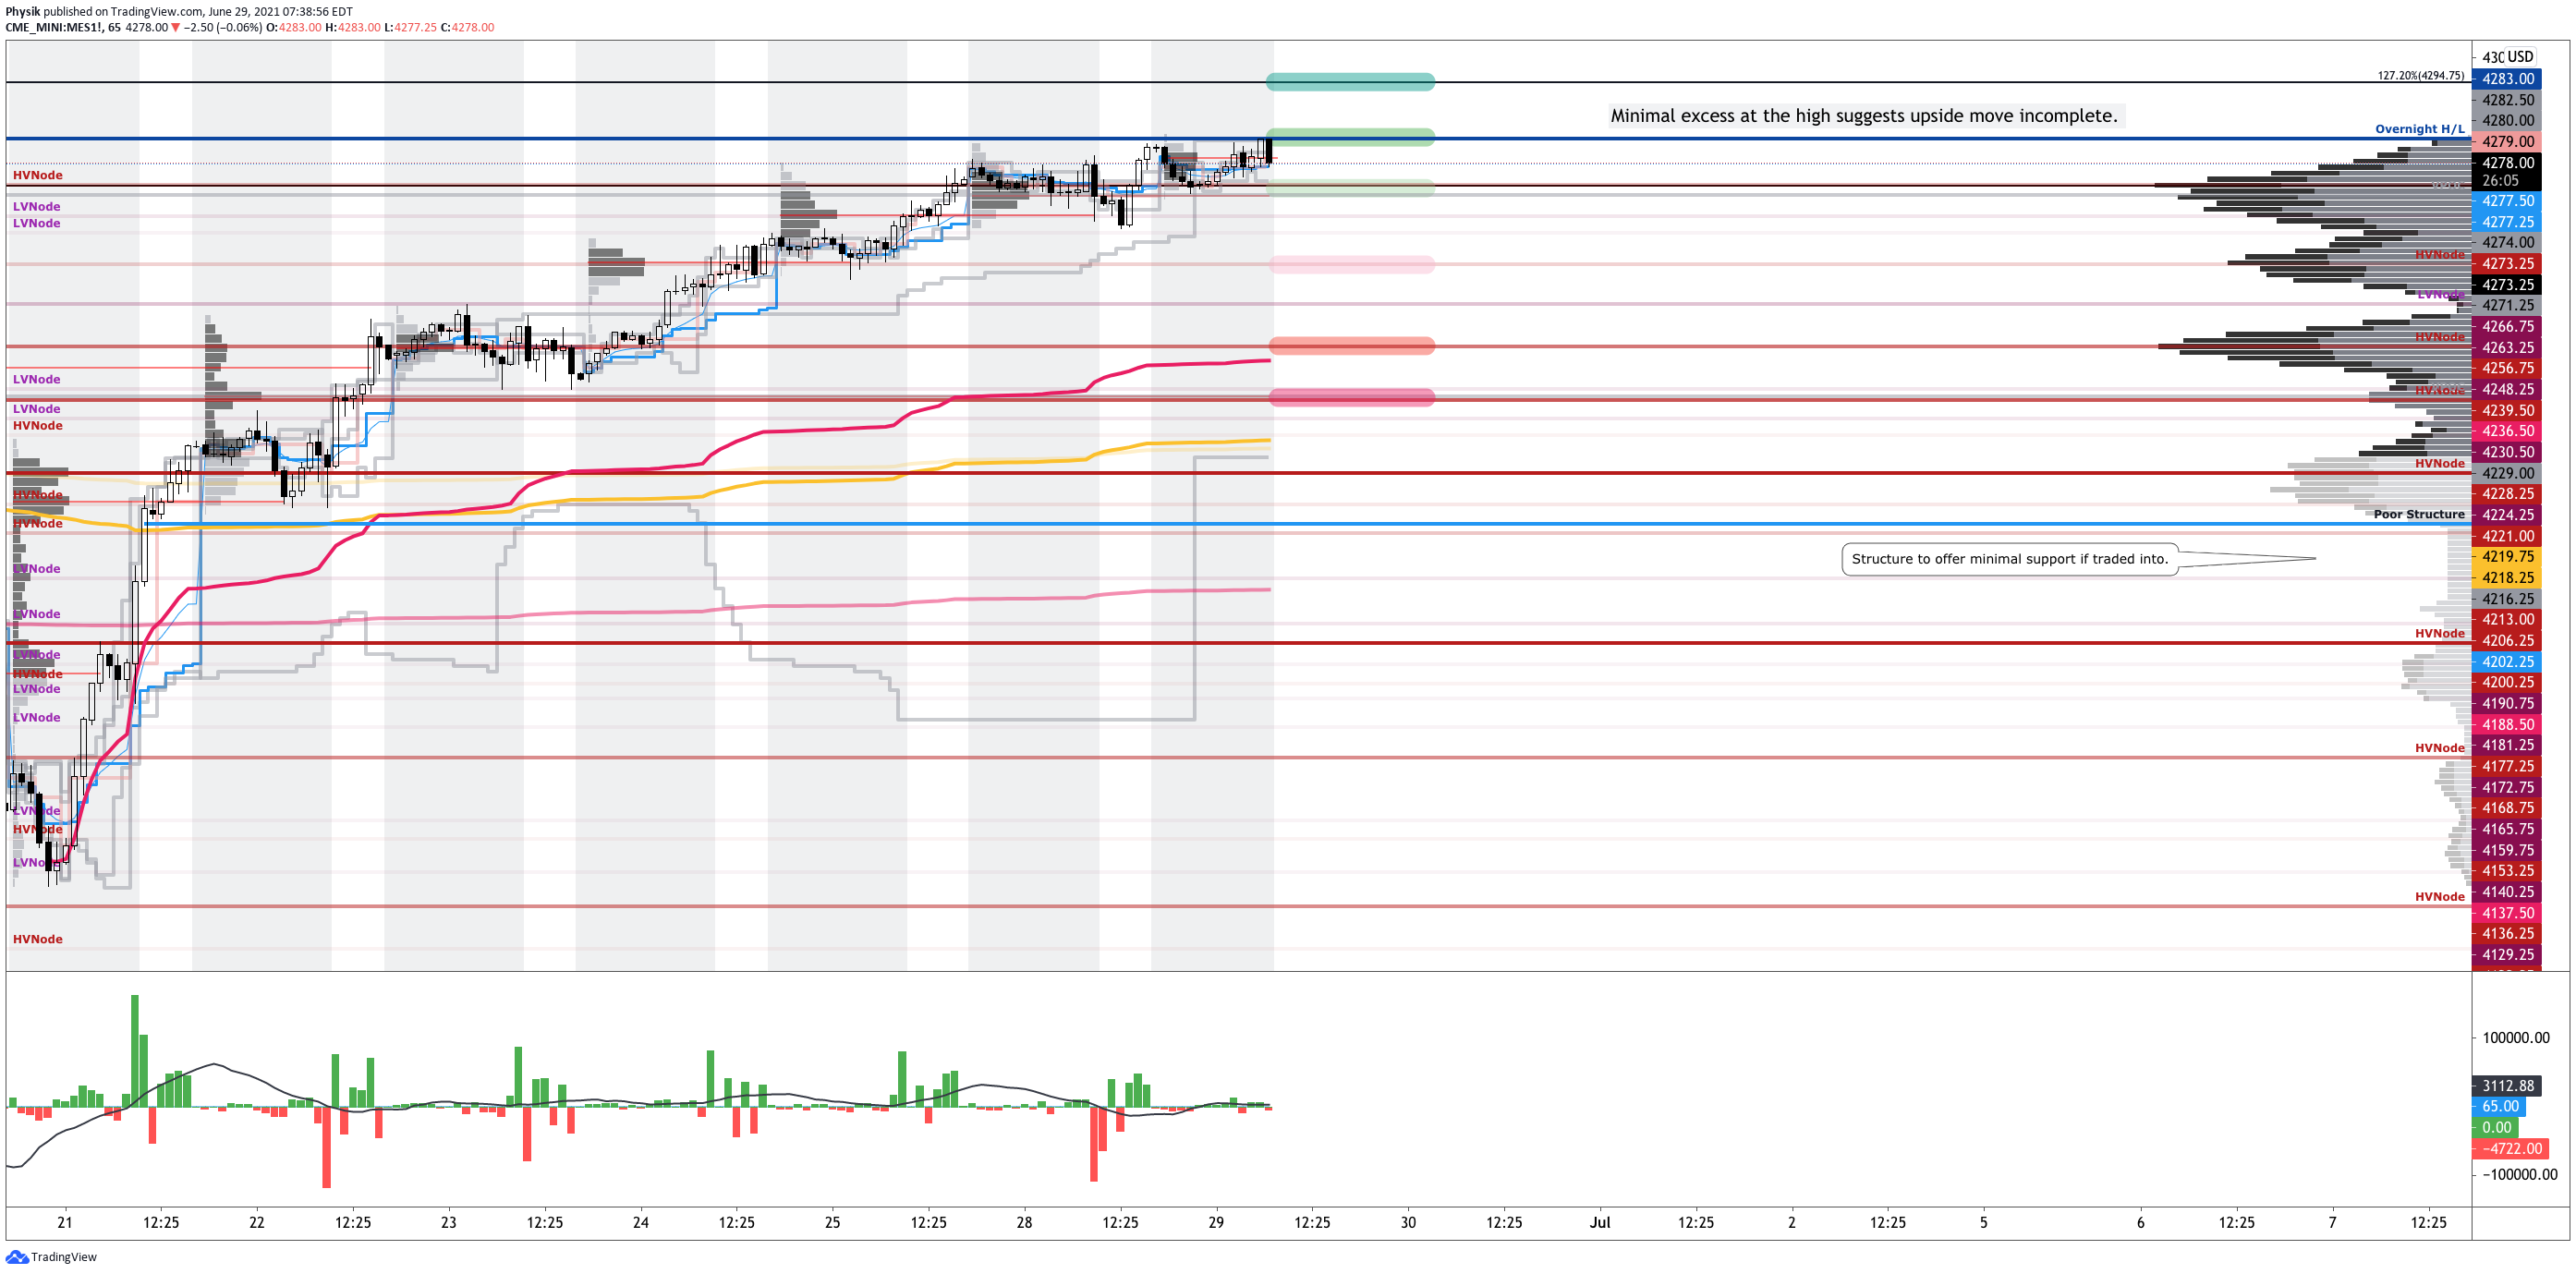
Expectations: As of 6:30 AM ET, Wednesday’s regular session (9:30 AM – 4:00 PM ET), in the S&P 500, will likely open in the upper part of a positively skewed overnight inventory, inside of prior-range and -value, suggesting a limited potential for immediate directional opportunity.
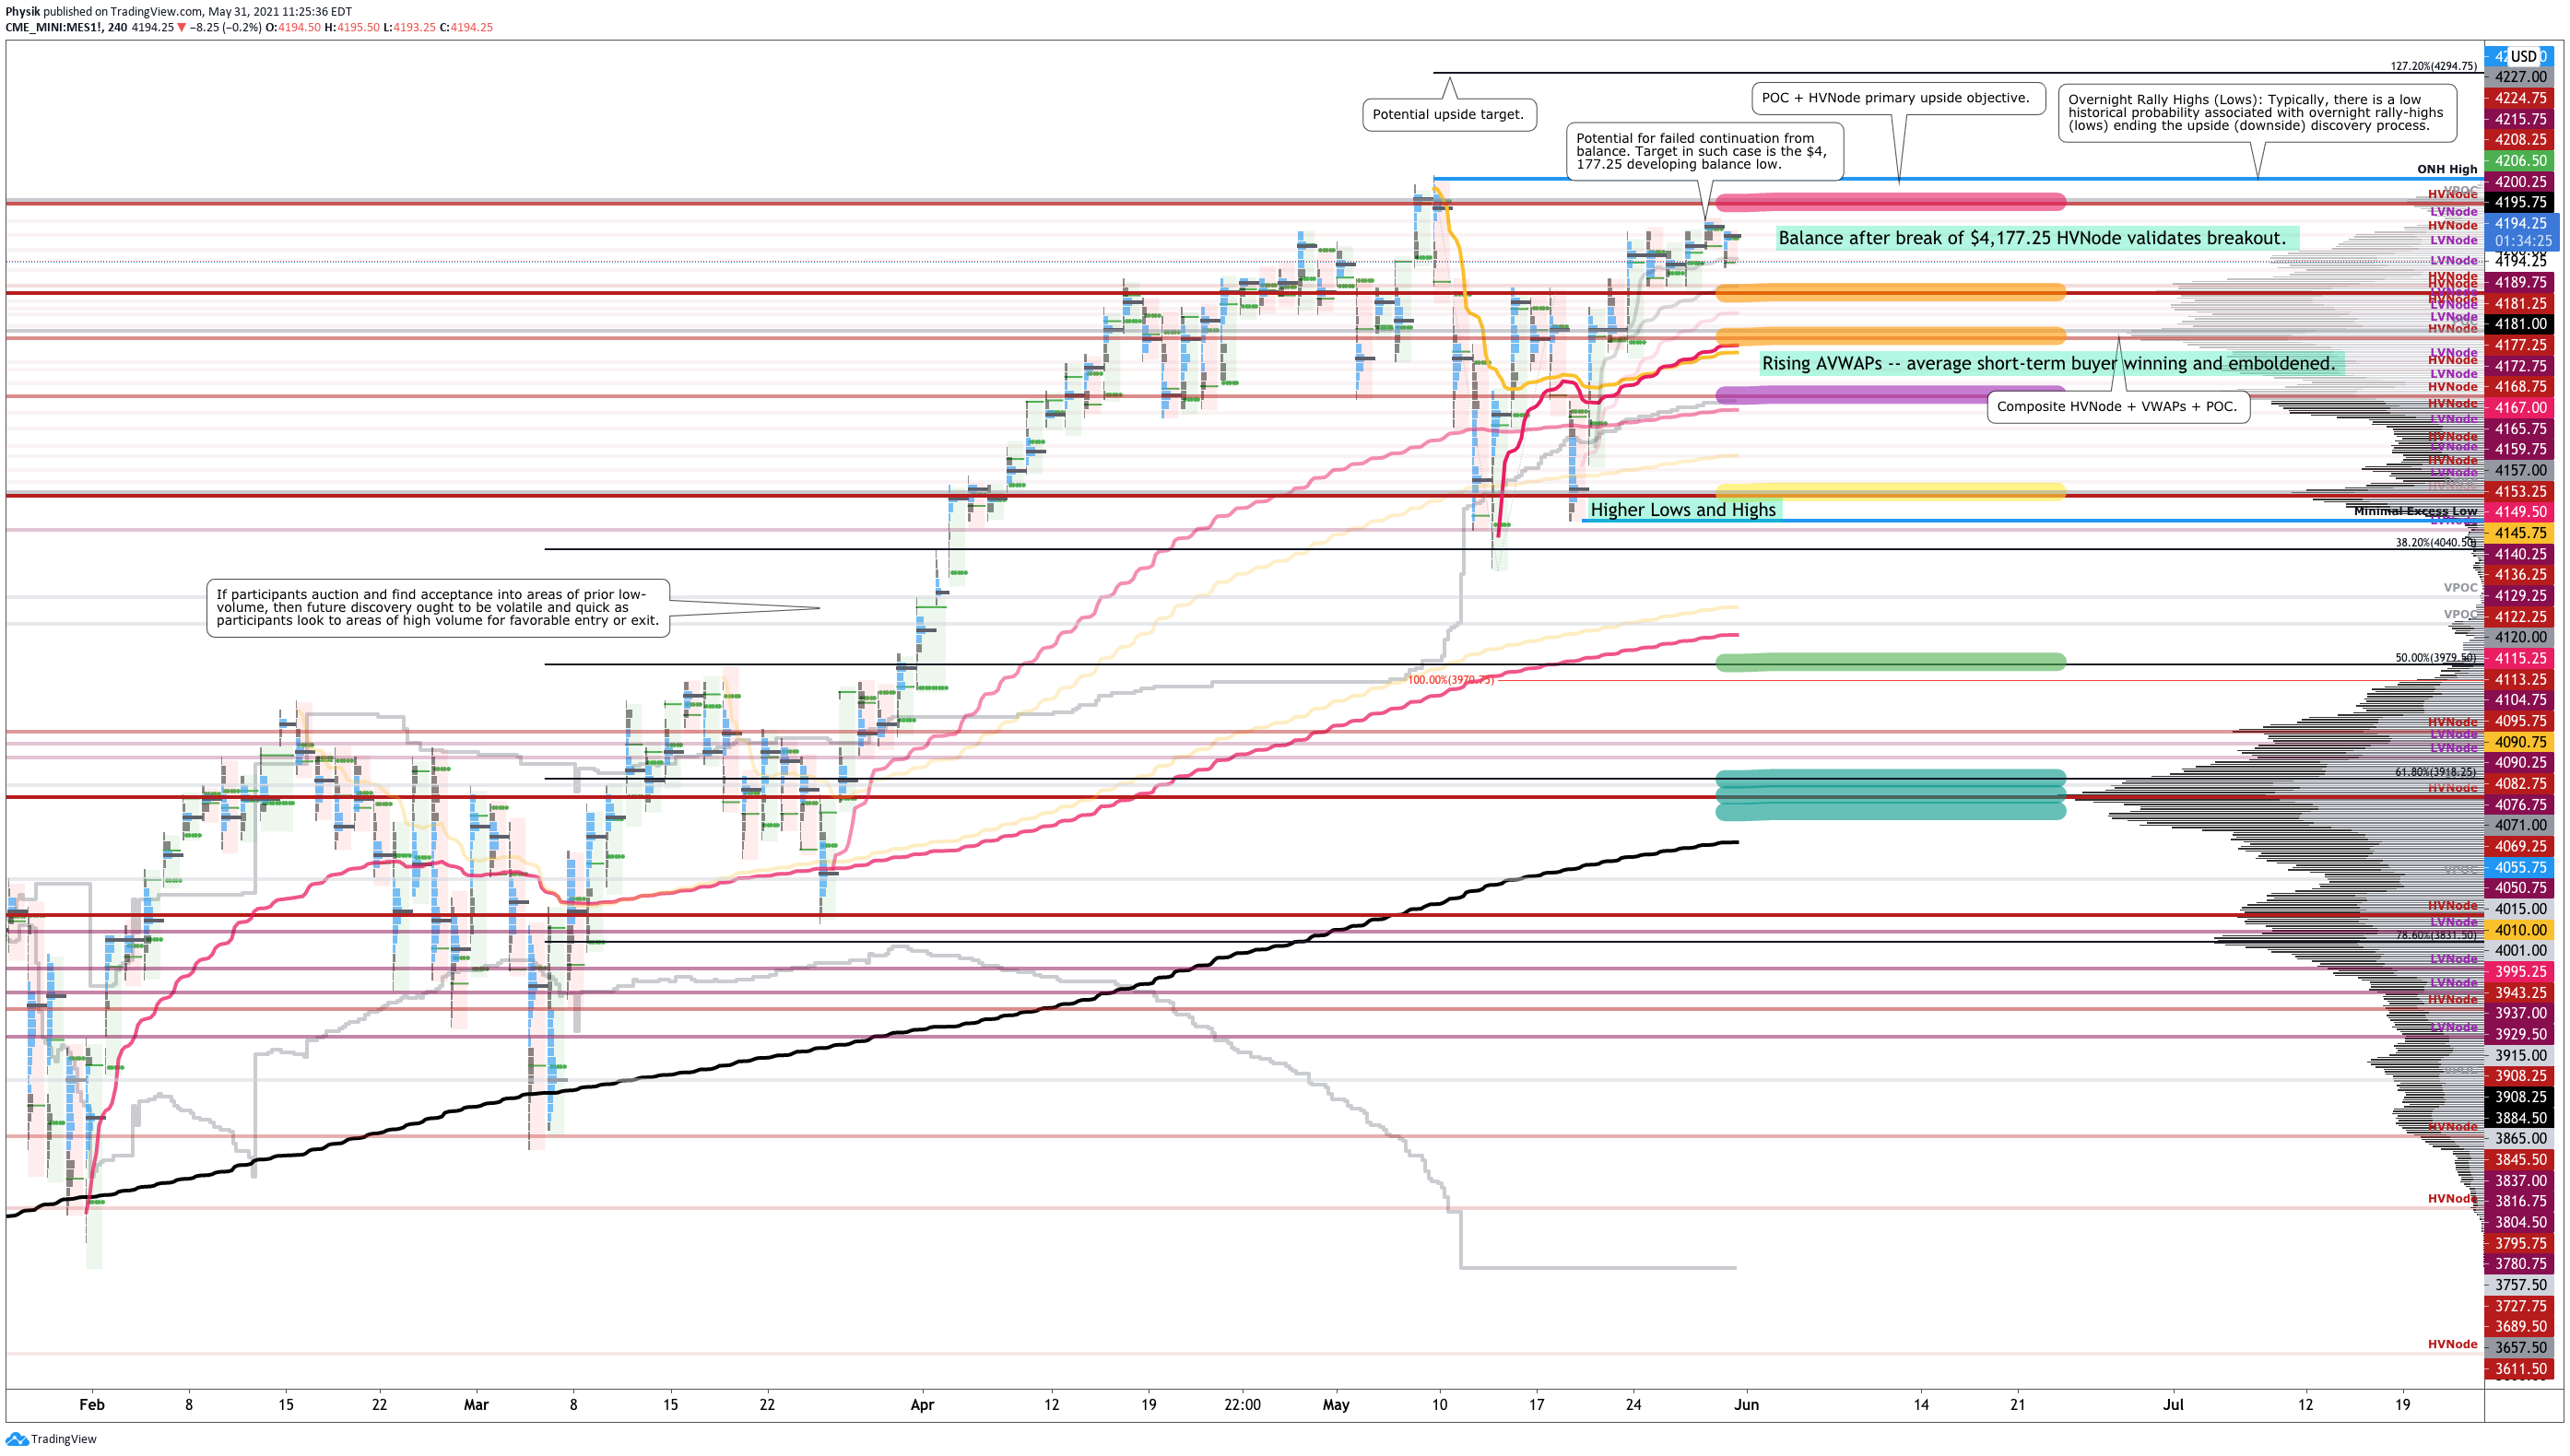
Developing Balance Scenario: Rotational trade that denotes current prices offer favorable entry and exit. Balance-areas make it easy to spot a change in the market (i.e., the transition from two-time frame trade, or balance, to one-time frame trade, or trend).

Modus operandi is responsive trade (i.e., fade the edges), rather than initiative trade (i.e., play the break).
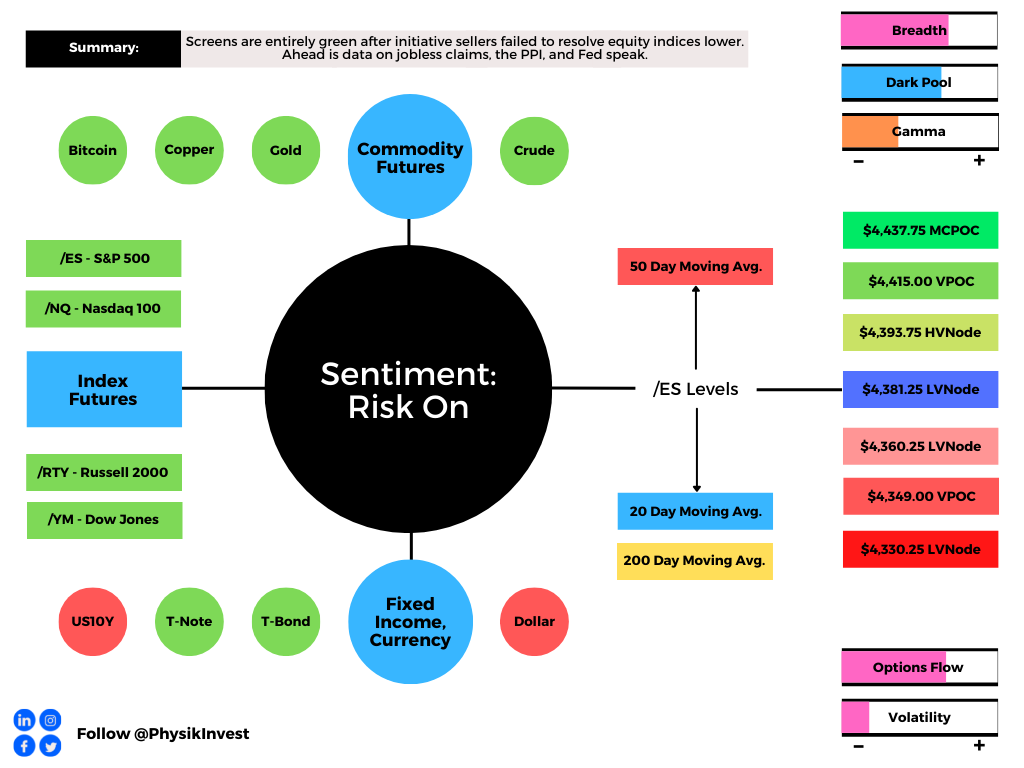
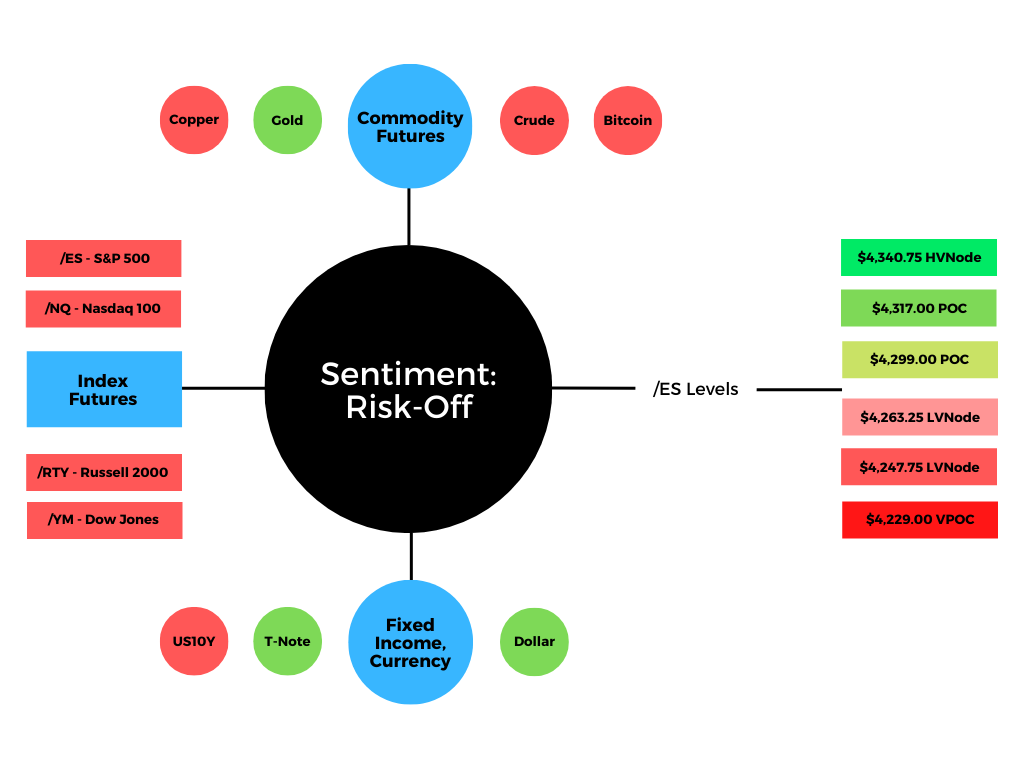
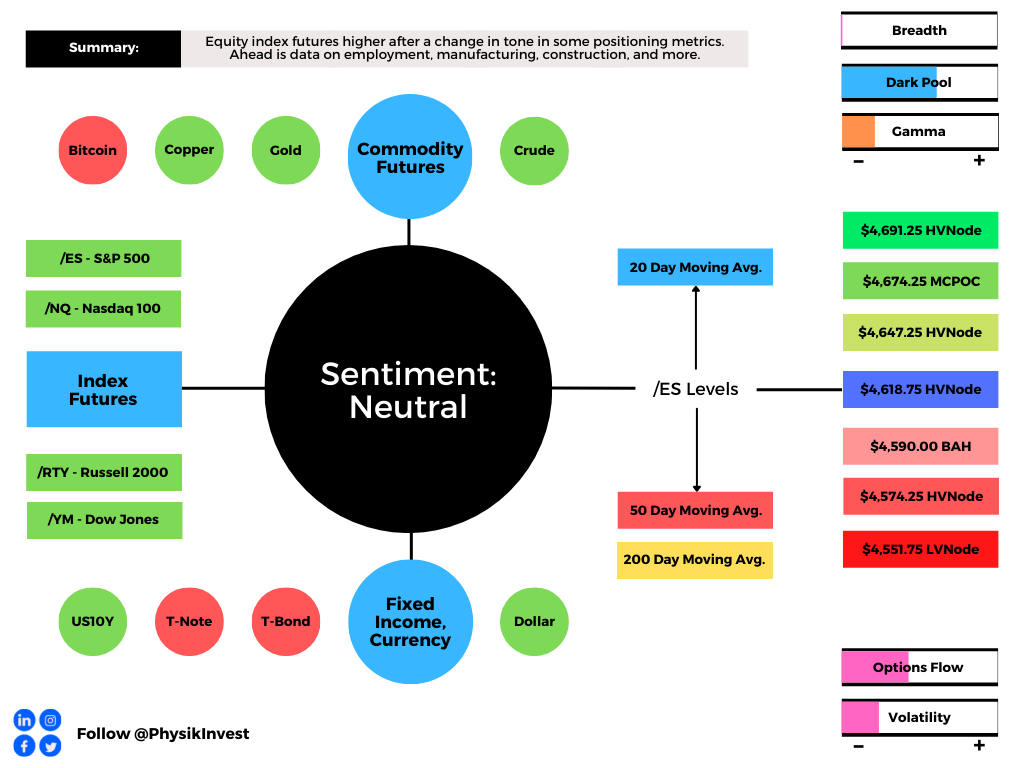
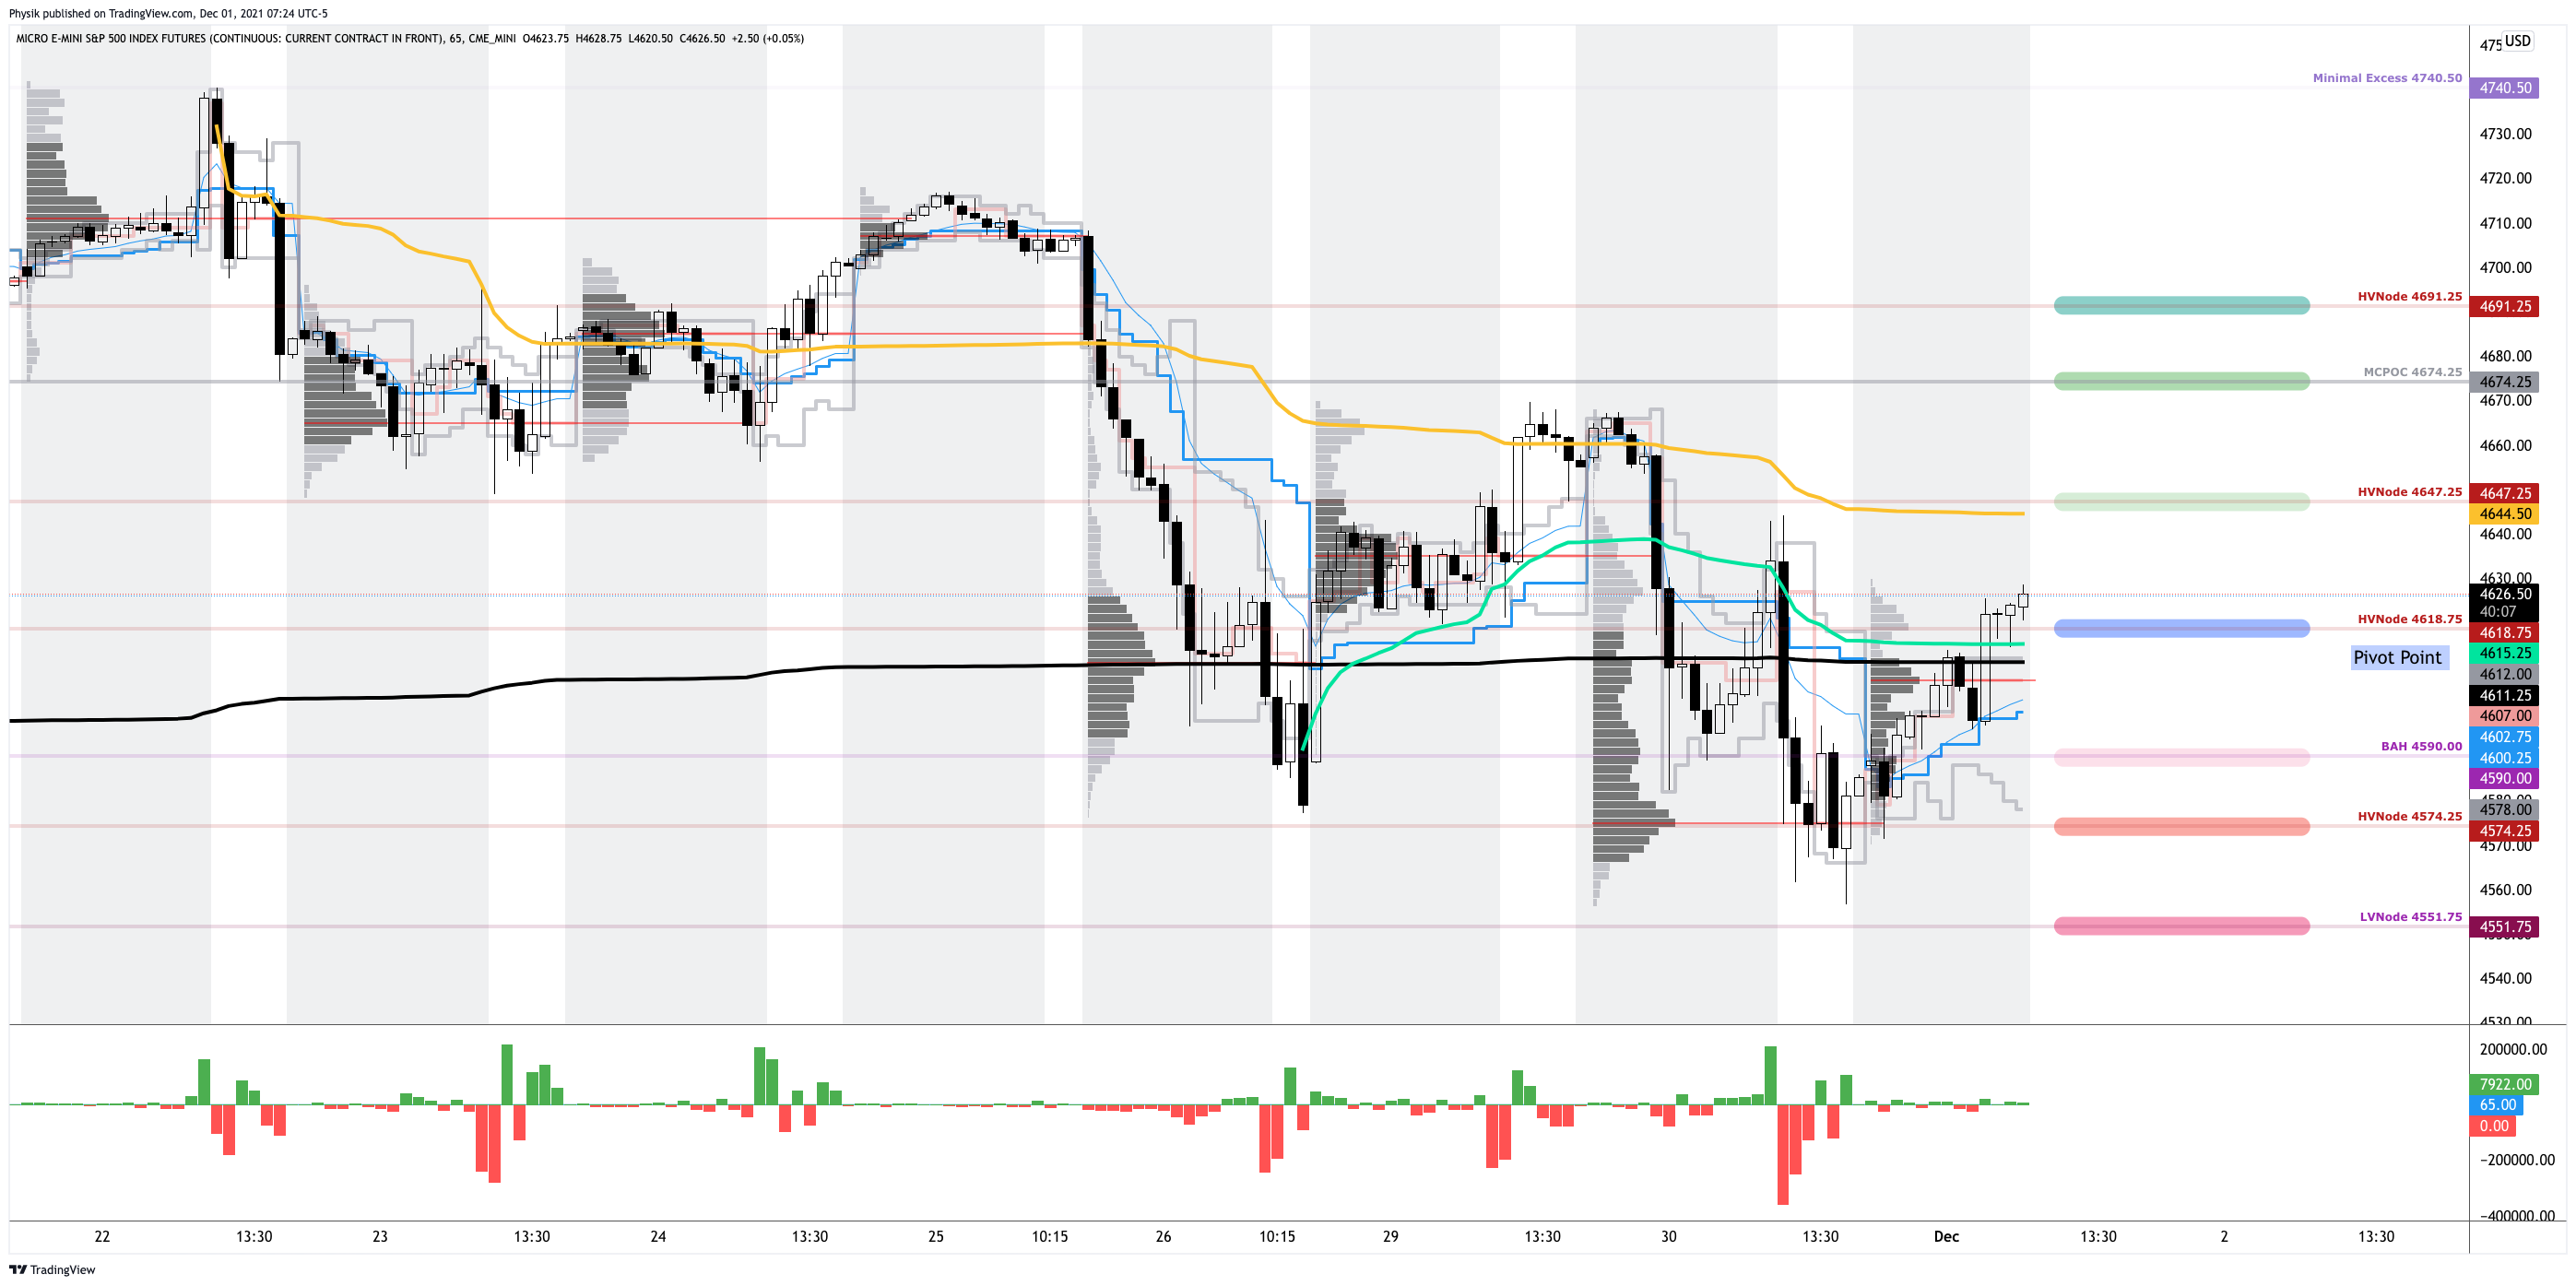
In the best case, the S&P 500 trades sideways or higher; activity above the $4,618.75 high volume area (HVNode) puts in play the $4,647.25 HVNode. Initiative trade beyond the latter HVNode could reach as high as the $4,674.25 micro composite point of control (MCPOC) and $4,691.25 HVNode, or higher.
In the worst case, the S&P 500 trades lower; activity below the $4,618.75 HVNode puts in play the $4,590.00 balance boundary (BAH). Initiative trade beyond the BAH could reach as low as the $4,574.25 HVNode and $4,551.75 LVNode, or lower.
Click here to load today’s updated key levels into the web-based TradingView charting platform. Note that all levels are derived using the 65-minute timeframe. New links are produced, daily.
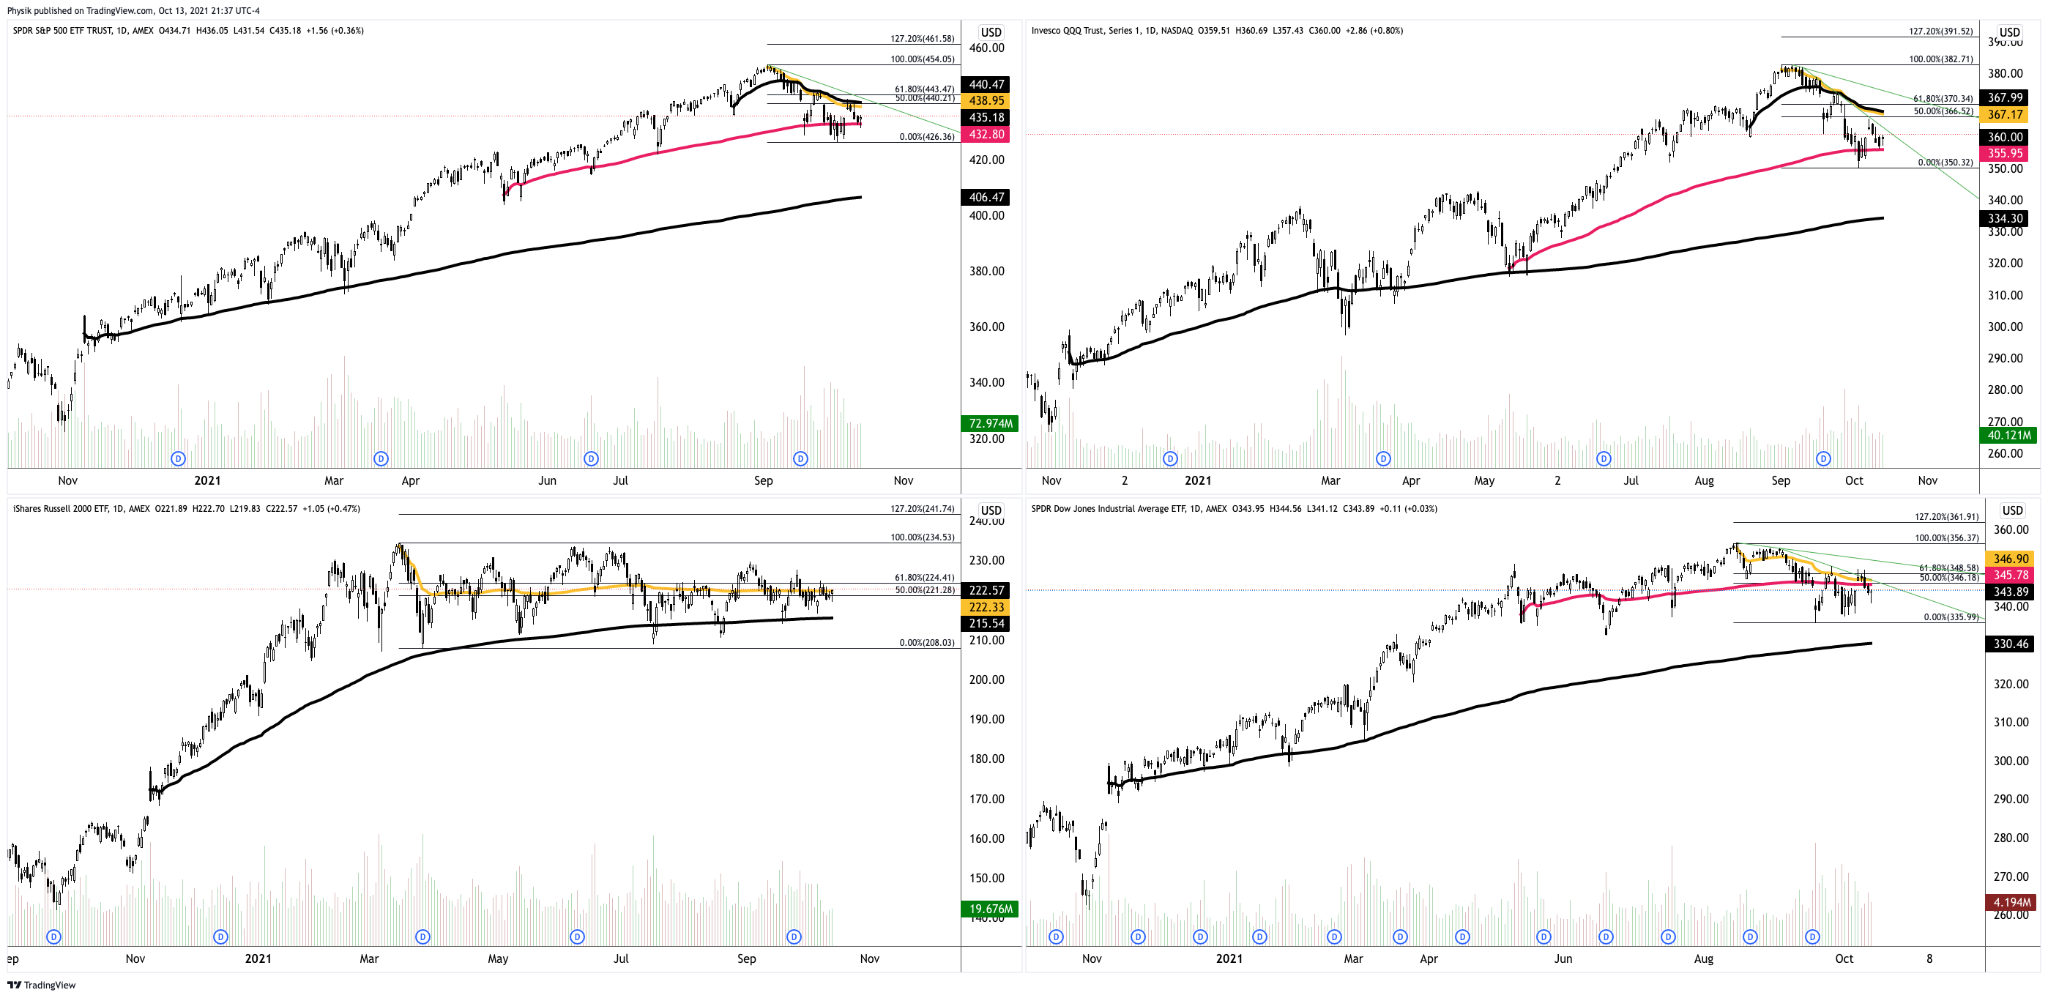
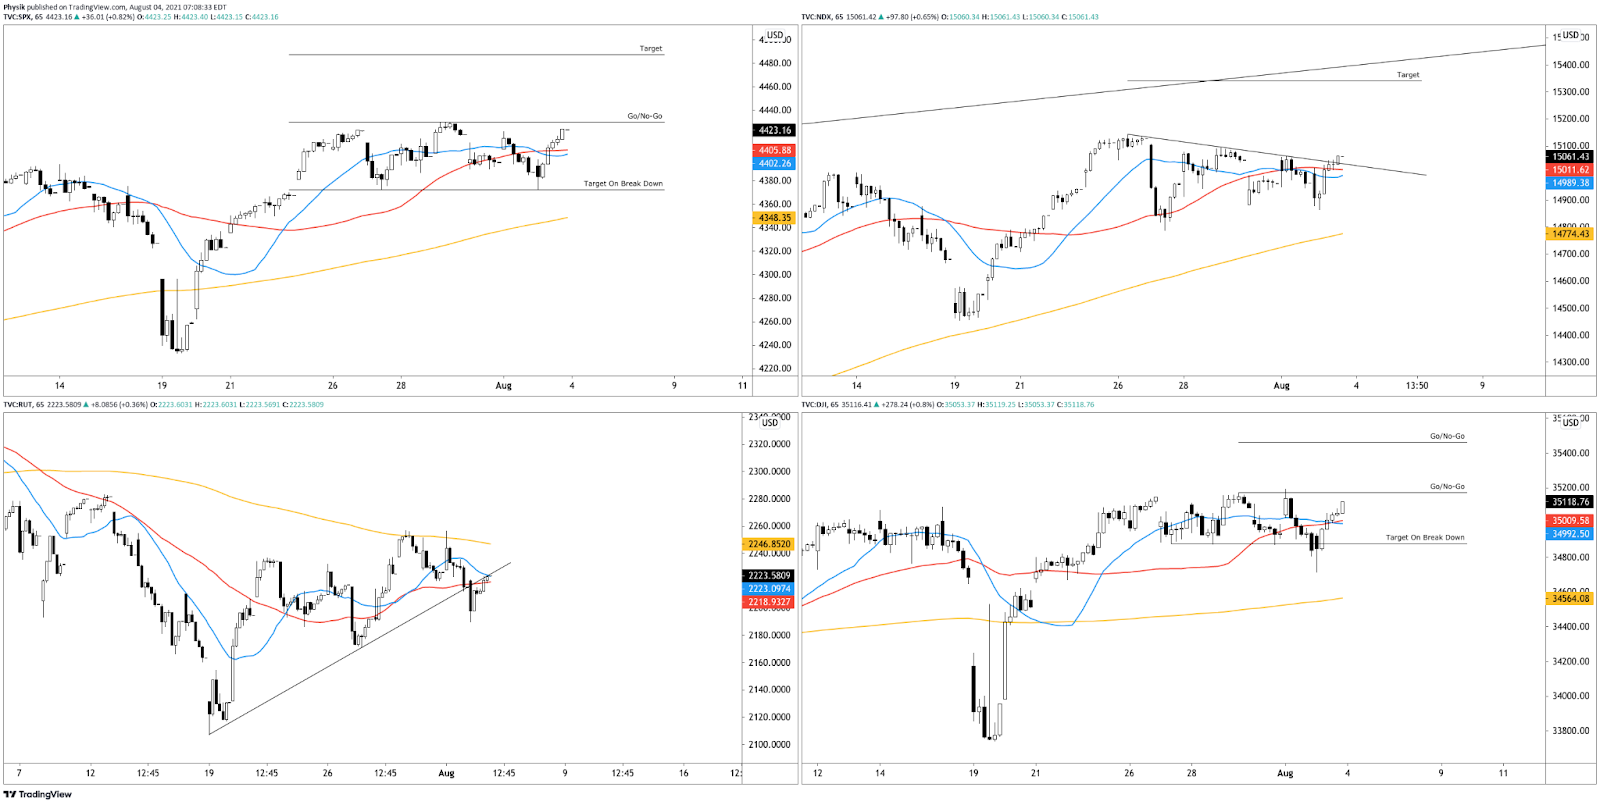
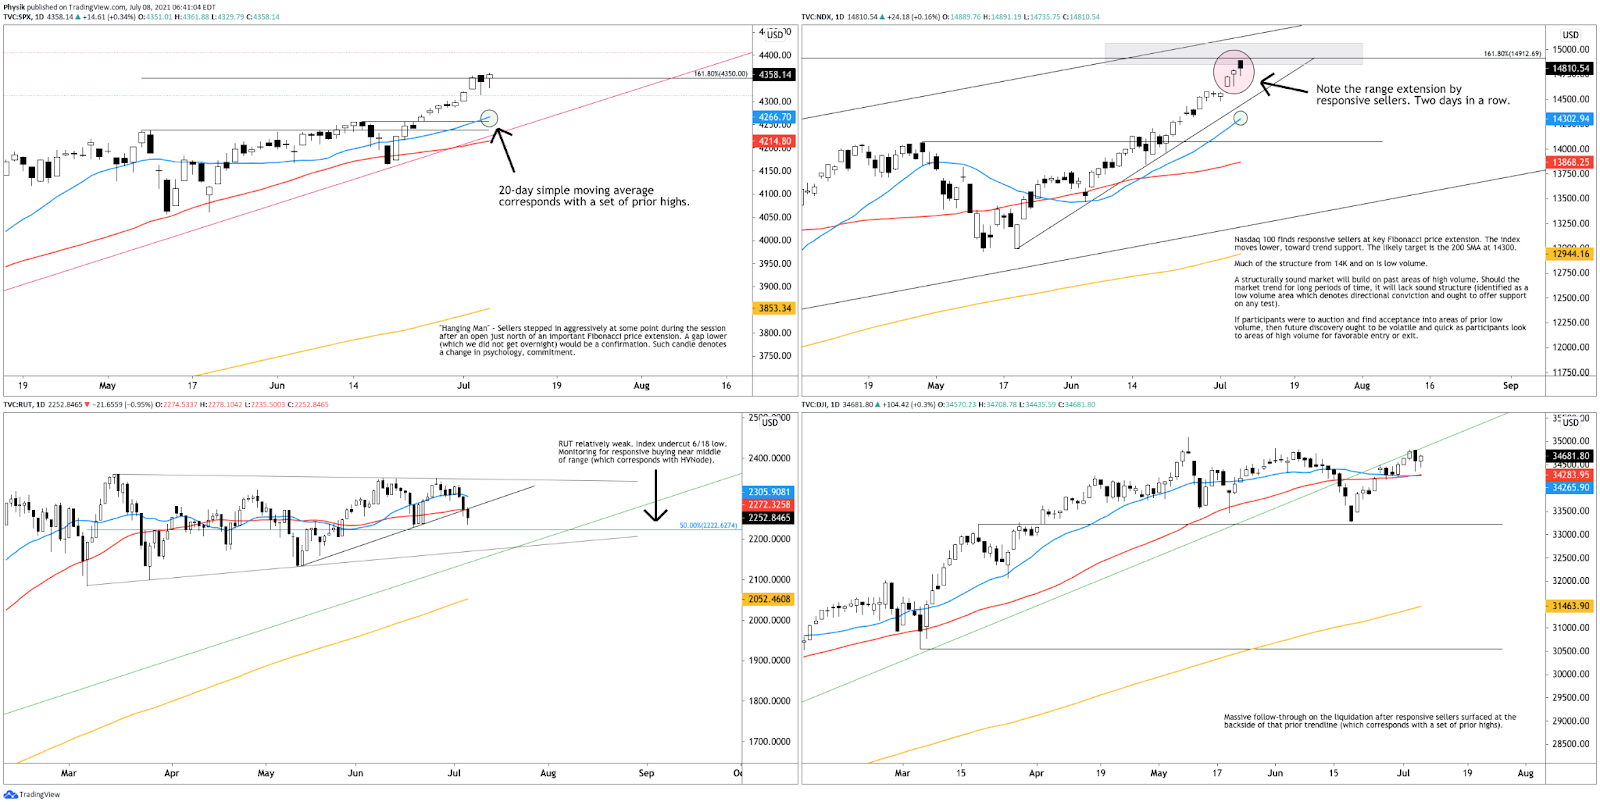
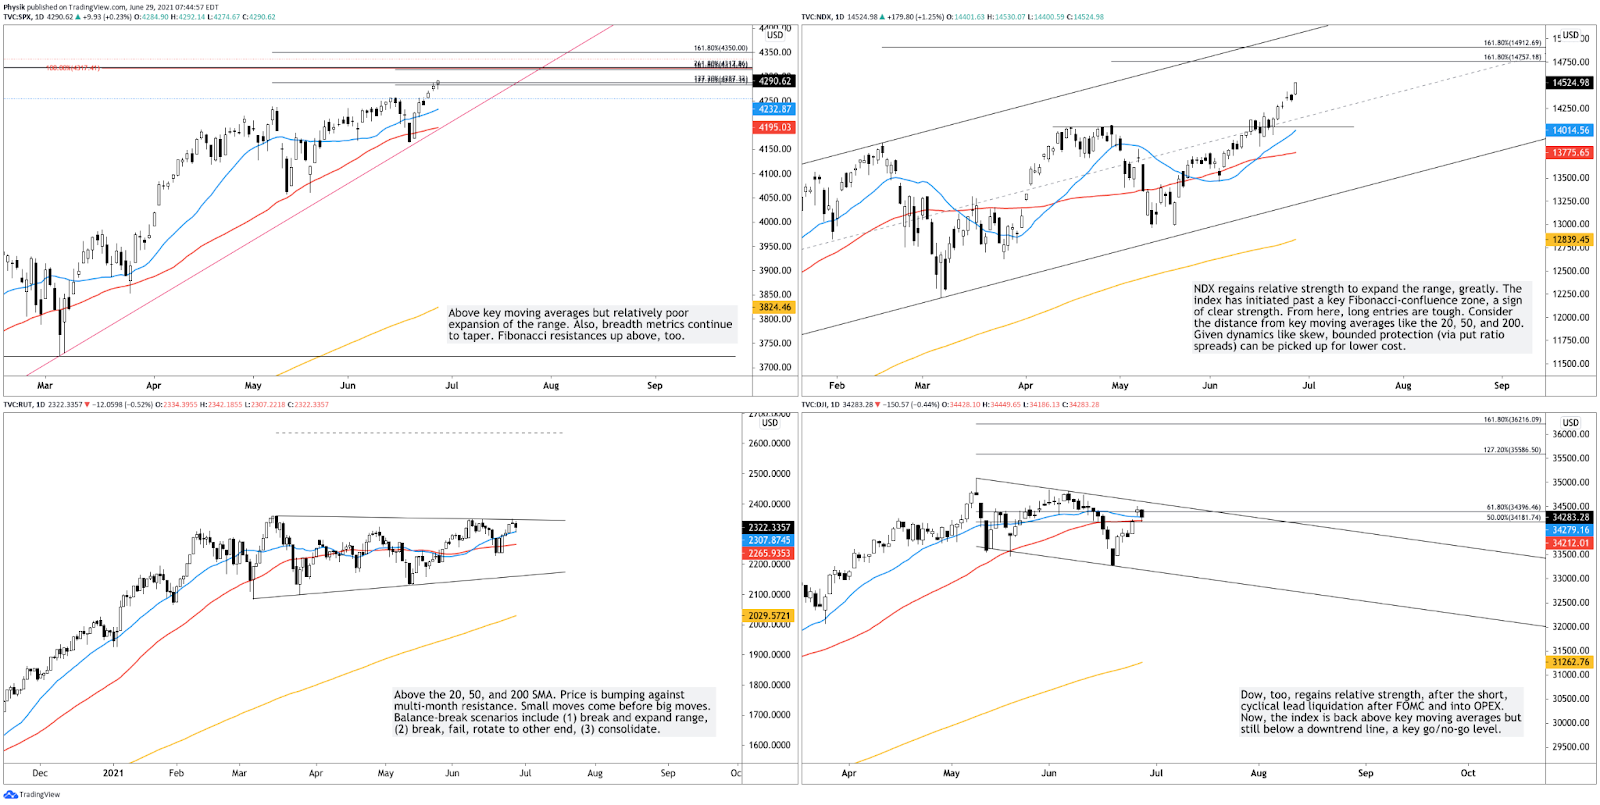
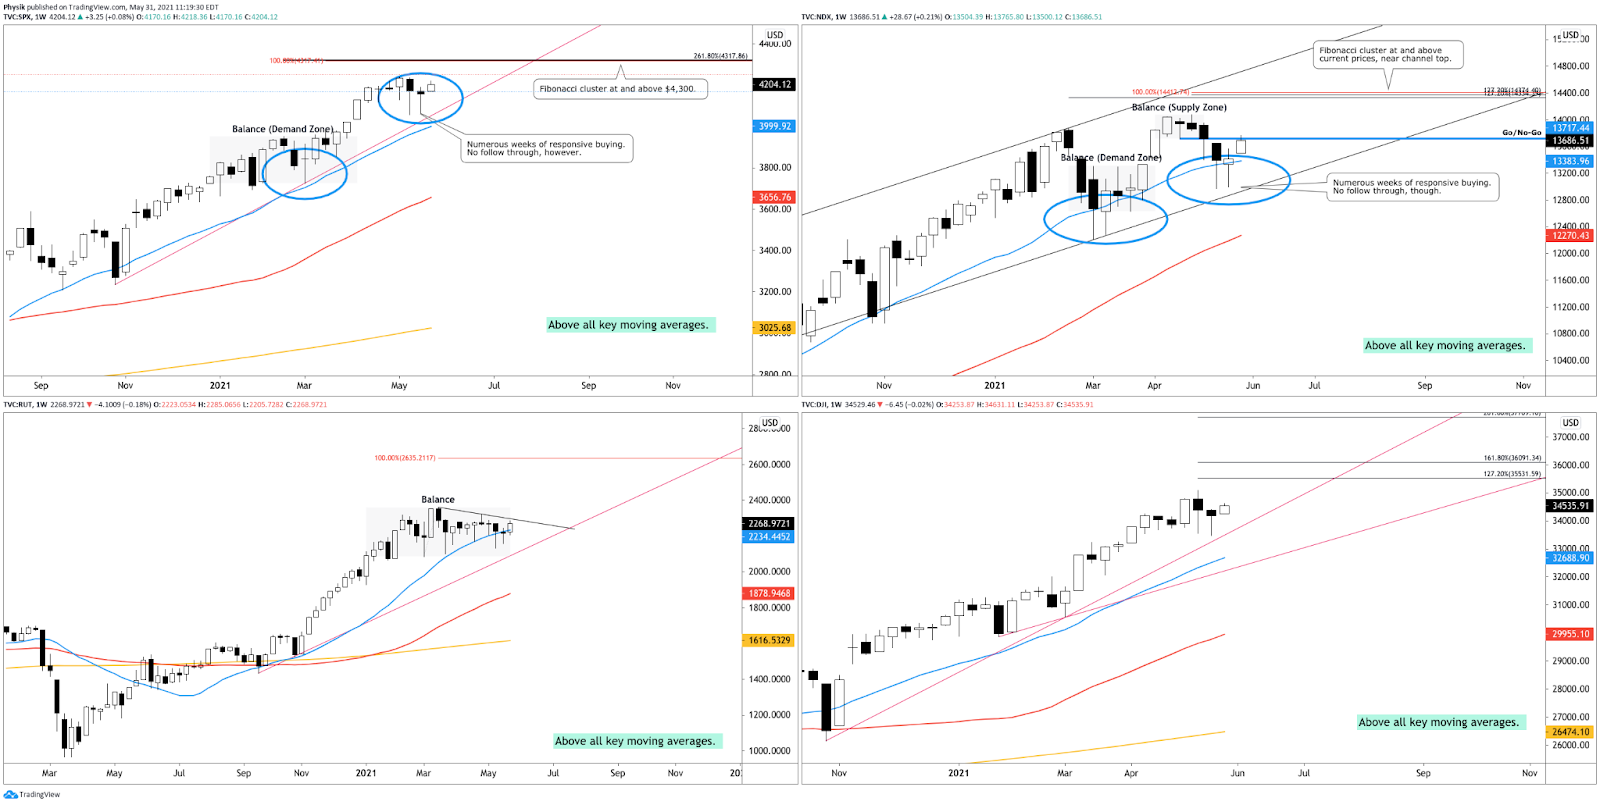
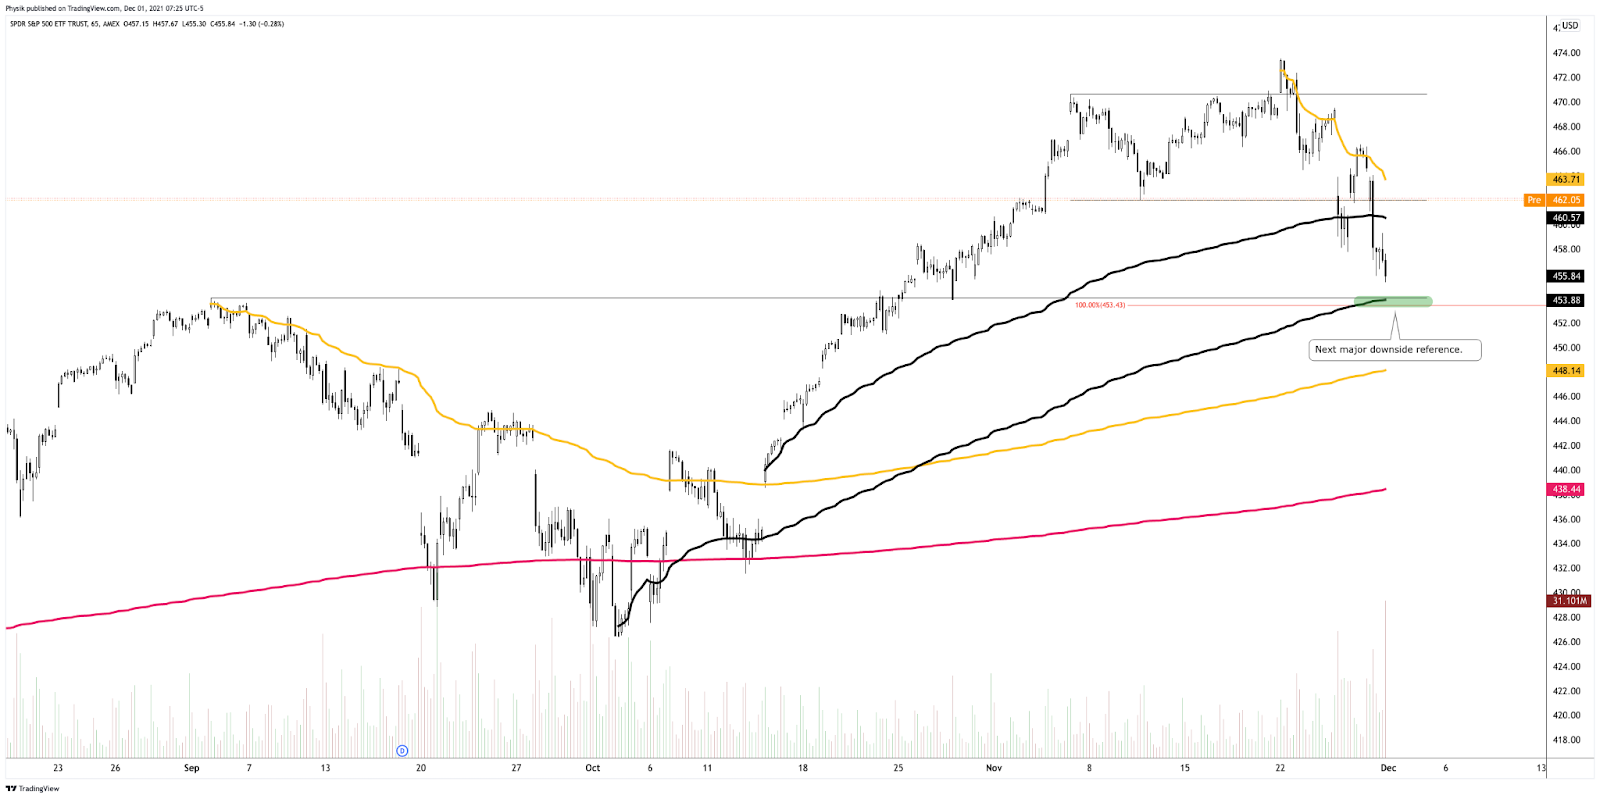
Charts To Watch
What People Are Saying
Volume Areas: A structurally sound market will build on areas of high volume (HVNodes). Should the market trend for long periods of time, it will lack sound structure, identified as low volume areas (LVNodes). LVNodes denote directional conviction and ought to offer support on any test.
If participants were to auction and find acceptance into areas of prior low volume (LVNodes), then future discovery ought to be volatile and quick as participants look to HVNodes for favorable entry or exit.
MCPOCs: POCs are valuable as they denote areas where two-sided trade was most prevalent over numerous day sessions. Participants will respond to future tests of value as they offer favorable entry and exit.
Definitions
About
After years of self-education, strategy development, and trial-and-error, Renato Leonard Capelj began trading full-time and founded Physik Invest to detail his methods, research, and performance in the markets.
Additionally, Capelj is a Benzinga finance and technology reporter interviewing the likes of Shark Tank’s Kevin O’Leary, JC2 Ventures’ John Chambers, and ARK Invest’s Catherine Wood, as well as a SpotGamma contributor, developing insights around impactful options market dynamics.
Disclaimer
At this time, Physik Invest does not manage outside capital and is not licensed. In no way should the materials herein be construed as advice. Derivatives carry a substantial risk of loss. All content is for informational purposes only.