Market Commentary
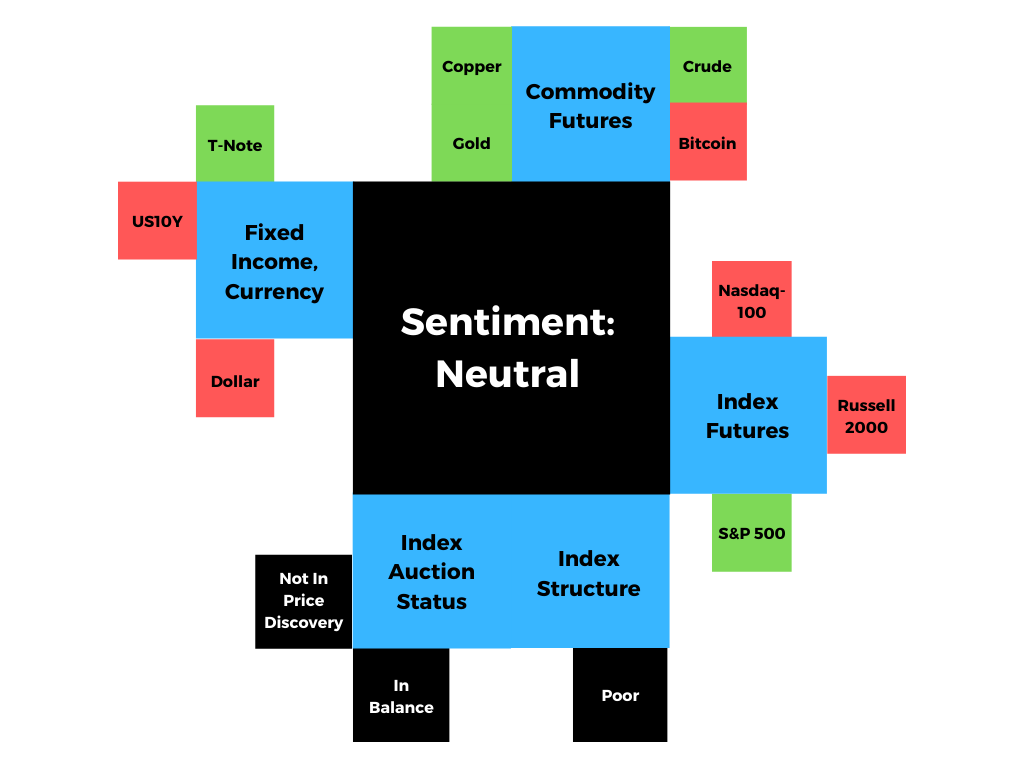
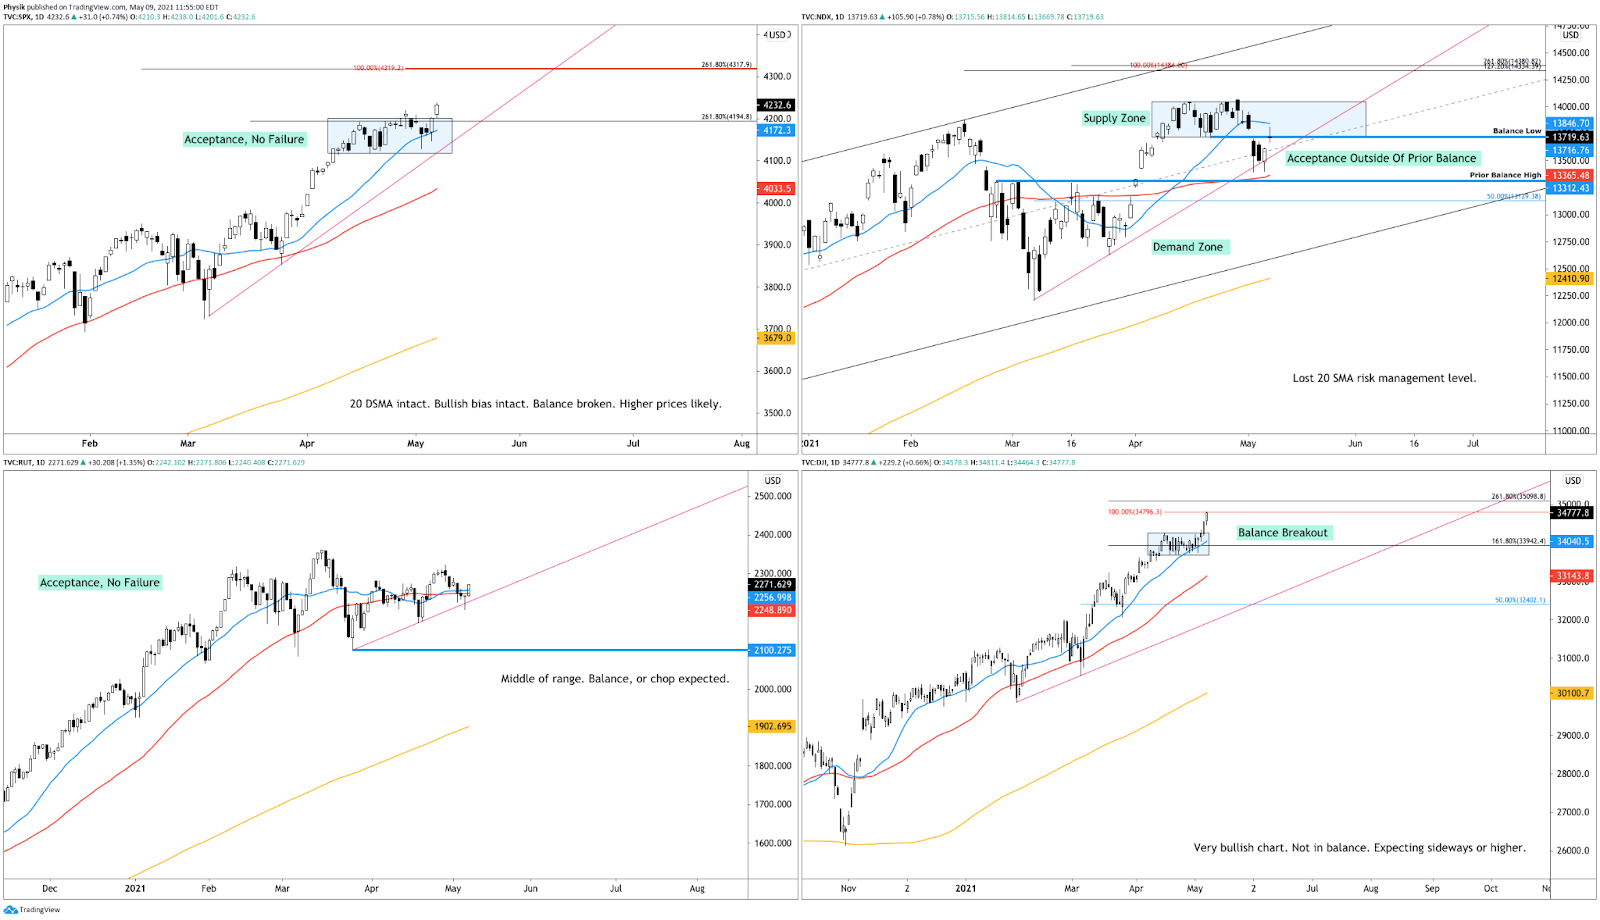
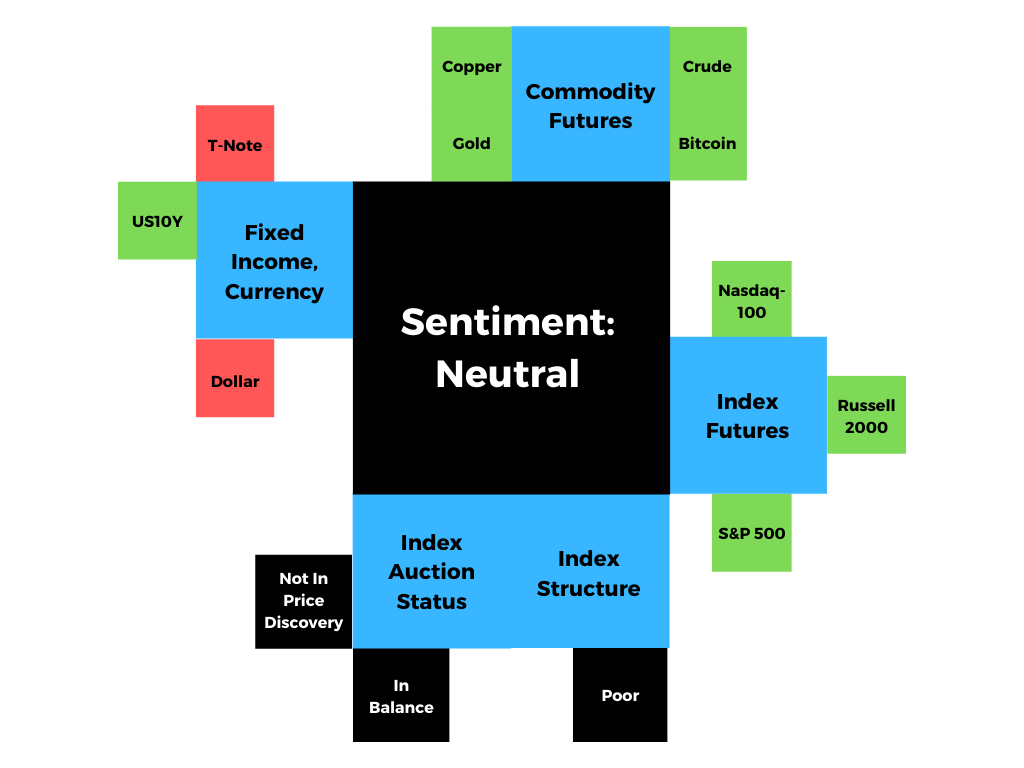
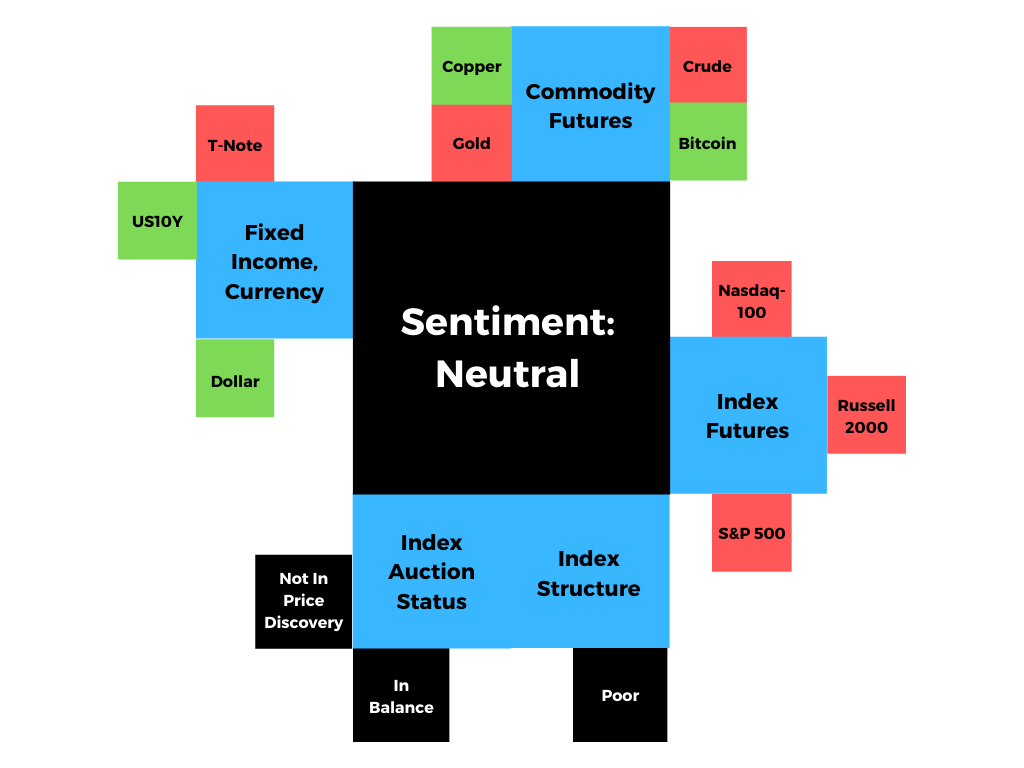
Index futures in balance.
- Tugging as sectors push and pull.
- Ahead: Consumer prices, inflation.
- Indices settle, position for resolve.
What Happened: After responsive buying the day prior, U.S. stock index futures auctioned lower overnight, ahead of data on inflation.

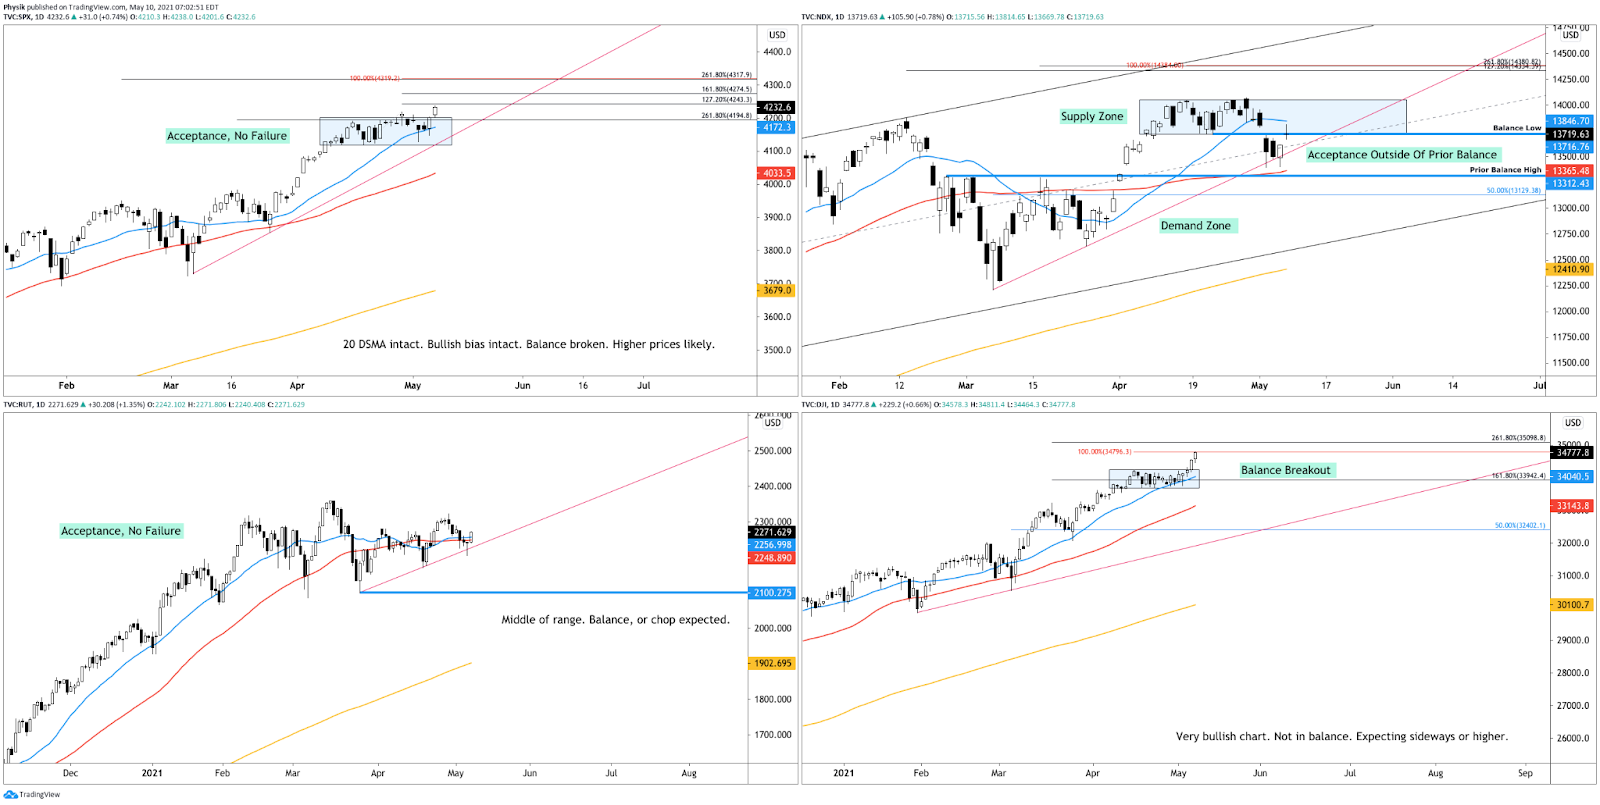
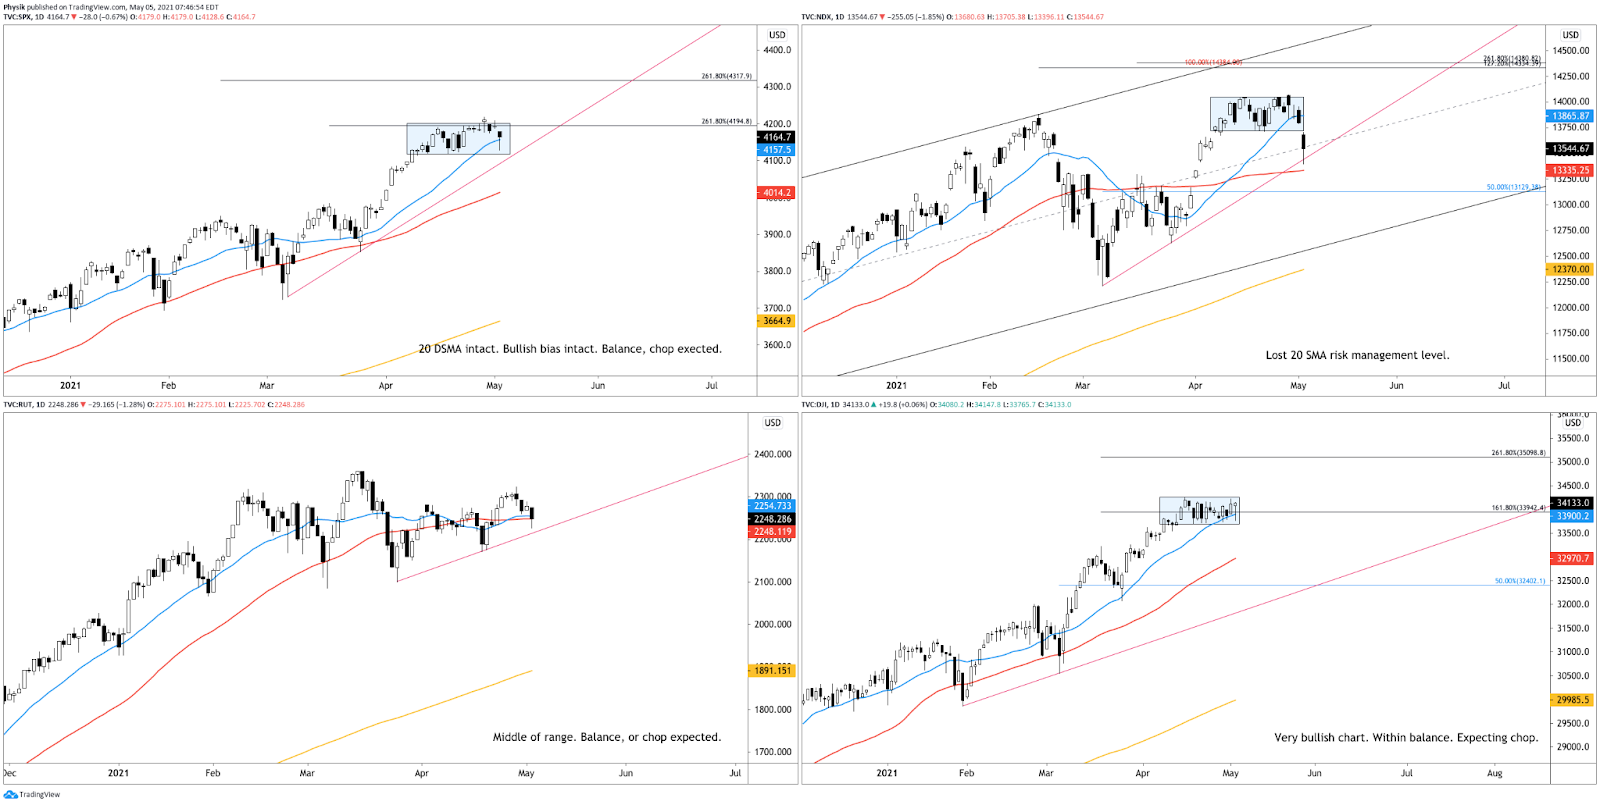
What To Expect: Wednesday’s regular session (9:30 AM – 4:00 PM EST) in the S&P 500 will likely open inside of prior-range and -value, suggesting a limited potential for immediate directional opportunity.
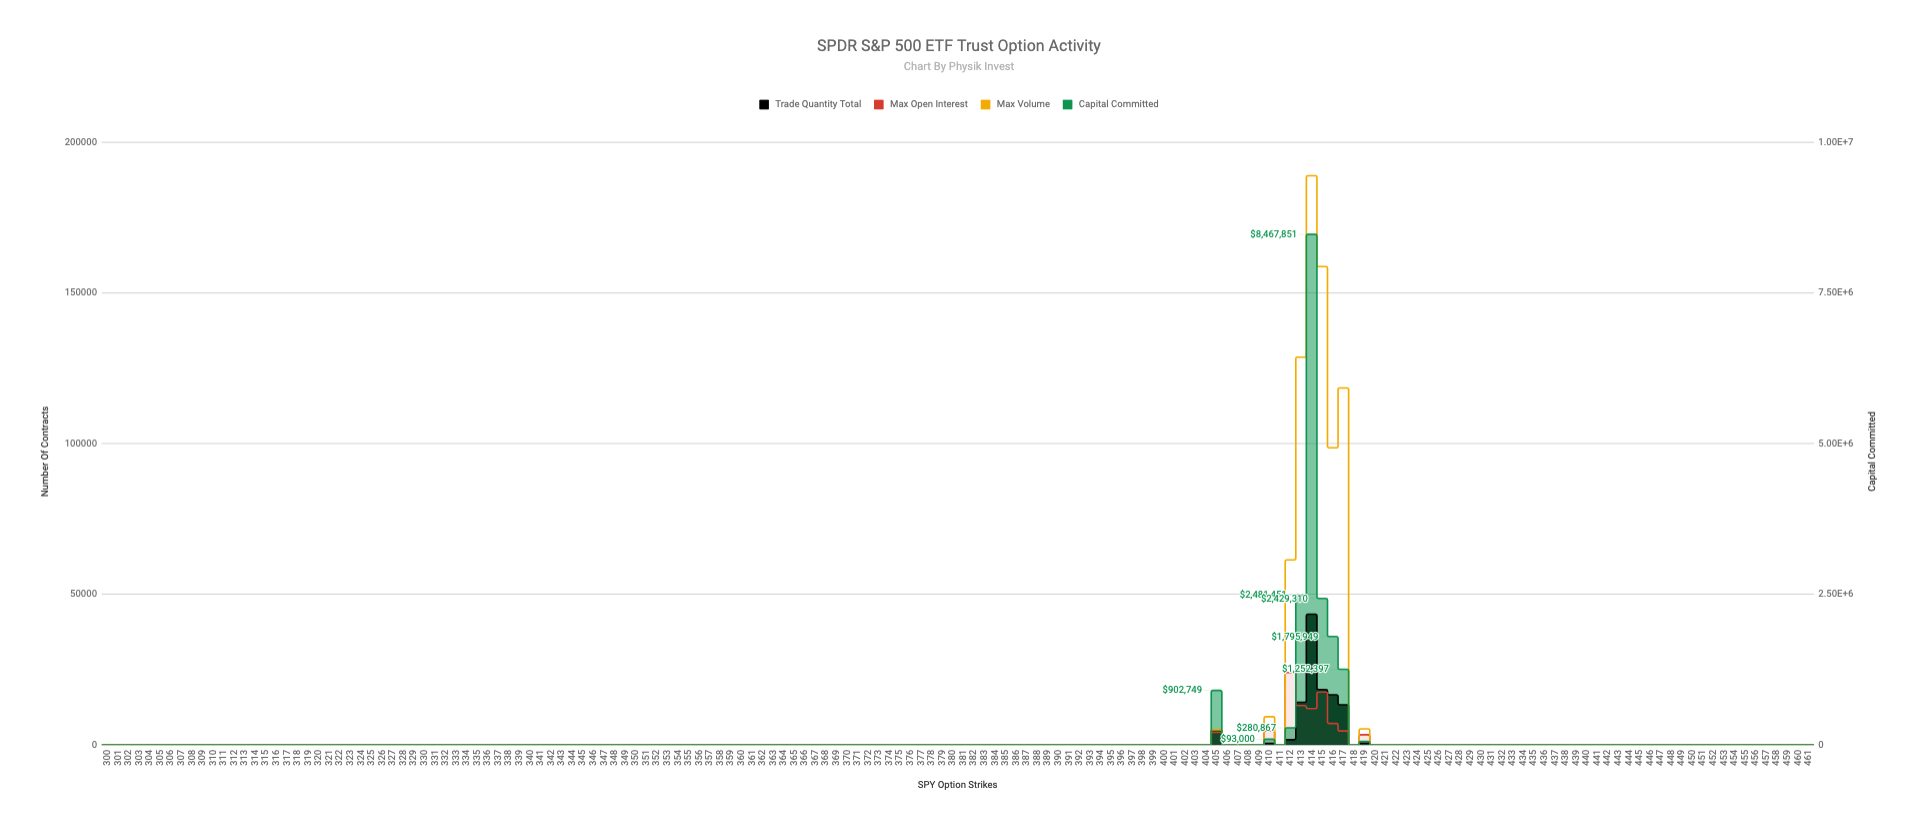
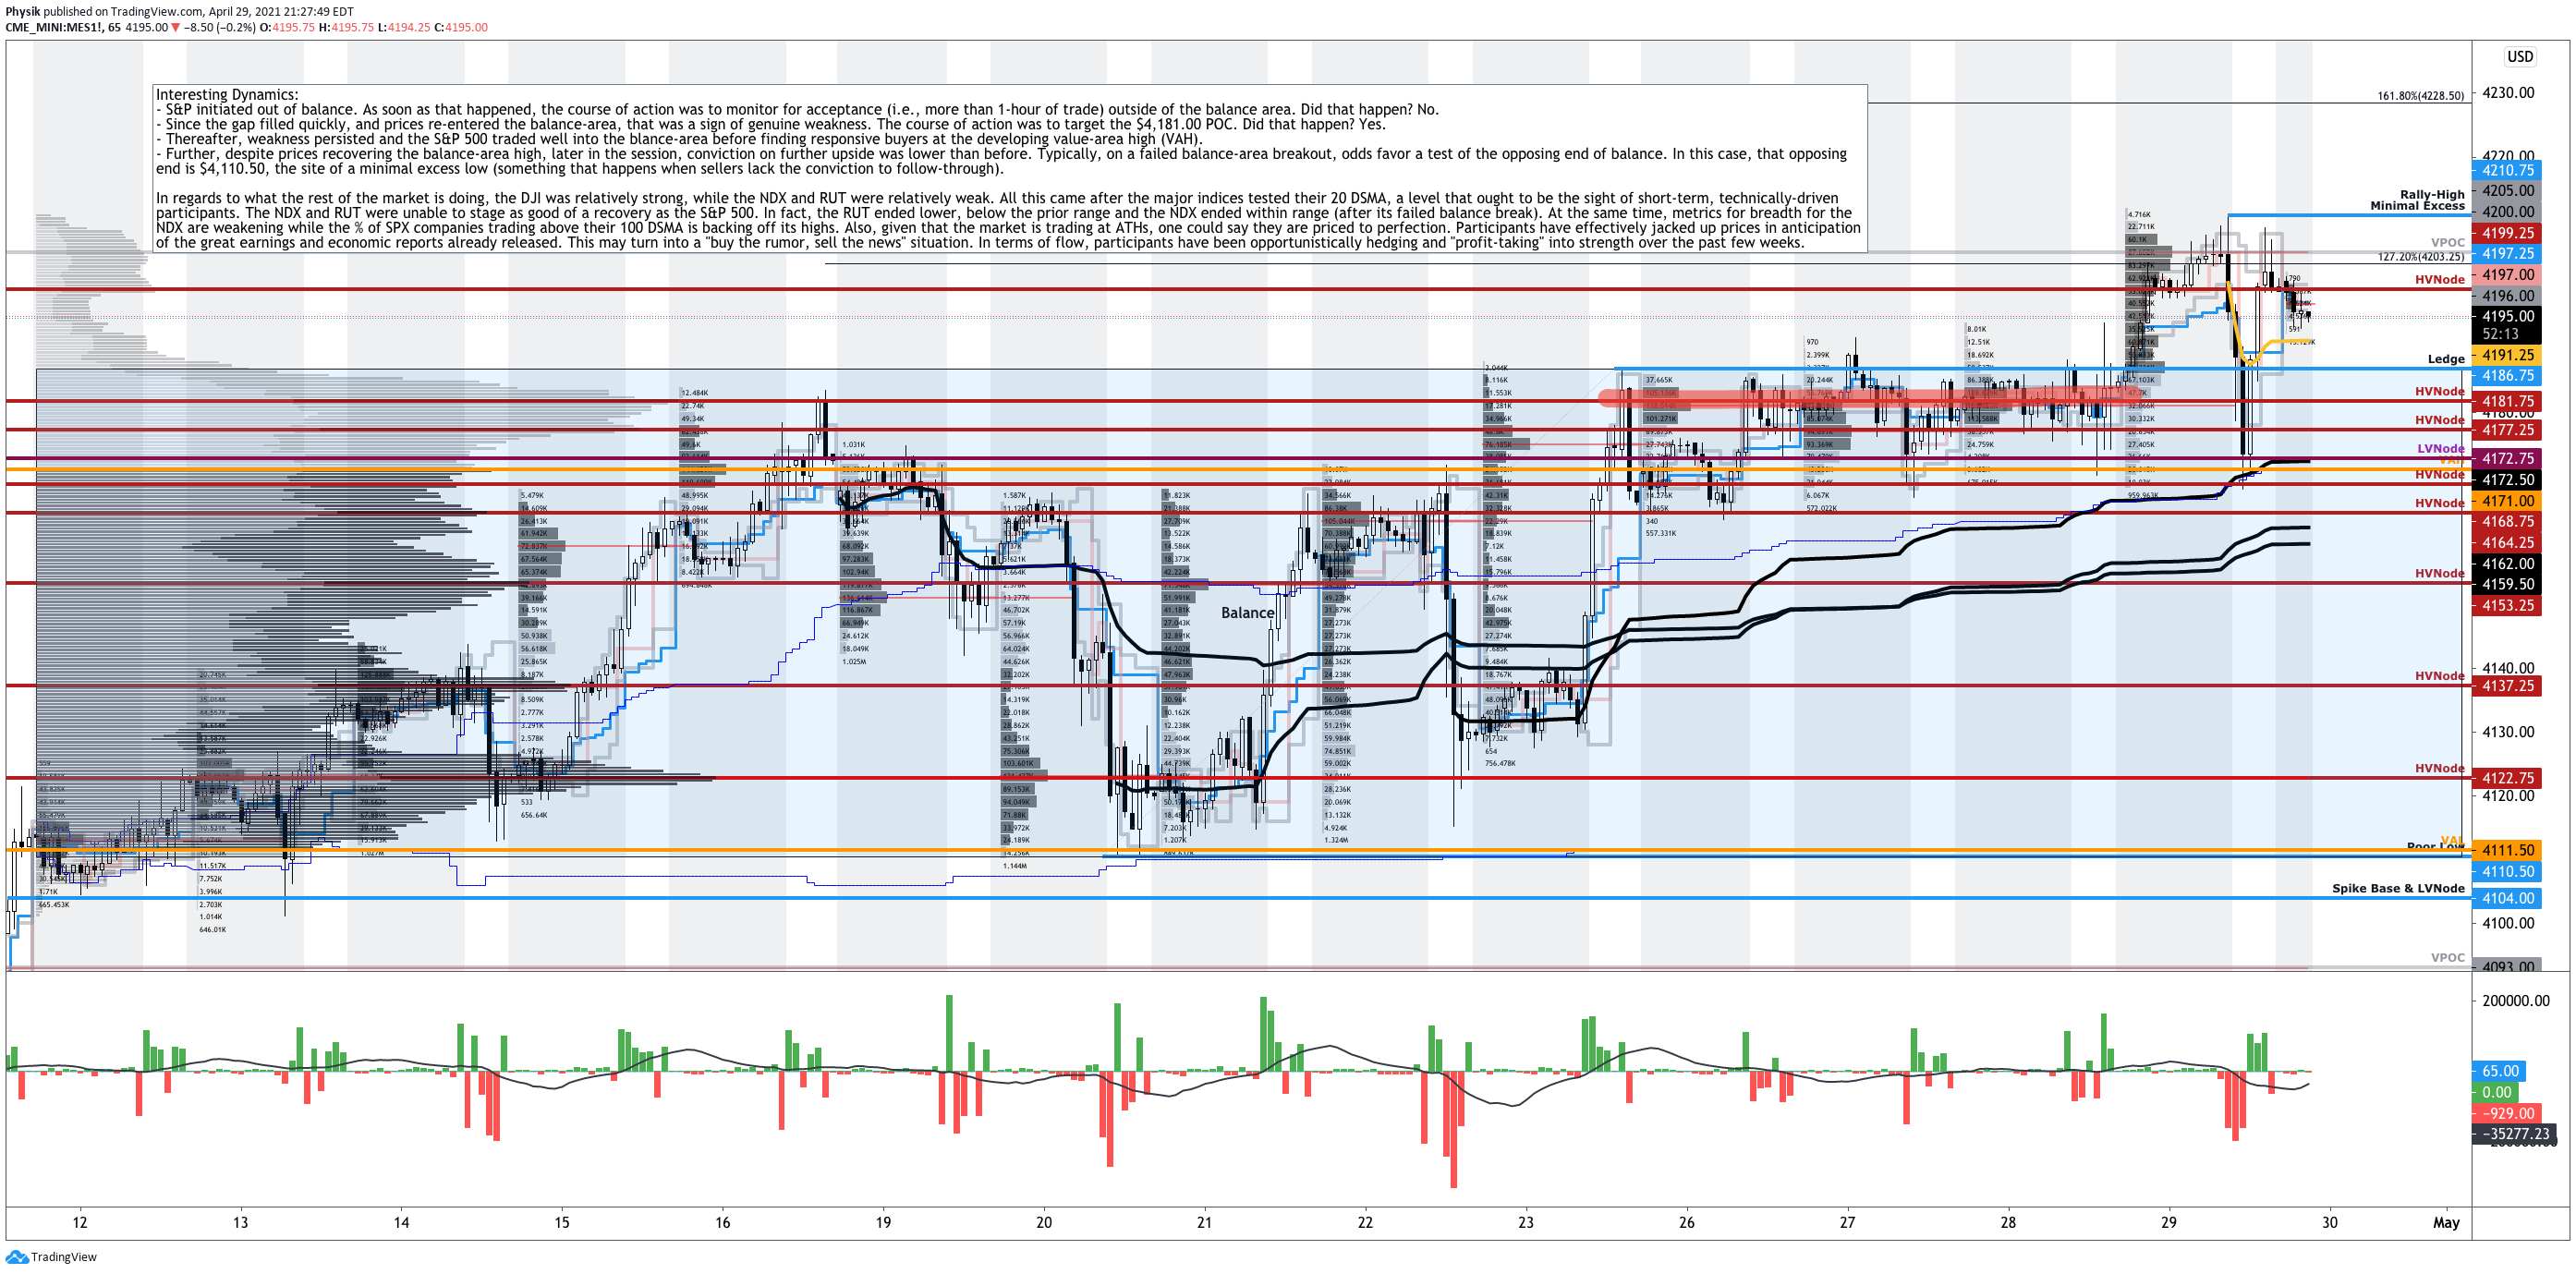
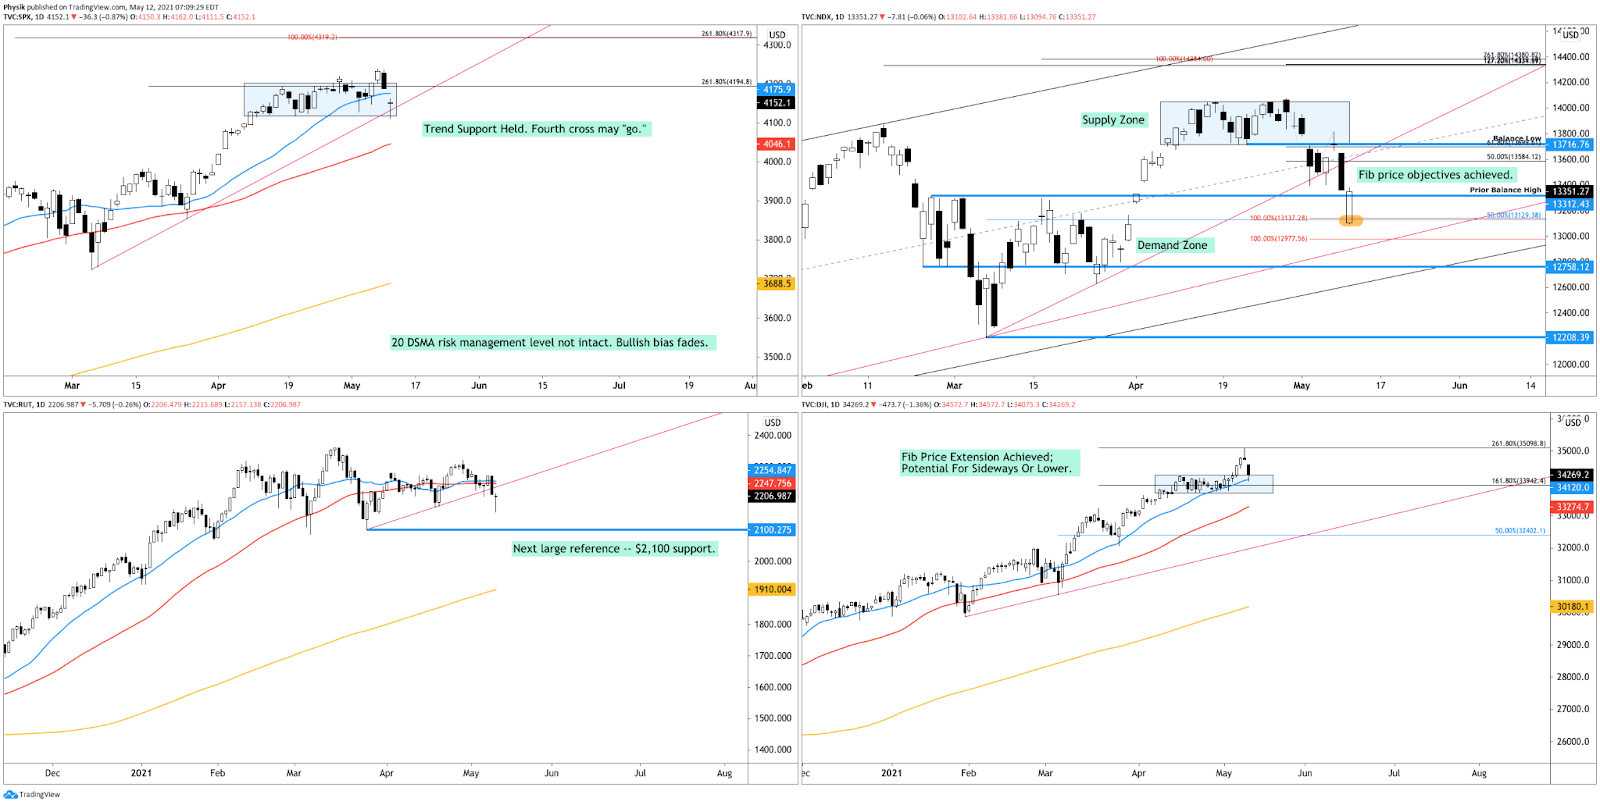
Adding, during the prior day’s regular trade, the worst-case outcome occurred, evidenced by the initiative trade down to the $4,110.50 minimal excess low. Thereafter, responsive buying brought the S&P 500 back in range. Later, participants found it most favorable to transact at last Tuesday’s POC, a development that suggests visually-driven technical traders may be out in full force.
Initiative Selling (Buying): Selling (buying) within or below (above) the previous day’s value area.

Excess: A proper end to price discovery; the market travels too far while advertising prices. Responsive, other-timeframe (OTF) participants aggressively enter the market, leaving tails or gaps which denote unfair prices.

Responsive Buying (Selling): Buying (selling) in response to prices below (above) an area of recent price acceptance.

POCs: POCs are valuable as they denote areas where two-sided trade was most prevalent. Participants will respond to future tests of value as they offer favorable entry and exit.
Further, this week’s early dip comes ahead of inflation figures that will provide clarity on emerging price pressures. Generally speaking, inflation and rates move inverse to each other. Low rates stimulate demand for loans (i.e., borrowing money more attractive). With the rapid recovery, though, market participants are fearful that rates may have to rise to protect the economy from overheating.
That’s pretty significant.
Higher rates may reduce the present value of future earnings, making stocks, especially those that are high growth, less attractive. To note, however, rates haven’t budged much since March. Rates on the 10 Year T-Note sit well below their March high.
That said, here is a quote to sum current conditions: “For an economy coming out of a pandemic, normal rules don’t apply,” said Matthew Cady, an investment strategist at Brooks Macdonald. “For broad sustained inflation you really need to see much tighter labor markets, and the bottom line is that the CPI out-turn due this week is very unlikely to change that picture.”
Further, for today, participants can trade from the following frameworks.
In the best case, the S&P 500 trades sideways or higher; activity above the $4,141.00 POC targets first the $4,163.00 POC and then the $4,177.25 composite high volume (HVNode) pivot. Initiative trade beyond the pivot could reach as high as the $4,224.75 HVNode.
Volume Areas: A structurally sound market will build on past areas of high volume. Should the market trend for long periods of time, it will lack sound structure (identified as a low volume area which denotes directional conviction and ought to offer support on any test).

If participants were to auction and find acceptance into areas of prior low volume, then future discovery ought to be volatile and quick as participants look to areas of high volume for favorable entry or exit.
In the worst case, the S&P 500 trades sideways or lower; activity below the $4,141.00 POC targets first the $4,103.00 excess low. Thereafter, if no response, participants may look for responses at the $4,128.00 and $4,093.00 POCs.
At this juncture, it pays not to be involved; the risk-to-reward of establishing new swing positions, in a tight trading range, is poor. Responsive trade is the course of action. Only after trading beyond the HVNode pivot, or excess low, may participants have the conviction to participate in initiative trades.


News And Analysis
Commodities | Colonial faces deadline to decide on hacked pipeline restart. (BBG)
Politics | Israel and Hamas escalate deadly strikes as the U.S. calls for calm. (BBG)
Markets | SPAC fees to support banks through 2022 even as deals dry up. (BBG)
Markets | COVID-19 concerns, chip sell-off roil the Taiwanese stock market. (WSJ)
Markets | SEC warning over bitcoin futures risks in mutual fund investments. (BBG)
Markets | A higher U.S. corporate tax rate is not a key credit risk driver. (Fitch)
What People Are Saying
Innovation And Emerging Trends
Economy | Housing-market surge is making the cheapest homes the hottest. (WSJ)
Markets | Media account Litquidity Capital is the Meme King of Wall Street. (VOX)
FinTech | eBay joined the NFT frenzy, will allow sale of NFTs on its platform. (REU)
About
Renato founded Physik Invest after going through years of self-education, strategy development, and trial-and-error. His work reporting in the finance and technology space, interviewing leaders such as John Chambers, founder, and CEO, JC2 Ventures, Kevin O’Leary, businessman and Shark Tank host, Catherine Wood, CEO and CIO, ARK Invest, among others, afforded him the perspective and know-how very few come by.
Having worked in engineering and majored in economics, Renato is very detailed and analytical. His approach to the markets isn’t built on hope or guessing. Instead, he leverages the unique dynamics of time and volatility to efficiently act on opportunity.
Disclaimer
At this time, Physik Invest does not manage outside capital and is not licensed. In no way should the materials herein be construed as advice. Derivatives carry a substantial risk of loss. All content is for informational purposes only.