Categories
Commentary

Daily Brief For October 12, 2021

Market Commentary

Equity index futures recover after Monday’s liquidation and brief overnight follow-through. Commodities were mixed and bonds were sideways to higher.

  • Market positioning for an EOY rally?
  • Ahead: Job openings, inflation data.
  • New feature to view real-time levels.

What Happened: U.S. stock index futures recover from earlier bearishness, absent impactful fundamental narratives.

Ahead is data on the job openings (10:00 AM ET) and the median expected 3-year inflation rate (11:00 AM ET). 
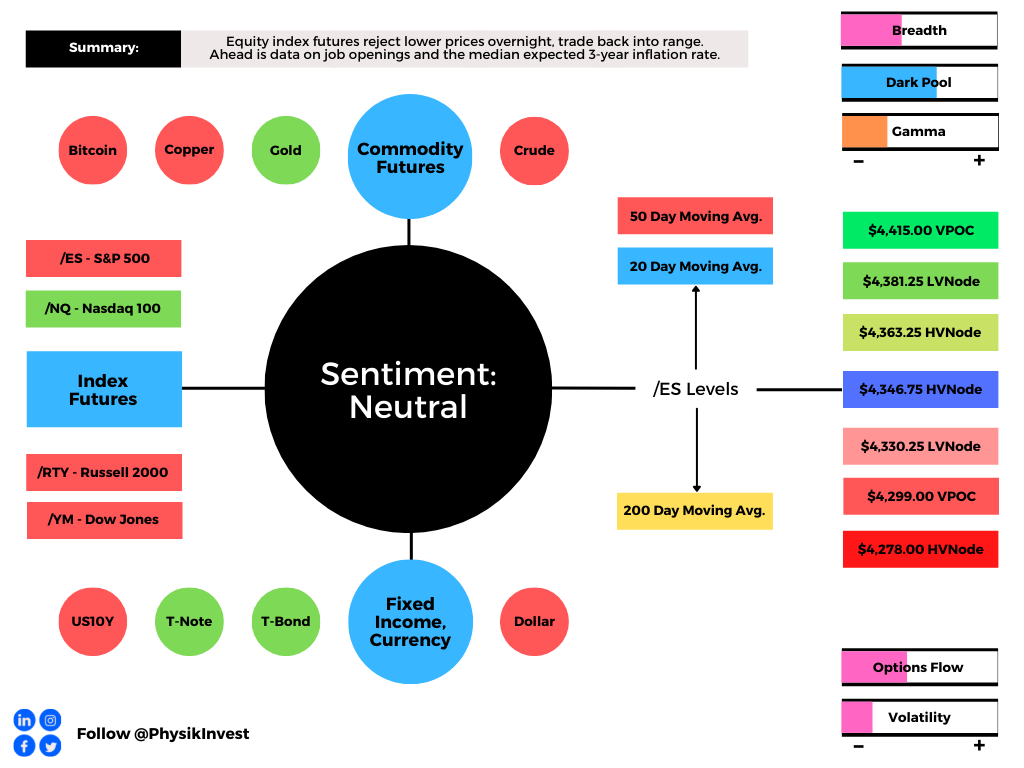
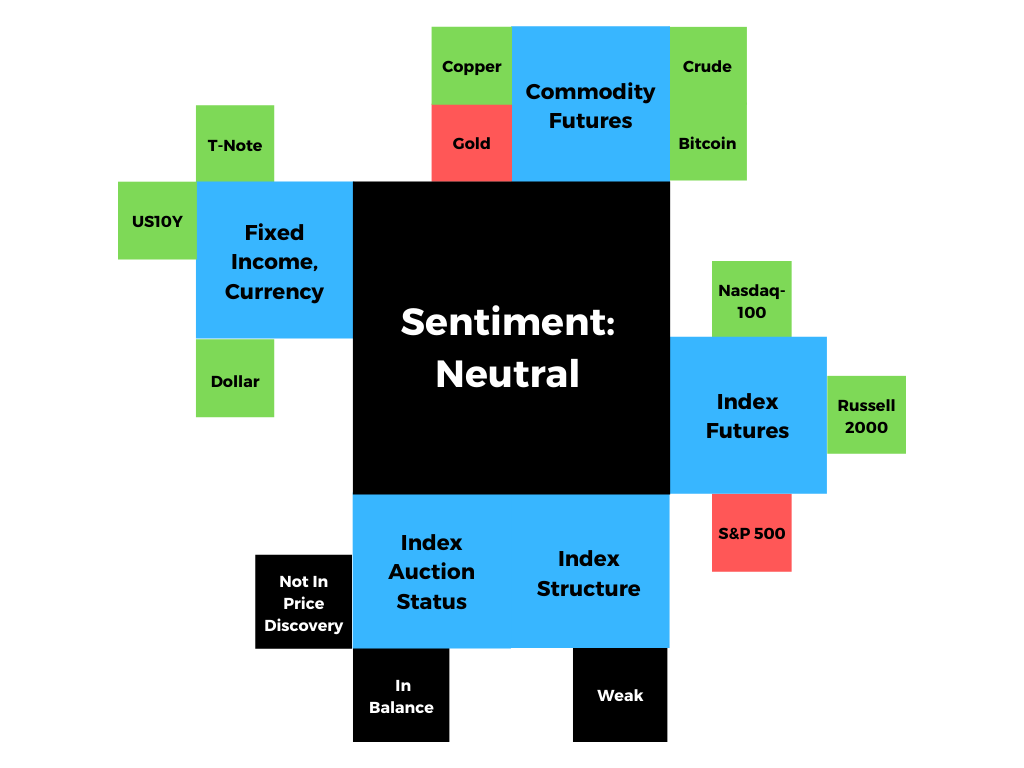
Graphic updated 6:30 AM ET. Sentiment Neutral if expected /ES open is inside of the prior day’s range. /ES levels are derived from the profile graphic at the bottom of the following section. SqueezeMetrics Dark Pool Index (DIX) and Gamma (GEX) calculations are based on where the prior day’s reading falls with respect to the MAX and MIN of all occurrences available. A higher DIX is bullish. At the same time, the lower the GEX, the more (expected) volatility. SHIFT data used for S&P 500 (INDEX: SPX) options activity. Note that options flow is sorted by the call premium spent; if more positive then more was spent on call options. Breadth reflects a reading of the prior day’s NYSE Advance/Decline indicator. VIX reflects a current reading of the CBOE Volatility Index (INDEX: VIX) from 0-100.

What To Expect: As of 6:30 AM ET, Tuesday’s regular session (9:30 AM – 4:00 PM EST) in the S&P 500 may open inside of prior-range and -value, suggesting a limited potential for immediate directional opportunity.

This comes after a volatile Monday.

At the outset, initiative sellers painted themselves into a corner at the convergence of the $4,363.25 high volume area (HVNode) pivot and an anchored volume-weighted average price.

Note: Liquidity algorithms are benchmarked and programmed to buy and sell around VWAPs, a metric highly regarded by chief investment officers, among others, for quality of trade.

After participants failed to muster the wherewithal to take prices lower, the S&P 500 then endured a rapid short-covering rally intraday – as evidenced by emotional, multiple distribution profile structures – before the momentum from covering shorts faded.

Thereafter, the S&P 500 liquidated, leaving behind a minimal excess high just south of the $4,408.75 low volume area (LVNode) and $4,415.00 untested point of control (VPOC).

Despite the spike and weak close, there was a minimal separation in value (i.e., the area where 70% of the day’s volume occurred); in other words, though participants valued lower prices, the knee-jerk, end-of-day move was not validated by increased trade at lower price levels.

Overnight exploration provided that validation before a massive change in tone after about 2:00 AM ET. Thereafter, indices recovered the prior day’s close.
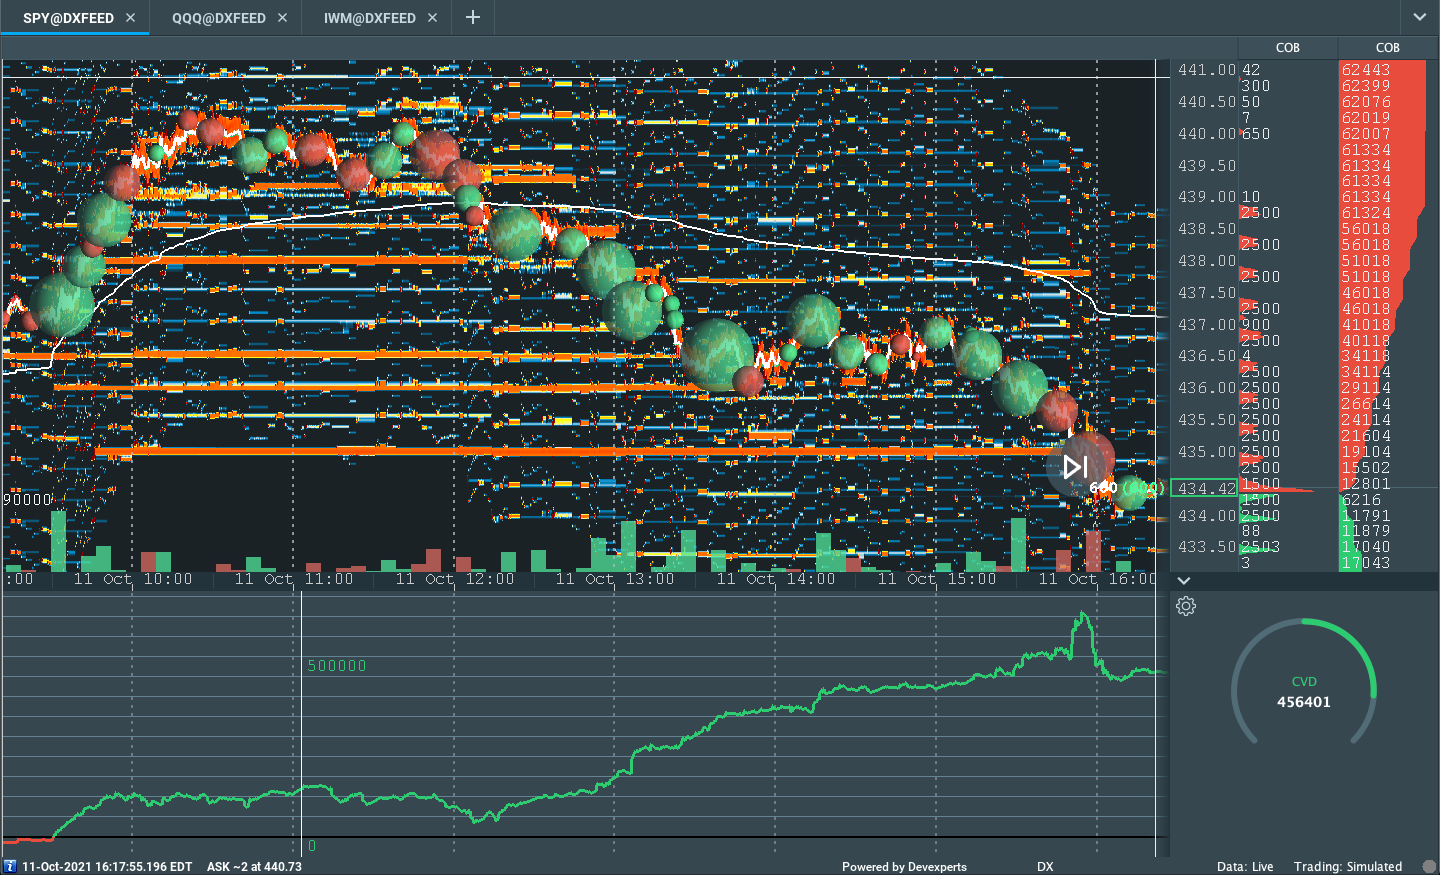
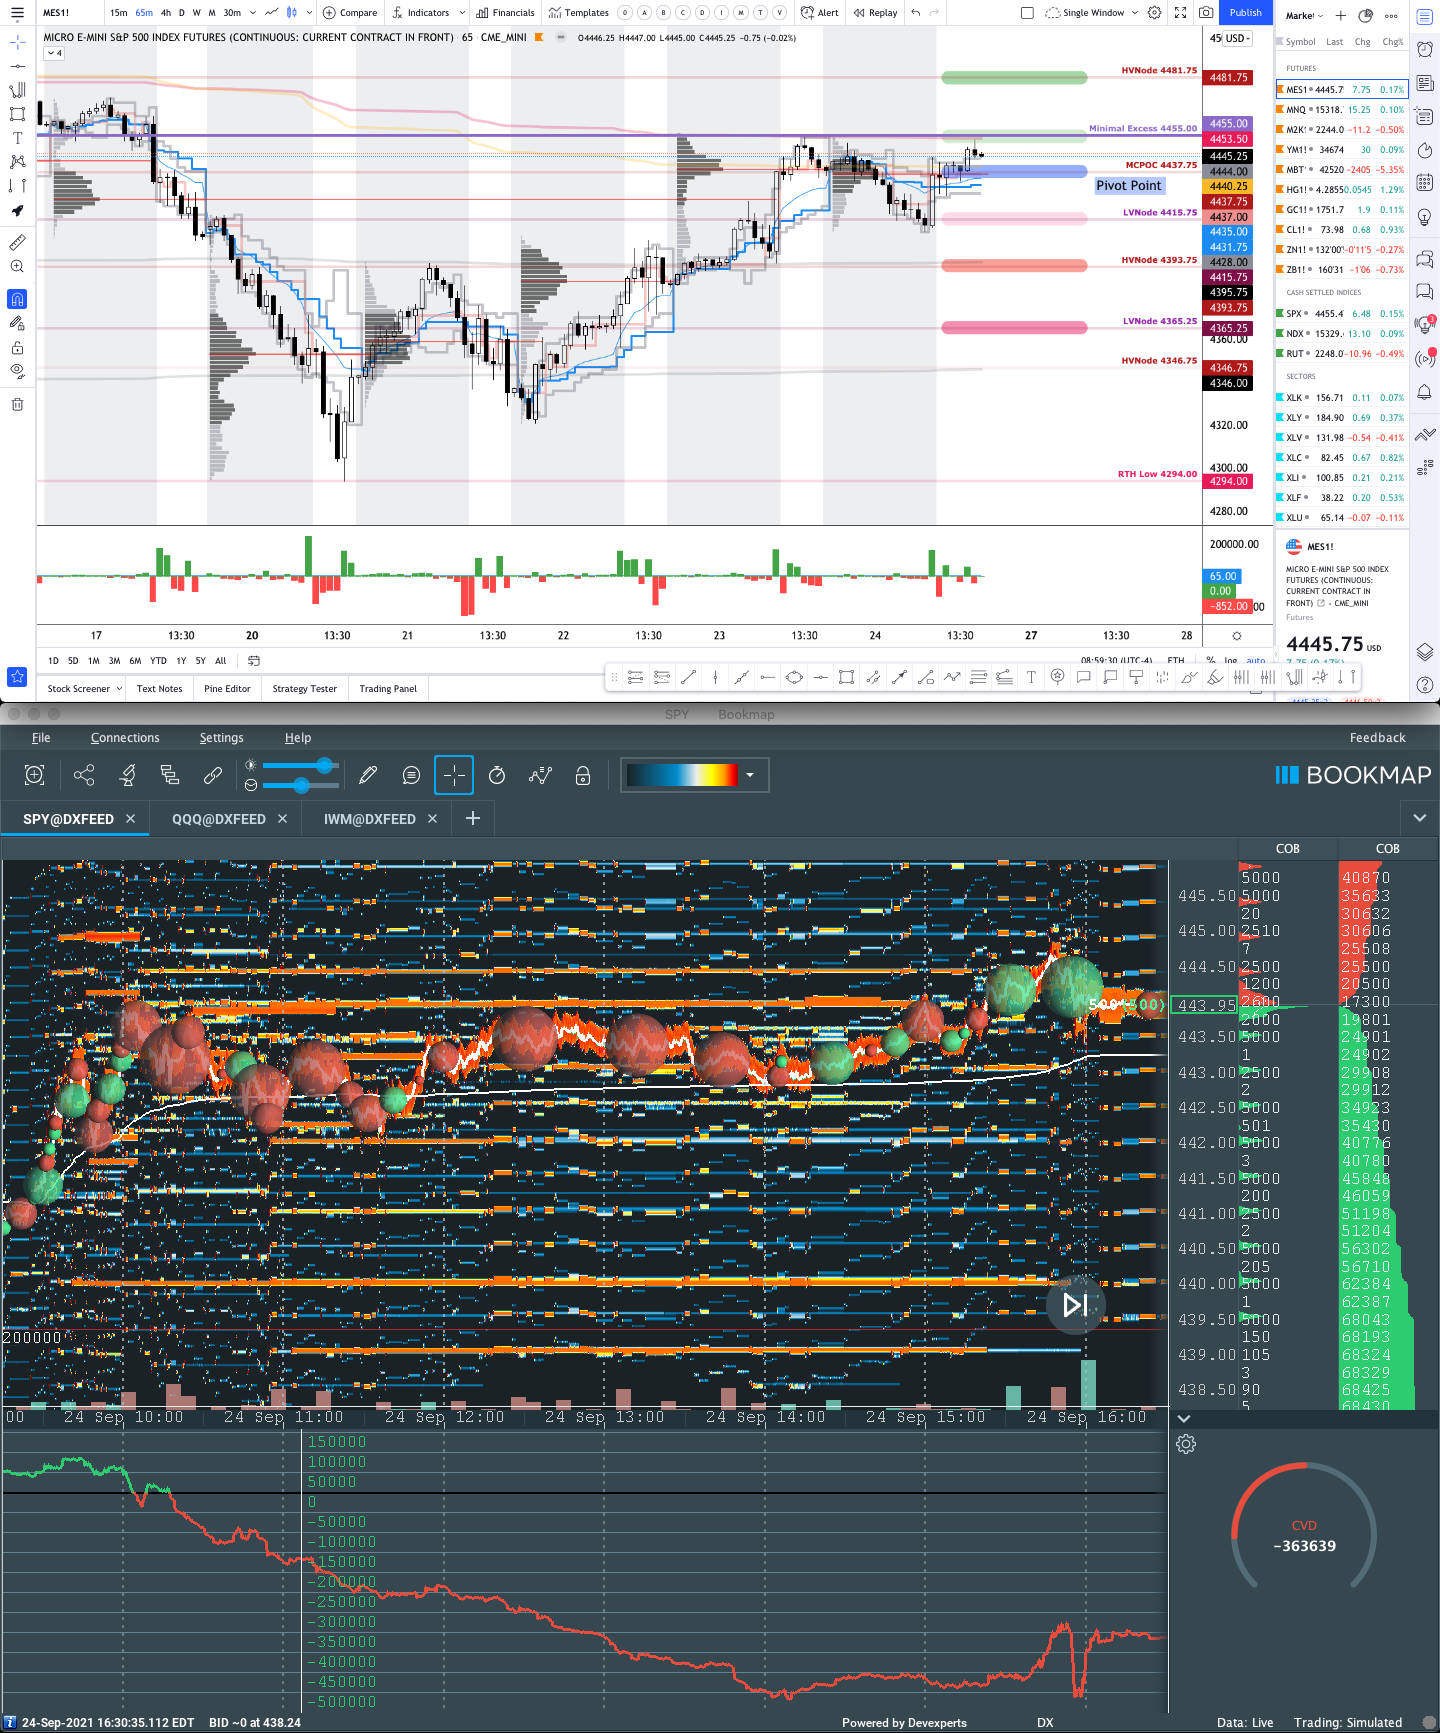
Graphic: Divergent delta (i.e., non-committed selling as measured by volume delta or buying and selling power as calculated by the difference in volume traded at the bid and offer) in SPDR S&P 500 ETF Trust (NYSE: SPY), one of the largest ETFs that track the S&P 500 index, via Bookmap. The readings are supportive of responsive trade or balance (i.e., rotational trade that suggests current prices offer favorable entry and exit).

Further, the aforementioned trade is happening in the context of a seasonal cycle of rebalancing and earnings, improvement among some positioning metrics, among other things. 

These themes support (1) October volatility and (2) an increased potential for sideways to higher trade.

In support is JPMorgan Chase & Co’s (NYSE: JPM) Marko Kolanovic, a big stock market bull; “We believe that this was the last significant wave, and an effective end to the pandemic,” he said.

Kolanovic prefers economically sensitive shares over technology and growth stocks. 

In opposition is Morgan Stanley’s (NYSE: MS) Mike Wilson who is on the side of pressured earnings, as a result of higher labor and material costs.

“Higher rates and a stronger USD have led to multiple compression, a process that remains unfinished, in our view,” he said in a note featured by The Market Ear. “Whether the final chapter of the mid-cycle transition ends with a 10% or 20% correction in the S&P 500 will be determined by how much earnings growth decelerates or has to outright decline (i.e., the Ice). We are gaining confidence in a sharper deceleration but the timing is more uncertain.”

Moreover, for today, participants may make use of the following frameworks.

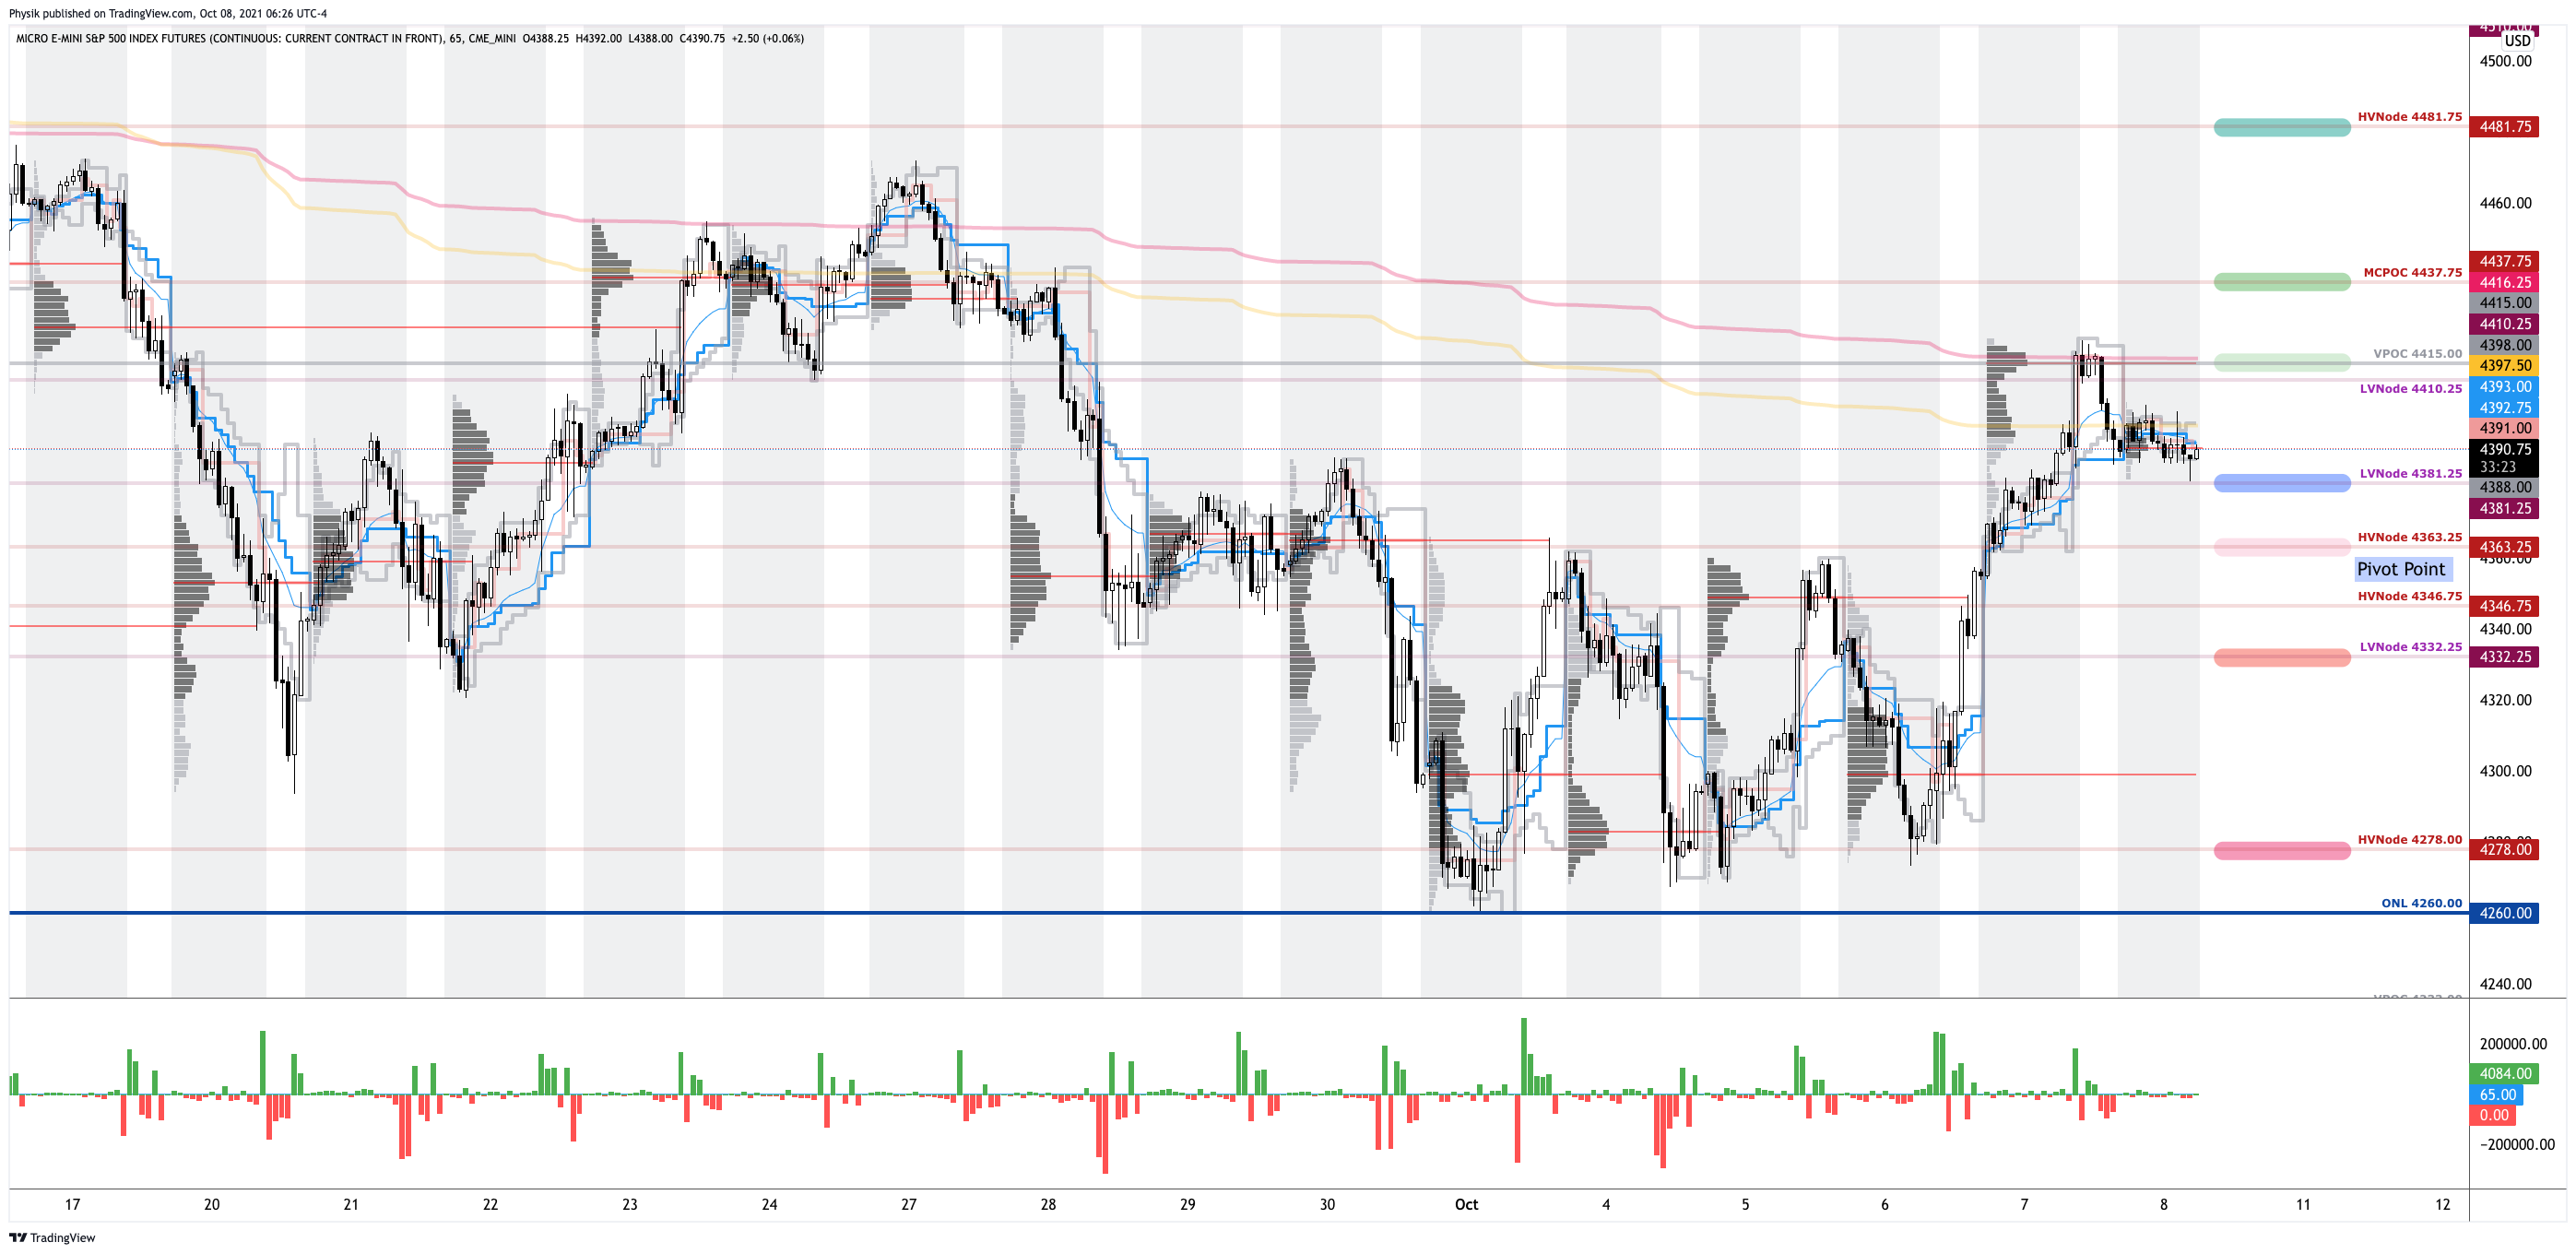
In the best case, the S&P 500 trades sideways or higher; activity above the $4,346.75 HVNode invalidates Monday’s spike lower and puts in play the $4,363.25 HVNode. Initiative trade beyond the $4,363.25 HVNode could reach as high as the $4,381.25 LVNode and $4,415.00 VPOC, or higher.

In the worst case, the S&P 500 trades lower; activity below the $4,346.75 HVNode puts in play the $4,330.25 LVNode. Initiative trade beyond the LVNode could reach as low as the $4,299.00 VPOC and $4,278.00 HVNode, or lower.

Click here to load today’s real-time key levels into the web-based TradingView charting platform. Please note that all levels are derived using the 65-minute timeframe.
Graphic: 65-minute profile chart of the Micro E-mini S&P 500 Futures updated 6:30 AM ET.

Definitions

Spikes: Spike’s mark the beginning of a break from value. Spikes higher (lower) are validated by trade at or above (below) the spike base (i.e., the origin of the spike).

Volume Areas: A structurally sound market will build on areas of high volume (HVNodes). Should the market trend for long periods of time, it will lack sound structure, identified as low volume areas (LVNodes). LVNodes denote directional conviction and ought to offer support on any test. 

If participants were to auction and find acceptance into areas of prior low volume (LVNodes), then future discovery ought to be volatile and quick as participants look to HVNodes for favorable entry or exit.

POCs: POCs are valuable as they denote areas where two-sided trade was most prevalent in a prior day session. Participants will respond to future tests of value as they offer favorable entry and exit.

Balance (Two-Timeframe Or Bracket): Rotational trade that denotes current prices offer favorable entry and exit. Balance-areas make it easy to spot a change in the market (i.e., the transition from two-time frame trade, or balance, to one-time frame trade, or trend). 

Modus operandi is responsive trade (i.e., fade the edges), rather than initiative trade (i.e., play the break).

Excess: A proper end to price discovery; the market travels too far while advertising prices. Responsive, other-timeframe (OTF) participants aggressively enter the market, leaving tails or gaps which denote unfair prices.

Value-Area Placement: Perception of value unchanged if value overlapping (i.e., inside day). Perception of value has changed if value not overlapping (i.e., outside day). Delay trade in the former case.

News And Analysis

JPMorgan’s Kolanovic says stocks can handle $130 oil.

Chinese developers are faced with cuts to credit ratings.

Federal Reserve will wimp out on hikes despite inflation.

Evergrande skips 3rd round of bond coupon payments.

More clarity on inflation doesn’t mean the news is good.

What People Are Saying

About

After years of self-education, strategy development, and trial-and-error, Renato Leonard Capelj began trading full-time and founded Physik Invest to detail his methods, research, and performance in the markets. 

Additionally, Capelj is a finance and technology reporter. Some of his biggest works include interviews with leaders such as John Chambers, founder and CEO, JC2 Ventures, Kevin O’Leary, businessman and Shark Tank host, Catherine Wood, CEO and CIO, ARK Invest, among others.

Disclaimer

At this time, Physik Invest does not manage outside capital and is not licensed. In no way should the materials herein be construed as advice. Derivatives carry a substantial risk of loss. All content is for informational purposes only.
Categories
Commentary

Daily Brief For October 8, 2021

Market Commentary

Equity index futures sideways overnight. Volatility ebbs.

  • Senate passed debt-ceiling raise.
  • Ahead: NFP, unemployment data.
  • Clarity regarding tapering by Fed.
  • Responsive selling into RTH high.

What Happened: U.S. stock index futures auctioned sideways overnight alongside news that the Senate passed a short-term debt ceiling increase. 

Ahead is data on nonfarm payrolls, the unemployment rate, and average hourly earnings (8:30 AM ET), as well as wholesale inventories (10:00 AM ET).

Graphic updated 6:40 AM ET. Sentiment Neutral if expected /ES open is inside of the prior day’s range. /ES levels are derived from the profile graphic at the bottom of the following section. SqueezeMetrics Dark Pool Index (DIX) and Gamma (GEX) calculations are based on where the prior day’s reading falls with respect to the MAX and MIN of all occurrences available. A higher DIX is bullish. At the same time, the lower the GEX, the more (expected) volatility. SHIFT data used for S&P 500 (INDEX: SPX) options activity. Note that options flow is sorted by the call premium spent; if more positive then more was spent on call options. Breadth reflects a reading of the prior day’s NYSE Advance/Decline indicator. VIX reflects a current reading of the CBOE Volatility Index (INDEX: VIX) from 0-100.

What To Expect: As of 6:40 AM ET, Friday’s regular session (9:30 AM – 4:00 PM EST) in the S&P 500 may open inside of prior-range and -value, suggesting a limited potential for immediate directional opportunity.

During the prior day’s regular trade, on strong intraday breadth and divergent market liquidity metrics, the best case outcome occurred, evidenced by the expansion of range and value above the $4,410.25 low volume area (LVNode), between two key anchored-volume weighted average price (AVWAP) levels.

Into the price rise, however, we note that participants sold responsively (i.e., sold in response to prices printing above an area of recent acceptance or balance); as prices came into the resting liquidity (Graphic 2) – also the location of a key AVWAP in – at and around /ES $4,410.25 (SPY $441.00), buying and selling power as calculated by the difference in volume traded at the bid and offer diverged, markedly.

In other words, at the AVWAP – a metric highly regarded by chief investment officers, among other participants, for quality of trade – there were liquidity algorithms programmed to sell.

Why? Liquidity algorithms are benchmarked and programmed to buy and sell around VWAPs.
Graphic 1: SPDR S&P 500 ETF Trust (NYSE: SPY), one of the largest ETFs that track the S&P 500 index, encounters responsive selling at key volume-weighted average price levels. 
Graphic 2: Divergent delta (i.e., non-committed buying as measured by volume delta or buying and selling power as calculated by the difference in volume traded at the bid and offer) in SPDR S&P 500 ETF Trust (NYSE: SPY), one of the largest ETFs that track the S&P 500 index, via Bookmap. The readings are supportive of responsive trade or balance (i.e., rotational trade that suggests current prices offer favorable entry and exit).

This trade is significant because it suggests a willingness to slow price discovery and balance (i.e., trade sideways as participants look to establish an equilibrium in light of new information). 

We’re carrying forward the presence of a p-shaped emotional, multiple-distribution profile structure (i.e., old-money shorts covering) left behind prior initiative trade, as well as continued trade below the 20- and 50-day simple moving averages; these dynamics induce anxiety and stress for the technical-driven, weaker-handed buy-the-dip crowd.

Further, the aforementioned trade is happening as investors await key employment data that will provide context on what the Federal Reserve with respect to monetary policy.

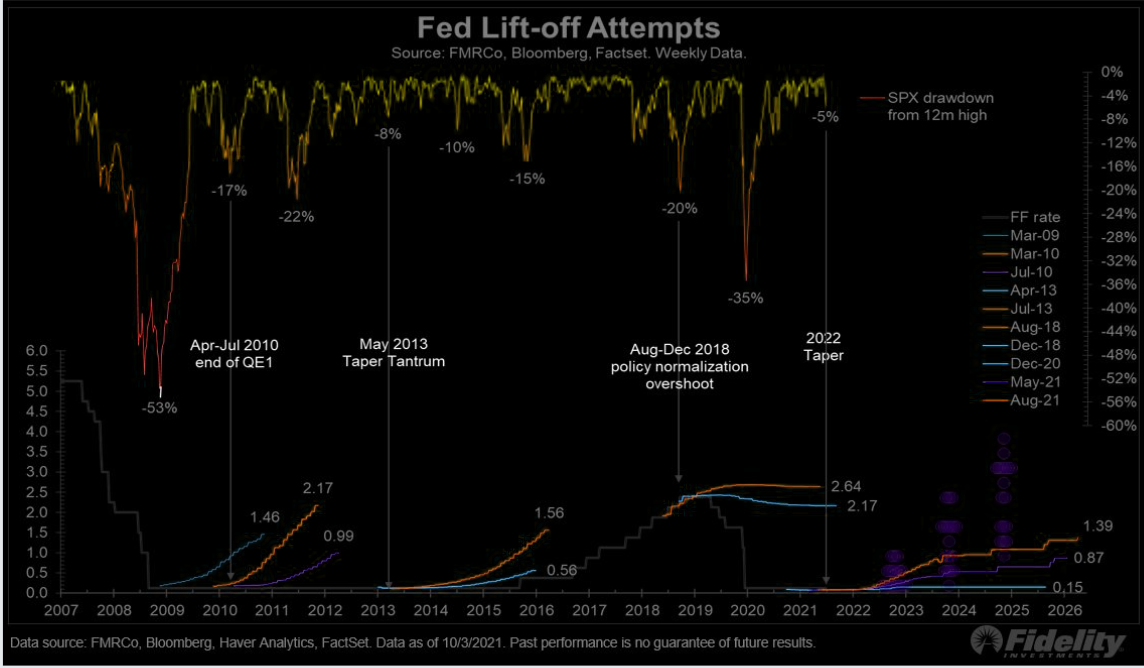
According to Bloomberg, Friday’s payroll data – which is likely to indicate strong improvement – likely emboldens tapering initiatives and improves the prospects of a rise in the Fed funds rate.

“What we see in the equity space is a lot of sensitivity to higher real yields,” Joseph Little, chief global strategist at HSBC Asset Management, said. “We are seeing policy normalization everywhere. That creates a little bit of a challenge for equity market because it does change the drivers of equity performance.”

Graphic 3: A “gentle reminder of the fact tapering matters,” via The Market Ear.

Adding, earlier this week, we noted that indices were best positioned for a vicious rebound as near-term downside discovery metrics likely reached a limit. These dynamics remain.

Graphic: ​​On October 5, 2021, according to SqueezeMetrics, “Net Put Delta (NPD) and the customer Vanna-Gamma Ratio (VGR) [] settled in a *bullish* place. Risk to the upside.”

Moreover, for today, participants may make use of the following frameworks.

In the best case, the S&P 500 trades sideways or higher; activity above the $4,381.25 low volume area (LVNode) puts in play the $4,415.00 untested point of control (VPOC). Initiative trade beyond the VPOC could reach as high as the $4,437.75 micro-composite point of control (MCPOC) and $4,481.75 high volume area (HVNode), or higher.

In the worst case, the S&P 500 trades lower; activity below the $4,381.25 LVNode puts in play the $4,363.25 HVNode. Initiative trade beyond the HVNode could reach as low as the $4,332.25 LVNode and $4,278.00 HVNode, or lower.

Graphic: 65-minute profile chart of the Micro E-mini S&P 500 Futures updated 6:30 AM ET.

Definitions

Balance (Two-Timeframe Or Bracket): Rotational trade that denotes current prices offer favorable entry and exit. Balance-areas make it easy to spot a change in the market (i.e., the transition from two-time frame trade, or balance, to one-time frame trade, or trend). 

Modus operandi is responsive trade (i.e., fade the edges), rather than initiative trade (i.e., play the break).

MCPOCs: POCs are valuable as they denote areas where two-sided trade was most prevalent over numerous day sessions. Participants will respond to future tests of value as they offer favorable entry and exit.

More On Volume-Weighted Average Prices (VWAPs): A metric highly regarded by chief investment officers, among other participants, for quality of trade. Additionally, liquidity algorithms are benchmarked and programmed to buy and sell around VWAPs.

POCs: POCs are valuable as they denote areas where two-sided trade was most prevalent in a prior day session. Participants will respond to future tests of value as they offer favorable entry and exit.

Short Covering: The profile shape suggests participants were “too” short and had poor location.

Volume Areas: A structurally sound market will build on areas of high volume (HVNodes). Should the market trend for long periods of time, it will lack sound structure, identified as low volume areas (LVNodes). LVNodes denote directional conviction and ought to offer support on any test. 

If participants were to auction and find acceptance into areas of prior low volume (LVNodes), then future discovery ought to be volatile and quick as participants look to HVNodes for favorable entry or exit.

News And Analysis

Short-term increase in U.S. debt ceiling passes Senate.

U.S. special operations rotating into Taiwan for training.

Moody’s: Kicking [debt limits] not too far down the road.

Energy Transition: Demand destruction stalking Europe.

APAC CBDCs – pathways plenty, destination uncertain.

Vaccinations and policy decisions are key to EM growth.

Richest Americans flee Treasuries with holdings at lows.

Crypto Mystery: Where’s the $69B behind Tether’s coin.

What People Are Saying

About

After years of self-education, strategy development, and trial-and-error, Renato Leonard Capelj began trading full-time and founded Physik Invest to detail his methods, research, and performance in the markets. 

Additionally, Capelj is a finance and technology reporter. Some of his biggest works include interviews with leaders such as John Chambers, founder and CEO, JC2 Ventures, Kevin O’Leary, businessman and Shark Tank host, Catherine Wood, CEO and CIO, ARK Invest, among others.

Disclaimer

At this time, Physik Invest does not manage outside capital and is not licensed. In no way should the materials herein be construed as advice. Derivatives carry a substantial risk of loss. All content is for informational purposes only.

Categories
Commentary

Weekly Brief For September 26, 2021

Editor’s Note: Market commentaries to pause until Monday, October 4, 2021, due to travel commitments. As a result, I go in-depth today and offer a strong trade idea for the week ahead.

Also, if you’re in a rush, focus on the bolded text!

Market Commentary

Equity index futures recover. Yields break higher. Volatility implodes.

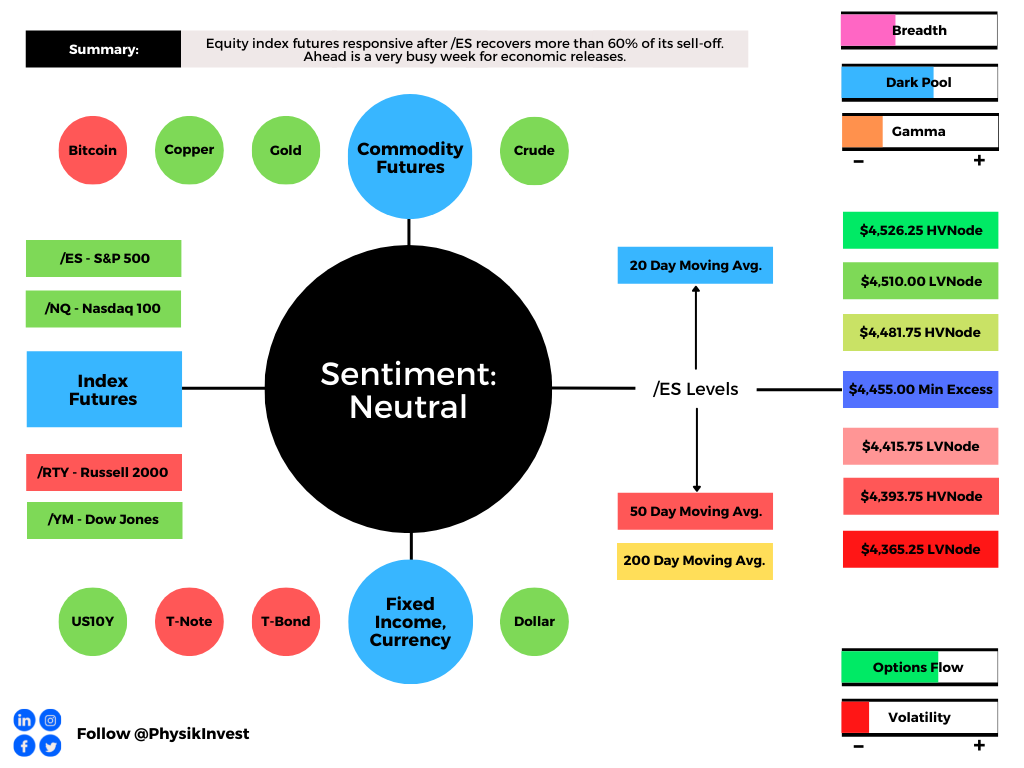
  • Indices have recovered 60% of sell-off.
  • Buying-the-dip psychology is breaking.
  • Watching: Taper, shutdown, debt risks.
  • Fed may stamp out life in the economy.
  • Trade Idea: Capitalizing on TSLA skew.

What Happened: After a series of outlier moves, U.S. stock index futures ended the week range-bound when responsive sellers – as confirmed by measures of market liquidity – stepped in at key moving averages and anchored volume-weighted average price levels.

Ahead is a busy week in terms of economic releases; important data on durable goods orders, consumer confidence, home sales, personal income and spending, PCE deflators, as well as manufacturing data are slated to come out.

Graphic updated 9:00 AM ET Sunday. Sentiment Neutral if expected /ES open is inside of the prior day’s range. /ES levels are derived from the profile graphic at the bottom of the following section. SqueezeMetrics Dark Pool Index (DIX) and Gamma (GEX) calculations are based on where the prior day’s reading falls with respect to the MAX and MIN of all occurrences available. A higher DIX is bullish. At the same time, the lower the GEX, the more (expected) volatility. SHIFT data used for S&P 500 (INDEX: SPX) options activity. Note that options flow is sorted by the call premium spent; if more positive then more was spent on call options. Breadth reflects a reading of the prior day’s NYSE Advance/Decline indicator. VIX reflects a current reading of the CBOE Volatility Index (INDEX: VIX) from 0-100.

What To Expect: Be patient with me, there is a lot to condense. 

During the prior week’s trade, on mostly strong intraday breadth and divergent market liquidity metrics, equity index futures briefly liquidated; the S&P 500 went as low as $4,300.00. 

Then, a swift recovery ensued; participants took back nearly 60% of the most recent sell-off.

During the recovery process, the S&P 500 – as evidenced by emotional, multiple distribution profile structures – established a minimal excess rally high at $4,455.00 before the momentum from covering shorts was overpowered by responsive selling at key areas of resting liquidity, at and around $4,455.00, or so. 

Friday’s session, however, resolved some of the aforementioned emotional structures through what’s called the “cave-fill” process; revisiting, repairing, and strengthening – building out areas of high volume (HVNodes), or value – areas low volume (LVNodes). 

To put it simply, the cave-fill process widened the area deemed favorable to transact at by an increased share of participants. This is a good development.

Graphic: Divergent delta (i.e., non-committed buying as measured by volume delta or buying and selling power as calculated by the difference in volume traded at the bid and offer) in SPDR S&P 500 ETF Trust (NYSE: SPY), one of the largest ETFs that track the S&P 500 index, via Bookmap. The readings are supportive of responsive trade or balance (i.e., rotational trade that suggests current prices offer favorable entry and exit).

Further, the aforementioned trade is happening in the context of narratives surrounding a taper to Federal Reserve asset purchases, a government shutdown, and the debt ceiling.

The implications of these themes on price are contradictory; to elaborate, in the most recent meeting of the Federal Open Market Committee (FOMC), it was announced that the economy made substantial progress toward the central bank’s goals and, if progress continued as expected, a moderation in the pace of asset purchases was likely. 

“Powell said that the tapering process could be wrapped up by mid-2022, which would require either an earlier start or larger reductions,” Moody’s said. 

“In other words, as long as September employment isn’t a disaster, the Fed will begin tapering at its November meeting. Therefore, it would skip a formal announcement and a one-meeting delay to dive right into the tapering process. It seems we’re headed for an eight-month taper, or [a] $15 billion reduction per month.”

The Fed’s dot plot saw movement, too; there are increased odds of a rate hike in 2022.

In regards to the debt ceiling, which caused a kink in the Treasury bill curve and may portend financial market volatility if not resolved, Powell voiced concern, noting that it must be raised. 

This is a likely development given that “lawmakers know that voting against raising the debt ceiling would have enormous economic costs,” Moody’s noted.

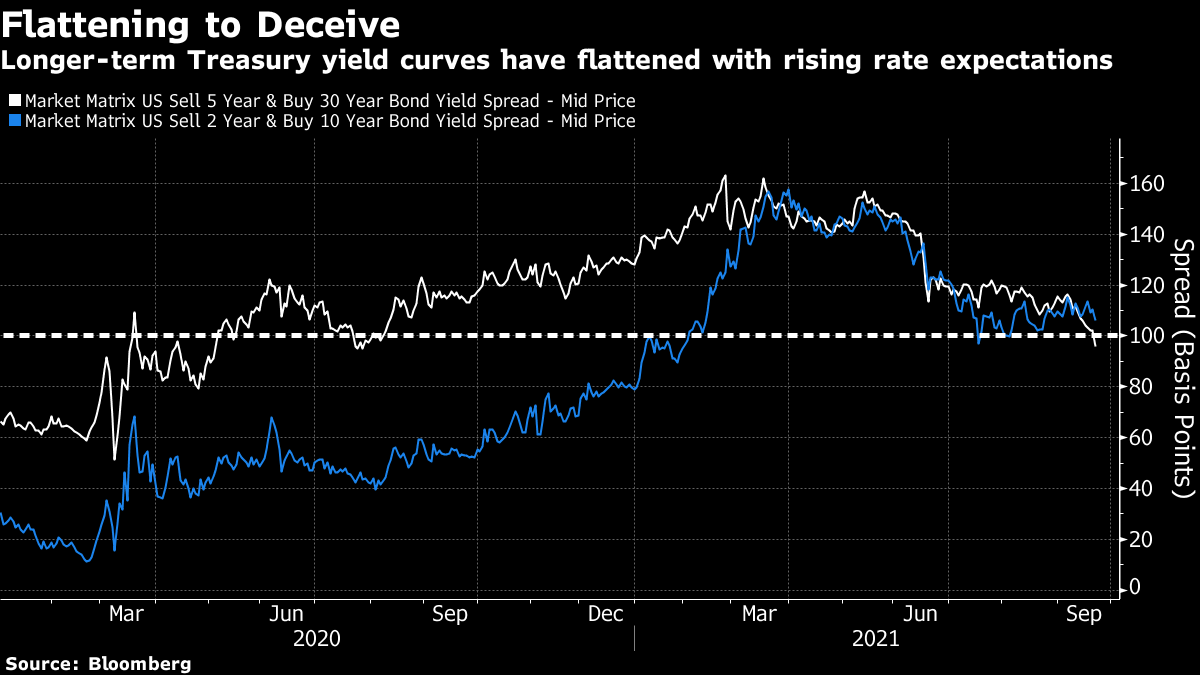
Graphic: “​​The spread between 5- and 30-year yields dropped below 100 basis points after the FOMC meeting, for the first time since just before last year’s Jackson Hole’s conference. Such a flat curve … signal[s] that the bond market thinks the Fed is going to make a hawkish mistake, and stamp out the life in the economy when previously there had been a belief that the Fed would be easy and let inflation move higher.” The source is Bloomberg.

Adding, after the September 17 options expiry which cut S&P 500 dealer gamma in half and opened the window to volatility, alongside threats posed by China’s Evergrande complications, the tone changed markedly, given a fraying in the buy-the-dip psychology.

While strategists at JPMorgan Chase & Co (NYSE: JPM) suggest the selling was knee-jerk and technical, the truth is that, according to Reuters, “global stock funds lost the most since March 2020 as investors moved in [favor] of cash where they [plowed] in $39.6 billion of funds.”

Still, in the face of comments by the Fed, as well as the Evergrande and debt ceiling debacle, the liquidation resolved some fragility with respect to positioning and stocks rallied, affirming the beliefs held by Goldman Sachs Group Inc’s (NYSE: GS) Peter Oppenheimer and HSBC Holdings Plc (NYSE: HSBC) strategists that dip-buying is a go as “we’re still in the relatively early stages of this economic cycle.” 

To put it differently, per one Bloomberg article, “the lasting impression … is that for markets the tapir no longer has the power to induce fear in the way that it did eight years ago, … [and] [t]he post-Evergrande bounce has some life in it. It’s no dead cat.” A 4,700 or 5,000 S&P 500, as some strategists see it, could be in the cards.

Moreover, for next week, participants may make use of the following frameworks.

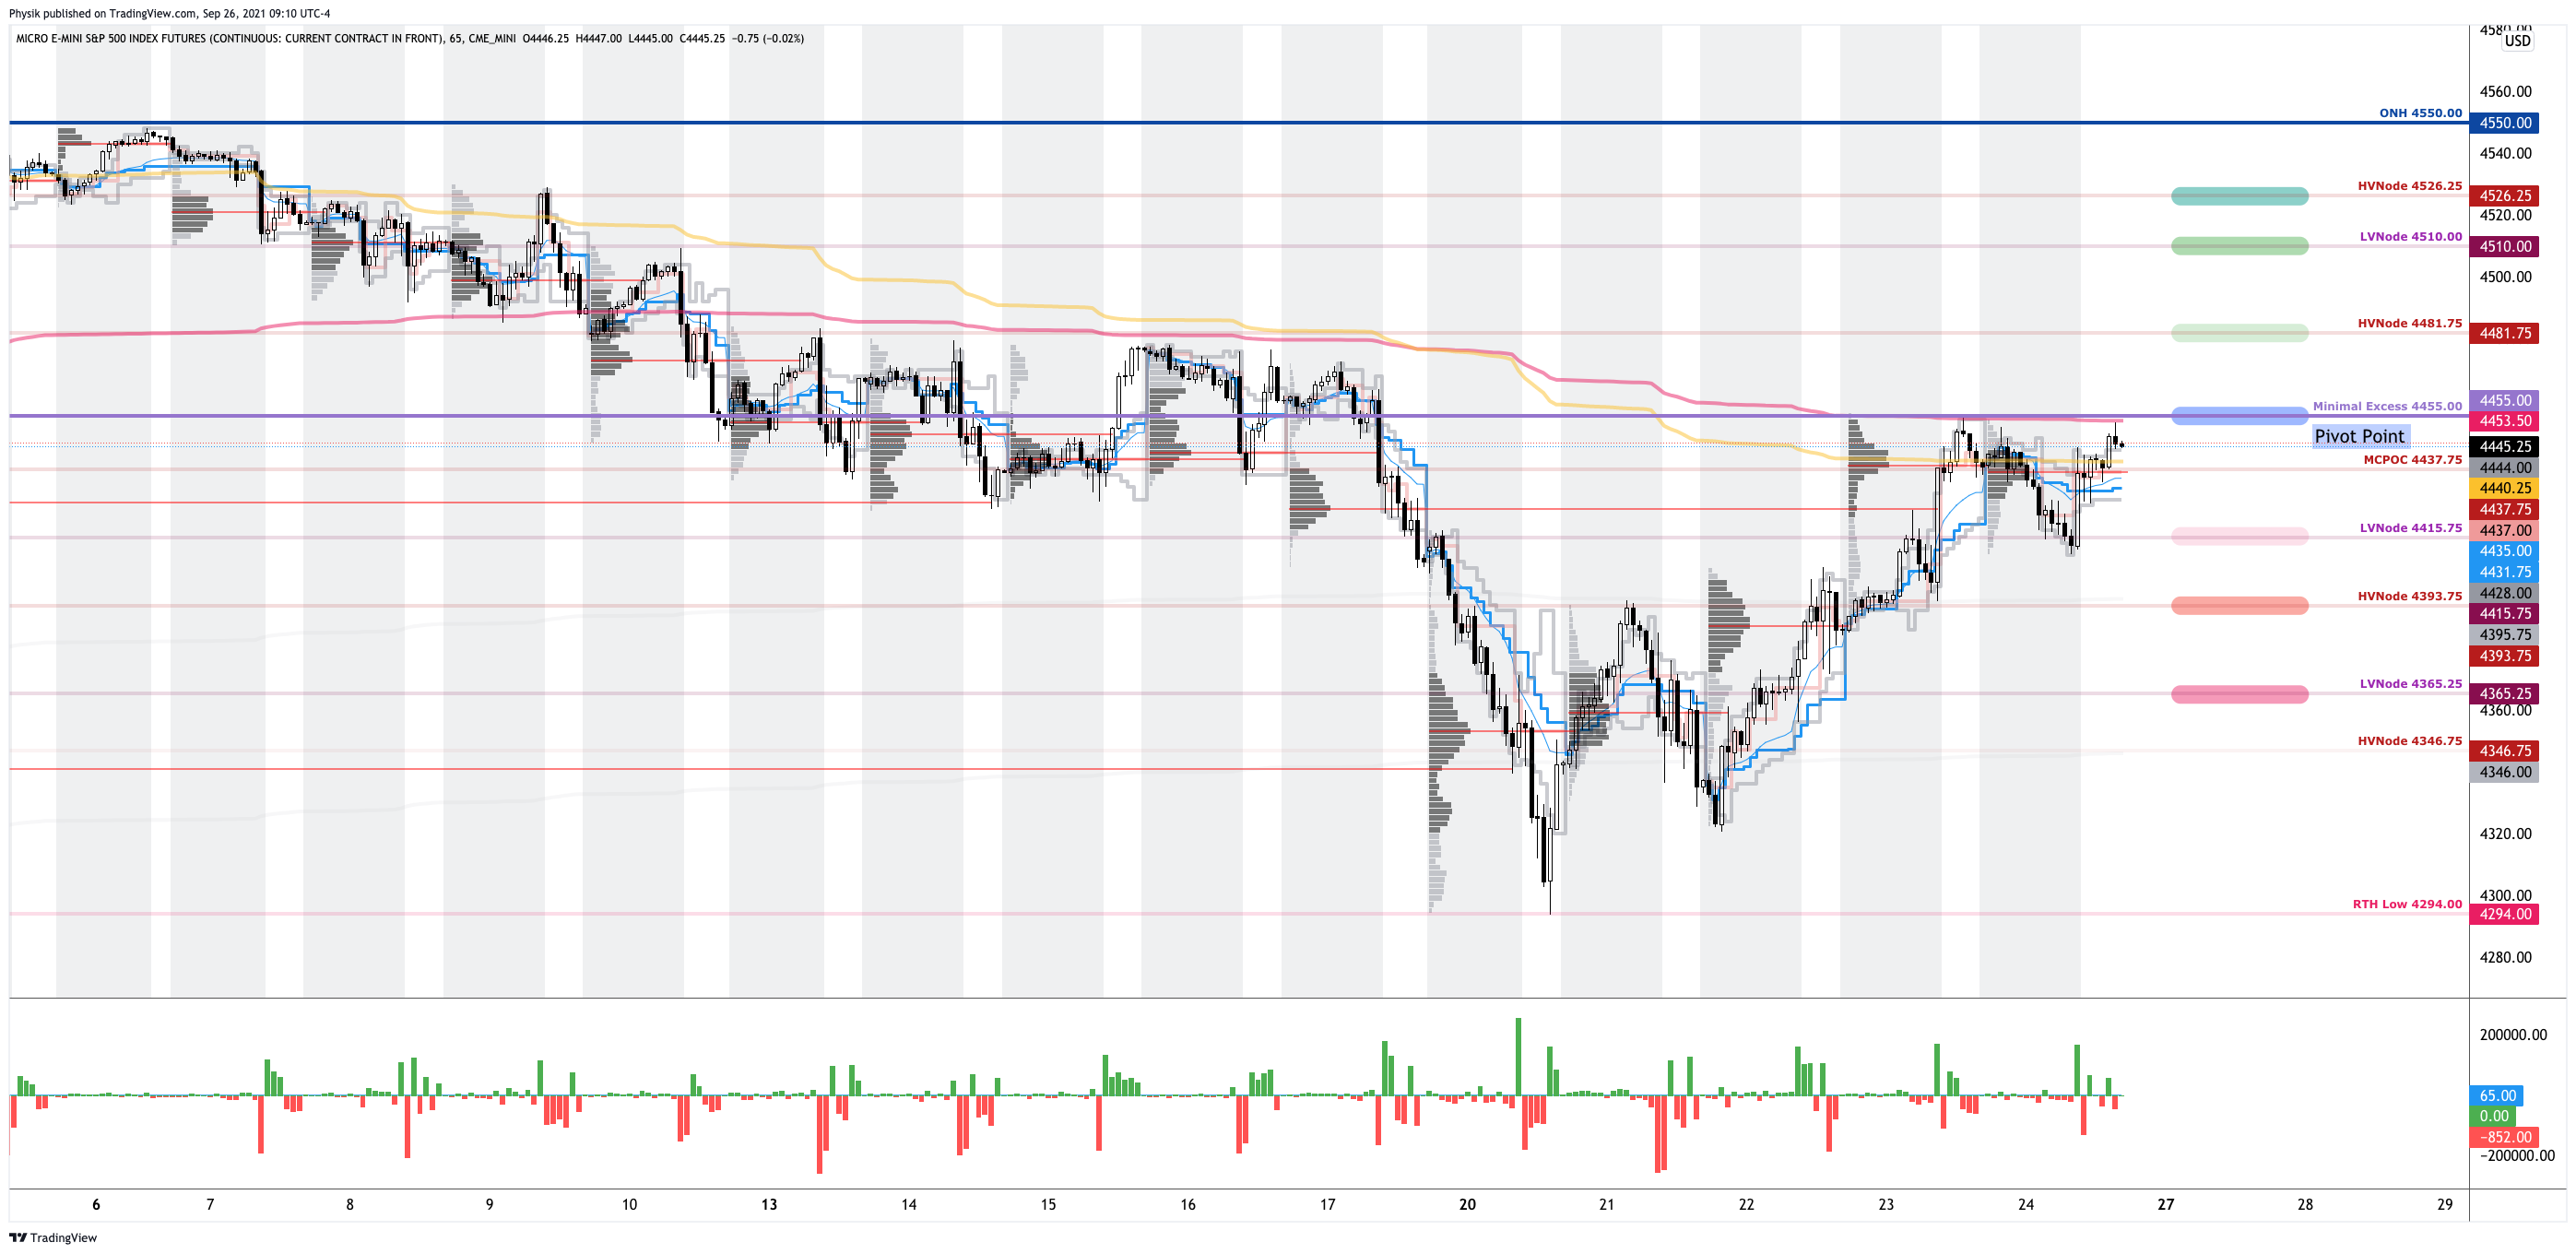
In the best case, the S&P 500 trades sideways or higher; activity above the $4,455.00 minimal excess high puts in play the $4,481.75 HVNode. Initiative trade beyond the HVNode could reach as high as the $4,510.00 LVNode and $4,526.25 HVNode, or higher.

In the worst case, the S&P 500 trades lower; activity below the $4,455.00 minimal excess high puts in play the $4,415.75 LVNode. Initiative trade beyond the LVNode could reach as low as the $4,393.75 HVNode and $4,365.25 LVNode, or lower.

Graphic: 65-minute profile chart of the Micro E-mini S&P 500 Futures updated 9:00 AM ET Sunday.

Definitions

Volume Areas: A structurally sound market will build on areas of high volume (HVNodes). Should the market trend for long periods of time, it will lack sound structure, identified as low volume areas (LVNodes). LVNodes denote directional conviction and ought to offer support on any test. 

If participants were to auction and find acceptance into areas of prior low volume (LVNodes), then future discovery ought to be volatile and quick as participants look to HVNodes for favorable entry or exit.

Gamma: Gamma is the sensitivity of an option to changes in the underlying price. 

Dealers that take the other side of options trades hedge their exposure to risk by buying and selling the underlying. 

When dealers are short-gamma, they hedge by buying into strength and selling into weakness. When dealers are long-gamma, they hedge by selling into strength and buying into weakness. 

The former exacerbates volatility. The latter calms volatility.

Options Expiration (OPEX): Option expiries mark an end to pinning (i.e, the theory that market makers and institutions short options move stocks to the point where the greatest dollar value of contracts will expire worthless) and the reduction dealer gamma exposure.

Excess: A proper end to price discovery; the market travels too far while advertising prices. Responsive, other-timeframe (OTF) participants aggressively enter the market, leaving tails or gaps which denote unfair prices.

More On Volume-Weighted Average Prices (VWAPs): A metric highly regarded by chief investment officers, among other participants, for quality of trade. Additionally, liquidity algorithms are benchmarked and programmed to buy and sell around VWAPs.

Rates: Low rates have to potential to increase the present value of future earnings making stocks, especially those that are high growth, more attractive. 

To note, inflation and rates move inversely to each other. 

Low rates stimulate demand for loans (i.e., borrowing money is more attractive). In conjunction with the rapid recovery, lower rates solicit hawkish commentary as policymakers look to inhibit inflation.

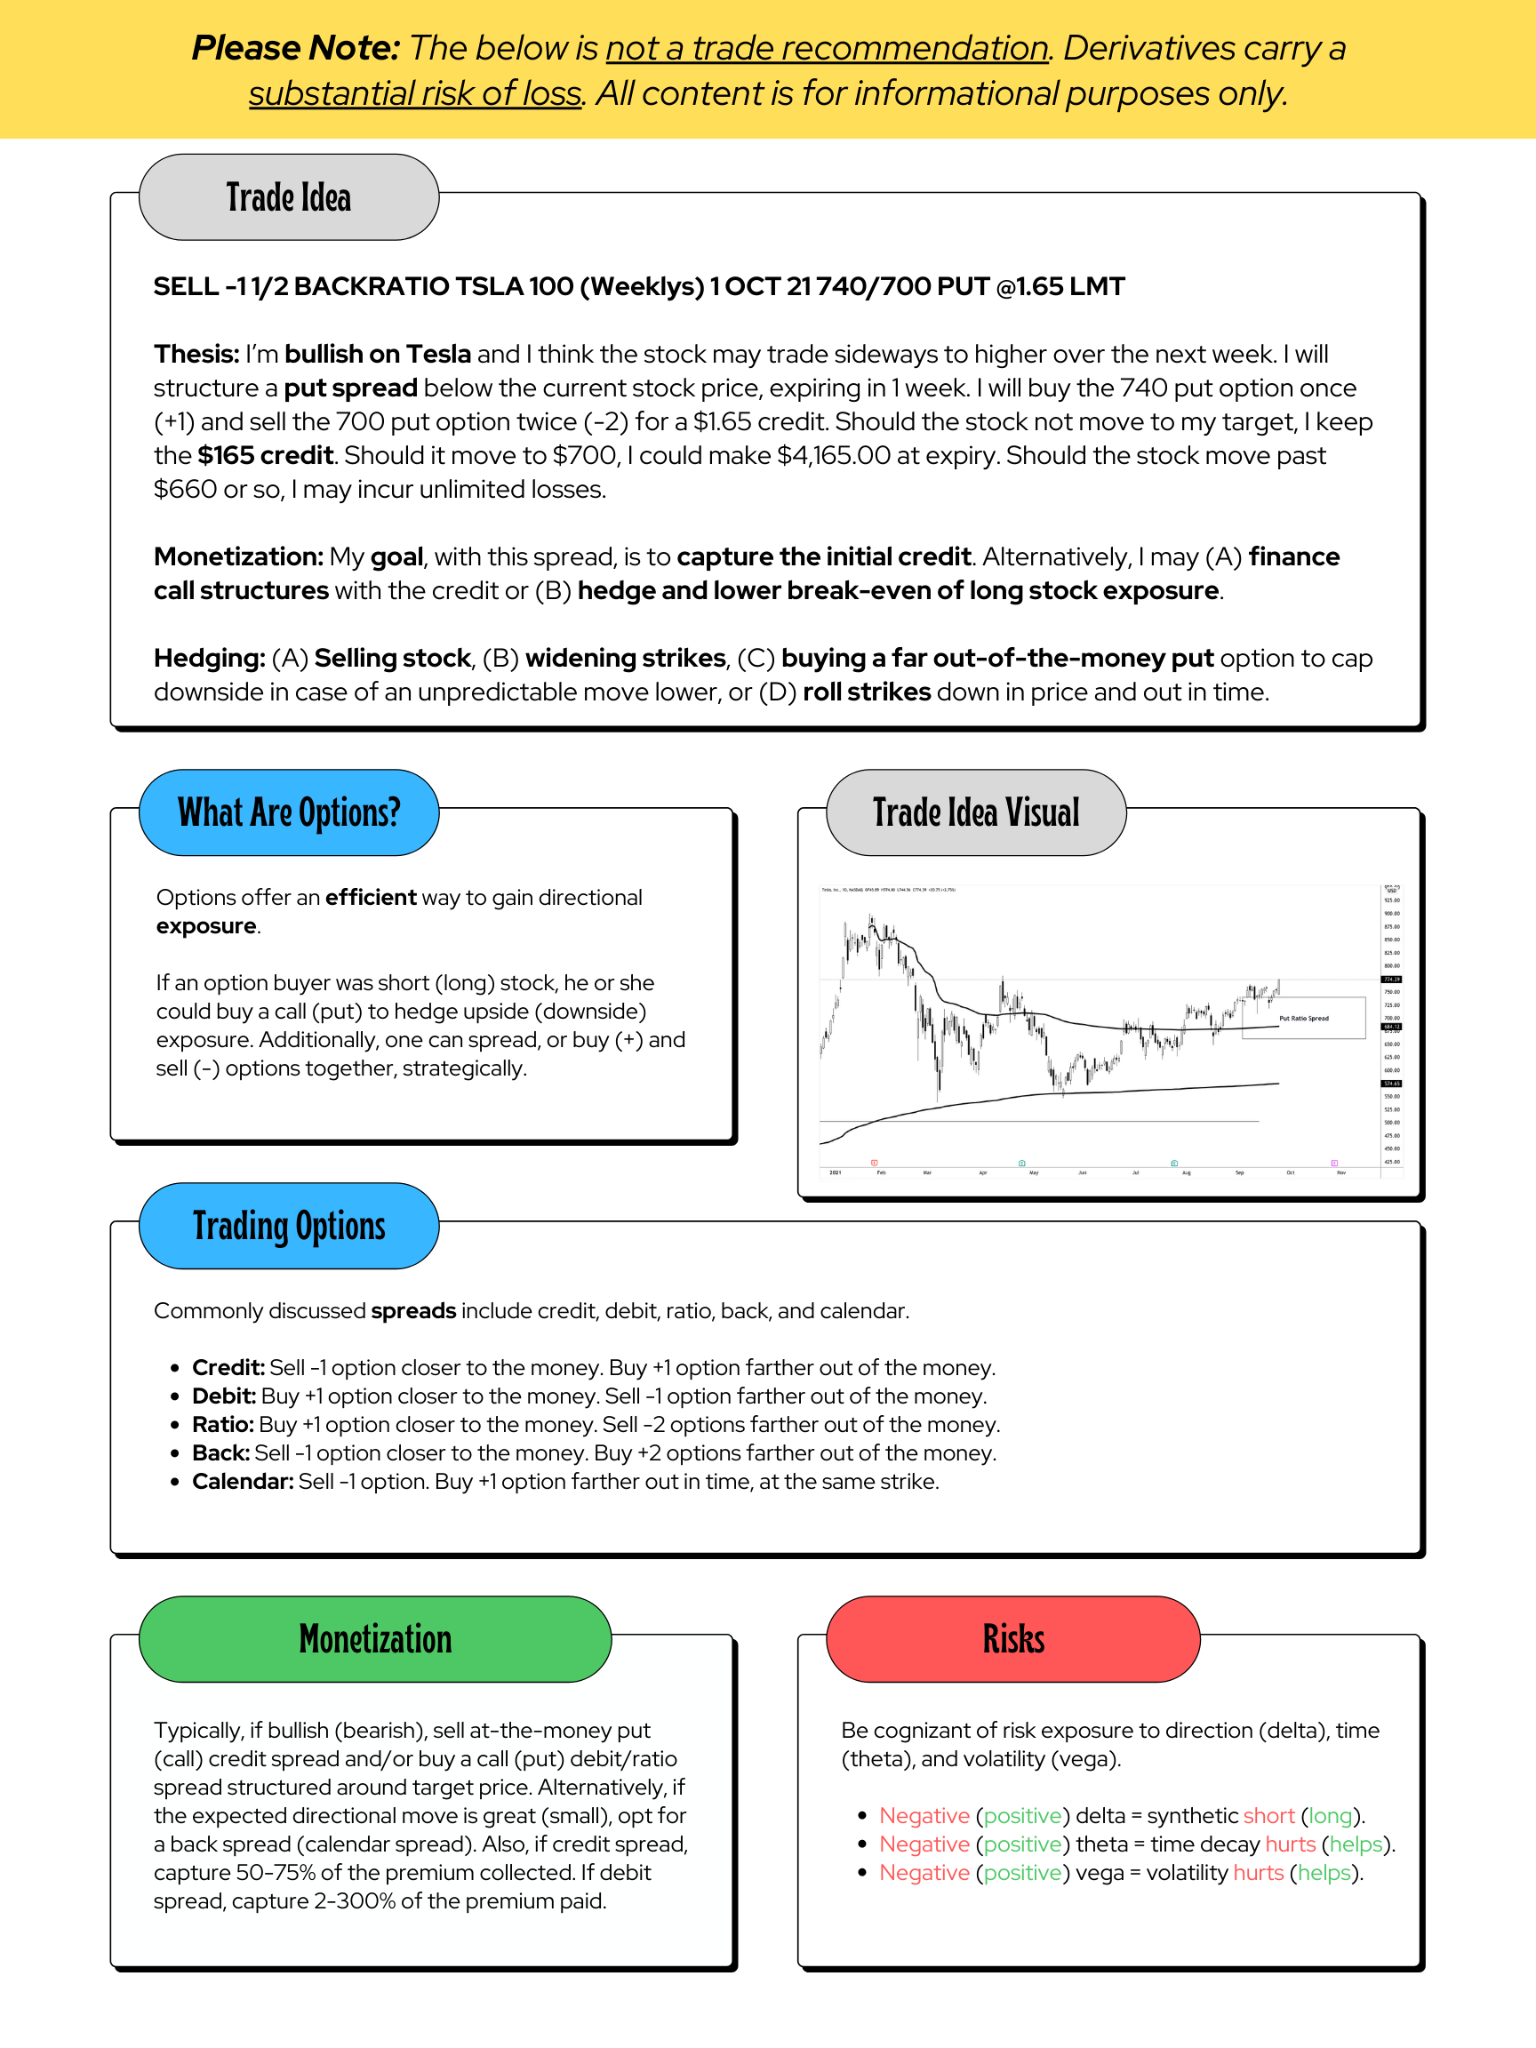
Weekly Trade Idea

News And Analysis

Weakening U.S. economy threatens swelling corporate debt mountain.

Ongoing debt limit fight is as much about 2022 politics as fiscal policy.

Alhambra Investments: Next steps to watch for a scarcity of collateral. 

From New York To Sydney: See the supply shocks spanning the globe.

Economic Outlooks U.S. Q4 2021: The rocket is beginning to level off.

Nancy Pelosi: The infrastructure plan will likely pass House this week. 

Treasuries at risk as Federal Reserve paves way for breakout in yields.

The SEC’s Gary Gensler doesn’t see cryptocurrencies lasting that long.

Bear market is unlikely, but stumble in stocks may lead to a bigger fall.

What People Are Saying

Let’s Hang Out

Salt Lake City, UT September 28-30

Las Vegas, NV October 1-3

About

After years of self-education, strategy development, and trial-and-error, Renato Leonard Capelj began trading full-time and founded Physik Invest to detail his methods, research, and performance in the markets. 

Additionally, Capelj is a finance and technology reporter. Some of his biggest works include interviews with leaders such as John Chambers, founder and CEO, JC2 Ventures, Kevin O’Leary, businessman and Shark Tank host, Catherine Wood, CEO and CIO, ARK Invest, among others.

Disclaimer

At this time, Physik Invest does not manage outside capital and is not licensed. In no way should the materials herein be construed as advice. Derivatives carry a substantial risk of loss. All content is for informational purposes only.

Categories
Commentary

Daily Brief For August 23, 2021

Market Commentary

Equity index and commodity futures trade higher overnight. Yields and VIX are higher, too.

  • Post-FOMC minutes recovery continues.
  • Ahead: CFNAI, Markit PMI, home sales.

What Happened: U.S. stock index futures auctioned higher, continuing their recovery from last week’s liquidation that intensified after the release of Federal Open Market Committee (FOMC) minutes. Leading the overnight price rise is the Russell 2000, a laggard in recent trade.

Ahead is data on the Chicago Fed National Activity Index (8:30 AM ET), Markit manufacturing and services PMI (9:45 AM ET), as well as existing home sales (10:00 AM ET). 

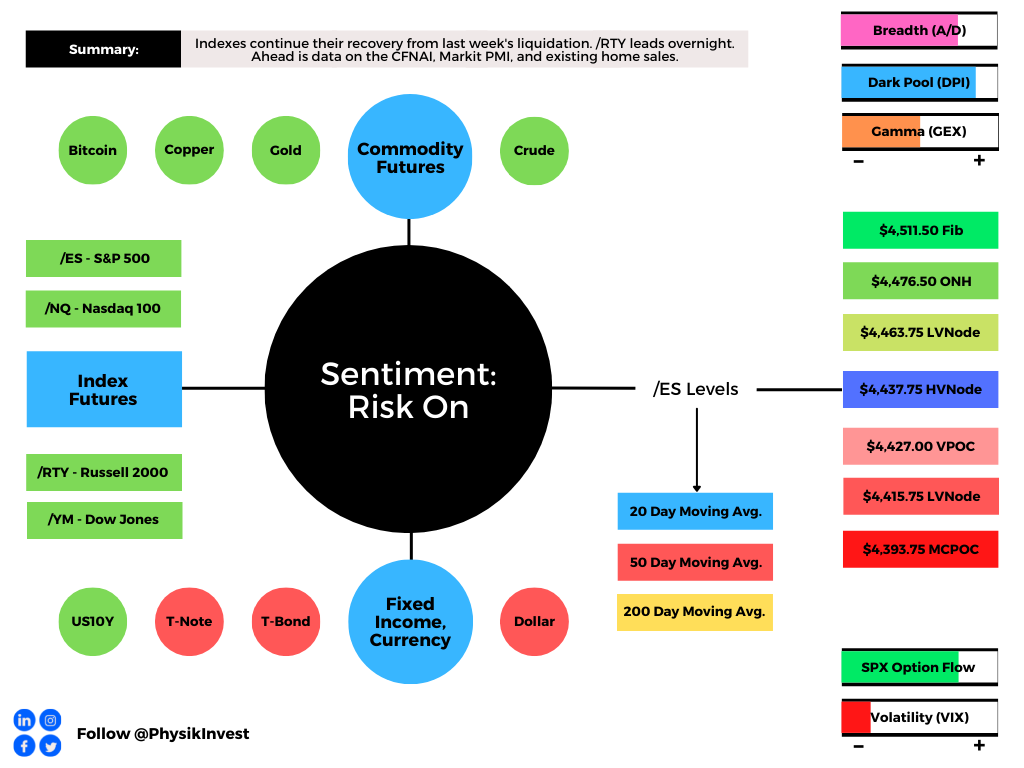
Graphic updated 6:40 AM ET. Sentiment Risk-On if expected /ES open is above the prior day’s range. See here for more on the Dark Pool Index (DPI) and Gamma (GEX). A higher DPI approximation is bullish. At the same time, the lower the GEX approximation, the more volatility. SHIFT data used for options activity approximation. Note that options flow is sorted by the call premium spent; if green and more positive then more was spent on call options. Breadth reflects a reading of the prior day’s Advance/Decline indicator. VIX reflects a current reading of the CBOE Volatility Index from 0-100.

What To Expect: As of 6:20 AM ET, Monday’s regular session (9:30 AM – 4:00 PM EST) in the S&P 500 will likely open just outside of prior-range and -value, suggesting a potential for immediate directional opportunity.

Adding, during Friday’s regular trade, on stronger intraday breadth and market liquidity metrics, the best-case outcome occurred, evidenced by trade above the spike base a few ticks below the $4,422.75 balance area high (BAH). This is significant because the post-FOMC minutes liquidation has been negated.

Gap Scenarios In Play: Gaps ought to fill quickly. Should they not, that’s a signal of strength; do not fade. Leaving value behind on a gap-fill or failing to fill a gap (i.e., remaining outside of the prior session’s range) is a go-with indicator.

Auctioning and spending at least 1-hour of trade back in the prior range suggests a lack of conviction; in such a case, do not follow the direction of the most recent initiative activity.

Further, the aforementioned trade is happening in the context of – most importantly – the Federal Reserve’s intent to taper asset purchases. This theme’s implications on price are contradictory; to elaborate, unemployment is falling rapidly, signaling to the Fed the need to reduce support.

“Bottom line, the critical element is inflation expectations,” former Fed Chairman Ben Bernanke says. “As long as they stay in the vicinity of 2%, the Fed’s strategy will achieve its goals. If inflation expectations were to move significantly higher, the Fed would be forced to tighten more quickly and probably slow the economy more than they would like.”

Ultimately, “[r]ising interest rates could be the kryptonite to the bubble in long-duration assets,” Rich Bernstein of Richard Bernstein Associates adds.

Moreover, for today, given expectations of heightened volatility and responsive trade into the Jackson Hole Economic Policy Symposium August 26-28, 2021, participants may make use of the following frameworks.

Responsive Buying (Selling): Buying (selling) in response to prices below (above) an area of recent price acceptance.

In the best case, the S&P 500 trades sideways or higher; activity above the $4,437.75 high volume area (HVNode) puts in play the $4,463.75 low volume area (LVNode). Initiative trade beyond the LVNode could reach as high as the $4,476.50 overnight high (ONH) and $4,511.50 Fibonacci extension.

In the worst case, the S&P 500 trades lower; activity below the $4,437.75 HVNode puts in play the $4,427.00 untested point of control (VPOC). Initiative trade beyond the VPOC could reach as low as the $4,415.75 LVNode and $4,393.75 micro composite point of control (MCPOC).

Overnight Rally Highs (Lows): Typically, there is a low historical probability associated with overnight rally-highs (lows) ending the upside (downside) discovery process.

Volume Areas: A structurally sound market will build on past areas of high volume. Should the market trend for long periods of time, it will lack sound structure (identified as a low volume area which denotes directional conviction and ought to offer support on any test). 

If participants were to auction and find acceptance into areas of prior low volume, then future discovery ought to be volatile and quick as participants look to areas of high volume for favorable entry or exit.

POCs: POCs are valuable as they denote areas where two-sided trade was most prevalent. Participants will respond to future tests of value as they offer favorable entry and exit.
Graphic: 65-minute profile chart of the Micro E-mini S&P 500 Futures updated 6:20 AM ET.

News And Analysis

Jay Powell’s policy revolution was blindsided.

EM central banks’ responses reflect recovery.

The pace of recovery critical to debt reduction.

China adds to list of steel giants with merger.

ECB rate hike bets losing out to dim inflation.

Activity in Japan’s services sector is shrinking.

Harris looks to assure U.S. allies over chaos.

The European services sector outperforming.

What People Are Saying

About

After years of self-education, strategy development, and trial-and-error, Renato Leonard Capelj began trading full-time and founded Physik Invest to detail his methods, research, and performance in the markets. 

Additionally, Capelj is a finance and technology reporter. Some of his biggest works include interviews with leaders such as John Chambers, founder and CEO, JC2 Ventures, Kevin O’Leary, businessman and Shark Tank host, Catherine Wood, CEO and CIO, ARK Invest, among others.

Disclaimer

At this time, Physik Invest does not manage outside capital and is not licensed. In no way should the materials herein be construed as advice. Derivatives carry a substantial risk of loss. All content is for informational purposes only.
Categories
Commentary

Weekly Brief For August 22, 2021

Market Commentary

Equity index futures recover after last week’s liquidation.

  • Unpacking the inclination to taper.
  • Ahead: Busy week. Jackson Hole.

What Happened: The S&P 500, Nasdaq 100, and Dow Jones Industrial Average recovered more than 50% of last week’s liquidation. The Russell 2000 remains a laggard, trading weak below the halfway point of a multi-month consolidation.

Ahead is data on the Markit manufacturing and services PMI (Monday), existing-home sales (Monday), new home sales (Tuesday), durable goods orders (Wednesday), nondefense capital goods orders (Wednesday), jobless claims (Thursday), GDP revision (Thursday), personal income (Friday), consumer spending (Friday), core PCE price index (Friday), trade in goods (Friday), as well University of Michigan consumer sentiment (Friday). 

Also, the Jackson Hole Economic Policy Symposium starts Thursday.

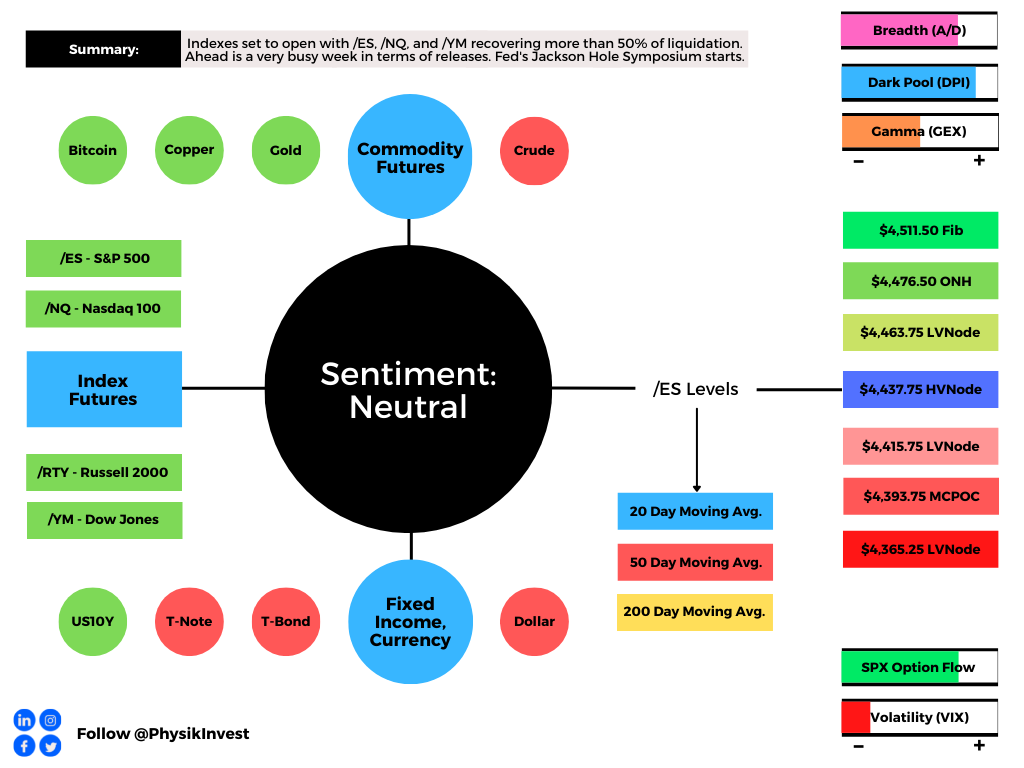
Graphic updated 12:30 PM ET Sunday. Sentiment Neutral if expected /ES open is inside of the prior day’s range. See here for more on the Dark Pool Index (DPI) and Gamma (GEX). A higher DPI approximation is bullish. At the same time, the lower the GEX approximation, the more volatility. SHIFT data used for options activity approximation. Note that options flow is sorted by the call premium spent; if green and more positive then more was spent on call options. Breadth reflects a reading of the prior day’s Advance/Decline indicator. VIX reflects a current reading of the CBOE Volatility Index from 0-100.

What To Expect: During the prior week’s trade, on weak intraday breadth and market liquidity metrics, the worst-case outcome occurred, evidenced by a liquidation that repaired poor profile structures as low as the S&P 500’s $4,353.00 point of control (POC).

POCs: POCs are valuable as they denote areas where two-sided trade was most prevalent. Participants will respond to future tests of value as they offer favorable entry and exit.

Then, during Friday’s session, a p-shaped profile structure (which denotes short covering) took back the spike base a few ticks below the $4,422.75 balance area high (BAH) – a prior break from value – negating the post-Federal Open Market Committee (FOMC) minutes liquidation.

Further, the aforementioned trade is happening in the context of moderating growth, peak long equity positioning, breadth divergences, a resurgence in COVID-19, geopolitical tensions, and an inclination to taper stimulus.

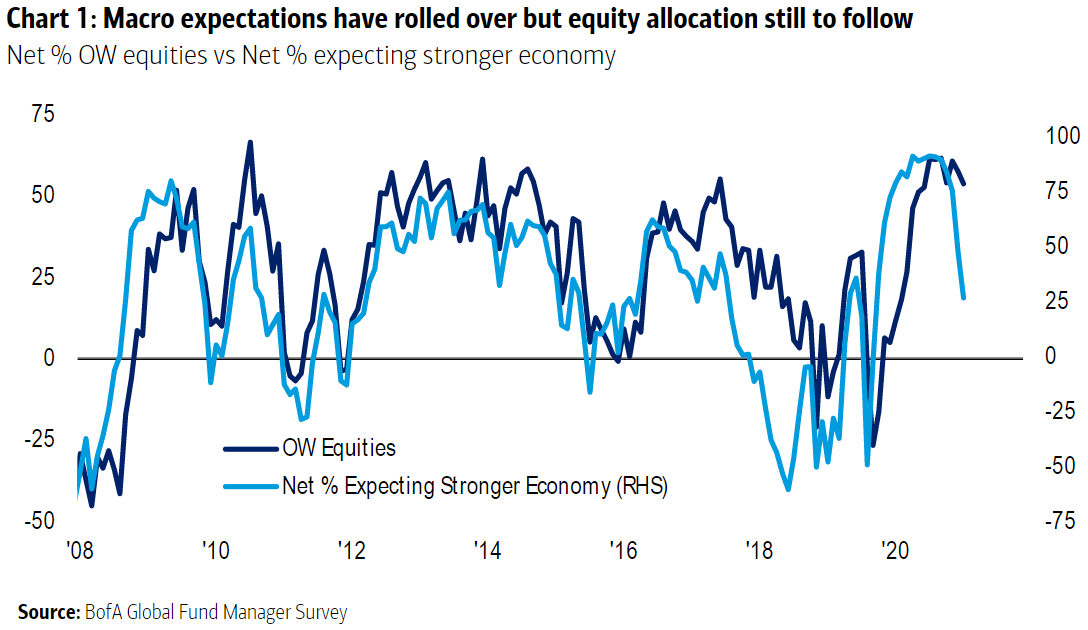
The implications of these themes on price are contradictory; to elaborate, as measures of macro expectations rolled over, in line with companies’ profit expectations, Treasury yields declined, triggering a rotation back into high growth equities.

Graphic: As created by Bank of America Corporation (NYSE: BAC) and shared by Bloomberg, the proportion of fund managers expecting a stronger economy tumbles while the number who are overweight in equities has barely moved.

This comes at the same time a strong July jobs report helped the Federal Reserve (Fed) move toward a consensus on tapering. Given the Fed’s enormous share of the Treasury market, fear of downside equity volatility is apparent; a shift higher in the VIX futures terms structure denotes demand for protection into and through the Jackson Hole Economic Policy Symposium August 26-28, 2021.

“The Fed has fostered a broad range of bubbles because their massive liquidity injections have been trapped in the financial economy,” Rich Bernstein of Richard Bernstein Associates said in a summary quoted by Bloomberg. “As with any cornered market, there are limited buyers and prices fall as the “cornerer” sells. Accordingly, bond prices seem likely to fall (interest rates rise) [as the] Fed reduces its cornered positions. Rising interest rates could be the kryptonite to the bubble in long-duration assets (long-term bonds, technology, innovation, disruption, bitcoin, etc.).”

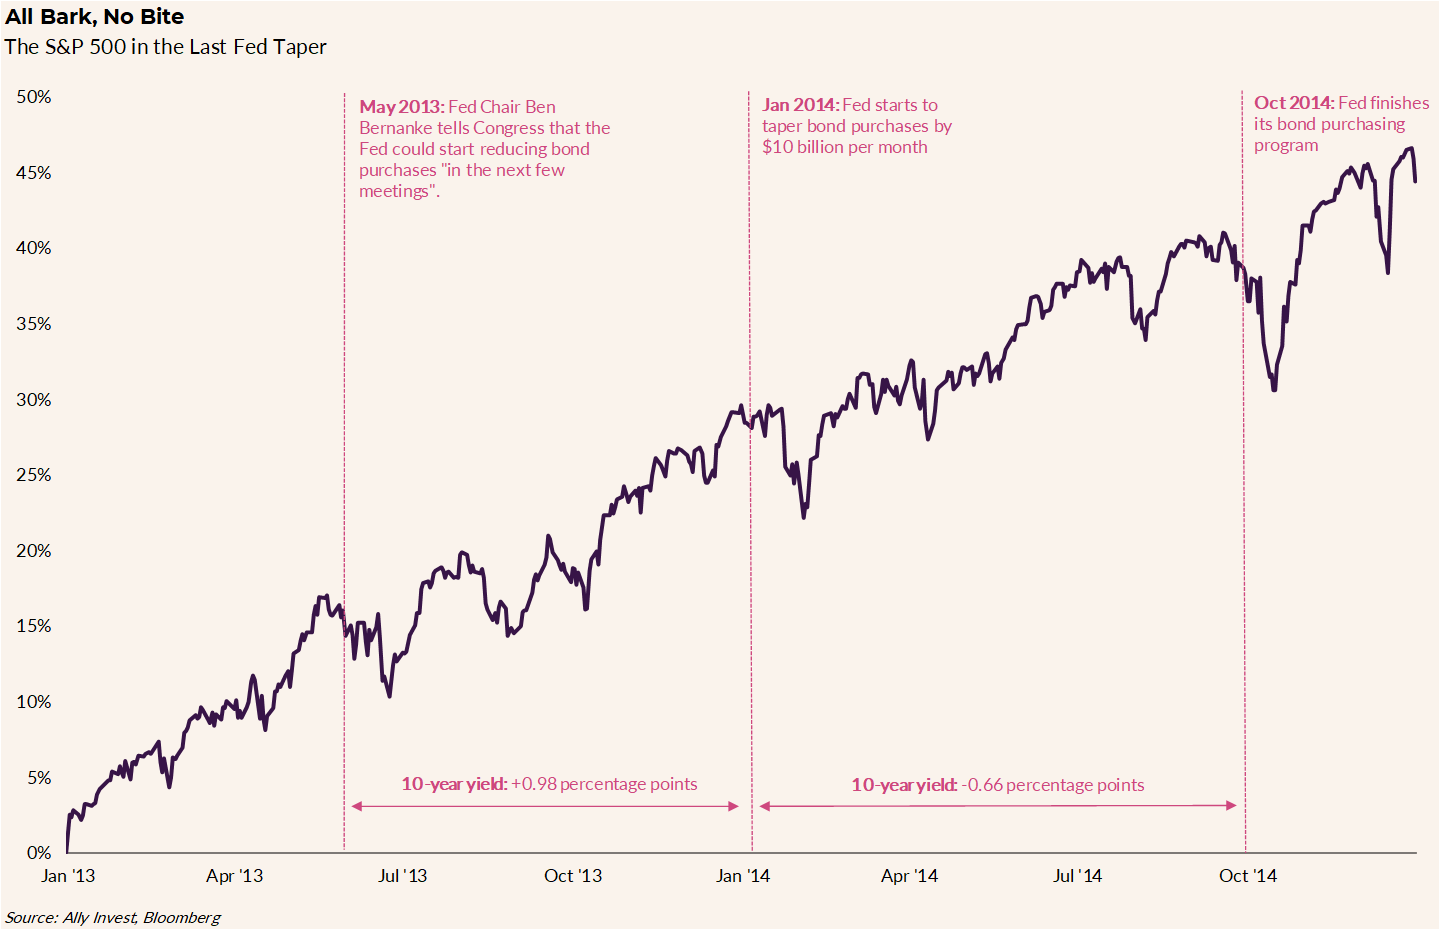
Obviously, tapering may have major repercussions. However, to balance our expectations, looking back to 2014, when the Fed was scaling back bond purchases, the S&P 500 rose over 10% and rates fell after spiking initially. 

Graphic: Ally Financial Inc-owned (NYSE: ALLY) Ally Invest unpacks 2014 taper of Federal Reserve bond buying.

Ally Invest’s chief investment strategist Lindsey Bell concludes: “Conditions may not be perfect, but they could be strong enough to move from a wheelchair to some heavy-duty crutches, especially if it means keeping overheating symptoms like inflation at bay.”

Regardless, major risks remain given the growth of derivatives and the potential for offsides positioning. Even the slightest reduction in the Federal Reserve’s balance sheet – the removal of liquidity – may prompt a cascading reaction that exacerbates underlying price movements.

As Kai Volatility’s Cem Karsan once told me for a Benzinga article: “It’s not a coincidence that the mid-February to mid-March 2020 downturn literally started the day after February expiration and ended the day of March quarterly expiration. These derivatives are incredibly embedded in how the tail reacts and there’s not enough liquidity, given the leverage, if the Fed were to taper.”

Moreover, for next week, given expectations of heightened volatility, participants may make use of the following frameworks.

In the best case, the S&P 500 trades sideways or higher; activity above the $4,437.75 high volume area (HVNode) pivot puts in play the $4,463.75 low volume area (LVNode). Initiative trade beyond the LVNode could reach as high as the $4,476.50 overnight high (ONH) and $4,511.50 Fibonacci extension, or higher.

In the worst case, the S&P 500 trades lower; activity below the $4,437.75 HVNode puts in play the $4,415.75 LVNode. Initiative trade beyond the LVNode could reach as low as $4,393.75 micro composite point of control (MCPOC) and $4,365.25 LVNode, or lower. 

Overnight Rally Highs (Lows): Typically, there is a low historical probability associated with overnight rally-highs (lows) ending the upside (downside) discovery process.

Volume Areas: A structurally sound market will build on past areas of high volume. Should the market trend for long periods of time, it will lack sound structure (identified as a low volume area which denotes directional conviction and ought to offer support on any test). 

If participants were to auction and find acceptance into areas of prior low volume, then future discovery ought to be volatile and quick as participants look to areas of high volume for favorable entry or exit.
Graphic: 65-minute profile chart of the Micro E-mini S&P 500 Futures updated 12:30 PM ET Sunday.

News And Analysis

Moody’s discusses taper – maybe this year, maybe not.

Single-family home construction the highest since 2007.

Fannie Mae says COVID-19 surge won’t impact growth. 

Goldman Sachs cut its U.S. growth forecast on the virus.

APAC corporate rating recovery may stall as cases rise.

Wall Street is just as baffled about markets as last year.

Canadian inflation has risen to 3.7%, troubling Trudeau. 

Powell second term approval boosted by Yellen backing.

A gaping 10-year bond call reveals growth uncertainties.

Michael Burry of ‘Big Short’ bet against ARK Invest ETF.

Outcry rises after White House looks to quell gas prices.

Big risks and trends facing banks globally and regionally.

Could a Western U.S. drought threaten municipal credit.

What People Are Saying

About

After years of self-education, strategy development, and trial-and-error, Renato Leonard Capelj began trading full-time and founded Physik Invest to detail his methods, research, and performance in the markets. 

Additionally, Capelj is a finance and technology reporter. Some of his biggest works include interviews with leaders such as John Chambers, founder and CEO, JC2 Ventures, Kevin O’Leary, businessman and Shark Tank host, Catherine Wood, CEO and CIO, ARK Invest, among others.

Disclaimer

At this time, Physik Invest does not manage outside capital and is not licensed. In no way should the materials herein be construed as advice. Derivatives carry a substantial risk of loss. All content is for informational purposes only.

Categories
Commentary

Daily Brief For June 23, 2021

Market Commentary

Equity index futures attempt to balance after strong recovery.

  • Fed’s Powell: Inflation is transitory.
  • Ahead: Home sales, CA balances.
  • Indexes traded sideways to higher.

What Happened: U.S. stock index futures auctioned sideways to higher as inflation concerns eased.

On Tuesday, Federal Reserve chair Jerome Powell said the bank would not raise rates while reiterating price increases are temporary.

In a statement, BlackRock strategists note: “We believe the Fed’s new outlook will not translate into significantly higher policy rates any time soon. This, combined with the powerful restart, underpins our pro-risk stance.”

Ahead is data on U.S. home sales and the current account balance. Tomorrow, the Bank of England issues its interest rate decision and the Federal Reserve will release the results of bank stress tests.

Graphic updated 7:00 AM ET.

What To Expect: Wednesday’s regular session (9:30 AM – 4:00 PM EST) in the S&P 500 will likely open inside of prior-range and -value, suggesting a limited potential for immediate directional opportunity.

Adding, during the prior day’s regular trade, the best case outcome occurred, evidenced by initiative trade beyond the $4,235.00 Virgin Point of Control (VPOC).

Point of Control (POCs): POCs are valuable as they denote areas where two-sided trade was most prevalent. Participants will respond to future tests of value as they offer favorable entry and exit.

As noted yesterday, trading above the $4,227.75 high volume area (HVNode) – the site where initiative selling accelerated the week prior – was a very positive outcome. Now, any participant that sold short, from that breakdown, is in a losing position. On the other hand, both Monday and Tuesday’s multi-distribution profiles, in conjunction with market liquidity metrics, denote short-covering activity, not substantive buying. Such structures often offer little-to-no support on liquidations. Therefore, participants ought to beware of an increased potential to violently backfill and repair.

Volume Areas: A structurally sound market will build on past areas of high volume. Should the market trend for long periods of time, it will lack sound structure (identified as a low volume area which denotes directional conviction and ought to offer support on any test). 

If participants were to auction and find acceptance into areas of prior low volume, then future discovery ought to be volatile and quick as participants look to areas of high volume for favorable entry or exit.

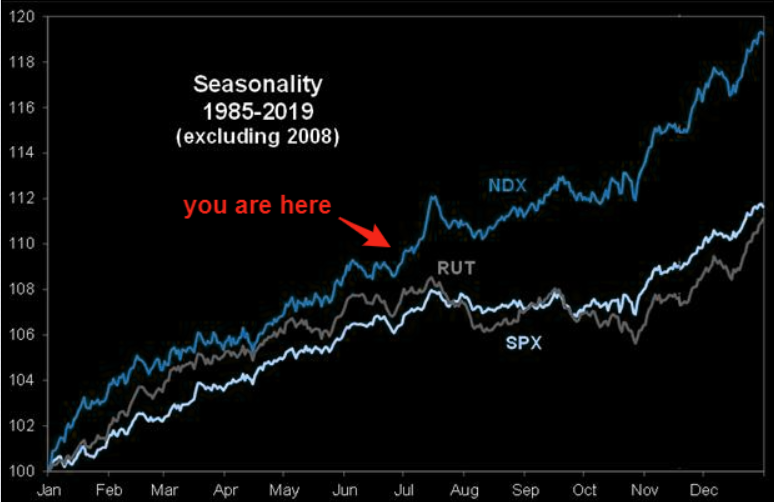
That dynamic, with what is historically the weakest 2-week period of the year, warns participants should not be surprised if indexes trade sideways to lower, into the end of the week. Positioning metrics support this notion, too.

Thereafter, seasonality flips, becoming most positive for the Nasdaq 100.

Graphic: Nasdaq 100 nears its best period of the year, via The Market Ear. Inflows are in agreement, too.

For today, participants can trade from the following frameworks. 

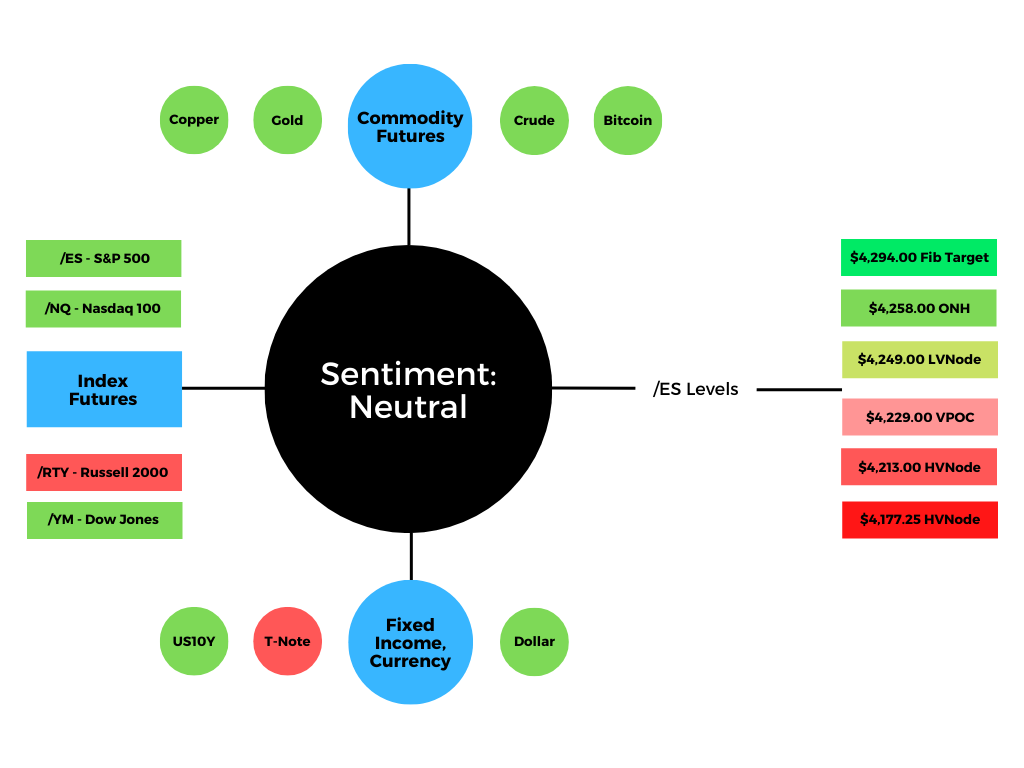
In the best case, the S&P 500 trades sideways or higher; activity above the $4,229.00 VPOC puts in play the $4,249.00 low volume area (LVNode). Initiative trade beyond the LVNode could reach as high as the $4,258.00 overnight high (ONH) and Fibonacci-derived price targets near $4,294.00. 

Overnight Highs (Lows): Typically, there is a low historical probability associated with overnight rally-highs (lows) ending the upside (downside) discovery process.

In the worst case, the S&P 500 trades lower; activity below the $4,229.00 VPOC puts in play the HVNodes at $4,213.00 and $4,177.25.

Graphic: 65-minute profile chart of the Micro E-mini S&P 500 Futures.
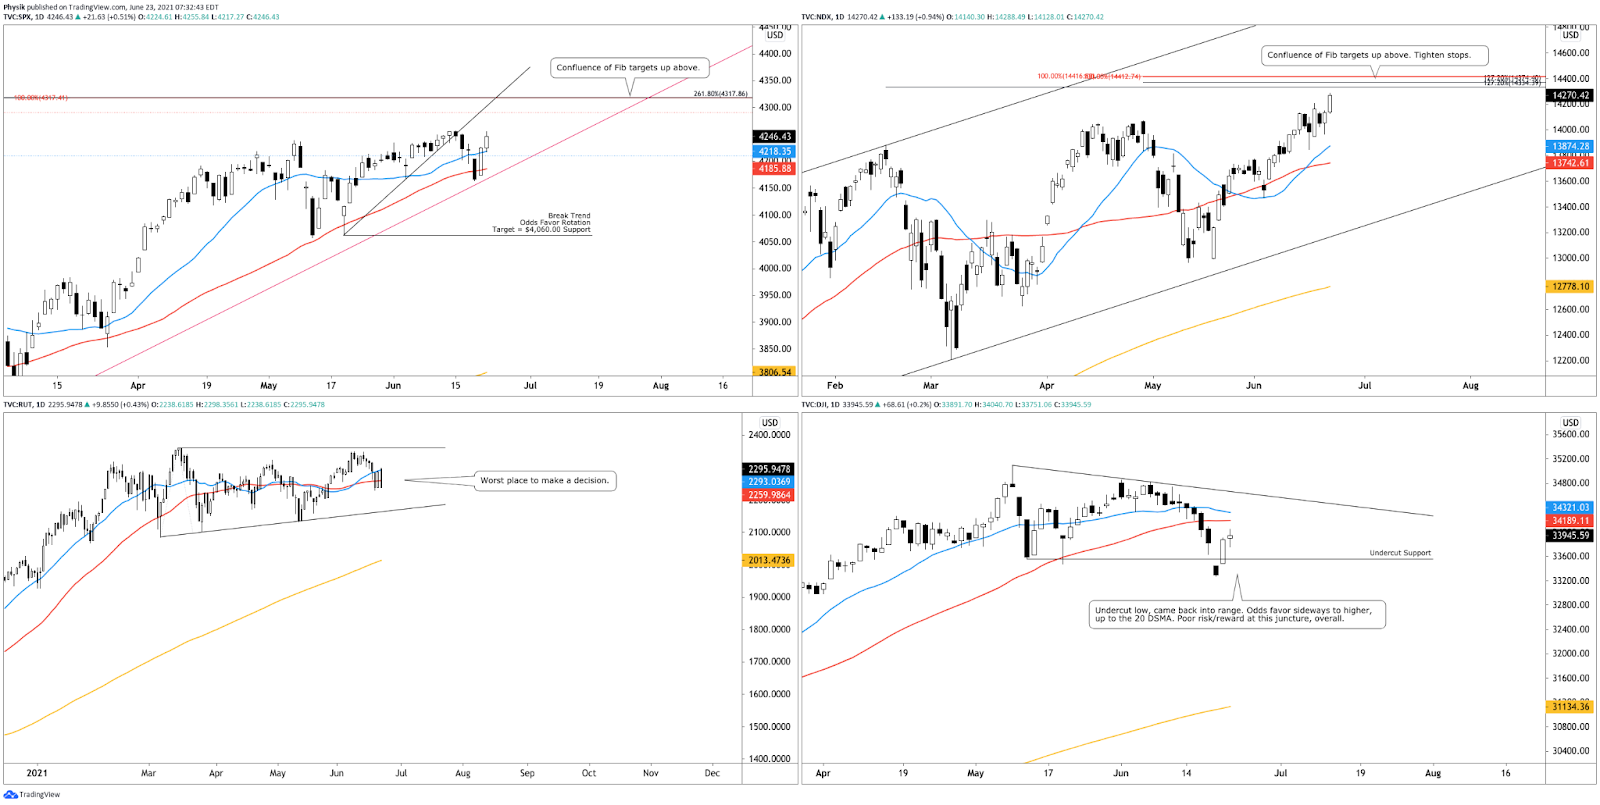
Graphic: Daily candlestick charts of the S&P 500 (top left), Nasdaq 100 (top right), Russell 2000 (bottom left), and Dow Jones Industrial Average (bottom right). Note the zone of overlapping Fibonacci targets in the Nasdaq 100.
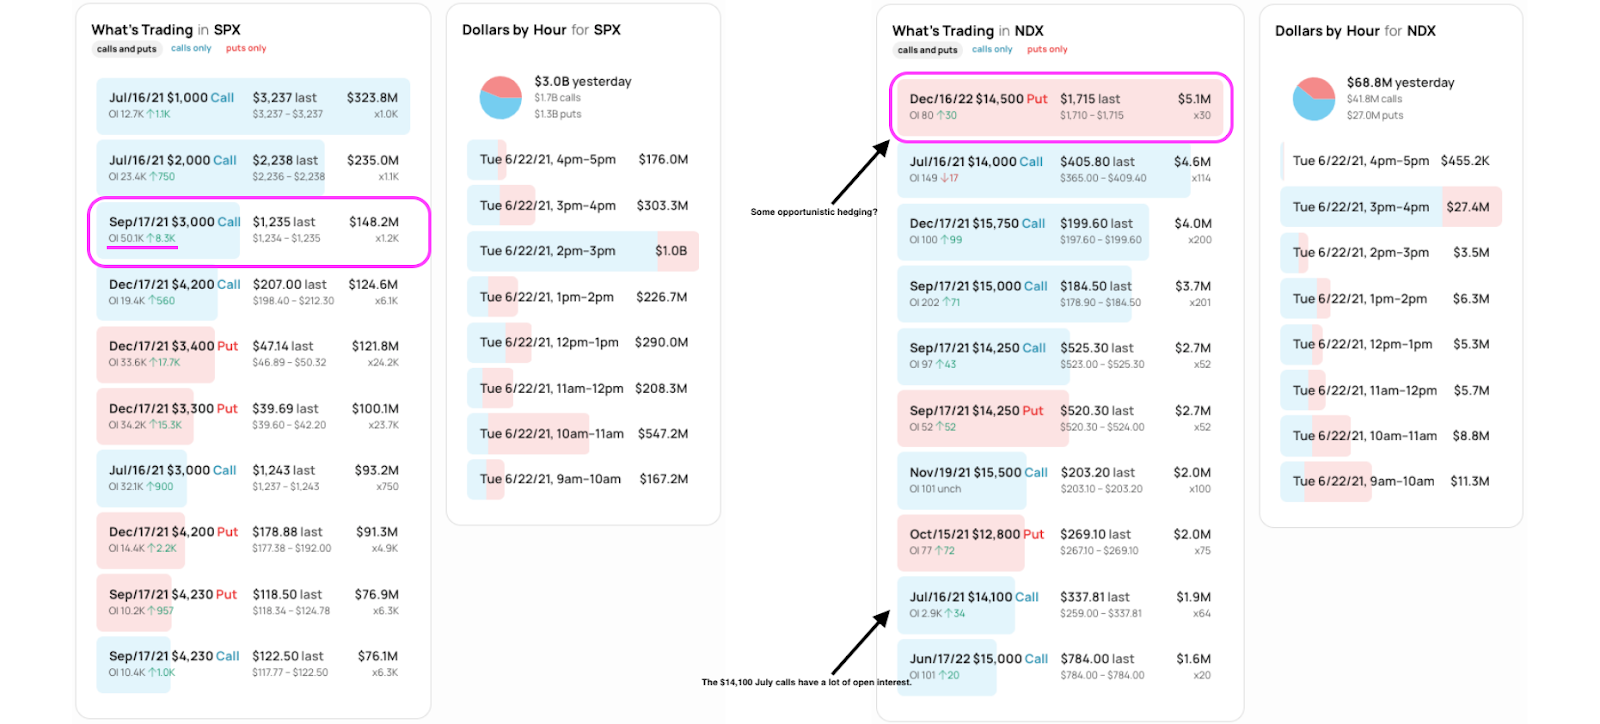
Graphic: SHIFT search suggests participants were committing the most capital to call strikes at and below current prices in the cash-settled S&P 500 Index (INDEX: SPX) and Nasdaq 100 (INDEX: NDX), yesterday. This activity may denote (1) stock replacement, (2) hedges for underlying short positions, or (3) speculation on the upside. Noting, in comparison to the day prior, there was interest in farther-dated put strikes at and above current prices. This may denote opportunistic hedging or speculation on the downside. 

News And Analysis

Politics | President Biden pushes for high-level meetings with Beijing. (FT)

Politics | Russia fires warning shots at British warship in Black Sea. (BBG)

Trade | Warehouse rents surged on bidding wars for scarce spaces. (WSJ)

Markets | Nonbank lenders are quickly dominating mortgage market. (WSJ)

Energy | Physical oil market gains suggest more support for the rally. (REU)

Economy | The most unexpected pandemic winner is small business. (Axios)

Economy | 2021 corporate defaults nearly 60% lower than last year. (S&P)

What People Are Saying

Innovation And Emerging Trends

Analysis | Inner Game with Steve Cohen. Lifting the veil on hedge funds. (SR)

Startups | Detroit turns into a startup ecosystem, great for entrepreneurs. (BZ)

FinTech | Decentralized finance is ready to disrupt financial technology. (NDAQ)

Work | The world’s financial centers are struggling back to their offices. (BBG)

Tech | Quantum data link established between two distant Chinese cities. (BBG)

About

Renato founded Physik Invest after going through years of self-education, strategy development, and trial-and-error. His work reporting in the finance and technology space, interviewing leaders such as John Chambers, founder, and CEO, JC2 Ventures, Kevin O’Leary, businessman and Shark Tank host, Catherine Wood, CEO and CIO, ARK Invest, among others, afforded him the perspective and know-how very few come by.

Having worked in engineering and majored in economics, Renato is very detailed and analytical. His approach to the markets isn’t built on hope or guessing. Instead, he leverages the unique dynamics of time and volatility to efficiently act on opportunity.

Disclaimer

At this time, Physik Invest does not manage outside capital and is not licensed. In no way should the materials herein be construed as advice. Derivatives carry a substantial risk of loss. All content is for informational purposes only.

Categories
Commentary

Daily Brief For June 11, 2021

Market Commentary

Index futures in balance and divergent.

  • One Big Thing: Inflation temporary.
  • Ahead: UoM Consumer Sentiment.
  • Indices diverge and trade sideways.

What Happened: U.S. stock index futures auctioned within prior range, after recent economic releases increased confidence in the notion that inflation will be temporary. Adding, participants are attempting to price in, also, the potential passage of an infrastructure deal, corporate tax talk, and cryptocurrency scrutiny.

Noting, ahead is data on sentiment.

Graphic updated 7:37 AM ET.

What To Expect: Friday’s regular session (9:30 AM – 4:00 PM EST) in the S&P 500 will likely open inside of prior-range and -value, suggesting a limited potential for immediate directional opportunity.

Adding, during the prior day’s regular trade, the worst-case outcome occurred, evidenced by a failed balance-area breakout.

After the release of the May 2021 CPI, participants attempted to initiate the S&P 500 up and out from balance. The attempt failed, confirmed by lackluster breadth, among other things. The minimal excess left at the 127.20% Fibonacci price extension suggests participants, which were likely short-term (i.e., technically-driven), either (1) lacked conviction or (2) were forced to liquidate because they were not getting paid.

Typical Balance-Break and/or Gap Scenarios: Monitor for acceptance (i.e., more than 1-hour of trade) outside of the balance area.

Gaps ought to fill quickly. Should they not, that’s a signal of strength; do not fade. Leaving value behind on a gap-fill or failing to fill a gap (i.e., remaining outside of the prior session’s range) is a go-with indicator.

Auctioning and spending at least 1-hour of trade back in the prior range suggests a lack of conviction; in such a case, do not follow the direction of the most recent initiative activity.

Excess: A proper end to price discovery; the market travels too far while advertising prices. Responsive, other-timeframe (OTF) participants aggressively enter the market, leaving tails or gaps which denote unfair prices.

The resulting profile structure, also, was p-shaped; profile structures denote short-covering as old business looks to cover short exposure. Such activity, contrary to popular belief, can weaken a market as it removes demand (or future demand) from the market (i.e., participants with no short exposure, do not have to buy-to-close an existing position). 

Further, for today, participants can trade from the following frameworks. 

In the best case, the S&P 500 trades sideways or higher; activity above the $4,227.00 high volume area (HVNode) puts in play the $4,249.00 minimal excess high. Initiative trade beyond that figure could reach as high as the $4,270.00 161.80% Fibonacci price extension. 

Volume Areas: A structurally sound market will build on past areas of high volume. Should the market trend for long periods of time, it will lack sound structure (identified as a low volume area which denotes directional conviction and ought to offer support on any test). 

If participants were to auction and find acceptance into areas of prior low volume, then future discovery ought to be volatile and quick as participants look to areas of high volume for favorable entry or exit.

In the worst case, the S&P 500 trades lower; activity below the $4,227.00 HVNode confirms a failed balance-area breakout. In such a case, the $4,213.75 low volume area (LVNode) comes into play first. Thereafter, if lower, participants ought to look for responses at the $4,206.25, $4,198.75, and $4,177.25 HVNodes.

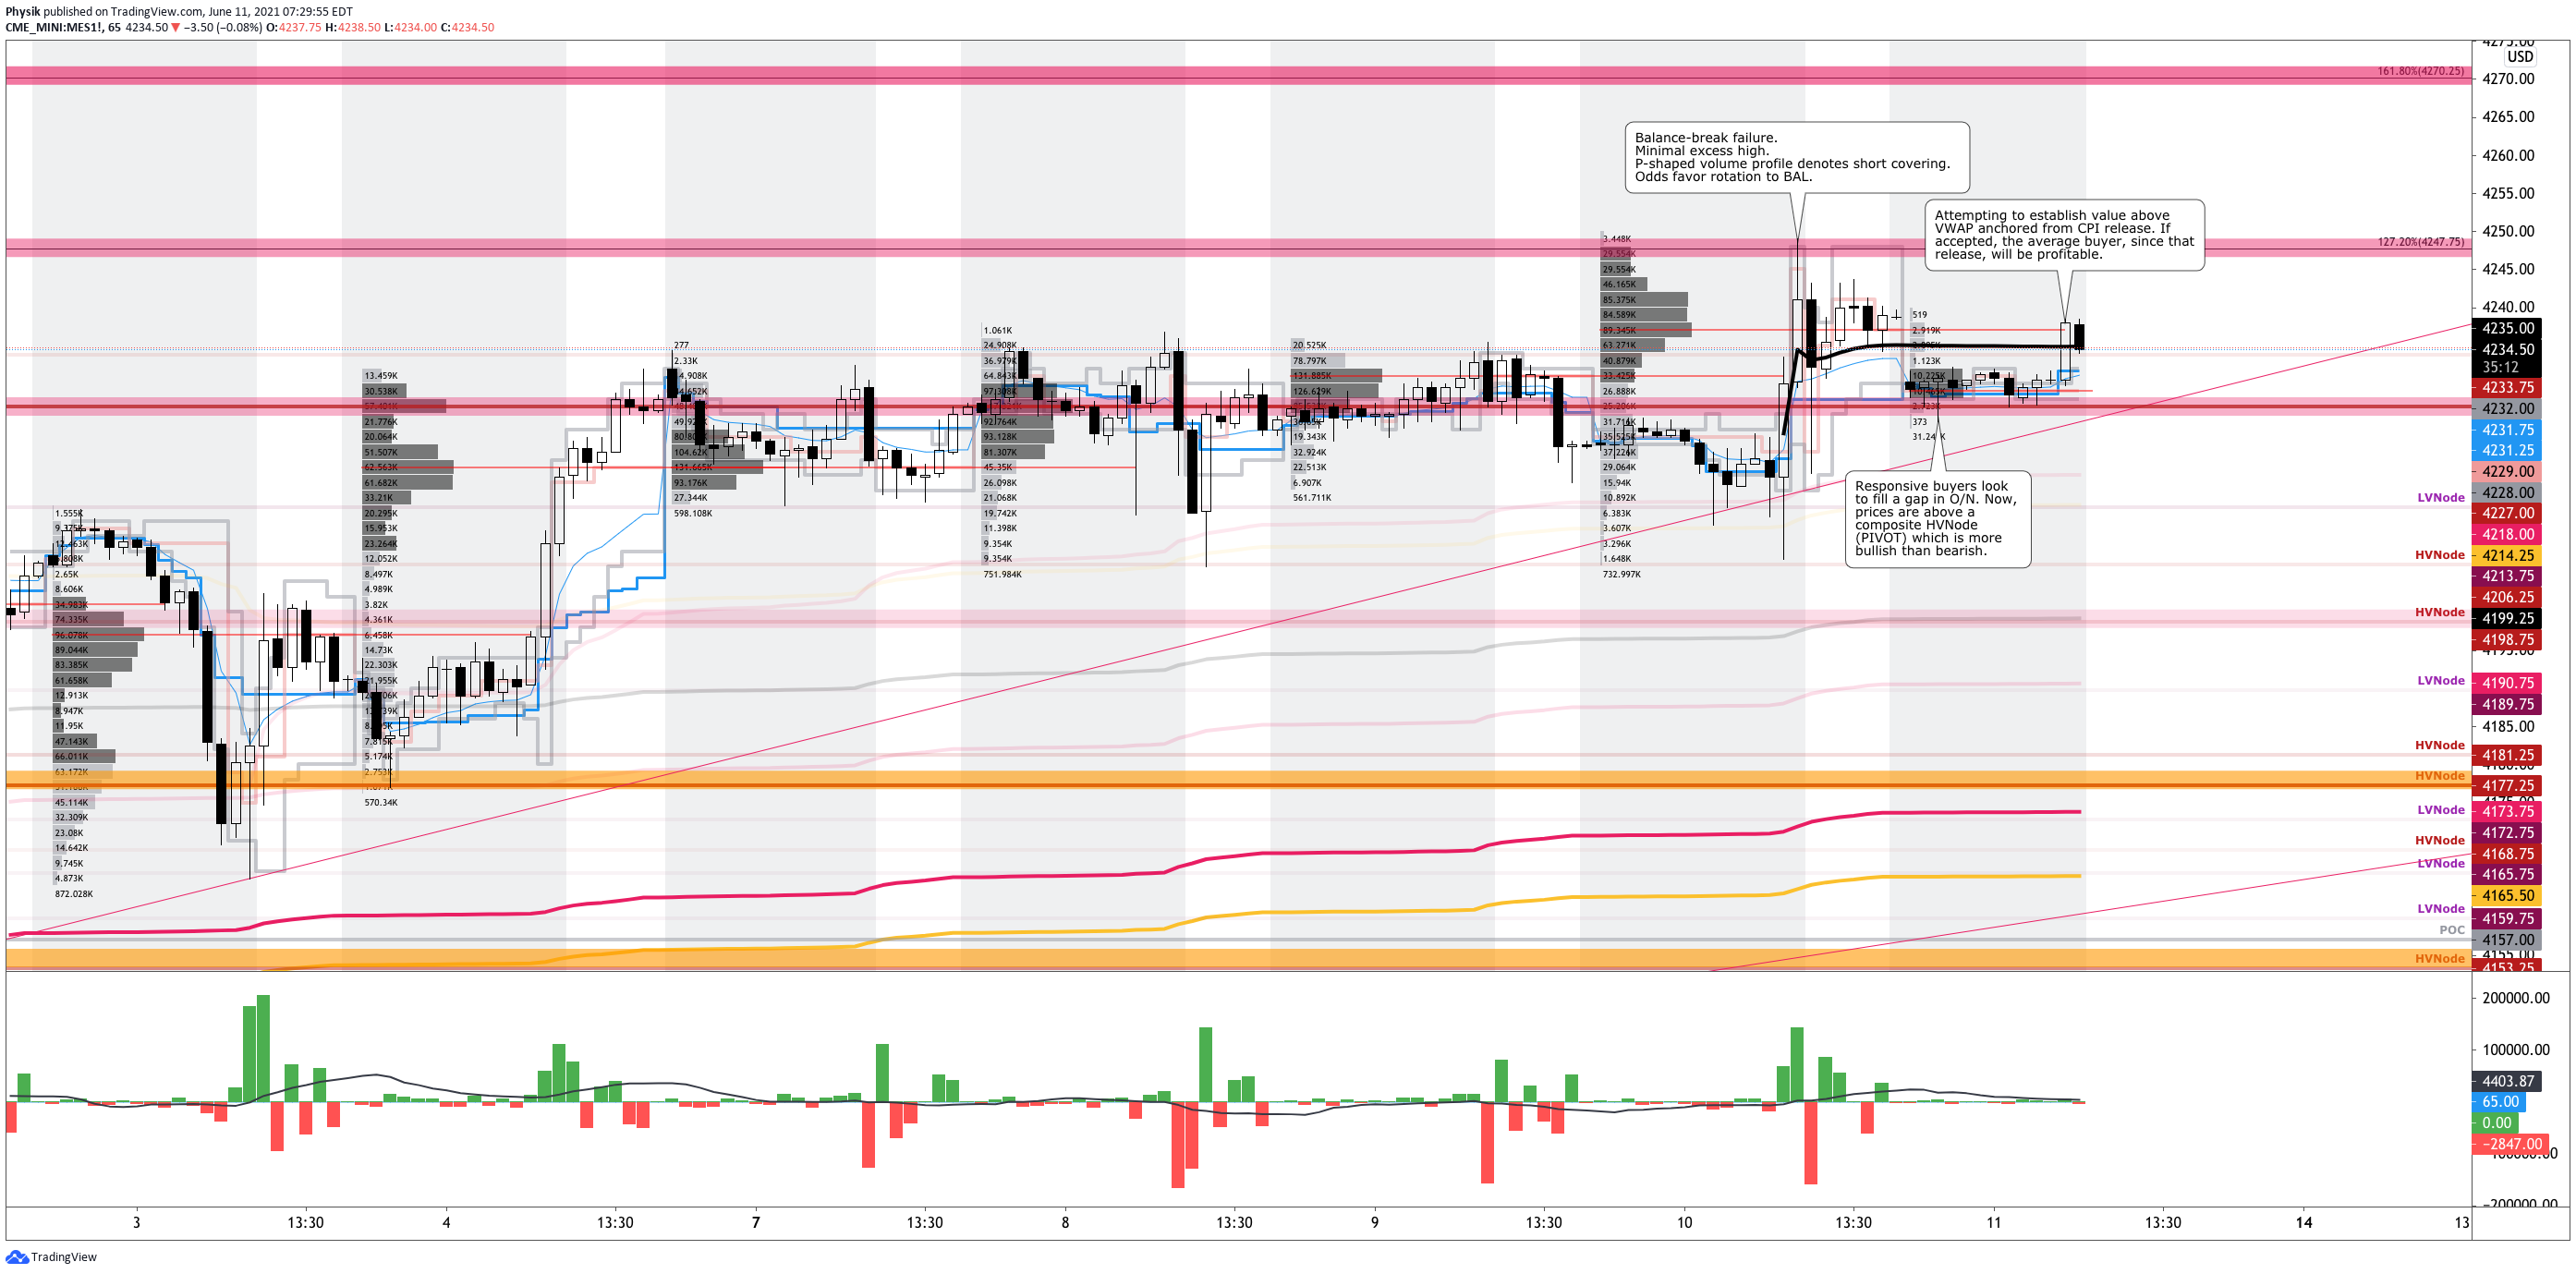
Graphic: 65-minute profile chart of the Micro E-mini S&P 500 Futures.
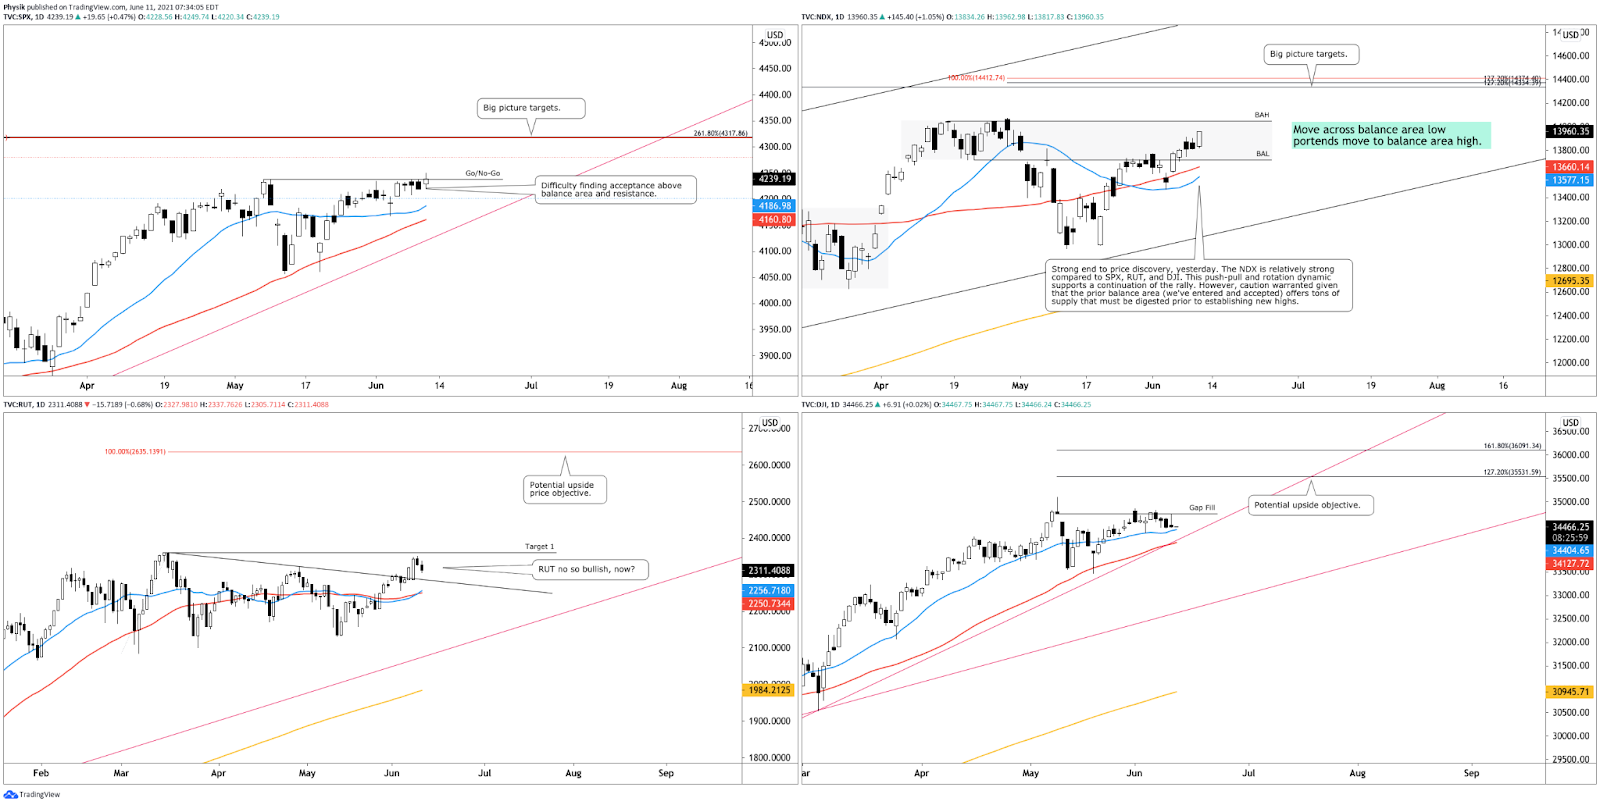
Graphic: Daily candlestick charts of the S&P 500 (top left), Nasdaq 100 (top right), Russell 2000 (bottom left), and Dow Jones Industrial Average (bottom right). Nasdaq is relatively strong.
Graphic: Physik Invest maps out the purchase of call and put options in the SPDR S&P 500 ETF Trust (NYSE: SPY), yesterday. Activity in the options market was primarily concentrated in short-dated tenors, in put strikes as low as $420.
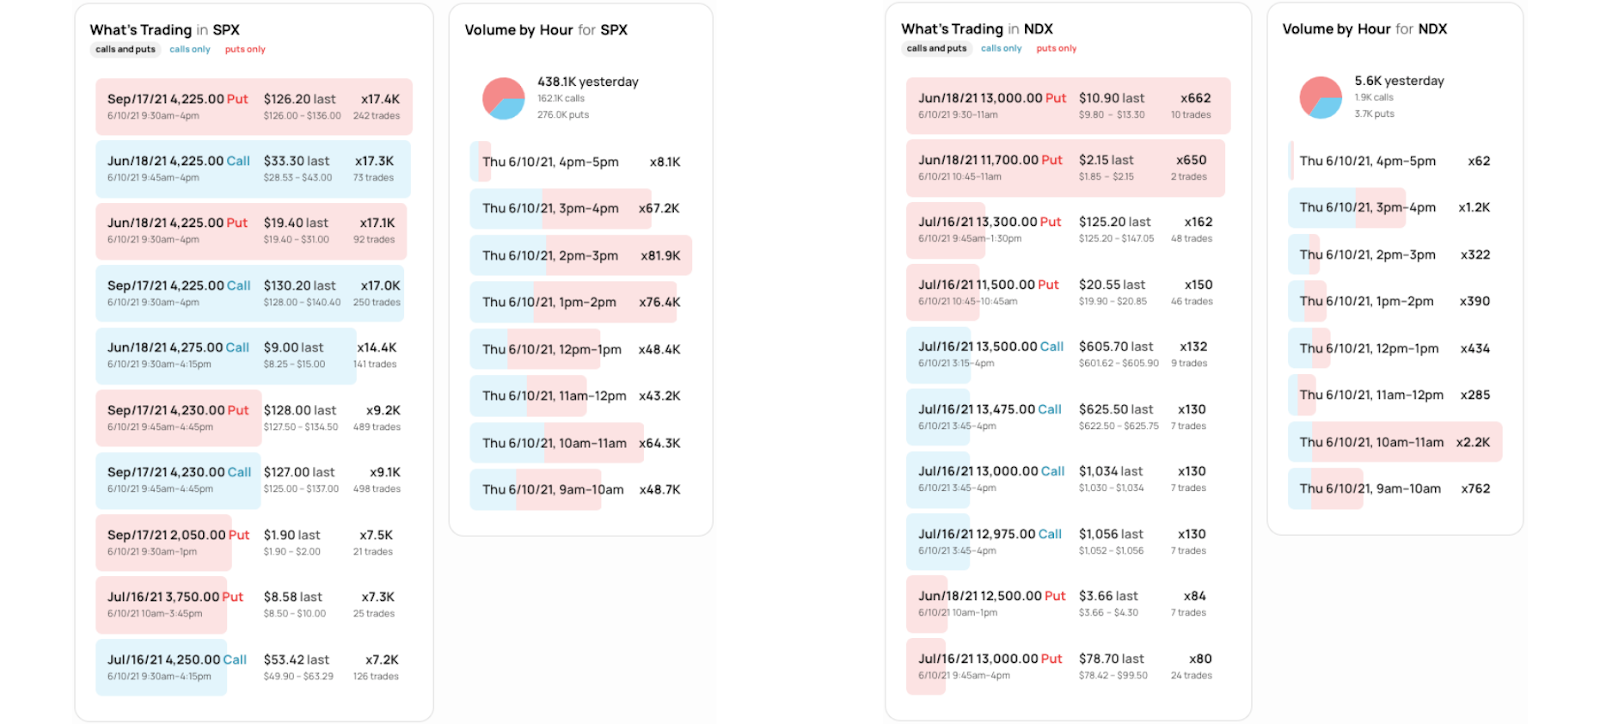
Graphic: SHIFT search suggests participants were most interested in put strikes at and below current prices in the cash-settled S&P 500 Index (INDEX: SPX) and Nasdaq 100 Index (INDEX: NDX), yesterday. Noting that, in regards to the NDX, this is a change in tone. In the days prior, longer-dated NDX calls saw more interest. The puts could be used to speculate or hedge a participant’s downside. 

News And Analysis

Markets | Citadel Securities settles with fund on secret algorithm. (BBG)

Economy | Though inflation hotter than expected, it is temporary. (CNBC)

FinTech | Basel suggests strictest risk weighting for cryptocurrency. (BD)

Travel | Uber, Lyft driver shortage is boosting business for taxis. (BBG)

Politics | President Biden to meet Merkel at White House July 15. (Axios)

Energy | Oil thirst projected to surpass pre-COVID by end of 2022. (Axios)

What People Are Saying

Innovation And Emerging Trends

Travel | Airlines are planning to plow billions into flying taxis. (BBG)

FinTech | Why buy-now-pay-later financing is so attractive. (Axios)

FinTech | Central banks are headed toward digital currency. (Axios)

FinTech | Online broker Webull considers $400M U.S. IPO. (BBG)

FinTech | Coinbase strikes deal to let you add crypto to 401K. (Fortune)

About

Renato founded Physik Invest after going through years of self-education, strategy development, and trial-and-error. His work reporting in the finance and technology space, interviewing leaders such as John Chambers, founder, and CEO, JC2 Ventures, Kevin O’Leary, businessman and Shark Tank host, Catherine Wood, CEO and CIO, ARK Invest, among others, afforded him the perspective and know-how very few come by.

Having worked in engineering and majored in economics, Renato is very detailed and analytical. His approach to the markets isn’t built on hope or guessing. Instead, he leverages the unique dynamics of time and volatility to efficiently act on opportunity.

Disclaimer

At this time, Physik Invest does not manage outside capital and is not licensed. In no way should the materials herein be construed as advice. Derivatives carry a substantial risk of loss. All content is for informational purposes only.

Categories
Commentary

Weekly Brief For May 31, 2021

Market Commentary

Key Takeaways: Index futures in balance.

  • Best to assume the taper tantrum happened.
  • Ahead: Fed speak and data on employment.
  • Indices traded sideways-to-higher last week.

What Happened: Coming into the large May monthly options expiration (OPEX) and extended holiday weekend, U.S. stock index futures pinned, trading sideways-to-higher.

Options: If an option buyer was short (long) stock, he or she would buy a call (put) to hedge upside (downside) exposure. Option buyers can also use options as an efficient way to gain directional exposure.

Options Expiration (OPEX): Option expiries mark an end to pinning (i.e, the theory that market makers and institutions short options move stocks to the point where the greatest dollar value of contracts will expire worthless) and the reduction dealer gamma exposure. 

Gamma is the sensitivity of an option to changes in the underlying price. Dealers that take the other side of options trades hedge their exposure to risk by buying and selling the underlying. When dealers are short-gamma, they hedge by buying into strength and selling into weakness. When dealers are long-gamma, they hedge by selling into strength and buying into weakness. The former exacerbates volatility. The latter calms volatility.

Furthermore, looking back, the movement in price was both volatile and mechanical.

After a short covering-like rally toward $4,200.00, the S&P 500 was responsively bought and sold at key visual references, suggesting a dominance by short-term participants.

Responsive Buying (Selling): Buying (selling) in response to prices below (above) areas of recent price acceptance.

The technically-driven trade denotes a lack of interest by institutional participants, at record highs; supply chain uncertainties and rising inflation, fiscal and monetary tightening, COVID-19 concerns, political risks, and the like, are some of the emerging concerns larger participants are looking to price in.

Of all the above risks, inflation remains the hottest topic.

Generally speaking, inflation and rates move inversely to each other. Low rates stimulate demand for loans (i.e., borrowing money is more attractive). With the rapid recovery, though, market participants fear that rates will rise to protect the economy from overheating.

Higher rates have the potential to reduce the present value of future earnings, making stocks, especially those that are high growth, less attractive. 

To note, however, rates remain range-bound; rates on the 10 Year T-Note sit below their March high and are likely to continue higher, which the market may absorb

How may the market absorb a rise in rates? During the so-called Taper Tantrum, in the early 2010s, rates settled in a wide range, and equities rallied big. Adding, some strategists, like Kit Juckes of Societe Generale SA (OTC: SCGLY) suggest it may be best to assume a tantrum has already happened.

“U.S. 10-year yields rose from a low of 1.4% in 2012 to 3% during their tantrum. In this cycle, the rise has been from 0.5% to a high just below 1.8%. That’s comparable in relative terms. The eventual peak in U.S. yields in 2018 was 3.25%. Can’t we accept that the taper tantrum has already happened? The important difference is that in the tantrum cycle, core CPI never got above 2 ½%. A bet on further bond weakness is a bet on inflation proving to be stickier than the Fed can cope with.”

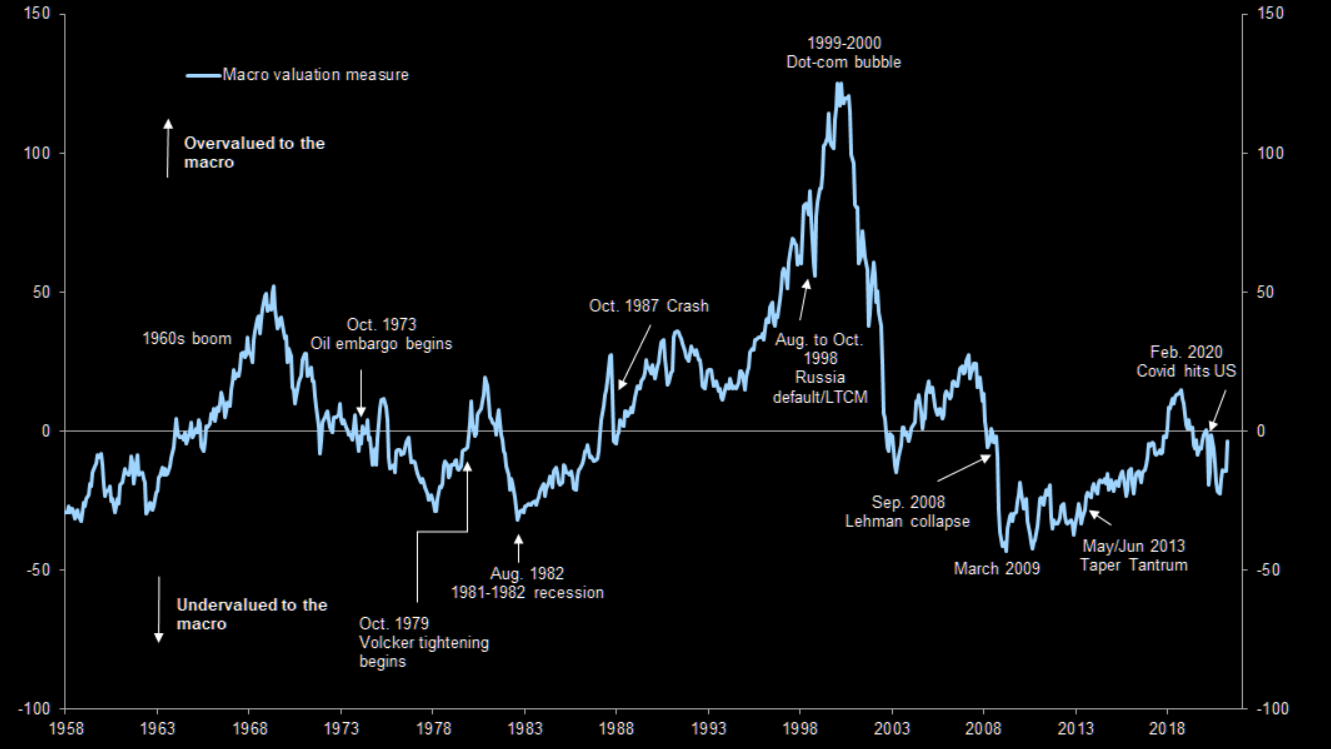
Adding, research by JPMorgan Chase & Co (NYSE: JPM), as well as Goldman Sachs Group Inc (NYSE: GS), suggests equities may be getting cheap with reflationary themes being the go-to play. This sentiment would help explain the increased interest in S&P 500 and Nasdaq 100 call options.

Graphic: Equity valuations at their cheapest, relative to the macro in March 2009 and in the depth of the 1982 recession, according to Goldman Sachs Group Inc (NYSE: GS), via The Market Ear.
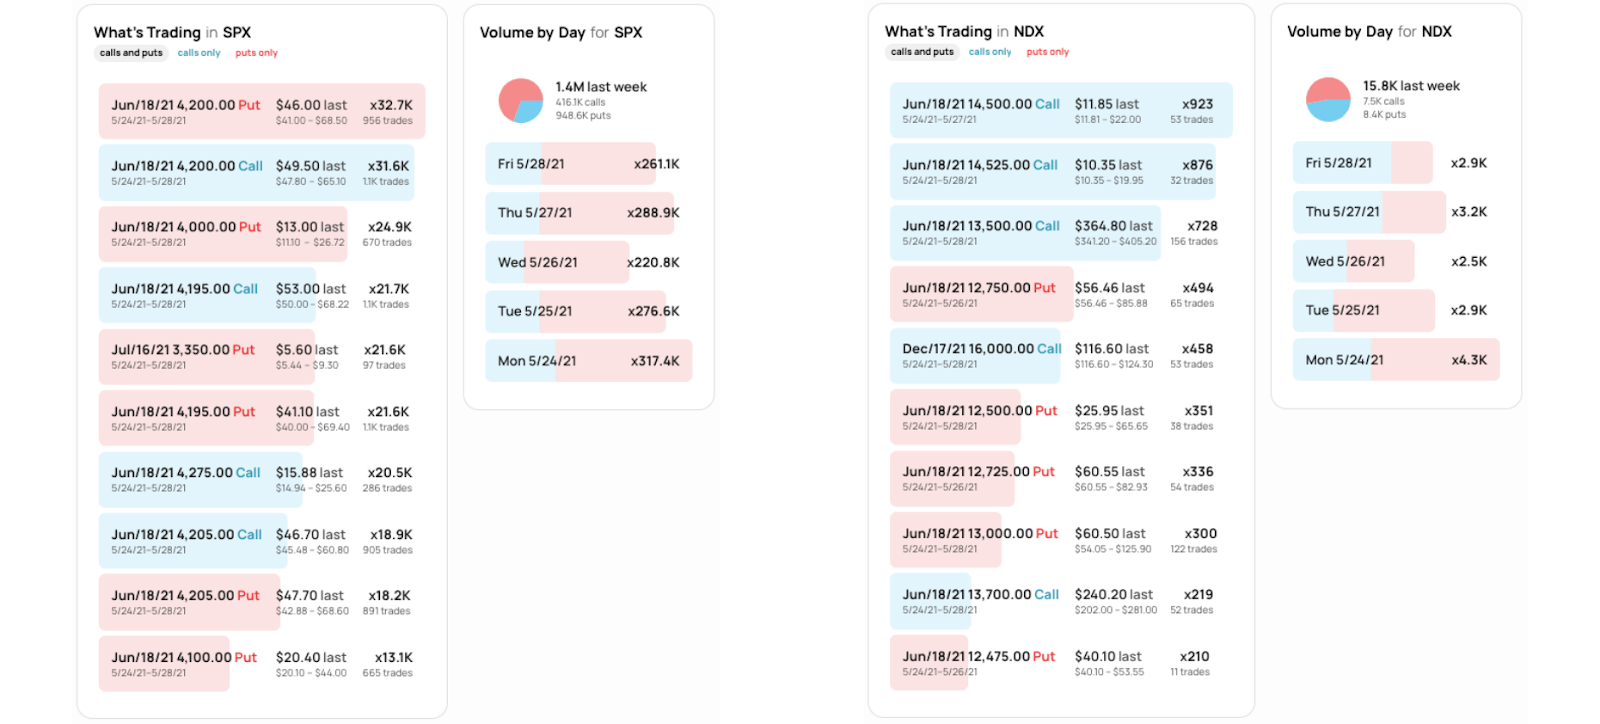
Graphic: SHIFT search suggests participants were becoming more interested in call strikes at and above current prices in the cash-settled S&P 500 Index (INDEX: SPX) and Nasdaq 100 Index (INDEX: NDX), last week.
Graphic: Physik Invest maps out the purchase of call and put options in the SPDR S&P 500 ETF Trust (NYSE: SPY), for the week prior. Activity in the options market was primarily concentrated in short-dated tenors, in strikes at and above $425.

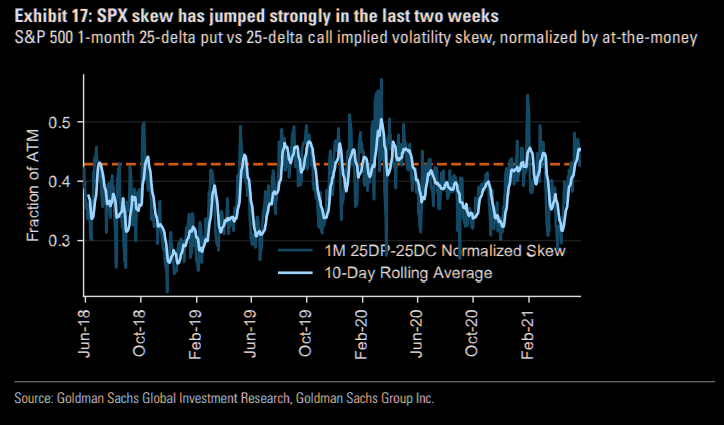
Outlier risks remain, though; aside from the seasonally weak period, S&P 500 skew – a measure of perceived tail risk and the chances of a black swan event – rose dramatically over the past few weeks. At the same time, sentiment cooled considerably, while individual stock volatility increased the potential for a repeat of the GameStop Corporation (NYSE: GME) de-risking event.

Graphic: Goldman Sachs Group Inc (NYSE: GS) unpacks outlier risks based on the implied volatility of S&P 500 out-of-the-money options, via The Market Ear.

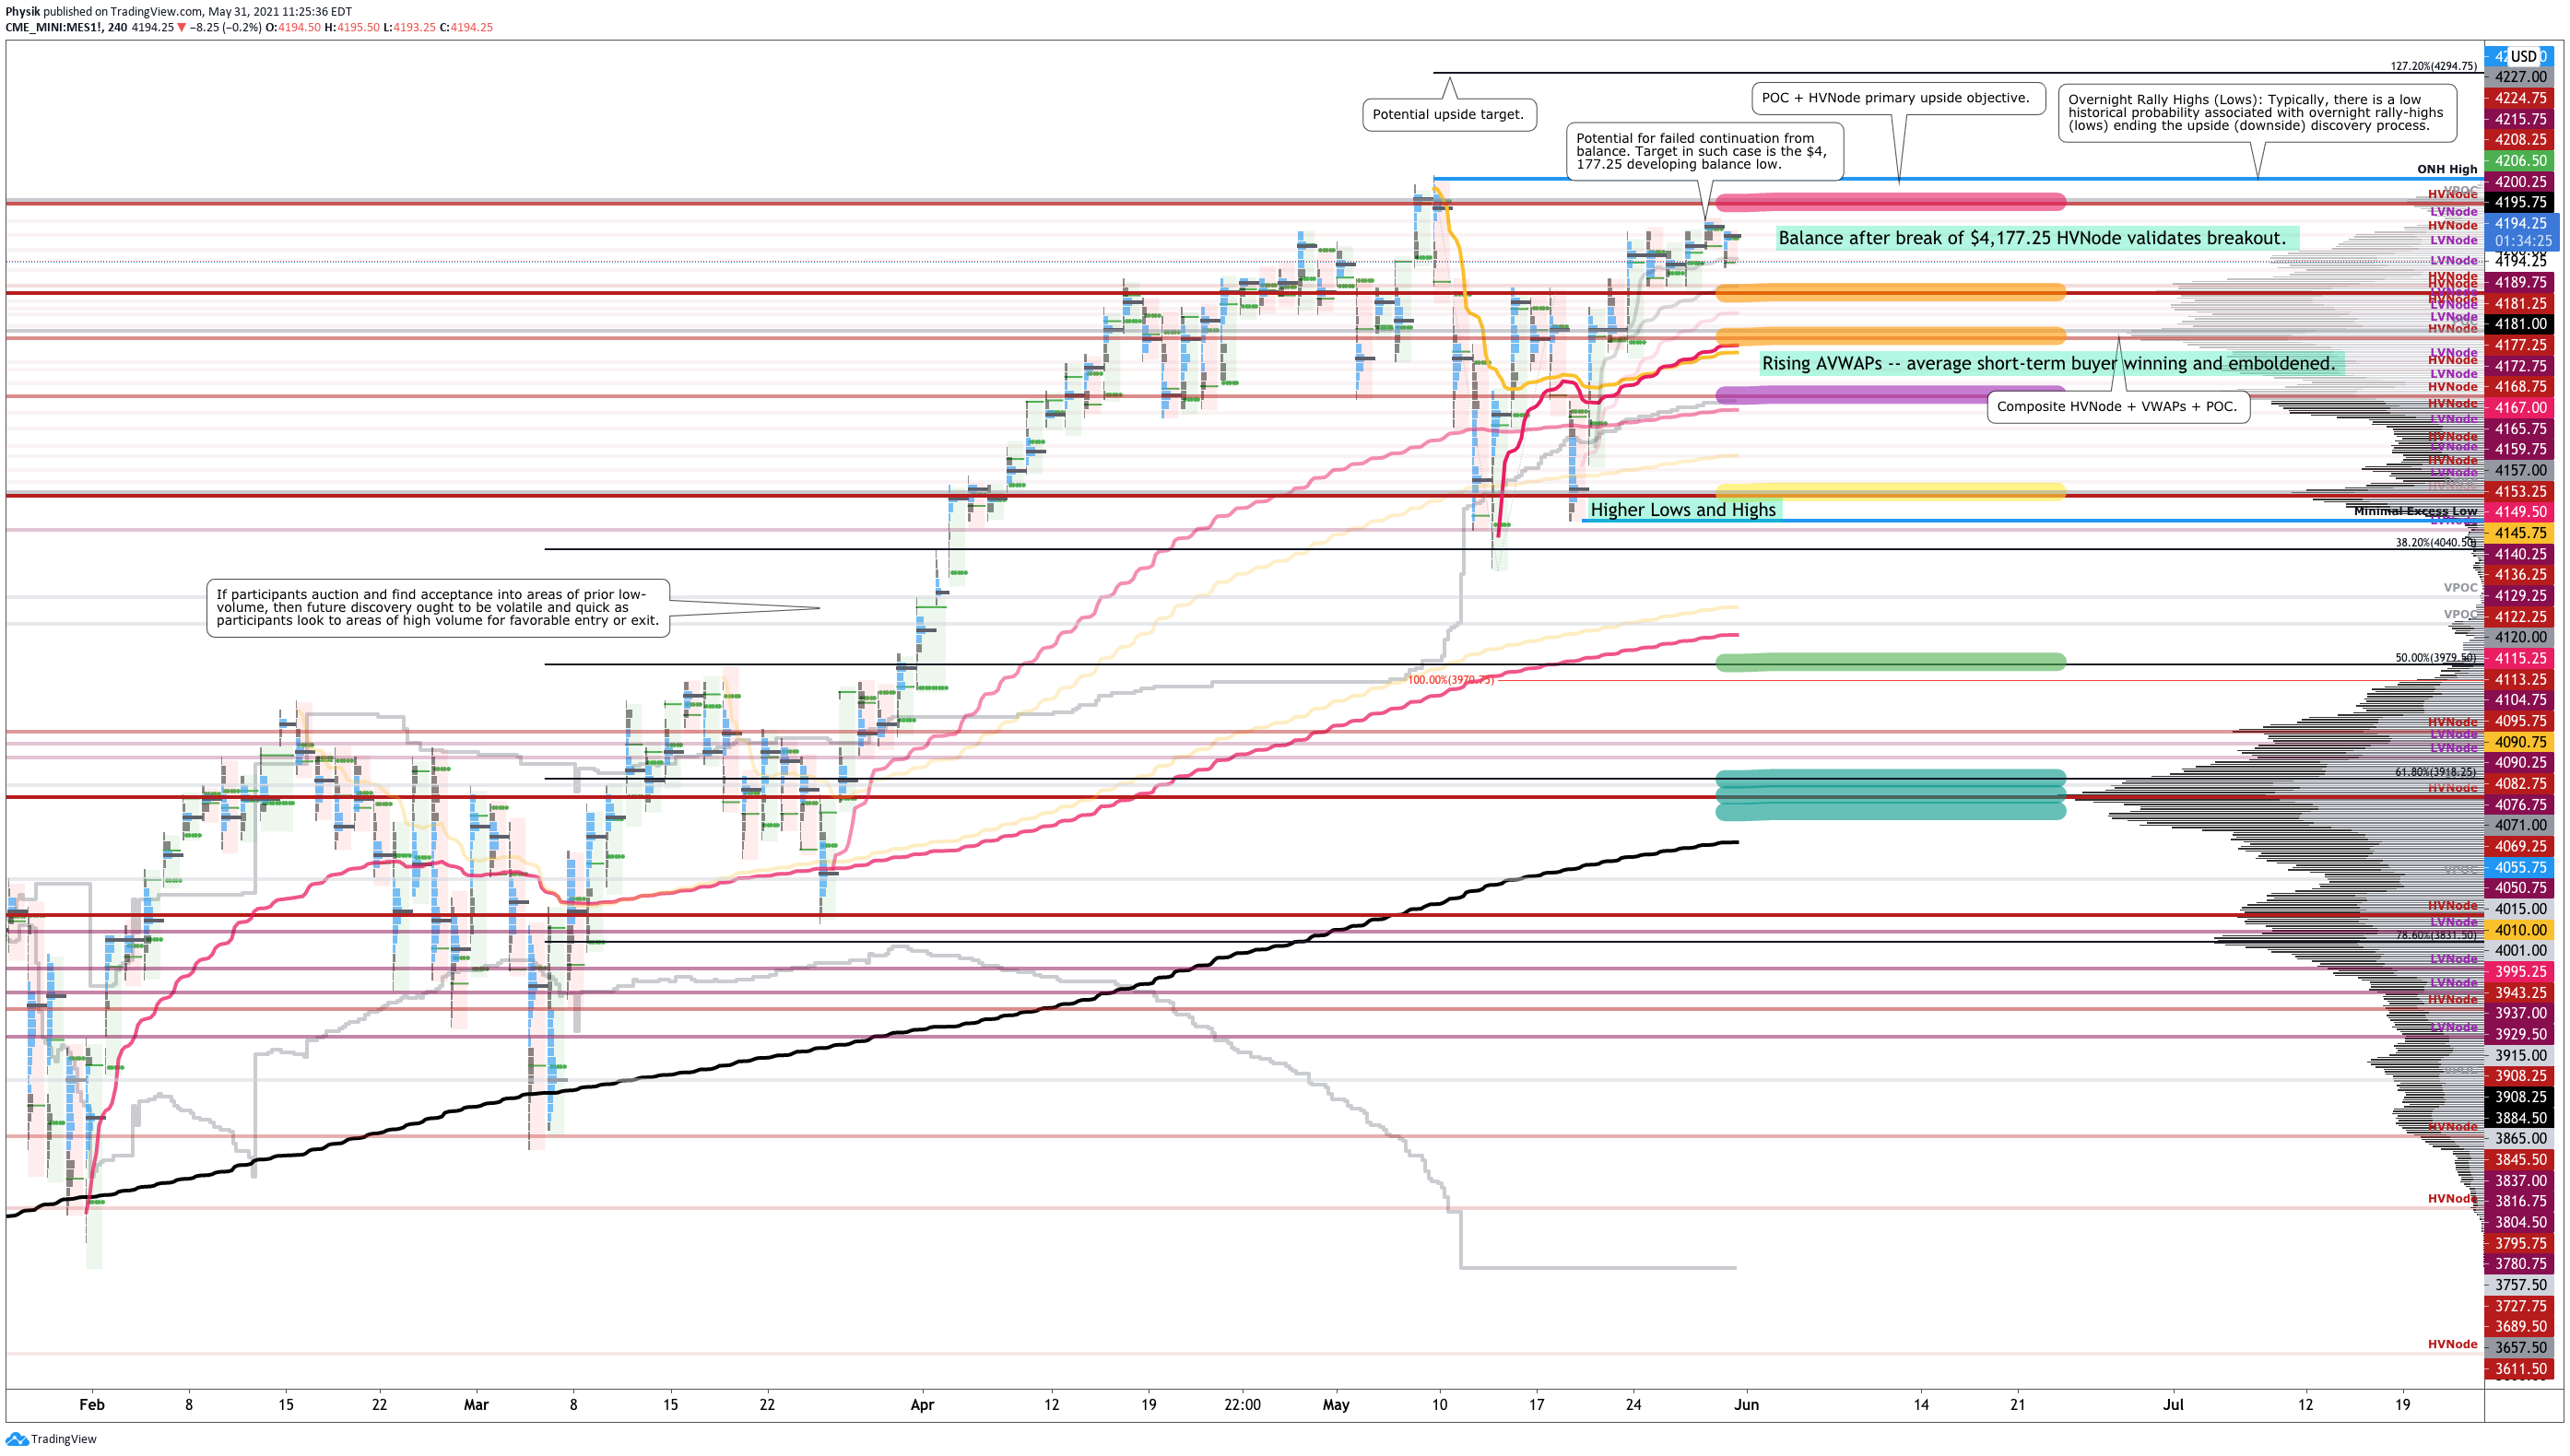
What To Expect: In the coming sessions, participants will want to focus their attention on where the S&P 500 trades in relation to the $4,197.25 high volume area (HVNode).

Volume Areas: A structurally sound market will build on past areas of high volume. Should the market trend for long periods of time, it will lack sound structure (identified as a low volume area which denotes directional conviction and ought to offer support on any test). 

If participants were to auction and find acceptance into areas of prior low volume, then future discovery ought to be volatile and quick as participants look to areas of high volume for favorable entry or exit.

That said, participants can trade from the following frameworks.

In the best case, the index trades sideways or higher; activity above $4,197.25 has the potential to reach the $4,227.00 point of control (POC). Initiative trade beyond the POC could reach as high as first the $4,238.00 overnight all-time high (ONH) and then, the $4,294.75 Fibonacci-derived price extension, a typical recovery target. 

POCs: POCs (like HVNodes described above) are valuable as they denote areas where two-sided trade was most prevalent. Participants will respond to future tests of value as they offer favorable entry and exit. 

Overnight Rally Highs (Lows): Typically, there is a low historical probability associated with overnight rally-highs (lows) ending the upside (downside) discovery process.

In the worst case, the index trades lower; activity below the $4,177.25 HVNode puts in play the $4,153.25 HVNode, first. Thereafter, if lower, the $4,122.25 HVNode and $4,071.00 POC come into play. 

On a cross through the $4,050.75 low volume area (LVNode), long-biased traders should beware of a rapid liquidation, as low as first the $4,015.00 and $4,001.00 POCs. In such a liquidation, odds favor a test of ~$3,970.00 50.00% retracement, as well as the $3,918.00 61.80% retracement and HVNode.

Graphic: 4-hour profile chart of the Micro E-mini S&P 500 Futures.
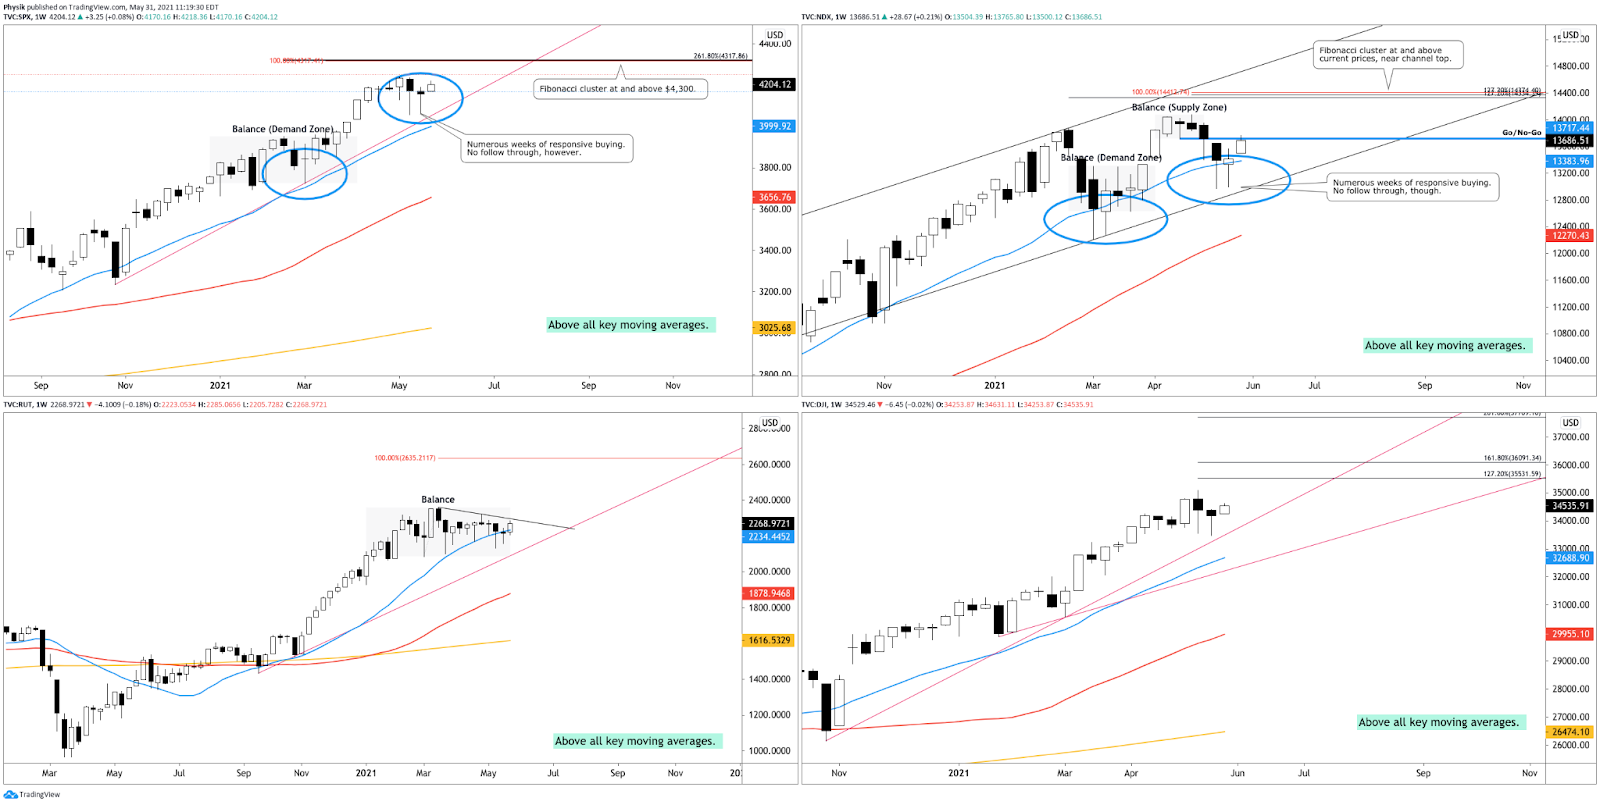
Graphic: Weekly candlestick charts of the S&P 500 (top left), Nasdaq 100 (top right), Russell 2000 (bottom left), and Dow Jones Industrial Average (bottom right). Nasdaq is primed for upside and has the potential to pull the S&P with it. 

News And Analysis

Trade | One of the world’s top ports expects delays on an outbreak. (BBG)

Markets | PBOC raises reserve ratio for foreign exchange holdings. (BBG)

Economy | Recovery solidifies in U.S., Europe, while EM faces risks. (Moody’s)

Markets | China bars banks from selling commodity-linked products. (REU)

Economy | Fed security purchases draw fire in hot U.S. housing market. (S&P)

Energy | Global oil demand is seen eclipsing India, Iran’s uncertainty. (S&P)

Economy | U.S. won’t experience stagflation over next few years. (Moody’s)

Economy | Non-government loans seeing a jump in forbearances. (MND)

Economy | U.S. speculative-grade corporate default rate to fall to 4%. (S&P)

Markets | Inflation, higher oil, stronger yuan point in same direction. (BBG)

Economy | U.S. retailers face headwinds from slowing sales, inflation. (S&P)

Markets | Everyone with bonds to liquidate had ample time to do so. (BBG)

What People Are Saying

Innovation And Emerging Trends

Markets | How recent growth in leveraged finance affects investors. (BZ)

Politics | Tech growth overshadowed by regulatory risks, challenges. (S&P)

Markets | Chamath: SPACs need more oversight and regulation. (BBG)

Politics | China moves to a three-child policy to boost its birthrate. (BBG)

Markets | Shakeout stirs debate over ether’s long-term potential. (BBG)

FinTech | Which banks are positioned for low rates, digital adoption. (S&P)

About

Renato founded Physik Invest after going through years of self-education, strategy development, and trial-and-error. His work reporting in the finance and technology space, interviewing leaders such as John Chambers, founder, and CEO, JC2 Ventures, Kevin O’Leary, businessman and Shark Tank host, Catherine Wood, CEO and CIO, ARK Invest, among others, afforded him the perspective and know-how very few come by.

Having worked in engineering and majored in economics, Renato is very detailed and analytical. His approach to the markets isn’t built on hope or guessing. Instead, he leverages the unique dynamics of time and volatility to efficiently act on opportunity.

Disclaimer

At this time, Physik Invest does not manage outside capital and is not licensed. In no way should the materials herein be construed as advice. Derivatives carry a substantial risk of loss. All content is for informational purposes only.
Categories
Commentary

Market Commentary For 2/4/2021

Notice: To view this week’s big picture outlook, click here.

What Happened: U.S. stock index futures balanced in prior-range, as evidenced by a lack of directional resolve.

What Does It Mean: After a rapid de-grossing and v-pattern recovery, stock indexes are nearing an important hurdle.

In particular, the S&P 500 has to contend with a transition into long-gamma.

Gamma is the sensitivity of an option to changes in underlying price. Dealers that take the other side of option trades hedge their exposure to risk by buying and selling the underlying.

When dealers are short-gamma, they hedge by buying into strength and selling into weakness. When dealers are long-gamma, they hedge by selling into strength and buying into weakness. The former exacerbates volatility. The latter calms volatility.

Adding: Here’s a good explanation I wrote regarding the derivative market’s impact on the equity market.

Graphic 1: SpotGamma suggests S&P 500 nearing “Long-Gamma” territory.

Further, given the aforementioned v-pattern recovery, a price sequence that ought to be followed by further price discovery, as high as the 100% price projection, which happens to be near $4,000.00 in the S&P 500, market participants ought to also pay attention to divergences popping up across different indices.

To be more specific, Wednesday’s regular trade in the Nasdaq-100 showed weakness relative to the S&P 500. In the end, participants established a neutral-center day on S&P 500 and neutral-extreme down day in the Nasdaq-100.

On a neutral-center day, participants test both extremes before closing an index in range, suggesting minimal confidence and balance. On a neutral-extreme day, participants test both extremes before closing at on extreme, suggesting increased confidence and imbalance.

The profile shape in the S&P 500 confirms balance while in the Nasdaq-100 it’s likely that participants were “too” long and had poor location.

What To Expect: Thursday’s regular session (9:30 AM – 4:00 PM ET) will likely open inside of prior-balance and -range, suggesting limited directional opportunity and high volatility.

Currently, the S&P 500 is rotating at the $3,842.00 high-volume area (HVNode).

As stated, HVNodes can be thought of as building blocks — they also denote areas of supply and demand. In this case, $3,842.00 can be thought of as an area of supply. The primary strategy is to respond to probes into these supply (i.e., selling responsively) and demand (i.e., buying responsively) areas as they offer favorable entry and exit.
In the coming session, participants will want to pay attention to Tuesday’s overnight high ($3,483.50) and Monday’s regular-trade low ($3,799.00). The reason being, between those two references is a developing balance area. Balance-areas make it easy to spot change in the market (i.e., the transition from two-time frame trade, or balance, to one-time frame trade, or trend).

Added Note: There is a low historical probability that overnight rally-highs end the upside discovery process.

From an order flow perspective, the absence of aggressive buying suggests more of the same — balance or downside to repair poor structures left in the wake of short-covering and initiative buying in the day’s prior.

In the simplest way, high-volume areas can be thought of as building blocks. A structurally sound market will build on past areas of high-volume. Should the market trend for long periods of time, it will lack sound structure. If participants were to auction and find acceptance into areas of prior low-volume, then future discovery ought to be volatile and quick as participants look to areas of value for favorable entry or exit.

For today, the following frameworks ought to be applied.

In the best case, the market will initiate above, or find acceptance at (in the form of rotational trade) the $3,842.00 HVNode. In the worst case, responsive sellers appear and restart the downside discovery process. Any break that finds increased involvement below the $3,799.00 regular-trade low, would favor continuation as low as the $3,727.75 HVNode.

The go/no-go for upside is the $3,843.50 overnight-trade high (ONH). The go/no-go for downside is $3,799.00 regular-trade low (RTH Low). Anything in-between portends responsive, non-directional trade.

A break above the ONH, participants may see discovery as high as $3,880.00, a balance-area projection (i.e., typical balance-break target). A break below the RTH Low, participants may see prices as low as $3,750.00, another balance-area projection.

Levels Of Interest: $3,843.50 ONH, $3,799.00 RTH Low.

Categories
Commentary

Market Commentary For 11/25/2020

What Happened: As investors await a flurry of economic data including GDP estimates, stock index futures are trading in range after a day of active discovery that found acceptance near the $3,630 balance-area high in the S&P 500.

What Does It Mean: In Tuesday’s regular trading, initiative buyers dominated the auction, after a break of the low-volume node at $3,580. Later in the session, buyers established an excess high, suggesting an end to the upside discovery process.

Overnight, however, buyers extended their gains before finding responsive sellers near the $3,650 mark, a balance-area projection.

As a result, participants come into Wednesday’s session knowing that (1) the market has made a substantial advance, (2) numerous high-profile economic releases are to be revealed, (3) the prior day’s p-shaped profile structure is weak and indicative of short-covering.

Therefore, today’s session may confirm if yesterday’s activity was the start of a new trend to the upside. Auctioning into Tuesday’s profile structure, below $3,625, may portend a rapid liquidation down to the $3,610 high-volume node, which ought to offer responsive buyers an opportunity to buy at lower prices and initiative sellers a favorable area to profit take. Spending time below yesterday’s value points to further balance.

In case participants accept higher prices, upside targets include the overnight high, as well as the November rally high at $3,668.75. An initiative drive through $3,610 would be the most bearish outcome, and would target the balance-area low and then the low-volume node at $3,580.

Levels Of Interest: $3,610 high-volume node, $3,655 overnight high, $3,668.75 rally high.