
Market Commentary
Equity index futures recover after Monday’s liquidation and brief overnight follow-through. Commodities were mixed and bonds were sideways to higher.
- Market positioning for an EOY rally?
- Ahead: Job openings, inflation data.
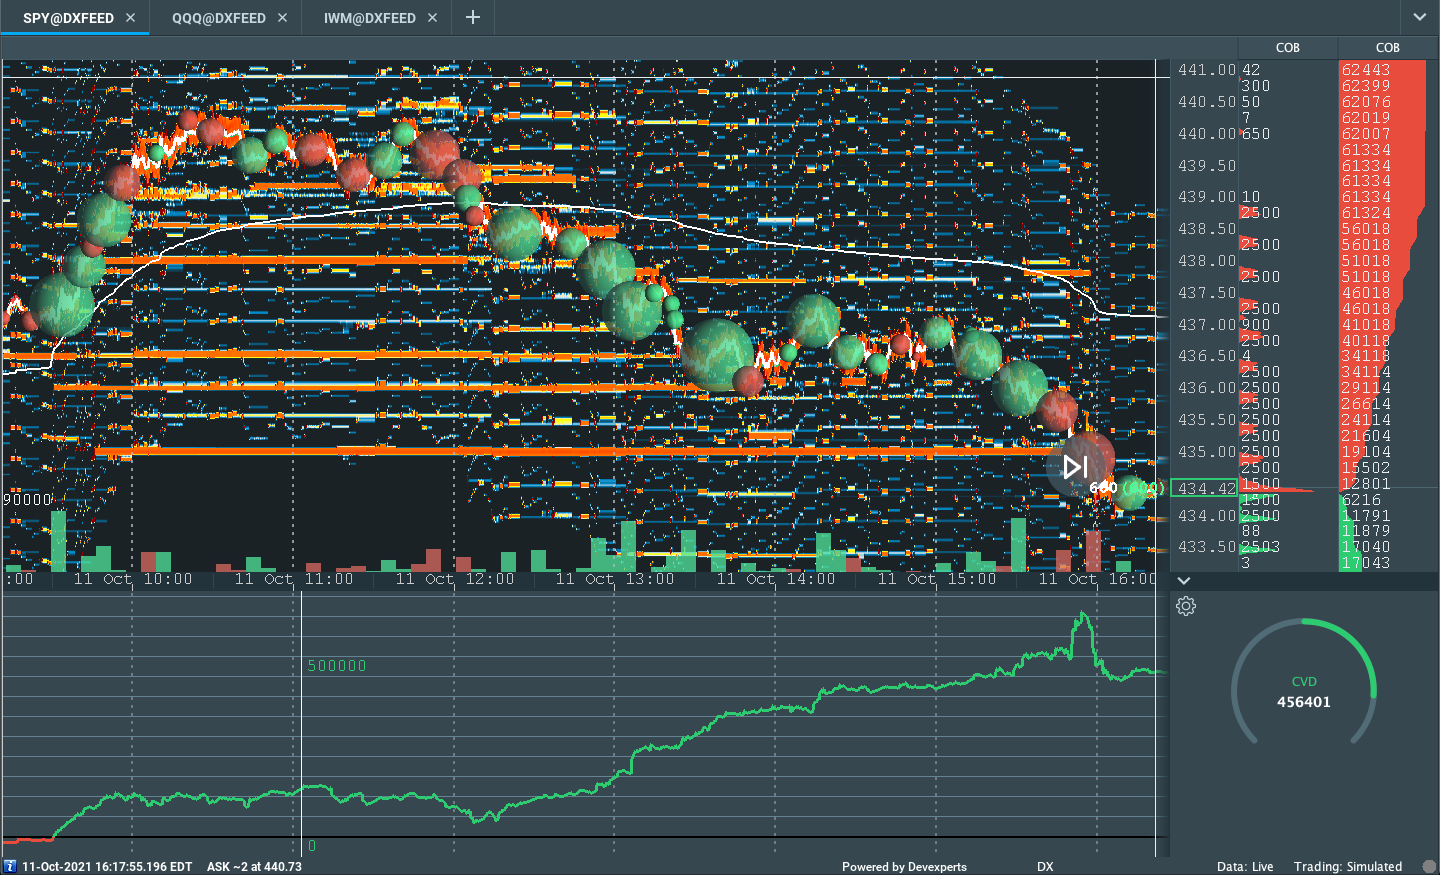
- New feature to view real-time levels.
What Happened: U.S. stock index futures recover from earlier bearishness, absent impactful fundamental narratives.
Ahead is data on the job openings (10:00 AM ET) and the median expected 3-year inflation rate (11:00 AM ET).
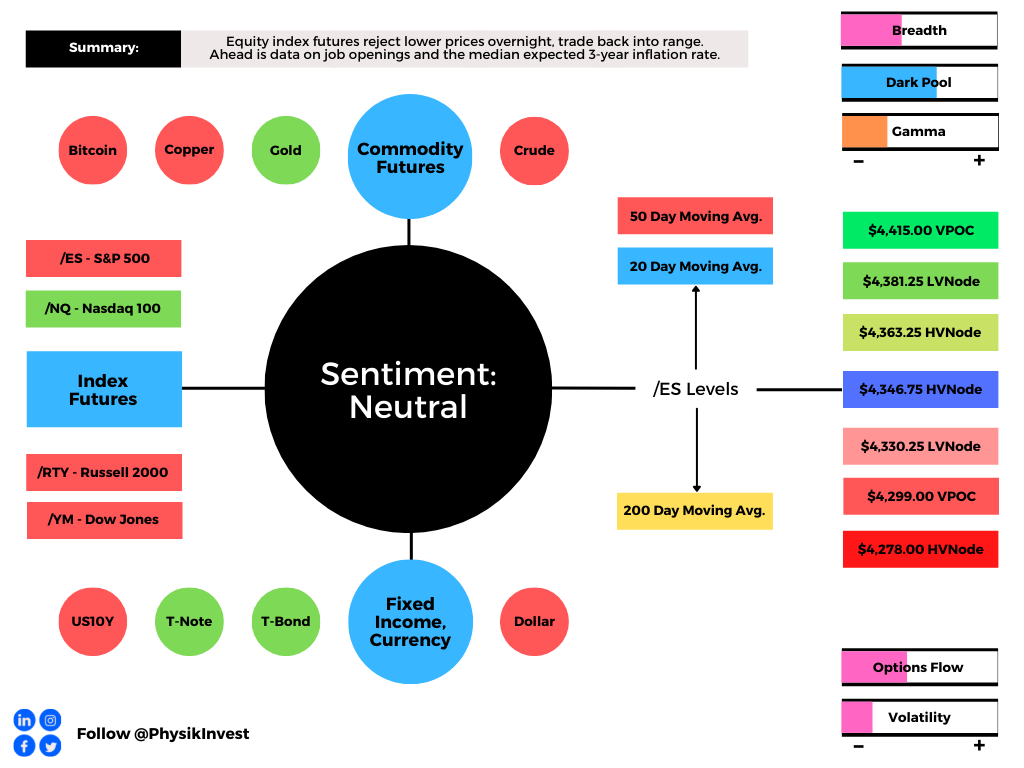
What To Expect: As of 6:30 AM ET, Tuesday’s regular session (9:30 AM – 4:00 PM EST) in the S&P 500 may open inside of prior-range and -value, suggesting a limited potential for immediate directional opportunity.
This comes after a volatile Monday.
At the outset, initiative sellers painted themselves into a corner at the convergence of the $4,363.25 high volume area (HVNode) pivot and an anchored volume-weighted average price.
Note: Liquidity algorithms are benchmarked and programmed to buy and sell around VWAPs, a metric highly regarded by chief investment officers, among others, for quality of trade.
After participants failed to muster the wherewithal to take prices lower, the S&P 500 then endured a rapid short-covering rally intraday – as evidenced by emotional, multiple distribution profile structures – before the momentum from covering shorts faded.
Thereafter, the S&P 500 liquidated, leaving behind a minimal excess high just south of the $4,408.75 low volume area (LVNode) and $4,415.00 untested point of control (VPOC).
Despite the spike and weak close, there was a minimal separation in value (i.e., the area where 70% of the day’s volume occurred); in other words, though participants valued lower prices, the knee-jerk, end-of-day move was not validated by increased trade at lower price levels.
Overnight exploration provided that validation before a massive change in tone after about 2:00 AM ET. Thereafter, indices recovered the prior day’s close.
Further, the aforementioned trade is happening in the context of a seasonal cycle of rebalancing and earnings, improvement among some positioning metrics, among other things.
These themes support (1) October volatility and (2) an increased potential for sideways to higher trade.
In support is JPMorgan Chase & Co’s (NYSE: JPM) Marko Kolanovic, a big stock market bull; “We believe that this was the last significant wave, and an effective end to the pandemic,” he said.
Kolanovic prefers economically sensitive shares over technology and growth stocks.
In opposition is Morgan Stanley’s (NYSE: MS) Mike Wilson who is on the side of pressured earnings, as a result of higher labor and material costs.
“Higher rates and a stronger USD have led to multiple compression, a process that remains unfinished, in our view,” he said in a note featured by The Market Ear. “Whether the final chapter of the mid-cycle transition ends with a 10% or 20% correction in the S&P 500 will be determined by how much earnings growth decelerates or has to outright decline (i.e., the Ice). We are gaining confidence in a sharper deceleration but the timing is more uncertain.”
Moreover, for today, participants may make use of the following frameworks.
In the best case, the S&P 500 trades sideways or higher; activity above the $4,346.75 HVNode invalidates Monday’s spike lower and puts in play the $4,363.25 HVNode. Initiative trade beyond the $4,363.25 HVNode could reach as high as the $4,381.25 LVNode and $4,415.00 VPOC, or higher.
In the worst case, the S&P 500 trades lower; activity below the $4,346.75 HVNode puts in play the $4,330.25 LVNode. Initiative trade beyond the LVNode could reach as low as the $4,299.00 VPOC and $4,278.00 HVNode, or lower.
Click here to load today’s real-time key levels into the web-based TradingView charting platform. Please note that all levels are derived using the 65-minute timeframe.

Definitions
Spikes: Spike’s mark the beginning of a break from value. Spikes higher (lower) are validated by trade at or above (below) the spike base (i.e., the origin of the spike).
Volume Areas: A structurally sound market will build on areas of high volume (HVNodes). Should the market trend for long periods of time, it will lack sound structure, identified as low volume areas (LVNodes). LVNodes denote directional conviction and ought to offer support on any test.
If participants were to auction and find acceptance into areas of prior low volume (LVNodes), then future discovery ought to be volatile and quick as participants look to HVNodes for favorable entry or exit.
POCs: POCs are valuable as they denote areas where two-sided trade was most prevalent in a prior day session. Participants will respond to future tests of value as they offer favorable entry and exit.
Balance (Two-Timeframe Or Bracket): Rotational trade that denotes current prices offer favorable entry and exit. Balance-areas make it easy to spot a change in the market (i.e., the transition from two-time frame trade, or balance, to one-time frame trade, or trend).
Modus operandi is responsive trade (i.e., fade the edges), rather than initiative trade (i.e., play the break).
Excess: A proper end to price discovery; the market travels too far while advertising prices. Responsive, other-timeframe (OTF) participants aggressively enter the market, leaving tails or gaps which denote unfair prices.
Value-Area Placement: Perception of value unchanged if value overlapping (i.e., inside day). Perception of value has changed if value not overlapping (i.e., outside day). Delay trade in the former case.
News And Analysis
JPMorgan’s Kolanovic says stocks can handle $130 oil.
Chinese developers are faced with cuts to credit ratings.
Federal Reserve will wimp out on hikes despite inflation.
Evergrande skips 3rd round of bond coupon payments.
More clarity on inflation doesn’t mean the news is good.
What People Are Saying
About
After years of self-education, strategy development, and trial-and-error, Renato Leonard Capelj began trading full-time and founded Physik Invest to detail his methods, research, and performance in the markets.
Additionally, Capelj is a finance and technology reporter. Some of his biggest works include interviews with leaders such as John Chambers, founder and CEO, JC2 Ventures, Kevin O’Leary, businessman and Shark Tank host, Catherine Wood, CEO and CIO, ARK Invest, among others.
Disclaimer
At this time, Physik Invest does not manage outside capital and is not licensed. In no way should the materials herein be construed as advice. Derivatives carry a substantial risk of loss. All content is for informational purposes only.