What Happened: U.S. stock index futures traded sideways overnight ahead of impactful developments such as the corporate earnings, FOMC meeting, and economic data.
Key takeaway: ”We had argued for a likely breakout in bond yields, and continue to believe that equities will be able to tolerate this repricing, as growth-policy trade-off remains supportive,” JPMorgan Chase & Co. (NYSE: JPM) strategists Mislav Matejka, Prabhav Bhadani, and Nitya Saldanha said. “The phase of activity pick-up is ahead of us. At the same time, excess liquidity is likely to stay ample, as policymakers err on the side of caution.”
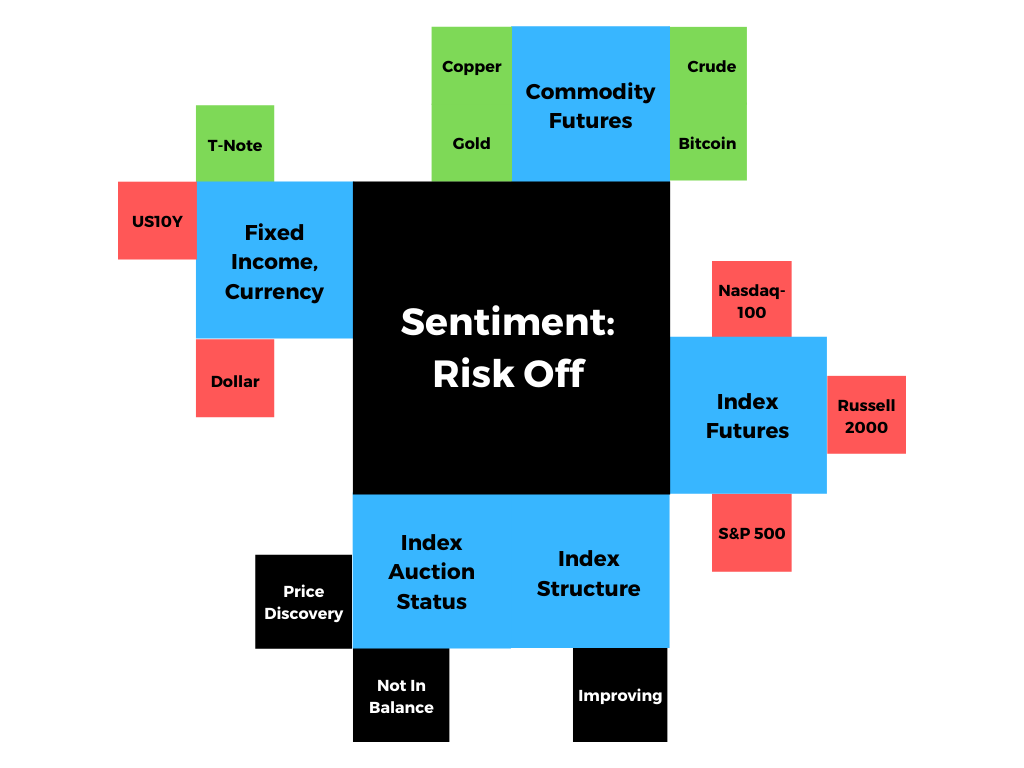
Graphic updated 7:50 AM EST.
What To Expect: Monday’s regular session in the S&P 500 (9:30 AM – 4:00 PM EST) will likely open inside of prior-range and -value, suggesting a limited potential for immediate directional opportunity.
Adding, during the prior day’s regular trade, the best case outcome occurred, evidenced by initiative trade that recovered Thursday’s news-driven liquidation. Adding, the liquidation failed to take out the $4,110.50 minimal excess low. Given those nuances, odds favor (1) a correction through time (i.e., balance), rather than price, or (2) higher prices.
Liquidation Breaks: The profile shape suggests participants were “too” long and had poor location.

Excess: A proper end to price discovery; the market travels too far while advertising prices. Responsive, other-timeframe (OTF) participants aggressively enter the market, leaving tails or gaps which denote unfair prices.

Balance (Two-Timeframe Or Bracket): Rotational trade that denotes current prices offer favorable entry and exit. Balance-areas make it easy to spot change in the market (i.e., the transition from two-time frame trade, or balance, to one-time frame trade, or trend).
For today, participants can trade from the following frameworks.
In the best case, the S&P 500 trades sideways or higher; activity above the $4,186.75 balance-area high targets the remaining Fibonacci price targets at and above $4,200.00.
In the worst case, the S&P 500 trades lower; activity below the $4,164.50 high-volume area (HVNode) targets the $4,153.25 HVNode. Thereafter, if lower, participants can look for responses at the $4,137.00 and $4,123.00 HVNodes.
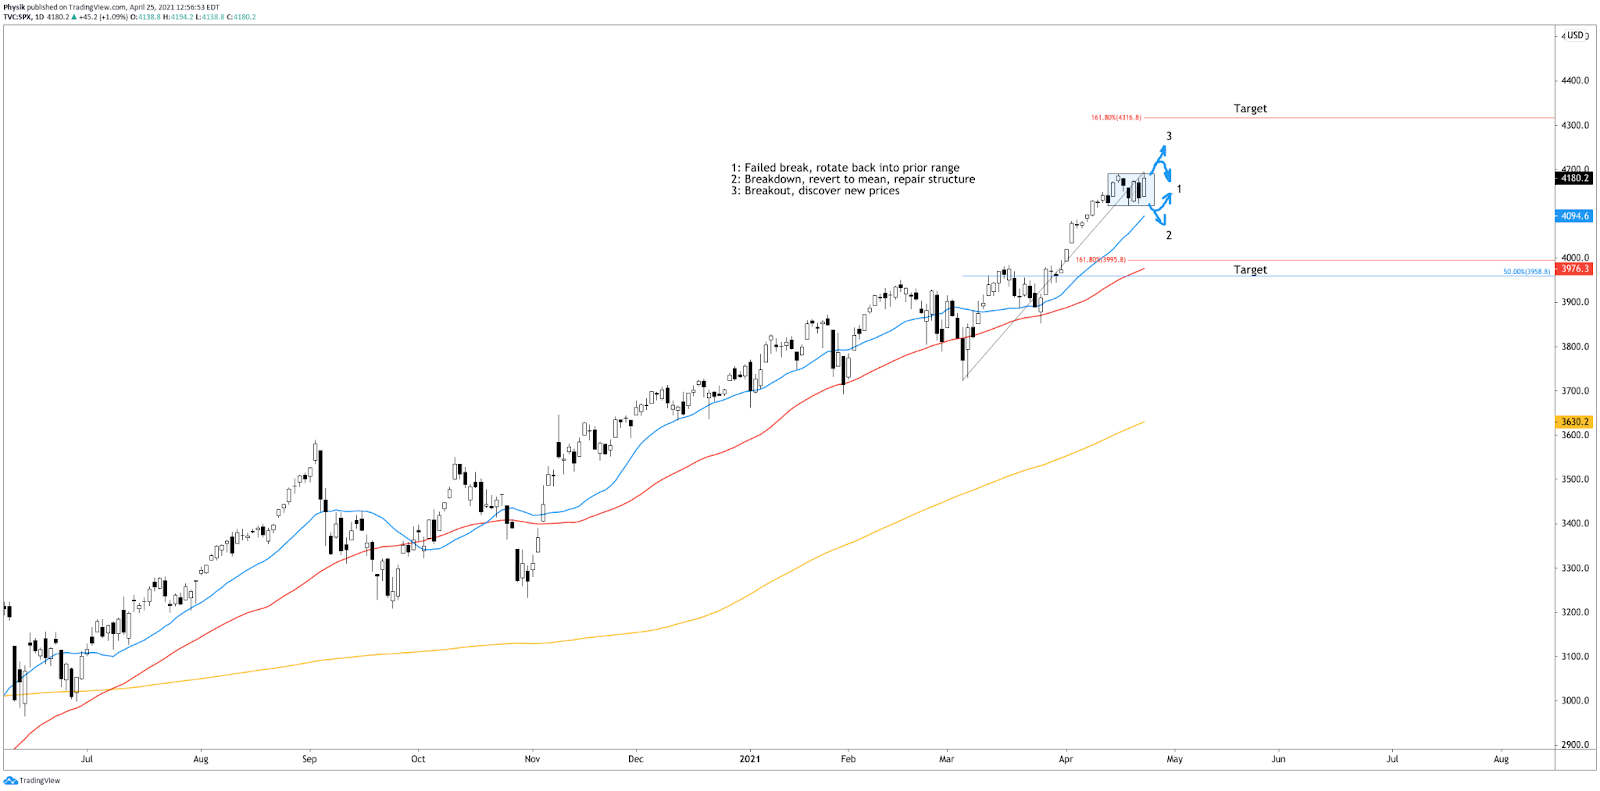
A break of the $4,110.50 minimal excess low suggests an inclination by participants to revert to the mean and repair some of the poor structure left behind prior discovery.
Volume Areas: A structurally sound market will build on past areas of high-volume. Should the market trend for long periods of time, it will lack sound structure (identified as a low-volume area which denotes directional conviction and ought to offer support on any test).

If participants were to auction and find acceptance into areas of prior low-volume, then future discovery ought to be volatile and quick as participants look to areas of high-volume for favorable entry or exit.
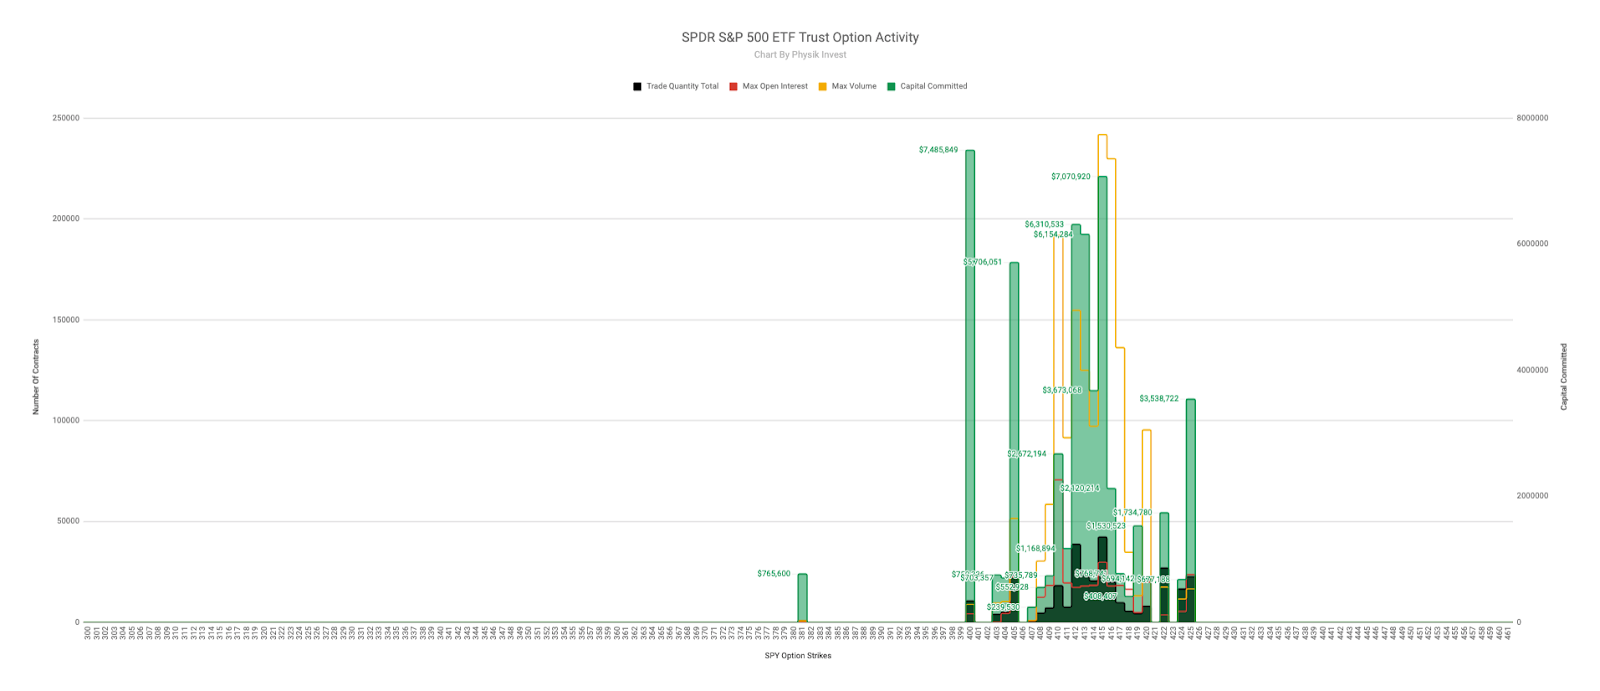
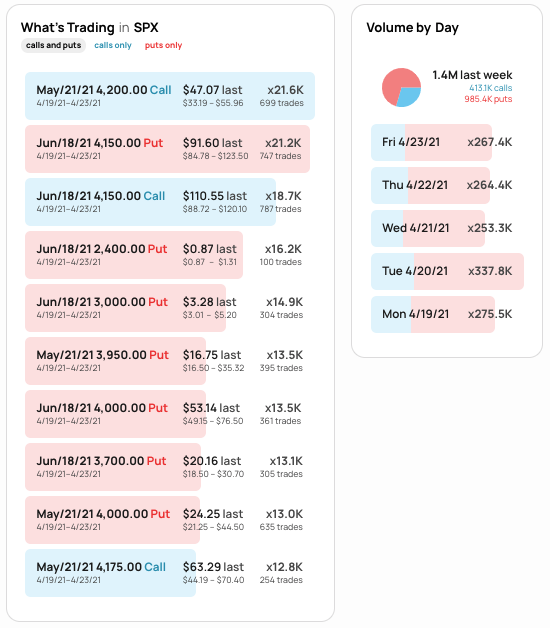
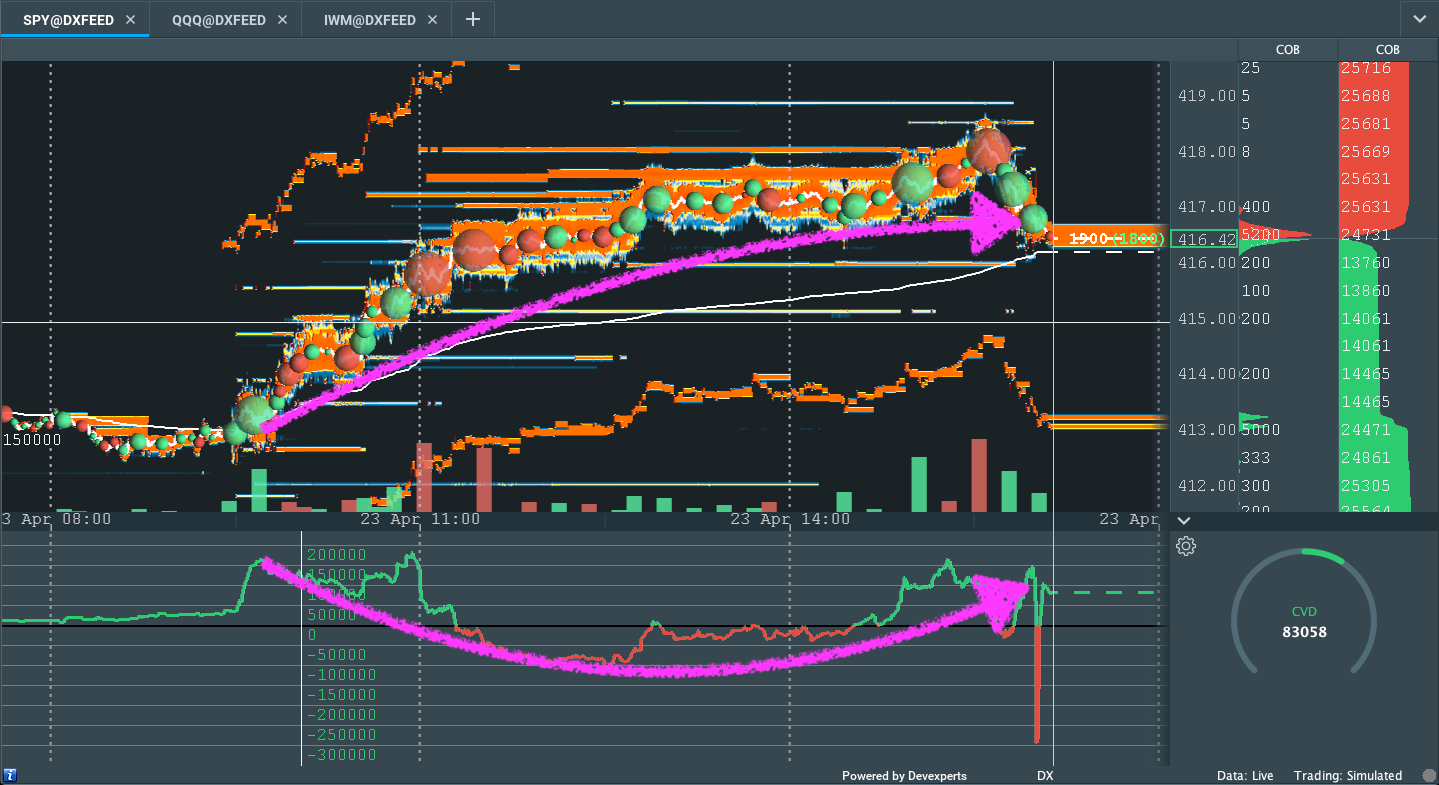
Graphic: 4-hour profile chart of the Micro E-mini S&P 500 Futures.Graphic: 1-day candlestick chart of the cash-settled S&P 500 Index (INDEX: SPX).Graphic: Physik Invest maps out the purchase of call and put options in the SPDR S&P 500 ETF Trust (NYSE: SPY), for the week ending April 23. Activity in the options market was primarily concentrated in short-dated tenors, in strikes as low as $381.00, which corresponds with $3,810.00 in the cash-settled S&P 500 Index (INDEX: SPX).Graphic: SHIFT search suggests participants are still not as inclined to add call-side exposure, through the month of May, in the cash-settled S&P 500 Index (INDEX: SPX).Graphic: SPDR S&P 500 ETF Trust (NYSE: SPY) market liquidity, via Bookmap. Note the divergent volume delta, a measure of buying and selling power as calculated by the difference in volume traded at the bid and offer. Such conditions favor balance (two-timeframe, rotational, or bracket trade).
News And Analysis
Economy | The Fed’s next test is breaking the ice over policy shift. (WSJ)
Politics | U.K. denies Boris Johnson said “let the bodies pile high.” (REU)
Economy | A disconnect between home sales, prices, and rates. (MND)
Economy | German government has raised 2021 growth forecast. (REU)
Economy | The grocery price shock is coming to a store near you. (BBG)
1/x so here we are after 2 weeks of a 🐌’s pace, correction in ⏰. The🪟is closing & our🐌is now primed for liftoff. As I explained last Sun night, the markets had every reason to decline in this🪟already. But it hasn’t even played🐔. Despite a long list of reasons to be🐻’ish, pic.twitter.com/LfQr4P9Pqh
"According to estimates by several online booking platforms, such as https://t.co/BpOh3ilgz8 and Airbnb, there will be 200-250 million travelers during the golden week holiday, marking an increase of 15% from 2019 on average" – Mizuho
In today's @markets newsletter, I wrote about how when the economy is booming, people talk about a "bill coming due" but the truth is the exact opposite. We pay for the busts, not for booms.
Markets | Beijing to crack down on home buying in a famous district. (BBG)
FinTech | Ant Group reveals crypto partnership history with the PBOC. (SCMP)
FinTech | It is a dangerous time to get caught up in the fintech frenzy. (FT)
Recovery | ‘We are drowning in insecurity’: young people after COVID. (FT)
About
Renato founded Physik Invest after going through years of self-education, strategy development, and trial-and-error. His work reporting in the finance and technology space, interviewing leaders such as John Chambers, founder, and CEO, JC2 Ventures, Kevin O’Leary, Canadian businessman and Shark Tank host, Catherine Wood, CEO and CIO, ARK Invest, among others, afforded him the perspective and know-how very few come by.
Having worked in engineering and majored in economics, Renato is very detailed and analytical. His approach to the markets isn’t built on hope or guessing. Instead, he leverages the unique dynamics of time and volatility to efficiently act on opportunity.
Disclaimer
At this time, Physik Invest does not manage outside capital and is not licensed. In no way should the materials herein be construed as advice. Derivatives carry a substantial risk of loss. All content is for informational purposes only.
What Happened: U.S. stock index futures auctioned lower overnight as investors weighed the risks of exposure given the potential for surprise earnings results and a recent spike in virus cases, among other factors.
What To Expect: Tuesday’s regular session (9:30 AM – 4:00 PM EST) in the S&P 500 will likely open outside of prior-range and -value, suggesting a higher-than-normal potential for directional opportunity.
During the prior day’s regular trade, the worst-case outcome occurred, evidenced by trade below the $4,171.00 VPOC, which is significant because it marks an area where participants found it most valuable to conduct business during a prior session. Thereafter, overnight, participants discovered lower prices and solicited responsive buying at the $4,137.00 high-volume area (HVNode).
Volume Areas: A structurally sound market will build on past areas of high volume. Should the market trend for long periods of time, it will lack sound structure (identified as a low-volume area which denotes directional conviction and ought to offer support on any test).

If participants were to auction and find acceptance into areas of prior low-volume, then future discovery ought to be volatile and quick as participants look to areas of high volume for favorable entry or exit.
This price action is occurring on the heels of an outstanding rally, fueled by vaccine rollouts, supportive central banks, and improved consumer finances. In a statement, JPMorgan Chase & Co (NYSE: JPM) expressed its optimism on a sustained equity market boom.
“We would not be cutting stocks exposure on a 6-9 months horizon, and continue to see any dips as buying opportunities,” JPMorgan analysts said. “We would not expect to see a more sustained pullback before Q4.”
Further, as stated in prior commentaries, equity markets are positioned bullish, but there exists an increased potential to correct in time and price. Should there be a drastic turn and spike in volatility, participants must be ready to accept the possibility of a violent liquidation, given poor structure left behind prior price discovery and increased put selling, among other factors.
Price Discovery (One-Timeframe Or Trend): Elongation and range expansion denotes a market seeking new prices to establish value, or acceptance (i.e., more than 30-minutes of trade at a particular price level).
For today, participants can trade from the following frameworks.
In the best case, the S&P 500 trades sideways or higher; activity above the $4,142.00 regular trade low (RTH Low) targets the $4,155.00 HVNode. Initiative trade beyond the HVNode could reach as high as $4,167.50 overnight high (ONH).
In the worst case, the S&P 500 trades lower; activity below $4,142.00 targets the $4,122.75 HVNode. Thereafter, if lower, participants can look for a repair of the poor structure sitting at the $4,113.00 low. Trading below $4,104.00 suggests a test as low as the $4,069.25 HVNode is likely.
Graphic: 65-minute profile chart of the Micro E-mini S&P 500 Futures.Graphic: Physik Invest maps out the purchase of call and put options in the SPDR S&P 500 ETF Trust (NYSE: SPY), for April 19, 2021. Activity in the options market was primarily concentrated in short-dated tenors, in strikes as low as $403, which corresponds with $4,030 in the cash-settled S&P 500 Index (INDEX: SPX).
Markets | The OCC has announced a reduction of its clearing fee to two cents. (TM)
Venture | Where the startup world sees money in the $2.3T infrastructure plan. (CN)
About
Renato founded Physik Invest after going through years of self-education, strategy development, and trial-and-error. His work reporting in the finance and technology space, interviewing leaders such as John Chambers, founder, and CEO, JC2 Ventures, Kevin O’Leary, Canadian businessman and Shark Tank host, Catherine Wood, CEO and CIO, ARK Invest, among others, afforded him the perspective and know-how very few come by.
Having worked in engineering and majored in economics, Renato is very detailed and analytical. His approach to the markets isn’t built on hope or guessing. Instead, he leverages the unique dynamics of time and volatility to efficiently act on opportunity.
Disclaimer
At this time, Physik Invest does not manage outside capital and is not licensed. In no way should the materials herein be construed as advice. Derivatives carry a substantial risk of loss. All content is for informational purposes only.
Index futures are attempting to balance and validate higher prices.
U.S. calls for pause to one vaccine.
Participants await data on inflation.
Futures off new highs, but in-range.
What Happened: U.S. stock index futures auctioned higher overnight before liquidating alongside calls to stop using the Johnson & Johnson (NYSE: JNJ) vaccine after clotting cases.
What To Expect: Tuesday’s regular session (9:30 AM – 4:00 PM EST) will likely open inside of prior-range and -value, suggesting a low potential for immediate directional opportunity.
Adding, during the prior day’s regular trade, the best case outcome occurred, evidenced by range-bound trade above the $4,104.00 spike base, which is significant because it validated Friday’s late-day knee-jerk rally away from value, or the fairest price to do business for that session.
Coming up, consumer-price index numbers will be released at 8:30 a.m. EST; participants increasingly see the risks of inflation and taxes as a big headwind.
As an aside, as noted in the Weekly Brief, Friday, April 16, will mark an end to the monthly options expiration. As that date approaches, and volatility continues to drop, given how participants are positioned, odds of sustained directional resolve are low.
For today, participants can trade from the following frameworks.
In the best case, the S&P 500 trades sideways or higher; activity above the $4,104.00 spike base targets $4,117.25, the 50% overnight retracement. Initiative trade beyond the 50% retracement could reach as high as the $4,127.00 ONH. In the worst case, the S&P 500 trades lower; activity below $4,104.00 puts the rally on hold and targets the $4,069.00 and $3,943.00 high-volume areas (HVNodes).
More On Overnight Rally Highs (Lows): Typically, there is a low historical probability associated with overnight rally-highs (lows) ending the upside (downside) discovery process.

More On Volume Areas: A structurally sound market will build on past areas of high-volume (HVNode). Should the market trend for long periods of time, it will lack sound structure (identified as a low-volume area (LVNode) which denotes directional conviction and ought to offer support on any test).

If participants were to auction and find acceptance into areas of prior low-volume, then future discovery ought to be volatile and quick as participants look to areas of high volume for favorable entry or exit.
Graphic: 4-hour profile chart of the Micro E-mini S&P 500 Futures.Graphic: Physik Invest maps out the purchase of call and put options in the SPDR S&P 500 ETF Trust (NYSE: SPY), for April 12. Activity in the options market was primarily concentrated in short-dated tenors, in strikes as low as $398, which corresponds with $3,980 in the cash-settled S&P 500 Index (INDEX: SPX).Graphic: SHIFT search shows that trade in the cash-settled S&P 500 Index (INDEX: SPX) was concentrated in put strikes below current prices.
Realized volatility is back to post Covid-Crash lows as we push towards 4/16 OPEX. Currently we see ~30% of S&P gamma rolling off by Fridays close. pic.twitter.com/0xWzQYQ1Vb
Step 1: Pick few horizontal patterns Step 2: Pick a time frame Step 3: Go through as many charts/instruments (tradable) as possible Step 4: Build a daily/weekly routine to review same charts Step 5: Be selective pic.twitter.com/Jx6p3KrfdP
Renato founded Physik Invest after going through years of self-education, strategy development, and trial-and-error. His work reporting in the finance and technology space, interviewing leaders such as John Chambers, founder, and CEO, JC2 Ventures, Kevin O’Leary, Canadian businessman and Shark Tank host, Catherine Wood, CEO and CIO, ARK Invest, among others, afforded him the perspective and know-how very few come by.
Having worked in engineering and majored in economics, Renato is very detailed and analytical. His approach to the markets isn’t built on hope or guessing. Instead, he leverages the unique dynamics of time and volatility to efficiently act on opportunity.
Disclaimer
At this time, Physik Invest does not manage outside capital and is not licensed. In no way should the materials herein be construed as advice. Derivatives carry a substantial risk of loss. All content is for informational purposes only.
Index futures are attempting to balance and validate higher prices.
Pay attention to economic reports.
Earnings season officially starting.
Balance-to-higher into April OPEX.
What Happened: U.S. stock index futures balanced overnight ahead of first-quarter earnings reports by large financial firms.
What To Expect: Monday’s regular session in the S&P 500 (9:30 AM – 4:00 PM EST) will likely open inside of prior-range and -value, suggesting a limited potential for directional opportunity.
Adding, during prior regular trade, the best case outcome occurred, evidenced by initiative trade above the S&P 500’s $4,100.00 high-interest strike, which will act as a magnet into Friday’s monthly options expiration (OPEX).
Option Expiration (OPEX) Significance: Option expiries mark an end to pinning (i.e, the theory that market makers and institutions short options move stocks to the point where the greatest dollar value of contracts will expire worthless) and the reduction dealer gamma exposure.
As a result, given low trading volumes, and because of how impactful activity in the derivatives market is, traders should consider the potential for further balance or digestion of higher prices.
Further, for today, participants can trade from the following frameworks.
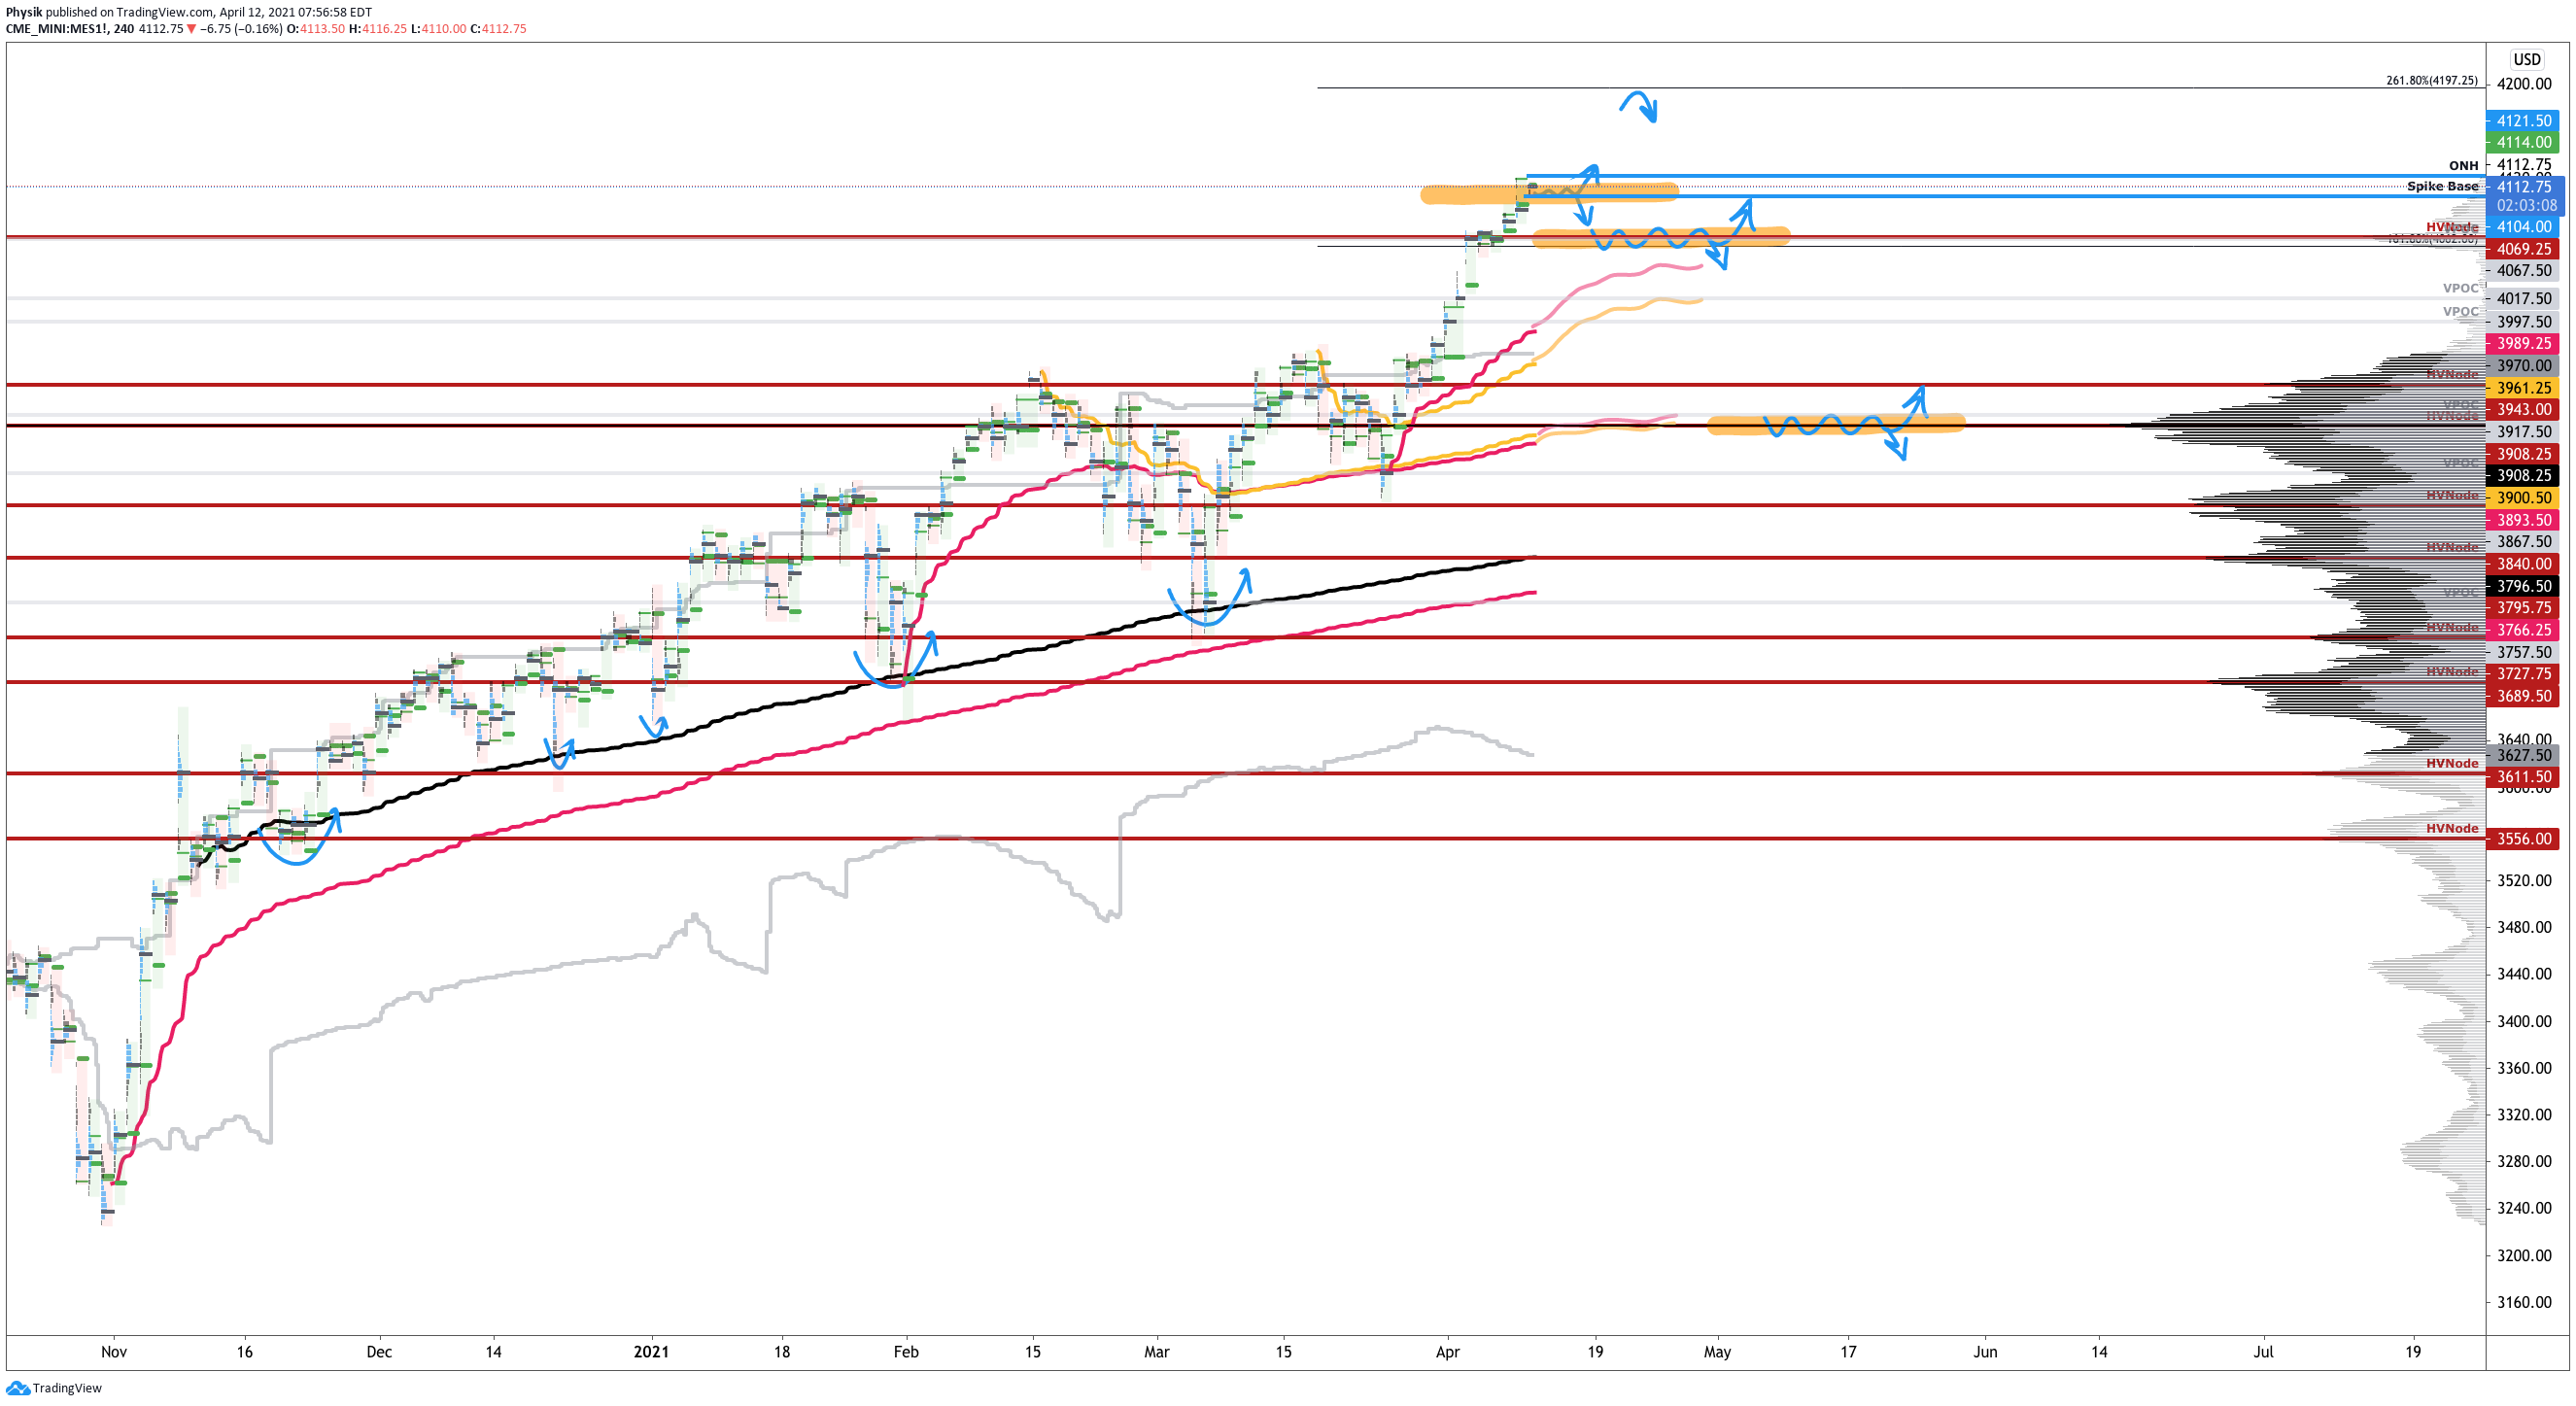
In the best case, the S&P 500 trades sideways or higher; activity above the $4,104.00 spike base targets the $4,121.50 overnight-high (ONH). Initiative trade beyond the ONH could reach as high as the $4,197.25 price extension. In the worst case, the S&P 500 trades lower; activity below the $4,104.00 spike base targets the $4,069.00 and $3,943.00 high-volume areas (HVNode).
More On Overnight Rally Highs (Lows): Typically, there is a low historical probability associated with overnight rally-highs (lows) ending the upside (downside) discovery process.

More On Volume Areas: A structurally sound market will build on past areas of high-volume (HVNode). Should the market trend for long periods of time, it will lack sound structure (identified as a low-volume area (LVNode) which denotes directional conviction and ought to offer support on any test).

If participants were to auction and find acceptance into areas of prior low-volume, then future discovery ought to be volatile and quick as participants look to areas of high volume for favorable entry or exit.
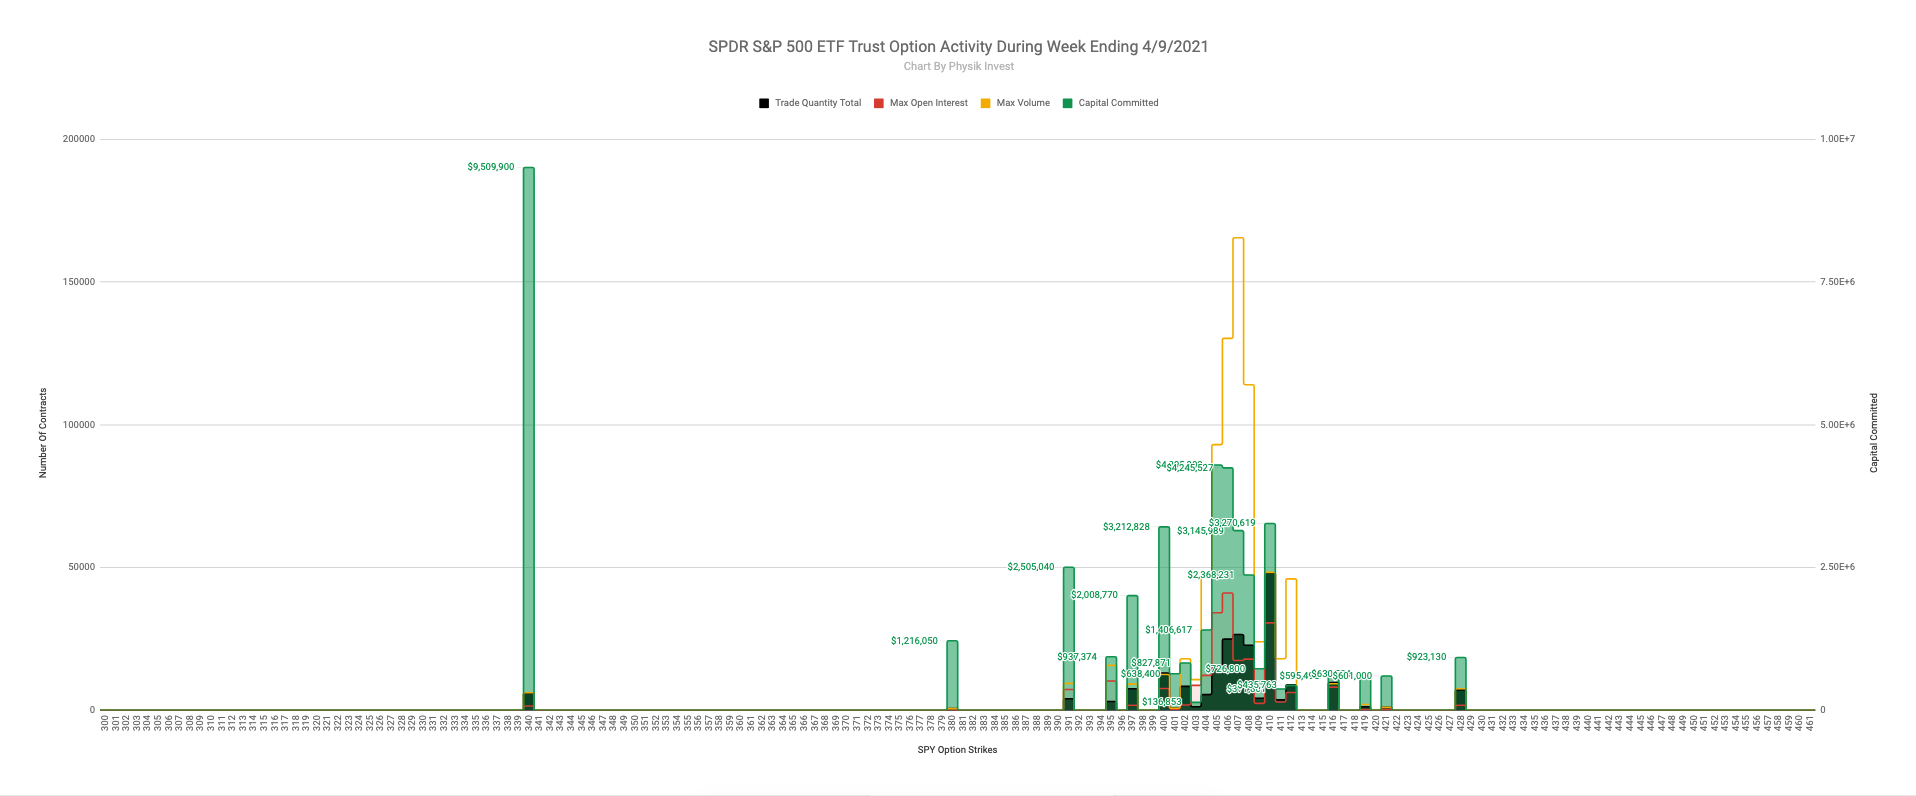
Graphic 1: 4-hour profile chart of the Micro E-mini S&P 500 Futures.Graphic 2: Physik Invest maps out the purchase of call and put options in the SPDR S&P 500 ETF Trust (NYSE: SPY), for the week ending April 9, 2021. Activity in the options market was primarily concentrated in short- and long-dated tenors, in put strikes as low as $340, which corresponds with $3,400 in the cash-settled S&P 500 Index (INDEX: SPX).
More index puts are being shorted then bought. The other times similar levels materialized was after large mkt declines – so puts were more expensive w/more volatility premium. Here though, traders have decided to step up and short puts with markets at record highs. pic.twitter.com/P8WdReVmdO
1/x Here we are @ 4/12. The rally to ATH has transpired as predicted & the VIX has tumbled to 13 month lows. The🪟of weakness has opened & this is where things start to get weird…it’s NEVER straightforward, & imagining how this market will manage to tumble through the🪟begins https://t.co/8U3awYjXXTpic.twitter.com/VFzC9KdRuX
Renato founded Physik Invest after going through years of self-education, strategy development, and trial-and-error. His work reporting in the finance and technology space, interviewing leaders such as John Chambers, founder, and CEO, JC2 Ventures, Kevin O’Leary, Canadian businessman and Shark Tank host, Catherine Wood, CEO and CIO, ARK Invest, among others, afforded him the perspective and know-how very few come by.
Having worked in engineering and majored in economics, Renato is very detailed and analytical. His approach to the markets isn’t built on hope or guessing. Instead, he leverages the unique dynamics of time and volatility to efficiently act on opportunity.
Disclaimer
At this time, Physik Invest does not manage outside capital and is not licensed. In no way should the materials herein be construed as advice. Derivatives carry a substantial risk of loss. All content is for informational purposes only.
Welcome to Market Intelligence, Physik Invest’s response to the many newsletters that seldom provide actionable market insights, free.
Through this newsletter you will get a glimpse into the following:
The implications of credit and positioning.
Impactful events in finance and technology.
Technical commentary for index products.
Media on emerging trends and hot topics.
Again, thanks for joining! Physik Invest looks forward to providing you an objective view into the who, what, when, where, why, and how in finance and technology.
What Happened: U.S. stock index futures closed higher, last week.
What Does It Mean: The S&P 500 closed above $4,100 for the first time as investors looked to price in an economic “‘Goldilocks moment’—fast, sustained growth alongside inflation and interest rates that drift slowly upward.”
According to a letter by JPMorgan Chase & Co’s (NYSE: JPM) Jamie Dimon, strong consumer savings, an increased pace in COVID-19 coronavirus vaccinations, and unprecedented efforts to spur economic activity could mean that a boom lasts as long as 2023.
This perspective differs from Dimon’s comments a year ago; he warned of a recession in which GDP could fall nearly 35%. Is Dimon one to fade? Likely not, given the fact that (1) he heads one of the biggest banks and (2) most forecasts by other institutions support Dimon’s perspectives.
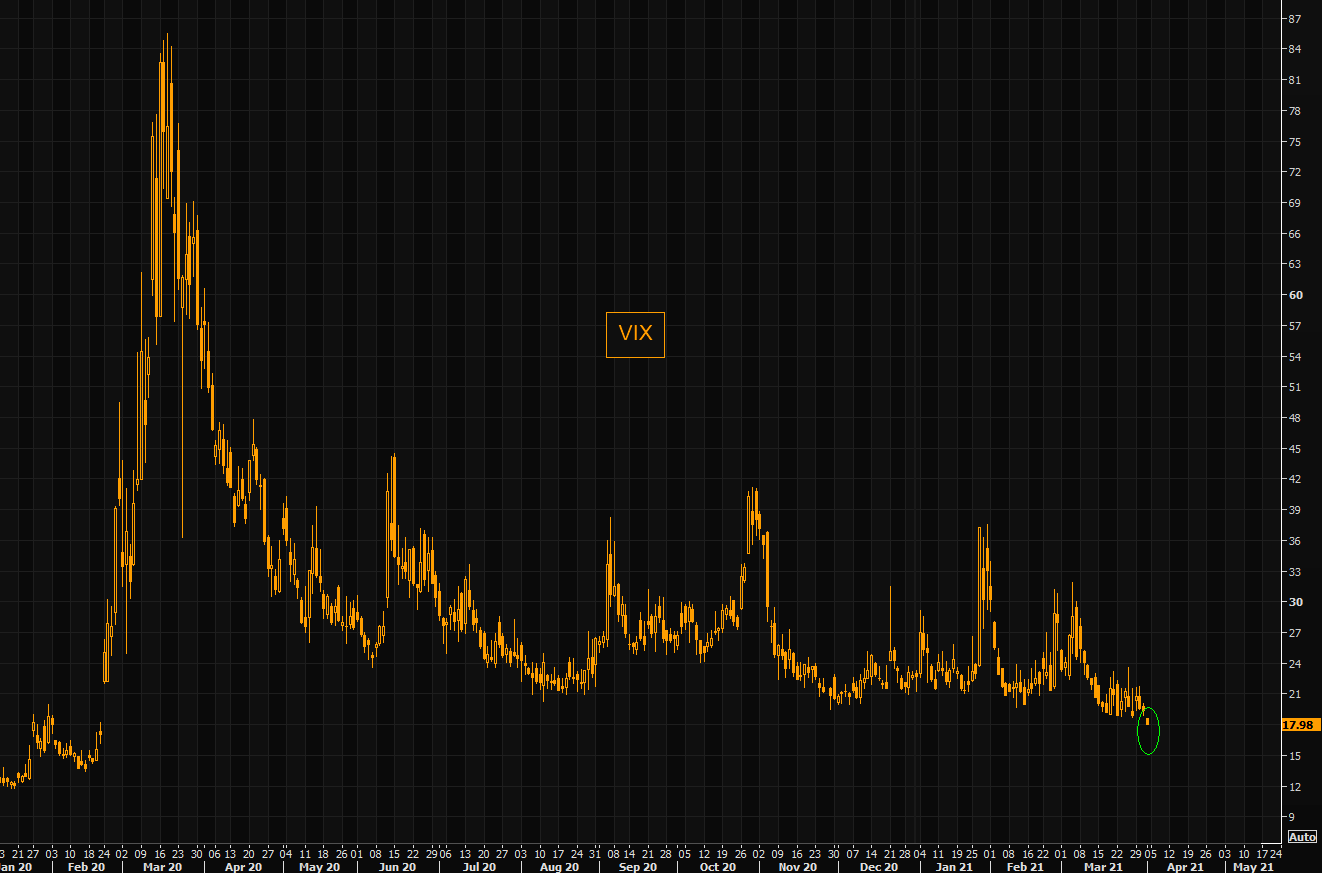
Further, the CBOE Volatility Index (INDEX: VIX), a measure of the stock market’s expectation of volatility based on S&P 500 (INDEX: SPX) options, traded to its lowest level since February 2020.
At the same time, participants saw blocks of VIX call spreads — bets that serenity won’t last — hit the tape; the unknown participant(s) bought nearly 200,000 contracts.
Graphic 1: Risk graph of the 25/40 VIX call spread in question via MarketEar.
“With VIX being priced in the low 17 area, I would imagine we would see more of these larger-sized bets going forward,” Kris Sidial, co-chief investment officer at Ambrus Group, told Bloomberg. “I think smart money understands that, although volatility has contracted a lot in these last two months, we are still seeing signs of excess market fragility appear from many different angles.”
Graphic 2: Volatility declines to its lowest level since February 2020.
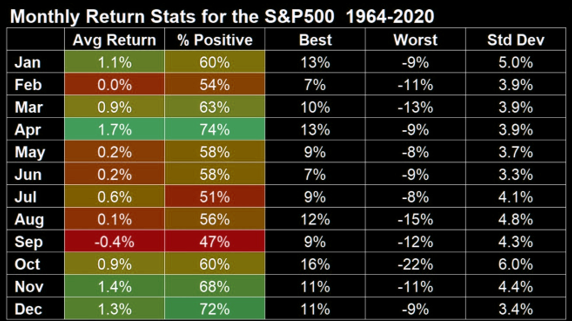
As stated last week, the market is in a historically bullish period, ahead of the upcoming corporate earnings season, with structural flows supporting the ongoing narrative into the coming April monthly options expiration (OPEX).
Option Expiration (OPEX) Significance: Option expiries mark an end to pinning (i.e, the theory that market makers and institutions short options move stocks to the point where the greatest dollar value of contracts will expire worthless) and the reduction dealer gamma exposure.
As realized volatility falls from its peak around a year ago, more sold SPX options cluster at strikes nearer to spot. And as implied volatility falls with it, the gamma of those options increases.
More dealer long gamma means more liquidity. More liquidity means less movement. pic.twitter.com/712OAMq7iP
Adding, most funds are committed to holding long positions. In the interest of lower volatility returns, these funds will collar off their positions, selling calls to finance the purchase of downside put protection.
As a result of this activity, options dealers are long upside and short downside protection.
This exposure must be hedged; dealers will sell into strength as their call (put) positions gain (lose) value and buy into weakness as their call (put) positions lose (gain) value.
Now, unlike theory suggests, dealers will hedge call losses (gains) quicker (slower). This leads to “long-gamma,” a dynamic that crushes volatility and promotes momentum, observed by lengthy sprints — like the one the market is currently in — followed by rapid de-risking events as the market transitions into “short-gamma.”
What To Expect: Balance-to-higher.
Important to note is that equity market inflows, over the past 5 months, exceeded inflows of the prior 12 years, total. Think about the supply and demand dynamics of the market; in case of an equity market sell-off, a lot of late buyers will have poor location which may leave a thick area of supply above the market, putting a dampener on future rallies.
“You should definitely be worried about valuations and all the more so when people start justifying extremely high valuations. We are risk-on, but we haven’t put our foot down on the accelerator because of valuations in some parts of the market,” said Fahad Kamal, chief investment officer at Kleinwort Hambros.
Adding to the narrative, metrics, like DIX, confirm increased buying pressure while divergences in options activity suggest opportunistic hedging, especially with puts trading at their cheapest level, relative to calls the same delta.
Graphic 3: 1-month 25 delta risk-reversal, via SpotGamma, suggests puts are trading cheap.
More On DIX: For every buyer is a seller (usually a market maker). Using DIX — which is derived from short sales (i.e., liquidity provision on the market-making side) — we can measure buying pressure.
Graphic 4: Physik Invest maps out the purchase of call and put options in the SPDR S&P 500 ETF Trust (NYSE: SPY), for the week ending April 9, 2021. Activity in the options market was primarily concentrated in short- and long-dated tenors, in put strikes as low as $340, which corresponds with $3,400 in the cash-settled S&P 500 Index (INDEX: SPX).
What To Do: In the coming sessions, participants will want to pay attention to where the S&P 500 trades in relation to Friday’s end-of-day spike higher.
More On Spikes: Spike’s mark the beginning of a break from value. Spikes higher (lower) are validated by trade at or above (below) the spike base (i.e., the origin of the spike).
In the best case, the S&P 500 remains above the $4,104.00 spike base. Doing so means that the participants are validating the prices caused by the late-day knee-jerk rally.
In the case of higher prices, given that the 161.80% and 127.20% Fibonacci price extensions were achieved, and after-market trade established an overnight high at $4,121.50, participants can target prices as high as the $4,197.25 price extension.
More On Overnight Rally Highs (Lows): Typically, there is a low historical probability associated with overnight rally-highs (lows) ending the upside (downside) discovery process.
Any activity below the $4,104.00 spike base puts the rally on hold and calls for balance or an attempt to digest higher prices.
Balance (Two-Timeframe Or Bracket): Rotational trade that denotes current prices offer favorable entry and exit. Balance-areas make it easy to spot a change in the market (i.e., the transition from two-time frame trade, or balance, to one-time frame trade, or trend).
In the case of lower prices, participants can look to whether a test of the $4,069.00 high-volume area (HVNode) solicits a response. If not, initiative trade could take prices as low as $3,943.00, the next most valuable price area in the chain.
More On Volume Areas: A structurally sound market will build on past areas of high-volume (HVNode). Should the market trend for long periods of time, it will lack sound structure (identified as a low-volume area (LVNode) which denotes directional conviction and ought to offer support on any test).

If participants were to auction and find acceptance into areas of prior low-volume, then future discovery ought to be volatile and quick as participants look to areas of high volume for favorable entry or exit.
Graphic 5: 4-hour profile chart of the Micro E-mini S&P 500 Futures.
In the late 1800’s and early 1900’s – as telephone, electricity, and the automobile were emerging – the US equity market cap relative to GDP appears to have been 2-3 times higher than it is today. We need to verify this difficult-to-get data but, if true, I have a hypothesis. https://t.co/7V4dNo3vBL
Renato founded Physik Invest after going through years of self-education, strategy development, and trial-and-error. His work reporting in the finance and technology space, interviewing leaders such as John Chambers, founder, and CEO, JC2 Ventures, Kevin O’Leary, Canadian businessman and Shark Tank host, Catherine Wood, CEO and CIO, ARK Invest, among others, afforded him the perspective and know-how very few come by.
Having worked in engineering and majored in economics, Renato is very detailed and analytical. His approach to the markets isn’t built on hope or guessing. Instead, he leverages the unique dynamics of time and volatility to efficiently act on opportunity.
Disclaimer
At this time, Physik Invest does not manage outside capital and is not licensed. In no way should the materials herein be construed as advice. Derivatives carry a substantial risk of loss. All content is for informational purposes only.
What Happened: U.S. stock index futures closed higher, last week.
What Does It Mean: The S&P 500 closed above $4,000.00 for the first time.
This comes as investors shifted their focus from the risks of rapidly rising inflation to the increasing pace of COVID-19 coronavirus vaccinations and a rebound in economic activity.
At the time, the CBOE Volatility Index (INDEX: VIX), a measure of the stock market’s expectation of volatility based on S&P 500 (INDEX: SPX) options, hit the lowest level since February of 2020. This was likely the result of an oversupply in volatility due to contract rolling, signaling a shift in the demand for volatility and options-based hedging.
Graphic 1: Volatility declines ahead of the extended holiday weekend.
Adding, the market is entering into a historically bullish period, ahead of the upcoming corporate earnings season, with structural flows supporting the ongoing narrative, also, at least until mid-April. The reason being, most funds are committed to holding long positions. In the interest of lower volatility returns, these funds will collar off their positions, selling calls to finance the purchase of downside put protection.
Graphic 2: April, historically speaking, is usually a good month for equity investors.
As a result of this activity, options dealers are long upside and short downside protection.
This exposure must be hedged; dealers will sell into strength as their call (put) positions gain (lose) value and buy into weakness as their call (put) positions lose (gain) value.
Now, unlike theory suggests, dealers will hedge call losses (gains) quicker (slower). This leads to “long-gamma,” a dynamic that crushes volatility and promotes momentum, observed by lengthy sprints — like the one the market is currently in — followed by rapid de-risking events as the market transitions into “short-gamma.”
What To Expect: Balance-to-higher into mid-April.
Why? One last hurrah before the reopening accelerates and flows turn.
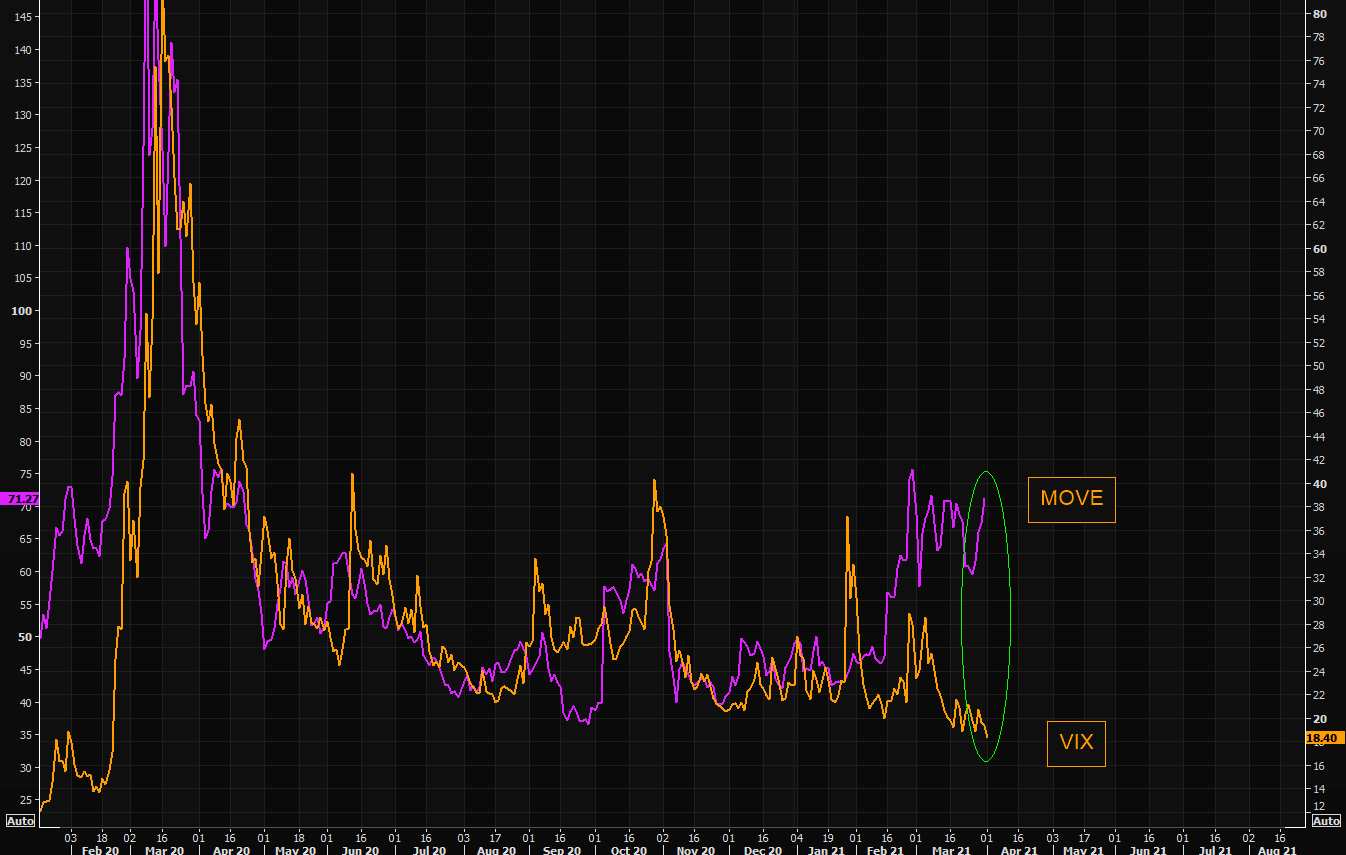
When flows turn, it is likely that equity and bond market volatility converge; the ongoing divergence comes alongside an attempt, by market participants, to price in rising debt levels and inflation. As consumers shift their preferences from saving and investing to spending, this divergence ought to disappear.
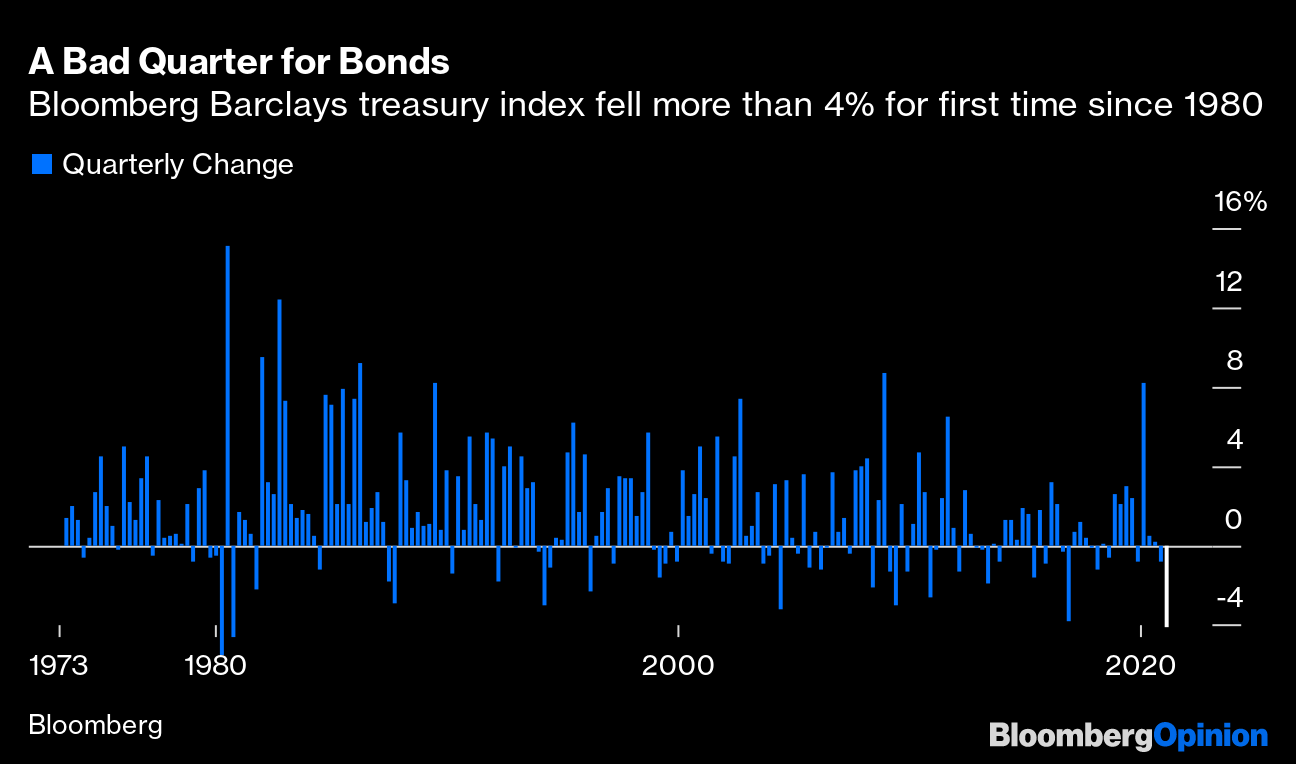
Graphic 3: Q1 2021 the worst quarter for bonds in decades, via Bloomberg. Graphic 4: Divergence in volatility across the bond and equity market.
Adding, metrics, like DIX, confirm increased buying pressure while divergences in options activity and volume delta suggest opportunistic selling.
More On DIX: For every buyer is a seller (usually a market maker). Using DIX — which is derived from short sales (i.e., liquidity provision on the market-making side) — we can measure buying pressure.Volume Delta: Buying and selling power as calculated by the difference in volume traded at the bid and offer.
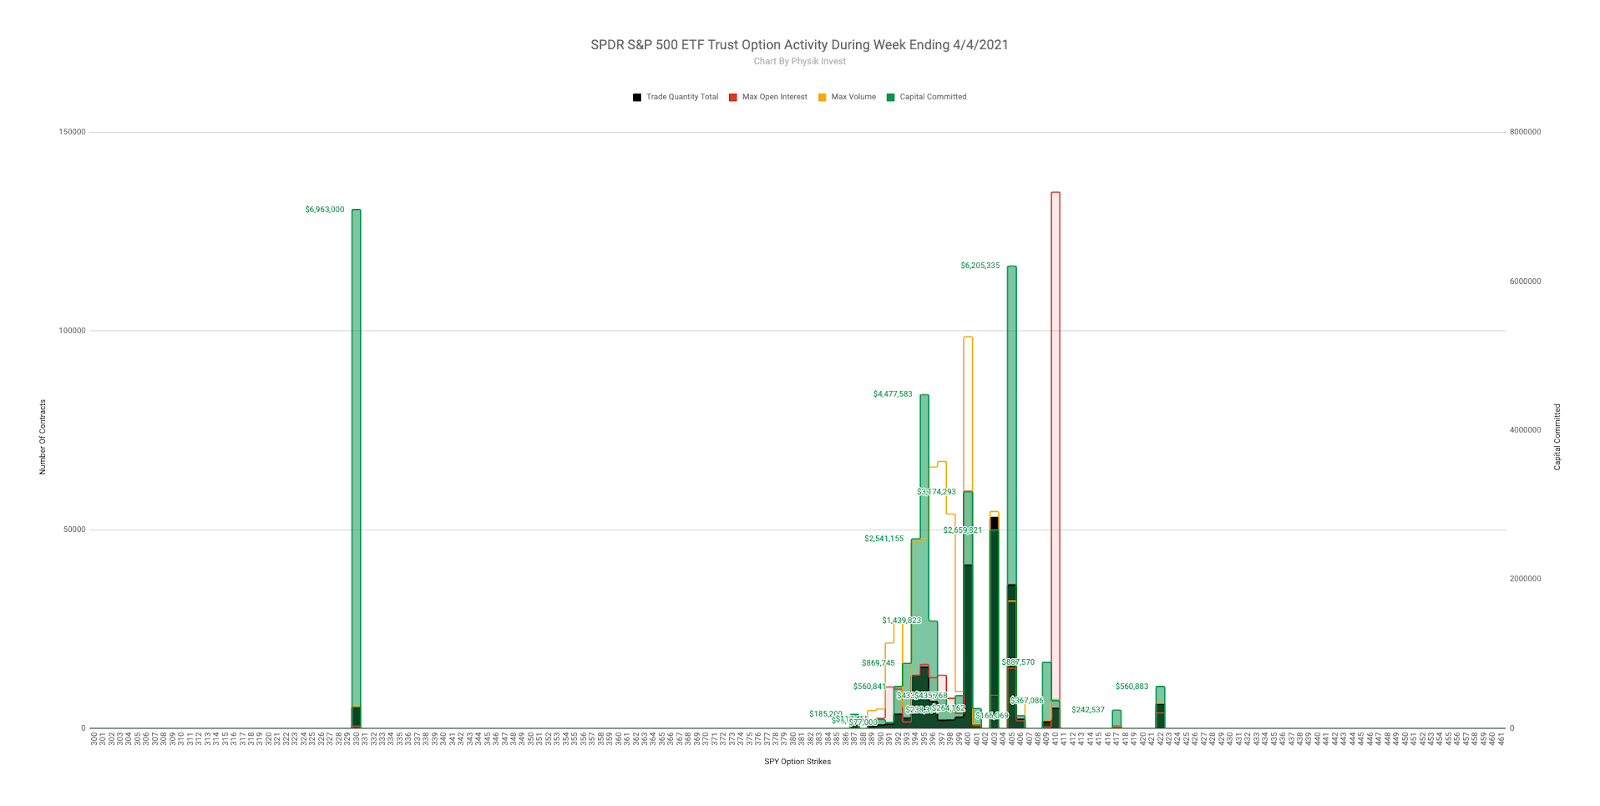
Graphic 5: Physik Invest maps out the purchase of call and put options in the SPDR S&P 500 ETF Trust (NYSE: SPY), for the week ending April 4, 2021. Activity in the options market was primarily concentrated in short- and long-dated tenors, in strikes as low as $330, which corresponds with $3,300 in the cash-settled S&P 500 Index (INDEX: SPX).
What To Do: In the coming sessions, participants will want to pay attention to where the S&P 500 trades in relation to Thursday’s end-of-day spike higher.
More On Spikes: Spike’s mark the beginning of a break from value. Spikes higher (lower) are validated by trade at or above (below) the spike base (i.e., the origin of the spike).
In the best case, the S&P 500 remains above the $4,004.25 spike base. Doing so means that the participants are finding higher prices, above the VWAP anchored from the March 17 rally-high, valuable (i.e., buyers, on average, are in control and winning since the March 17 rally-high).
More On Volume-Weighted Average Prices (VWAPs): A metric highly regarded by chief investment officers, among other participants, for quality of trade. Additionally, liquidity algorithms are benchmarked and programmed to buy and sell around VWAPs.
In the case of higher prices, given that the $4,015.25 price extension was achieved in after-market trade that established an overnight high at $4,038.25, participants can target the $4,062.00 extension.
More On Overnight Rally Highs (Lows): Typically, there is a low historical probability associated with overnight rally-highs (lows) ending the upside (downside) discovery process.
Any activity below the $4,004.25 spike base puts the rally on hold and calls for balance or digestion of higher prices.
Balance (Two-Timeframe Or Bracket): Rotational trade that denotes current prices offer favorable entry and exit. Balance-areas make it easy to spot a change in the market (i.e., the transition from two-time frame trade, or balance, to one-time frame trade, or trend).
In the case of lower prices, participants can look to whether a test of the $3,943.00 and $3,908.25 high-volume areas (HVNodes) solicit a response.
More On Volume Areas: A structurally sound market will build on past areas of high-volume (HVNode). Should the market trend for long periods of time, it will lack sound structure (identified as a low-volume area (LVNode) which denotes directional conviction and ought to offer support on any test).

If participants were to auction and find acceptance into areas of prior low-volume, then future discovery ought to be volatile and quick as participants look to areas of high volume for favorable entry or exit.
Graphic 6: 4-hour profile chart of the Micro E-mini S&P 500 Futures.
Conclusions: The go/no-go level for next week’s trade is $4,004.25.
Any activity above this level confirms the bullishness of last Thursday’s end-of-day spike.
What Happened: Amid a volatile, news-heavy week, after a slew of earnings reports by heavily weighted index constituents, and an FOMC meeting that made no change to existing monetary policy, financial markets experienced a rapid de-risking, similar to what transpired prior to the sell-off in February 2020.
What Does It Mean: After extending the S&P 500’s rally, as well as establishing acceptance near the $3,850.00 price extension, an upside target, and excess (i.e., a proper end to price discovery), participants auctioned back into range, repairing poor structures left in the wake of initiative buying.
The action found acceptance below the $3,824.00 – $3,763.75 balance-area, invalidating the prior week’s break-out to new highs.
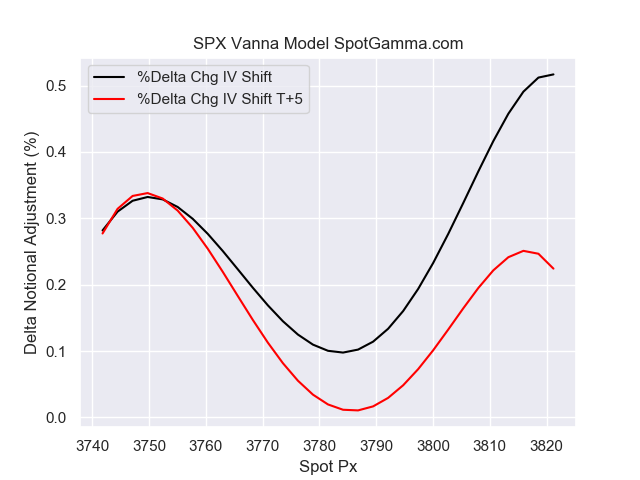
Since then, market participants were witness to violent two-sided trade, a result of the market transitioning into a short-gamma environment (Graphic 1).
In such case dealers hedge derivatives exposure by buying into strength and selling into weakness. This, will exacerbate volatility.
Graphic 1: SpotGamma data suggests S&P 500 has entered short-gamma environment
In a conversation for a Benzinga article to be released this coming week, I spoke with Kris Sidial, co-chief investment officer at The Ambrus Group, a volatility arbitrage fund, regarding GameStop Corporation (NYSE: GME) share price volatility, market microstructure, and regulation.
According to Sidial, the dynamics that transpired in GameStop can be traced back to factors like Federal Reserve stabilization efforts, and low rates, which incentivize risk taking (see Graphic 2).
“The growth of structured products, passive investing, the regulatory standpoint that’s been implemented with Dodd-Frank and dealers needing to hedge off their risk more frequently, than not,” are all part of a regime change that’s affected the stability of markets, Sidial notes.
“These dislocations happen quite frequently in small windows, and it offers the potential for large outlier events,” like the equity bust and boom during 2020. “Strength and fragility are two completely different components. The market could be strong, but fragile.”
The aforementioned regime change is one in which dealer exposure to direction and volatility promotes crash up and down dynamics. Last February, the market was heavily one-sided with participants, like target date funds (e.g., mutual funds), selling far out-of-the-money puts on the S&P 500 for passive yield, and investors buying-to-open put options in an increasing amount for downside exposure, thus exacerbating volatility.
Graphic 2: Newfound Research unpacks market drivers, implications of liquidity.Graphic 3: SqueezeMetrics highlights implications of volatility, direction, and moneyness.
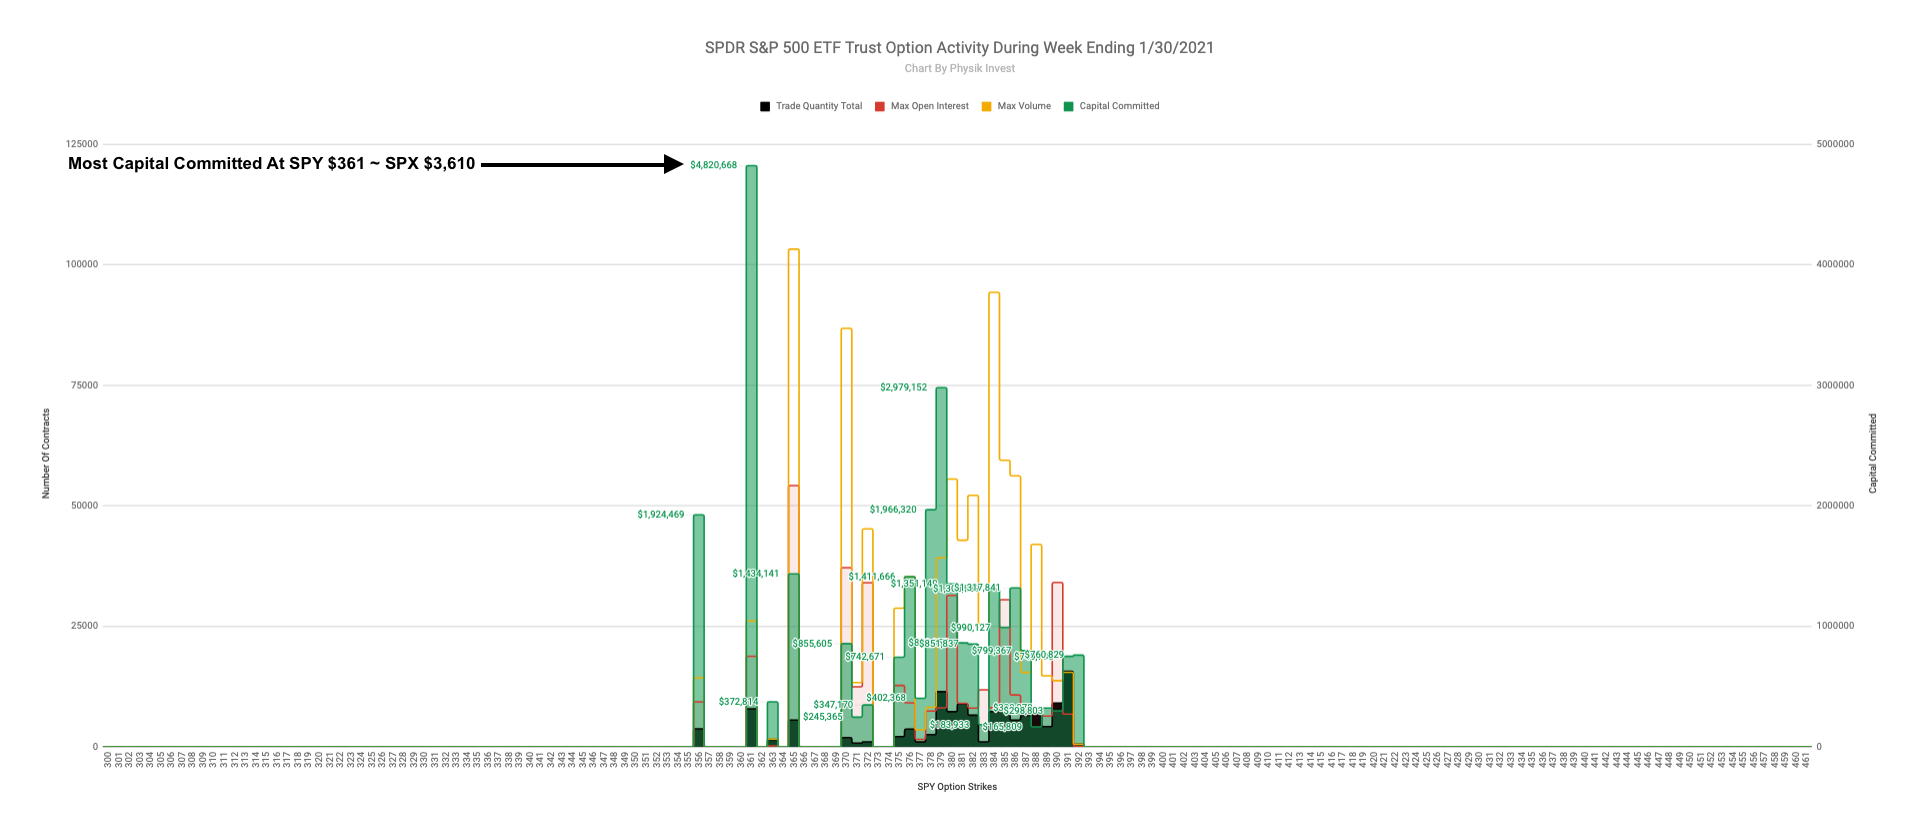
Last week, per Graphic 4, the SPDR S&P 500 ETF Trust, the largest ETF that tracks the S&P 500, saw a rise in purchases of downside protection with time, which will likely lead to an increase in implied volatility and sensitivity of options to changes in underlying price.
These risks will be hedged off by dealers selling into weakness (see Graphic 3), thereby exacerbating downside volatility.
Graphic 4: Physik Invest maps out the purchase of call and put options in the SPDR S&P 500 ETF Trust, for the week ending January 30, 2021.
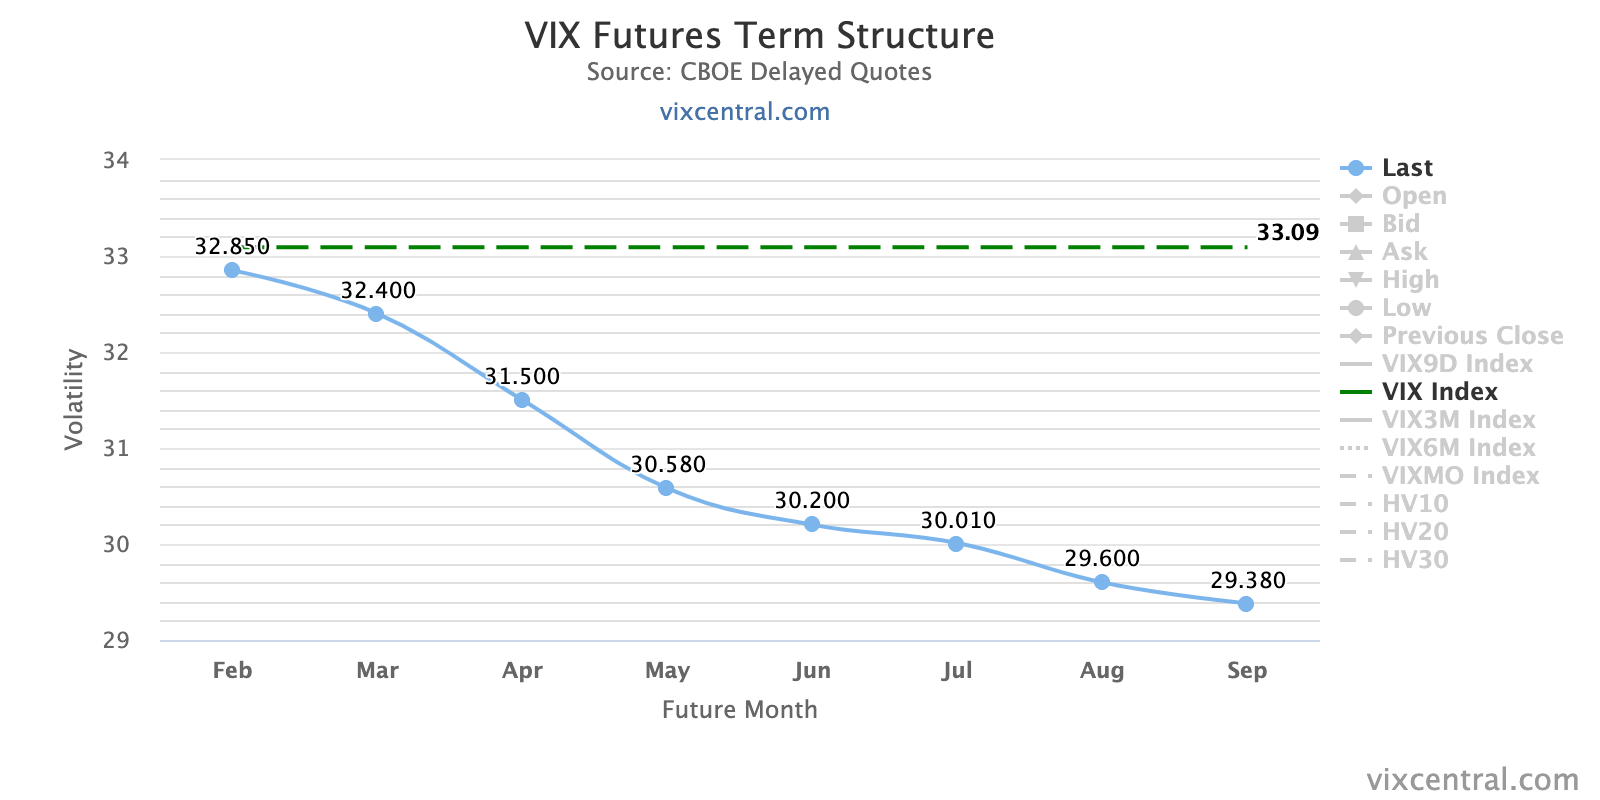
The activity was most concentrated in put options with a strike price of $361, corresponding with $3,610 in the cash-settled S&P 500 Index (INDEX: SPX). This, alongside the market’s entry into short gamma, and an inversion of the VIX futures term structure (see Graphic 5), in which longer-dated VIX expiries are less expensive, is a warning of elevated near-term risks for equity market stability.
Graphic 5: VIX Futures Term Structure per vixcentral.com.
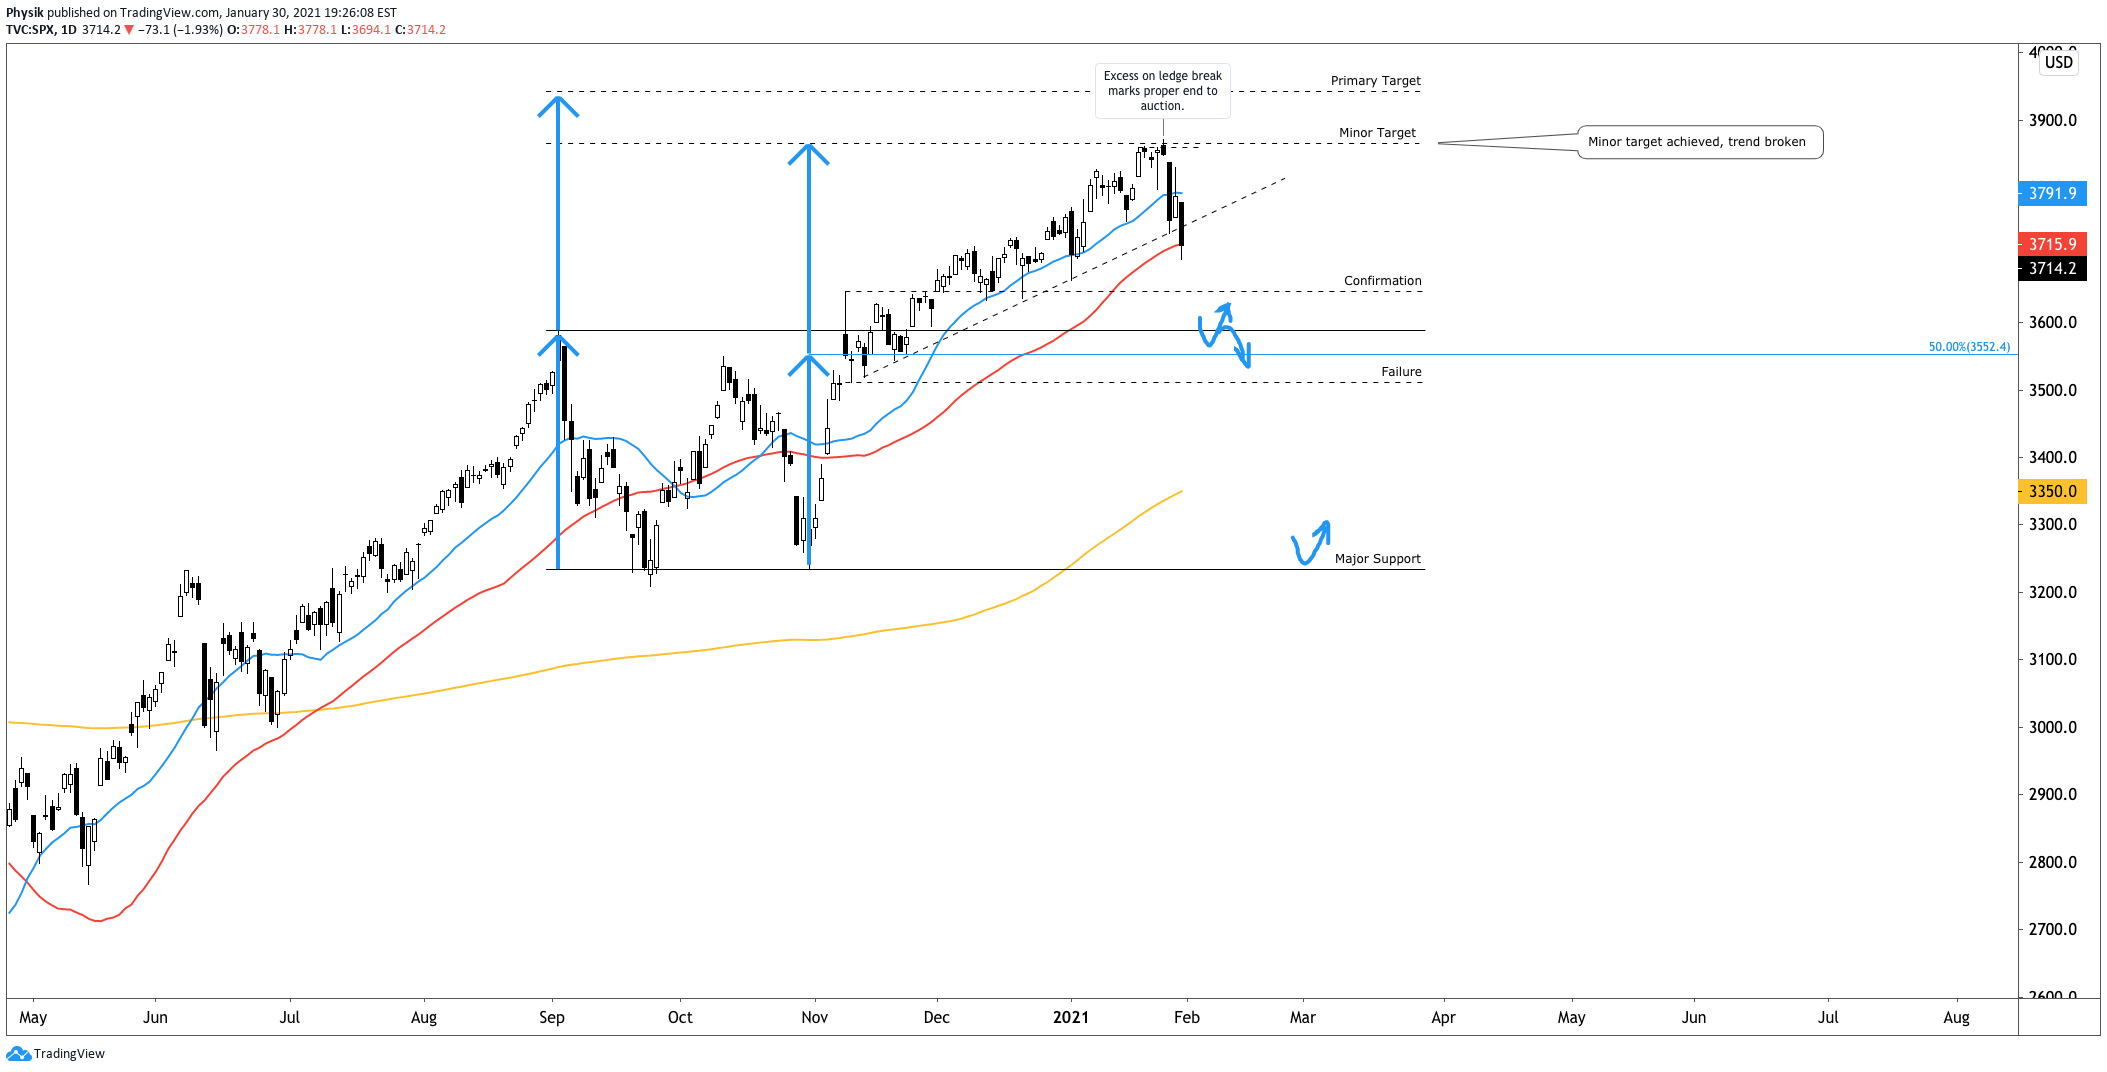
What’s more? Aside from breaking technical trend (Graphic 6) is DIX, a proxy for buying derived from short sales (i.e., liquidity provision on the market making side) declining, and the presence of divergent speculative flows and delta (e.g., non-committed buying as measured by volume delta).
Graphic 6: Cash-settled S&P 500 Index experiences technical breakdown.Graphic 7: DIX by SqueezeMetrics suggests large divergence between price and buying on January 27.Graphic 8: Divergent Delta in the SPDR S&P 500 ETF (NYSE: SPY), the largest ETF that tracks the S&P 500.
What To Expect: In light of the technical breakdown U.S. stock indexes are best positioned for downside discovery.
As a result, participants ought to zoom out, and look for valuable areas to transact.
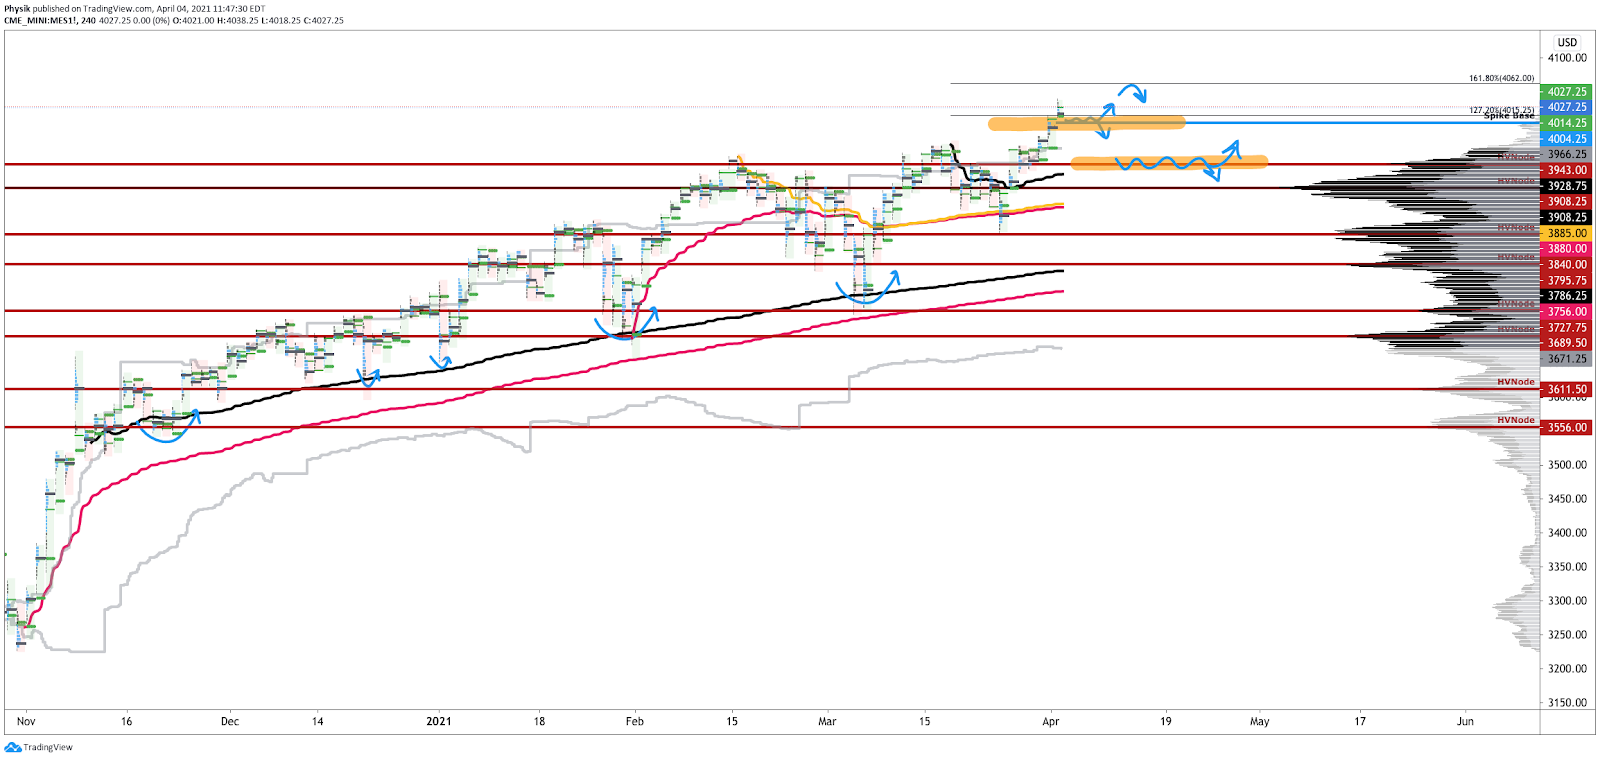
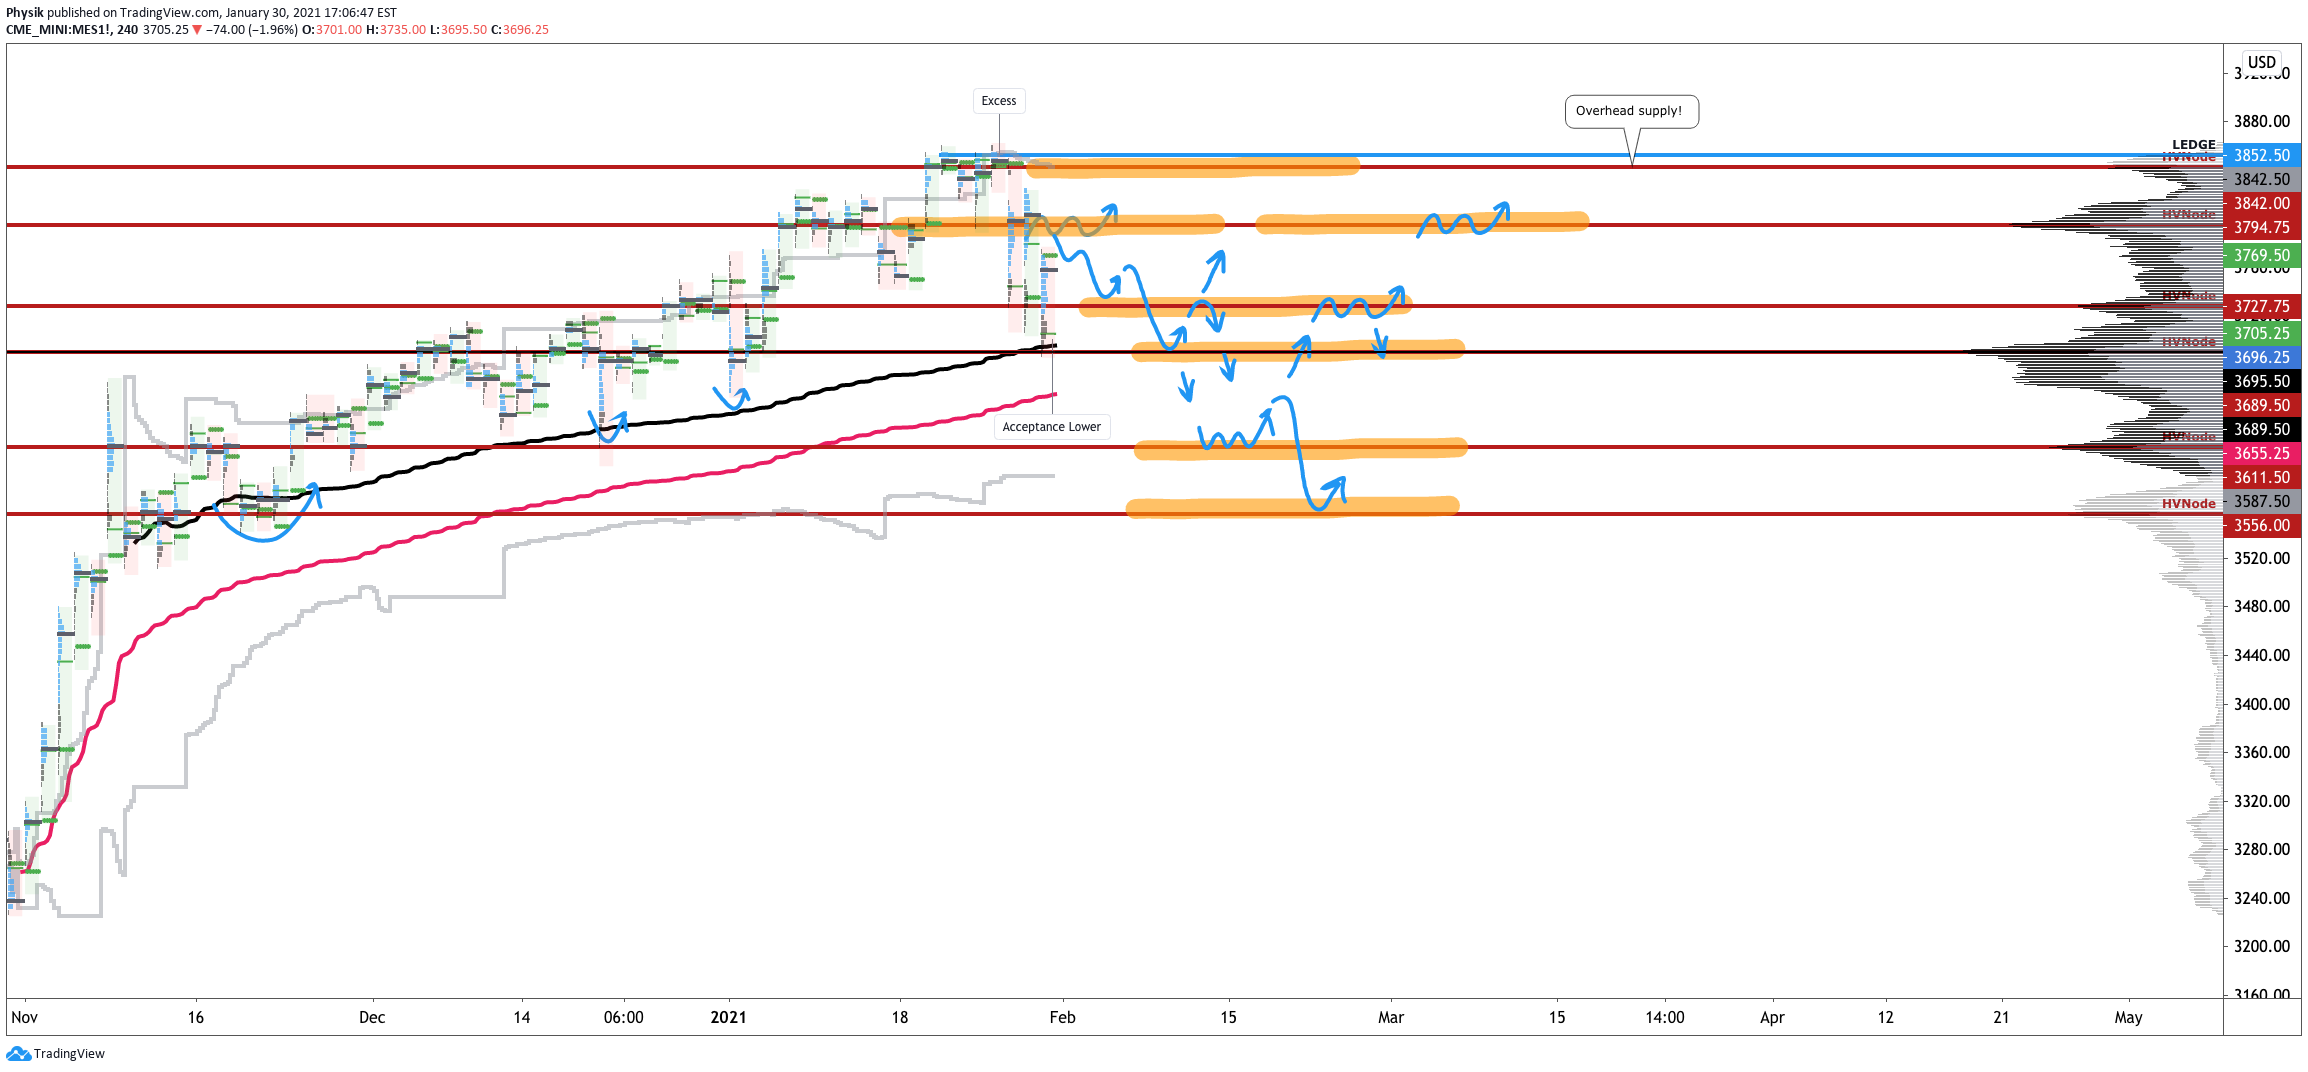
Graphic 9: 4-hour profile chart of the Micro E-mini S&P 500 Futures.
In Graphic 9, the highlighted zones denote high-volume areas (HVNodes), which can be thought of as building blocks.
A structurally sound market will build on past areas of high-volume. Should the market trend for long periods of time, it will lack sound structure (identified as a low-volume area which denotes directional conviction and ought to offer support on any test).
If participants were to auction and find acceptance into areas of prior low-volume, as they have in the week prior, then future discovery ought to be volatile and quick as participants look to areas of value for favorable entry or exit.
Additionally, it’s important to remember what the market’s long-term trajectory is: up.
Late last year, JPMorgan Chase & Co. (NYSE: JPM) strategist Marko Kolanovic suggested equities would rally short-term with the S&P 500 auctioning as high as $4,000 on the basis of low rates, improved fundamentals, buybacks, as well as systematic and hedge fund strategies. Since then, Kolanovic has downgraded growth and suggested the limited potential for further upside despite odds of a sustained economic recovery.
Note, Kolanovic has not called for an implosion in equity markets. Instead, the market is due for some downside discovery given a moderation in the recovery.
Given the above dynamics, the following frameworks apply for next week’s trade.
In the best case, the S&P 500 takes back Friday’s liquidation and auctions above the $3,727.75 HVNode. Expectations thereafter include continued balance.
In the worst case, any break that finds increased involvement (i.e., supportive flows and delta) below the $3,689.50 HVNode, would favor continuation as low as the $3,611.50 and $3,556.00 HVNodes. Note that the second to last HVNode corresponds with the $361 SPY put concentration, which may serve as a near-term target, or bottom, for this sell-off, given last week’s activity at that strike.
Graphic 10: Profile overlays on a 15-minute candlestick chart of the Micro E-mini S&P 500 Futures.
Conclusions: Participants ought to look for favorable areas to transact, such as those highlighted areas in the S&P 500, featured in Graphic 9.
Big picture, the sell-off ought to be bought, just not yet. Per Graphic 11, euphoria is still too high.
Notice: To view this week’s big picture outlook, click here.
What Happened: After a failure to resolve higher, ahead of the Federal Reserve’s policy decision and earning reports by mega-cap stocks, U.S. index futures sold heavy overnight.
What Does It Mean: During Tuesday’s regular trade in the S&P 500, market participants were unable to maintain prices above the $3,852.50 ledge, increasing confidence among responsive sellers.
Graphic 1: Internally, it appears that the market is running out of steam.
What To Expect: Wednesday’s regular session (9:30 AM – 4:00 PM ET) will likely open on a gap, outside of prior-balance and -range, suggesting the potential for immediate directional opportunity.
Given that the market failed to drum up initiative buying after an upside break of the $3,852.50 ledge, in addition to profile structures denoting the presence of excess (which forms after an auction has traveled too far in a particular direction and portends sustained reversal) participants can expect increased confidence among responsive sellers.
Therefore, attention moves to the $3,824.00 – $3,763.75 balance-area.
Balance-areas denote range-bound trade. The longer participants spend time transacting within a narrow range of prices, the more valuable those prices become. Should the market initiate out of balance and return, participants left out in the move will respond as the area offers favorable entry.
Re-entry into the balance-area may portend further downside participation, as low as the $3,763.75 boundary. Participants should keep in mind that the area is valuable and will be the site of responsive buying. The near-term bullish narrative remains intact, as long as participants maintain prices above the $3,763.75 boundary. Trade beneath $3,763.75 would be the most negative outcome and may portend further downside discovery, as low as the $3,727.75 high-volume node (HVNode), a favorable area to transact in the past.
The go/no-go for upside is the $3,824.00 balance-area boundary. The go/no-go for downside is $3,763.75 balance-area boundary.
Above $3,824.00 puts in play the $3,852.50 ledge. Below $3,763.75, participants ought to look to the $3,727.75 HVNode.
What Happened: After prices were advertised below balance in the week prior, responsive buyers in the S&P 500 began a rally that found acceptance back inside a larger balance-area, near the $3,800 high-open interest strike.
Thereafter, initiative buyers extended the S&P 500’s rally, breaking the index above its $3,824.25 balance-area high (BAH), before establishing acceptance near the $3,850.00 price extension, an upside target, and auctioning back into range, repairing poor structures left in the wake of discovery.
What Does It Mean: In light of a failed breakdown in the week prior, U.S. stock indexes were best positioned for further downside discovery. However, after what appears to be aggressive buying in response to prices below value, it was clear that was not the case.
This leads to the following question: why did selling stop on January 15? One answer, aside from a positive start to the earnings season and prospects for further stimulus, may be OPEX, the January 15 option expiry. On expiration days, delta and gamma exposures change — depending on how derivatives exposure is removed or rolled — which causes dealers to adjust hedges.
According to SpotGamma, the January 15 expiry “resulted in a ~50% reduction in single stock gamma … [which] creates volatility because, as large options positions expire[], are closed and/or rolled, dealers have large hedges they need to adjust. There is a trove of data to suggest that the bulk of single stock call activity is long calls, and based on that we believe dealers (who are short calls vs long stock) therefore have long stock positions to sell.”
Put more simply, the price action may have been attributable to the sale of long stock that hedged expiring short derivatives exposure above the market (i.e., call side).
Per the SpotGamma S&P 500 dealer hedging graphic for the January 15 expiry below, “The black line was the mark on Thursday evening, with the red line being the forecasted position on Tuesday. This red line being substantially lower than the black suggests that dealers had to reduce delta exposure as a result of expiration. Note there is a larger shift at overhead prices suggesting this was a ‘call heavy’ expiration.”
Graphic 1: SpotGamma S&P 500 dealer hedging graphic for the January 15 options expiry
After the VIX (i.e., CBOE’s Volatility Index) expiry on January 20, alongside the inauguration of President Joe Biden, the prospects for a rally improved as “event premium in IV dries up … [and] put values drop, which allows dealers (who are short puts) to buy back short hedges … [fueling] a quick rally up to the 3850SPX/385SPY level (green arrow).”
Graphic 2: SpotGamma S&P 500 Gamma Levels
Adding, the number of put options sold to open exceeded the number bought to open, per SpotGamma, suggesting increased confidence in higher prices as market participants look to options for income, and not insurance.
Historically, the returns after such developments are mixed — more often the appearance of strong initiative buying surfaces (e.g., August and January 2020) before a liquidation helps correct excess inventory, and bring sense back into the market.
What To Expect: During Friday’s session in the S&P 500, responsive buying surfaced after a test of the $3,818.25 High-Volume Node (HVNode), above the $3,813.50 ledge (below which is a pocket of low-volume).
In the simplest way, high-volume areas can be thought of as building blocks. A structurally sound market will build on past areas of high-volume. Should the market trend for long periods of time, it will lack sound structure (identified as a low-volume area which denotes directional conviction and ought to offer support on any test).
If participants were to auction and find acceptance into areas of prior low-volume, then future discovery ought to be volatile and quick as participants look to areas of value for favorable entry or exit.
After the S&P 500 found acceptance above the $3,813.50 ledge and $3,824.25 BAH, it encountered responsive selling near the $3,840.75 HVNode, the site of a downtrend line. Since the selling transpired at a visual level, market participants know that technically-driven, short-term traders in control. In other words, institutions (e.g, funds) tend not to transact at exact technical levels.
Given the aforementioned dynamics, participants will come into Monday’s session knowing the following:
The S&P 500’s higher-time frame breakout remains intact, per graphics 7, 8, and 9.
Late last year, JPMorgan Chase & Co. (NYSE: JPM) strategist Marko Kolanovic suggested equities would rally with the S&P 500 auctioning as high as $4,000 on the basis of low rates, improved fundamentals, buybacks, as well as systematic and hedge fund strategies. Since then, Kolanovic downgraded growth and expressed the limited potential for further upside.
The earnings of heavily weighted index constituents suggests participants discount improved speculative flows and delta (e.g., presence of committed buying or selling as measured by volume delta). Please see graphics 4, 5, and 6.
Graphic 4: Supportive order flow in the SPDR S&P 500 ETF Trust (NYSE: SPY), the largest ETF that tracks the S&P 500, on January 20 trend day.Graphic 5: Supportive order flow in the SPDR S&P 500 ETF Trust (NYSE: SPY), the largest ETF that tracks the S&P 500, on January 22.Graphic 6: Speculative derivatives activity for the week ending January 23, 2021.Graphic 7: Daily candlestick chart of the cash S&P 500 Index
Given the above dynamics, the following frameworks apply for next week’s trade.
In the best case, the S&P 500 takes back Friday’s liquidation and auctions above the $3,840.75 HVNode. Expectations thereafter include continued balance or initiative buying to take out the $3,859.75 overnight all-time high (there is a low probability that overnight all-time highs end the upside discovery process). Thereafter buying continues as high as the $3,884.75 price projection, or double the width of the balance-area, the typical target on a balance-area breakout.
In the worst case, any break that finds increased involvement (i.e., supportive flows and delta) below $3,824.25 BAH, would favor continuation as low as the $3,763.75 BAL.
Graphic 8: Profile overlays on a 15-minute candlestick chart of the Micro E-mini S&P 500 Futures
Conclusions: Despite broad-market indices being in a longer-term uptrend, the odds of substantial upside resolve are low. Participants ought to look for favorable areas to transact, such as those high-volume areas in the S&P 500 featured in graphic 8.
All in all, the risk and reward dynamics, at these price levels, are poor.
Graphic 9: 4-hour profile chart of the Micro E-mini S&P 500 Futures
Alongside mixed economic releases, plans for added fiscal stimulus, as well as a start to the Q4 earnings season, U.S. index futures broke balance and auctioned lower.
Given that Friday’s worst case scenario was realized, U.S. stock indexes are positioned for further downside discovery.
Graphic 1: Profile overlays on a 30-minute candlestick chart of the Micro E-mini S&P 500 Futures
What To Expect: Friday’s session in the S&P 500 found responsive buying surface after a test of the $3,741.25 Virgin Point of Control, or VPOC (i.e., the fairest price to do business in a prior session).
Noting: POCs are valuable as they denote areas where two-sided trade was most prevalent. Participants will respond to future tests of value as they offer favorable entry and exit.
In the simplest way, high-volume areas can be thought of as building blocks. A structurally sound market will build on past areas of high-volume. Should the market trend for long periods of time, it will lack sound structure. If participants were to auction and find acceptance into areas of prior low-volume, then future discovery ought to be volatile and quick as participants look to areas of value for favorable entry or exit.
Thereafter, buying pressure quickly disappeared, and the S&P 500 confirmed the balance-break. Now, in light of the market’s search for an area to establish balanced, two-sided trade, participants will come into Tuesday’s session knowing the following:
Prior to a multi-session consolidation, profile structures denoted the presence of short-covering. This was the result of old, weak-handed business emotionally buying to cover short positions, causing swift movement, followed by a stalled advance, or two-sided trade.
Unsupportive speculative flows and delta (e.g., non-presence of committed buying or selling) in some instances, as can be viewed by the order flow graphics 2 and 3 below.
The multi-month upside breakout targeting S&P 500 prices as high as $4,000.00 remains intact, per graphic 4.
After a v-pattern recovery, the S&P 500 consolidated near the $3,800 high-open interest strike, forming a balance-area. This structure was resolved with Friday’s balance-break. A break-out from balance is usually the start of a short-term auction. Therefore, placing trades in the direction of the break is the normal course of action. Trading back into the consolidation (above $3,763.75), thereby invalidating the break-out, may portend a move to the other end of balance ($3,824.25).
Graphic 2: Divergent delta in the iShares Russell 2000 ETF (NYSE: IWM), one of the largest ETFs that track the Russell 2000Graphic 3: Order flow in the SPDR S&P 500 ETF Trust(NYSE: SPY), the largest ETF that tracks the S&P 500Graphic 4: Daily candlestick chart of the cash S&P 500 Index
Given the above dynamics, the following frameworks apply for next week’s shortened holiday trade.
In the best case, the S&P 500 remains above its $3,763.75 balance-area low (BAL). Expectations thereafter include continued balance or initiative buying to take out the $3,824.25 balance-area high (BAH).
In the worst case, the S&P 500 remains below its $3,763.75 BAL. Expectations thereafter include a test of the low-volume node (LVNode) near $3,732.75. A break of the LVNode would portend a response near the $3,703.25 balance-break projection.
Conclusions: For now, despite a negative balance-break jeopardizing the bullish thesis, broad-market indices are in a longer-term uptrend. Participants ought to look for favorable areas to transact, such as those big-picture high-volume areas featured in graphic 5.
Graphic 5: 4-hour profile chart of the Micro E-mini S&P 500 Futures