Market Commentary
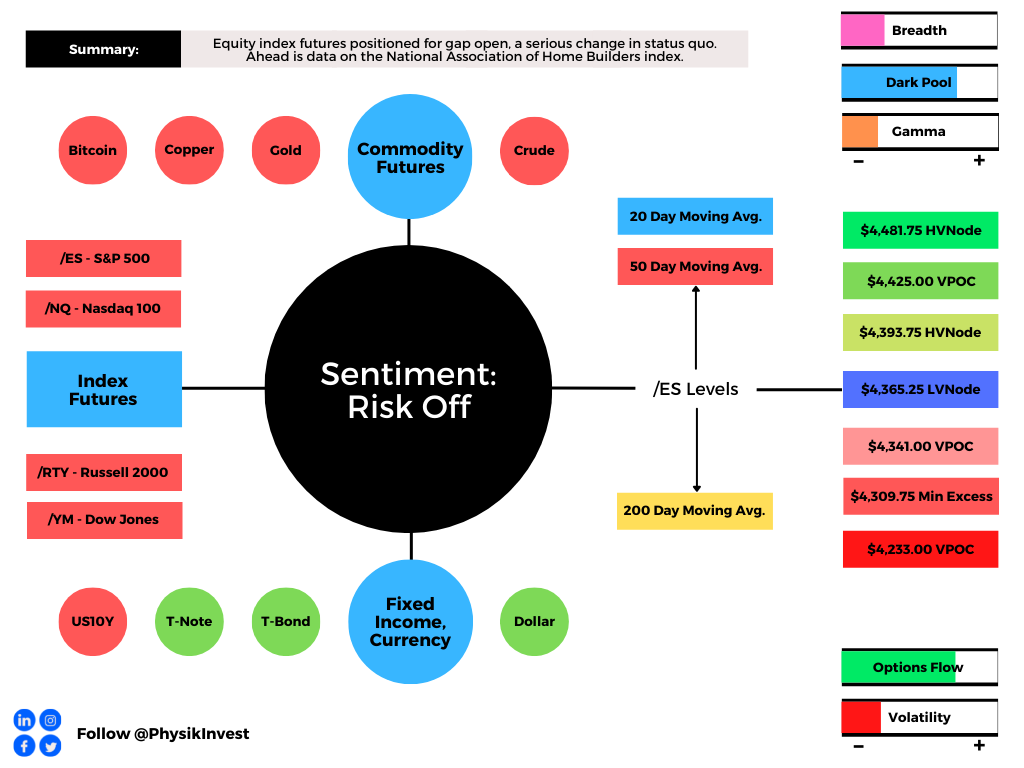
Equity index futures, commodities, and yields trade lower.
- Concerns around the debt ceiling.
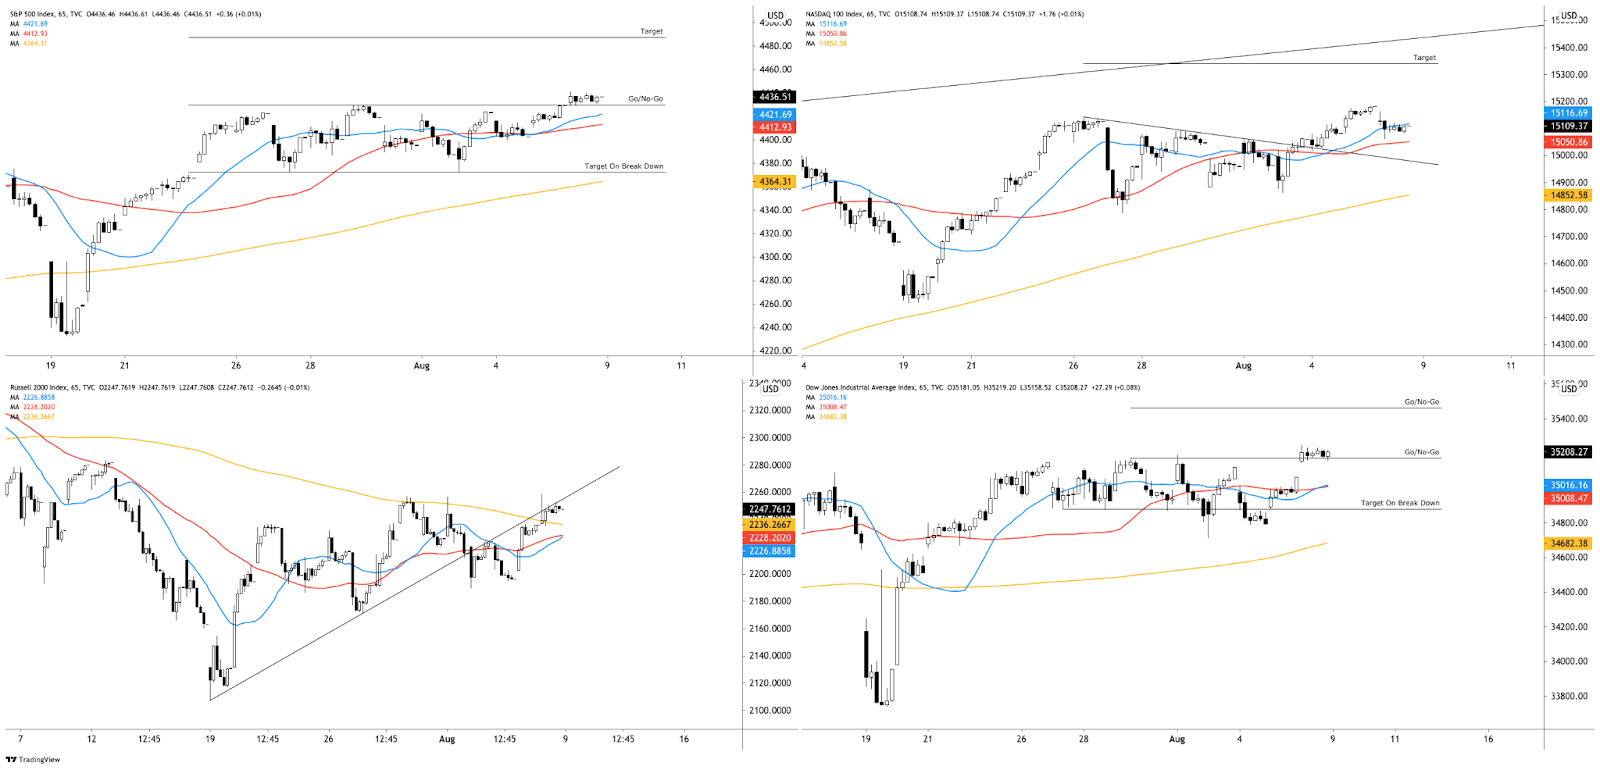
- SPX below balance, 50-day SMA.
- Ahead is a 2-day FOMC meeting.
- Today we receive NAHB updates.
What Happened: U.S. stock index futures auctioned lower alongside commodities and yields as Treasury Secretary Janet Yellen seeks to raise or suspend the debt ceiling alongside Evergrande fears.
Ahead is data on the National Association of Home Builders Index (10:00 AM ET).
What To Expect: As of 7:15 AM ET, Monday’s regular session (9:30 AM – 4:00 PM EST) in the S&P 500 will likely open outside of prior-range and -value, suggesting a high potential for immediate directional opportunity.
Gap Scenarios In Play: Gaps ought to fill quickly. Should they not, that’s a signal of strength; do not fade. Leaving value behind on a gap-fill or failing to fill a gap (i.e., remaining outside of the prior session’s range) is a go-with indicator.

Auctioning and spending at least 1-hour of trade back in the prior range suggests a lack of conviction; in such a case, do not follow the direction of the most recent initiative activity.
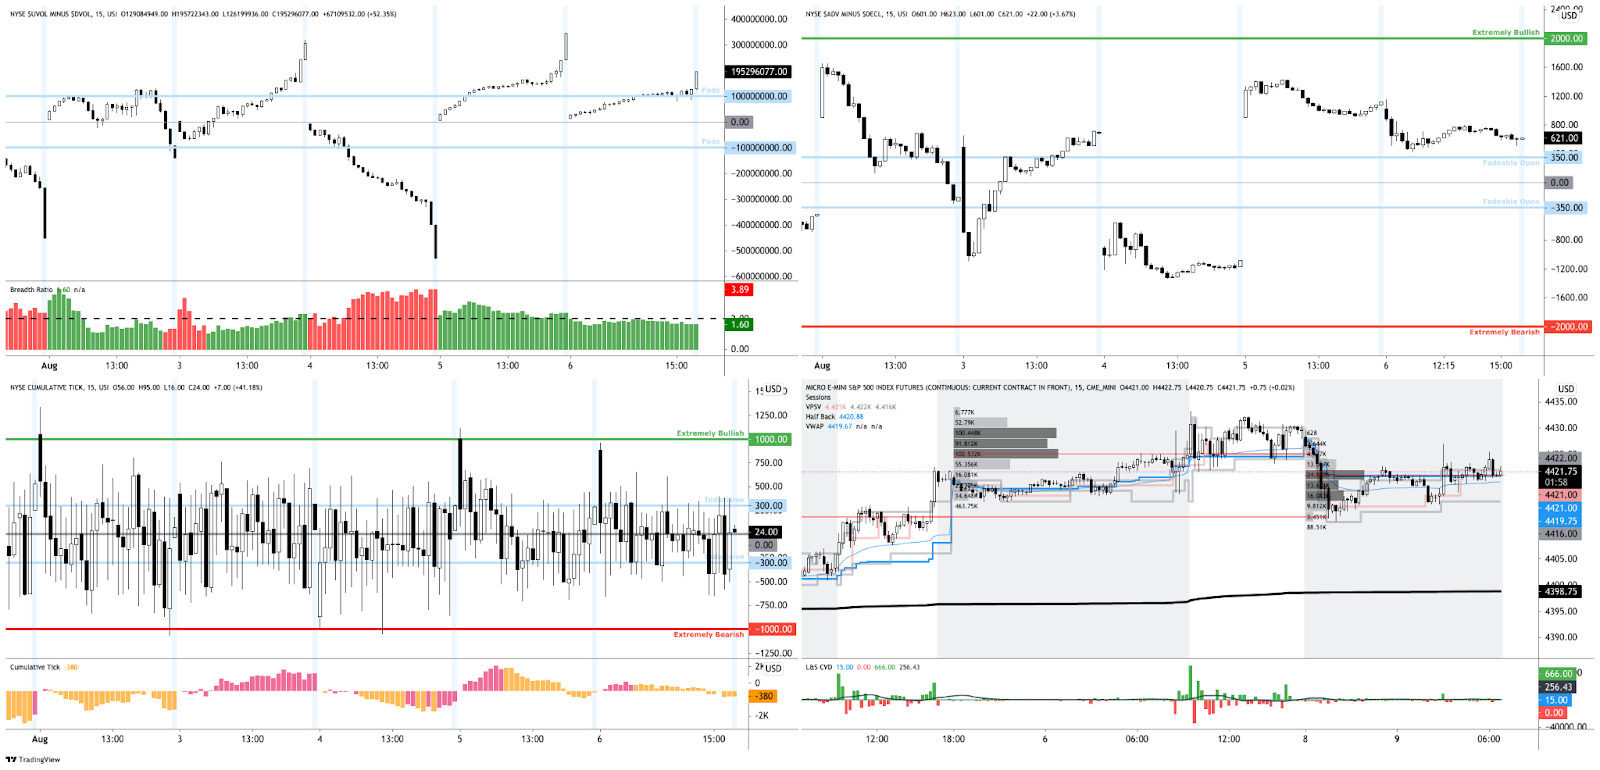
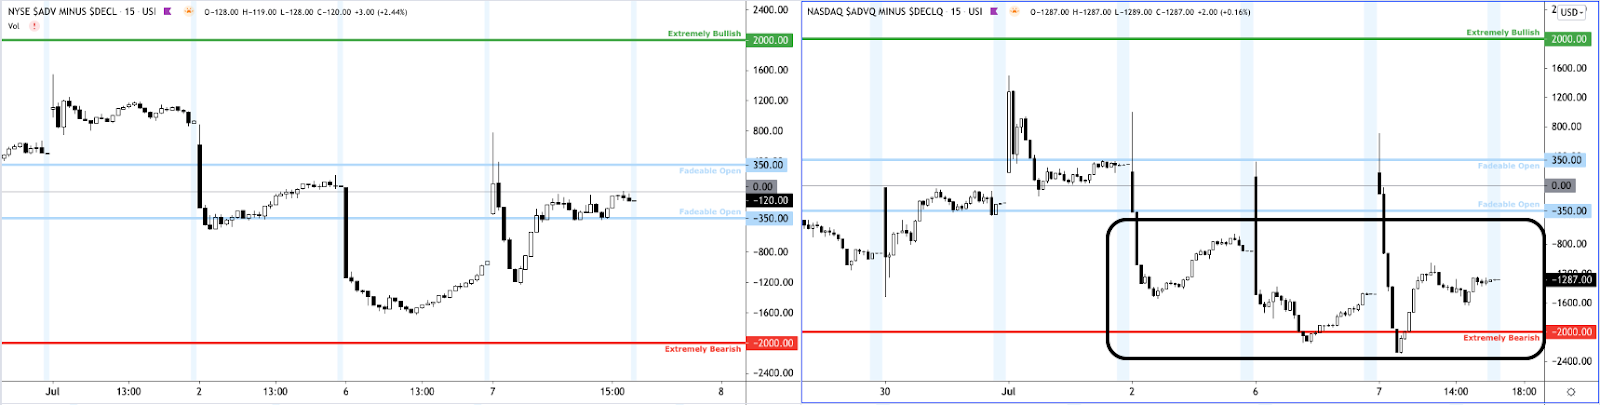
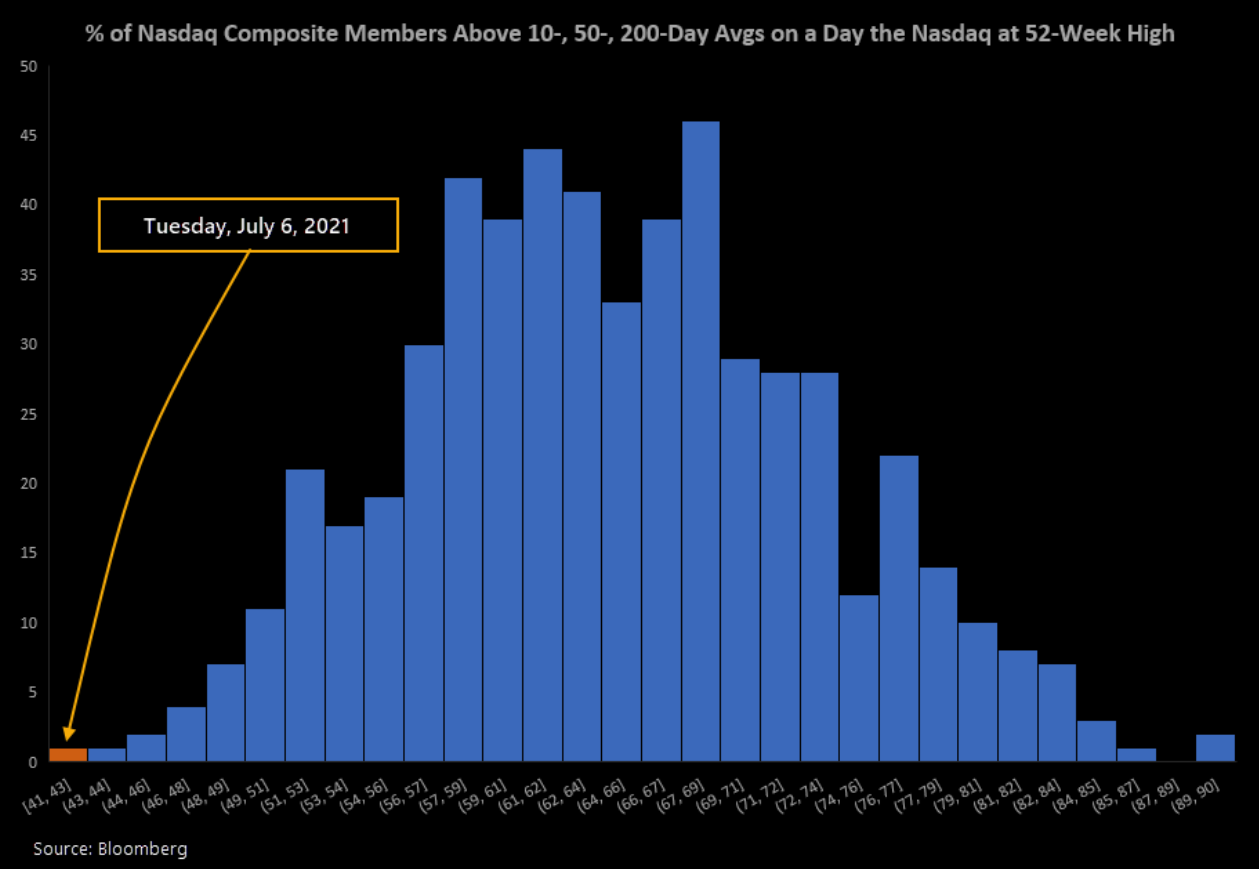
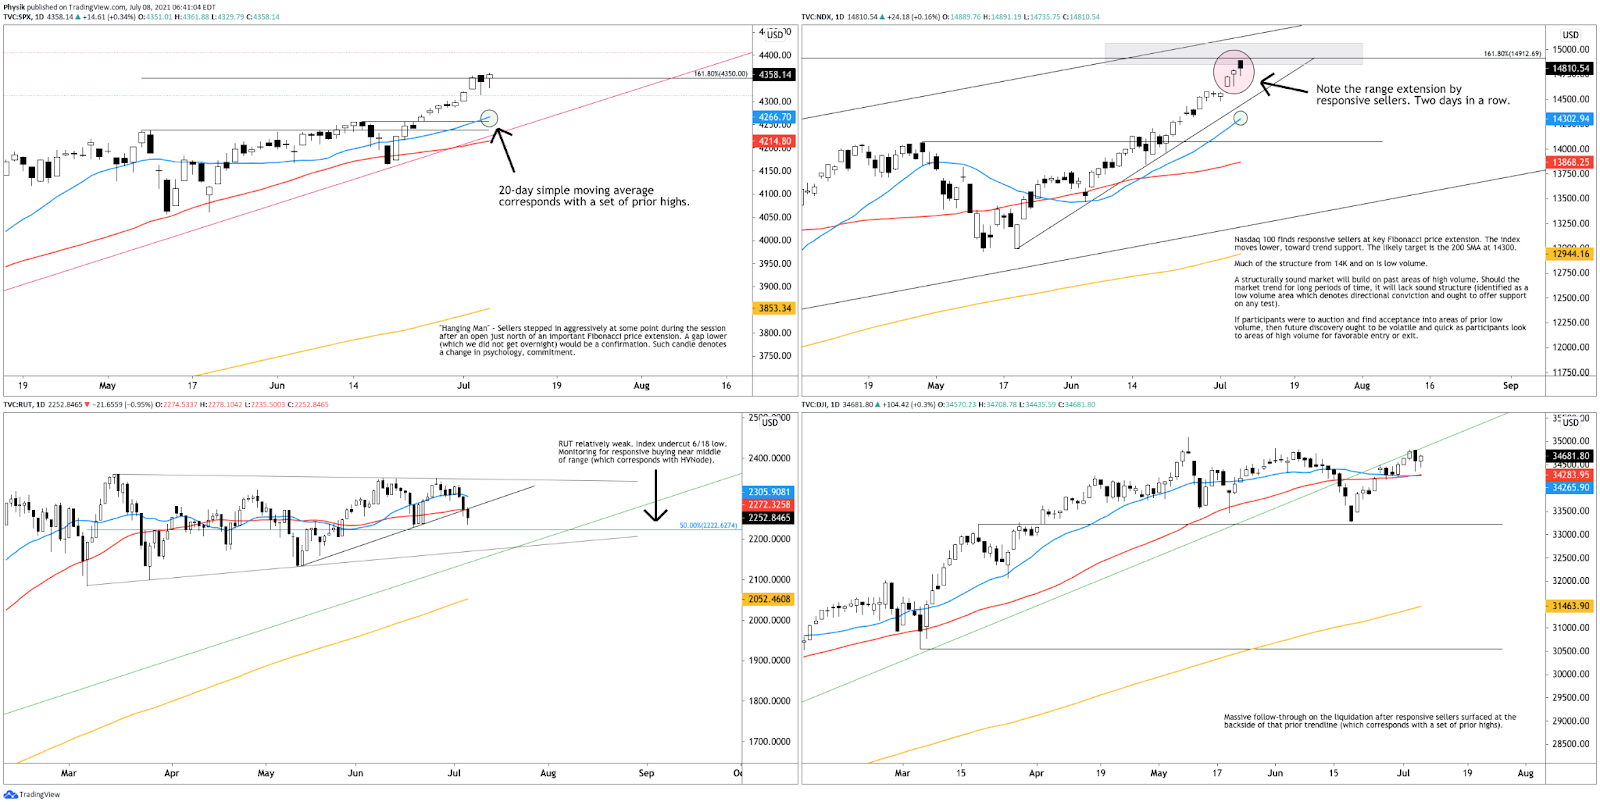
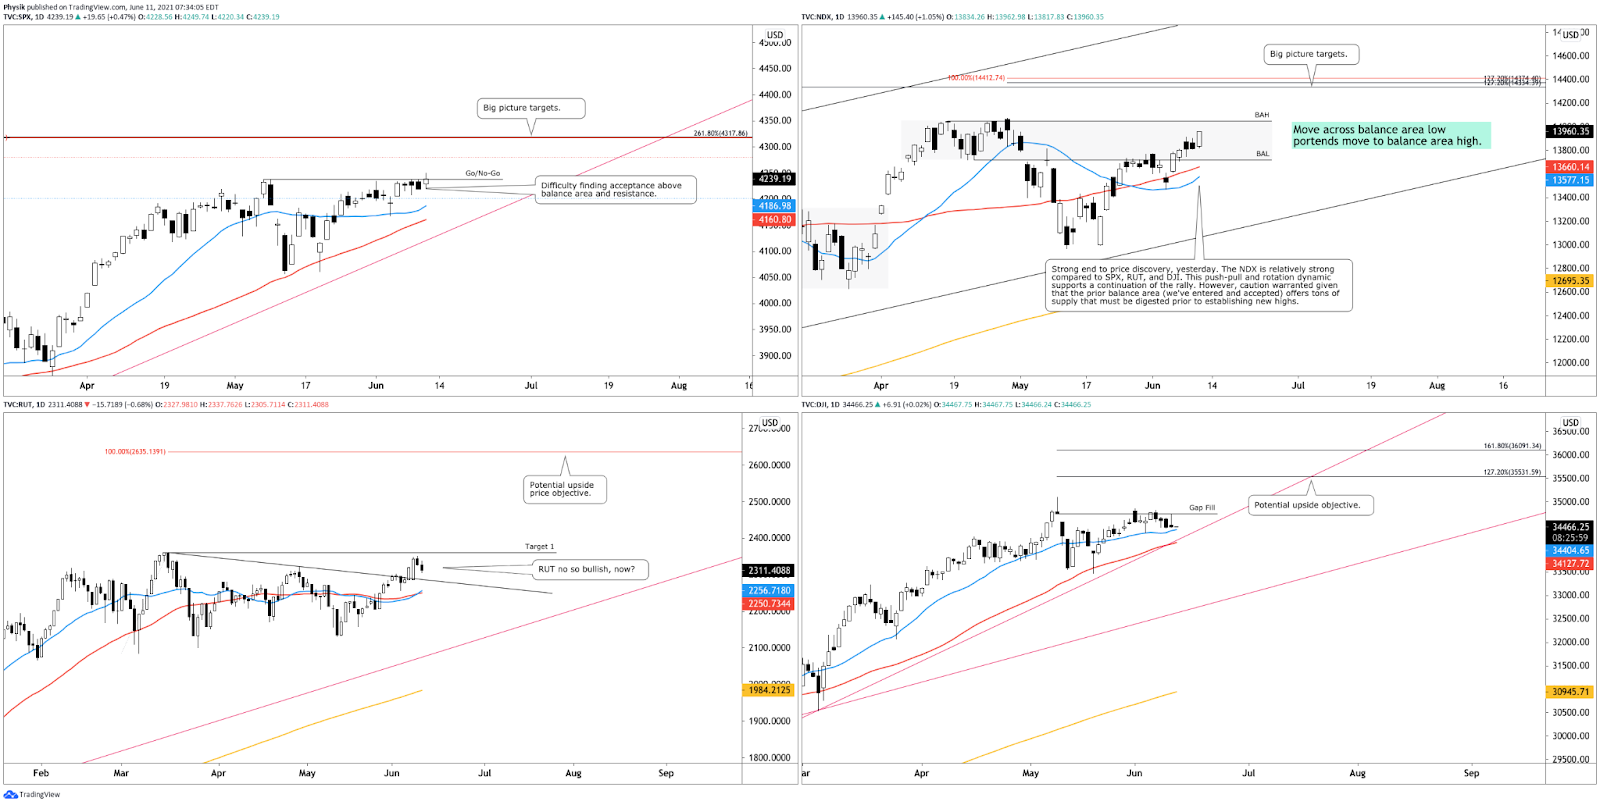
During the prior week’s trade, on weak breadth, the worst-case outcome occurred, evidenced by a balance-area breakout and separation of value below the S&P 500’s 50-day simple moving average (i.e., a visual level likely paid attention to by short-term, technically-driven market participants who generally are unable to defend retests).
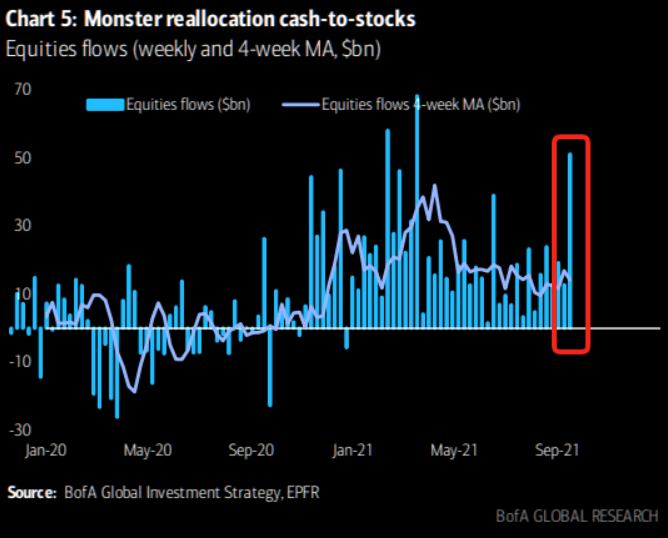
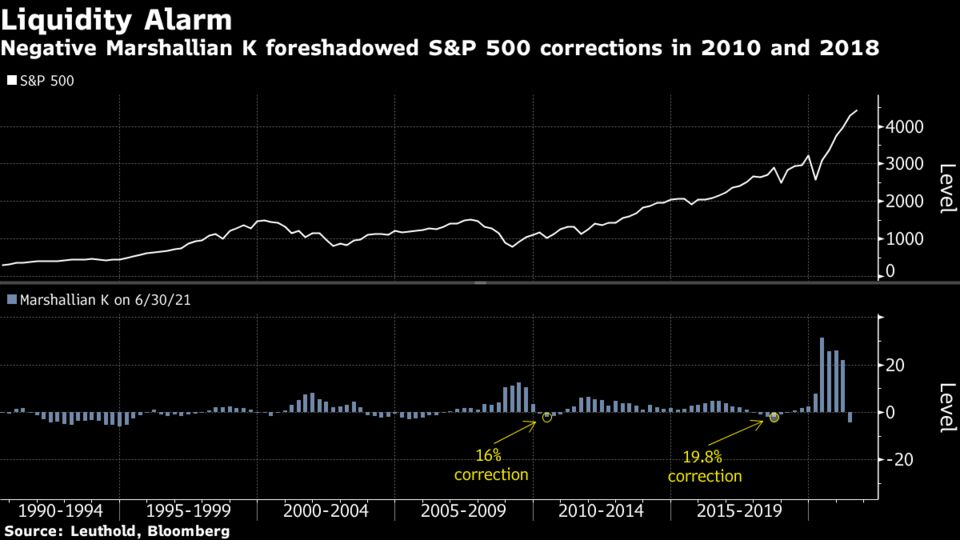
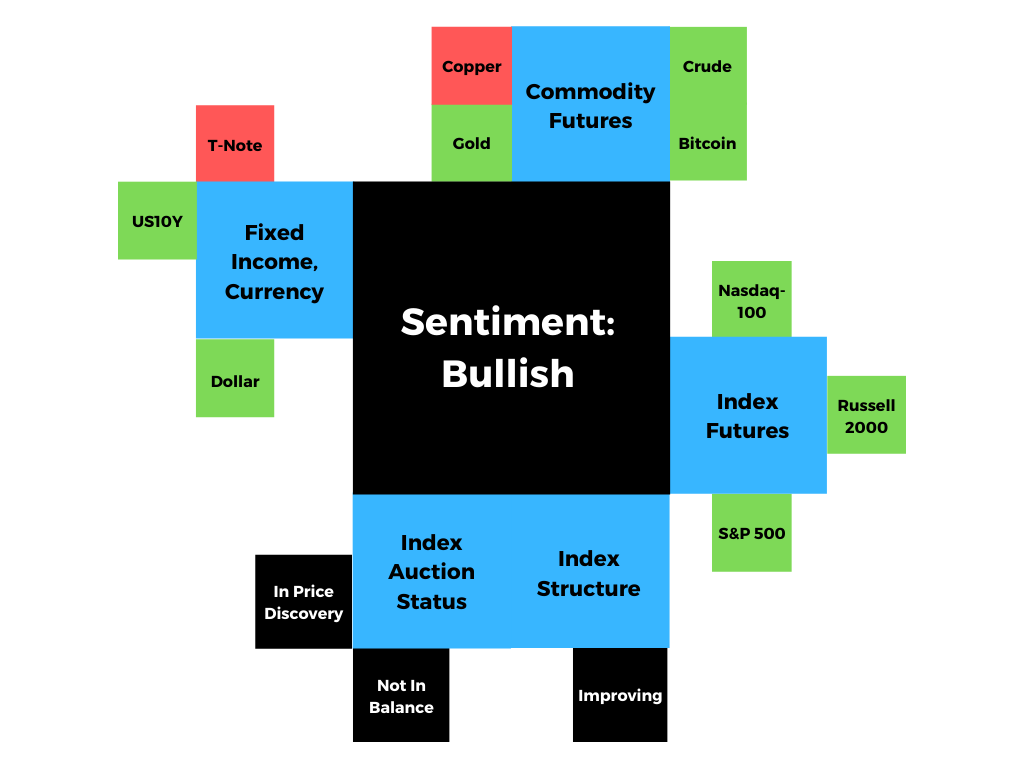
Further, the aforementioned trade is happening in the context of a waning economic recovery, heightened valuations in the face of strong EPS expectations, the prospects of stimulus reduction, non-seasonally aligned flows, impactful options and equity market dynamics, divergent sentiment, as well as fears of a mid-cycle transition.
A key risk, as highlighted by Treasury Secretary Janet Yellen, is the debt ceiling which, if not resolved, some economists argue “that an announcement on tapering is likely to be delayed to December, and that Treasury yields could fall further as a result.”
We note that – as Goldman Sachs writes – “The upcoming debt limit deadline is beginning to look as risky as the 2011 debt limit showdown that led to Standard & Poor’s downgrade of the US sovereign rating and eventually to budget sequestration, or the 2013 deadline that overlapped with a government shutdown.”
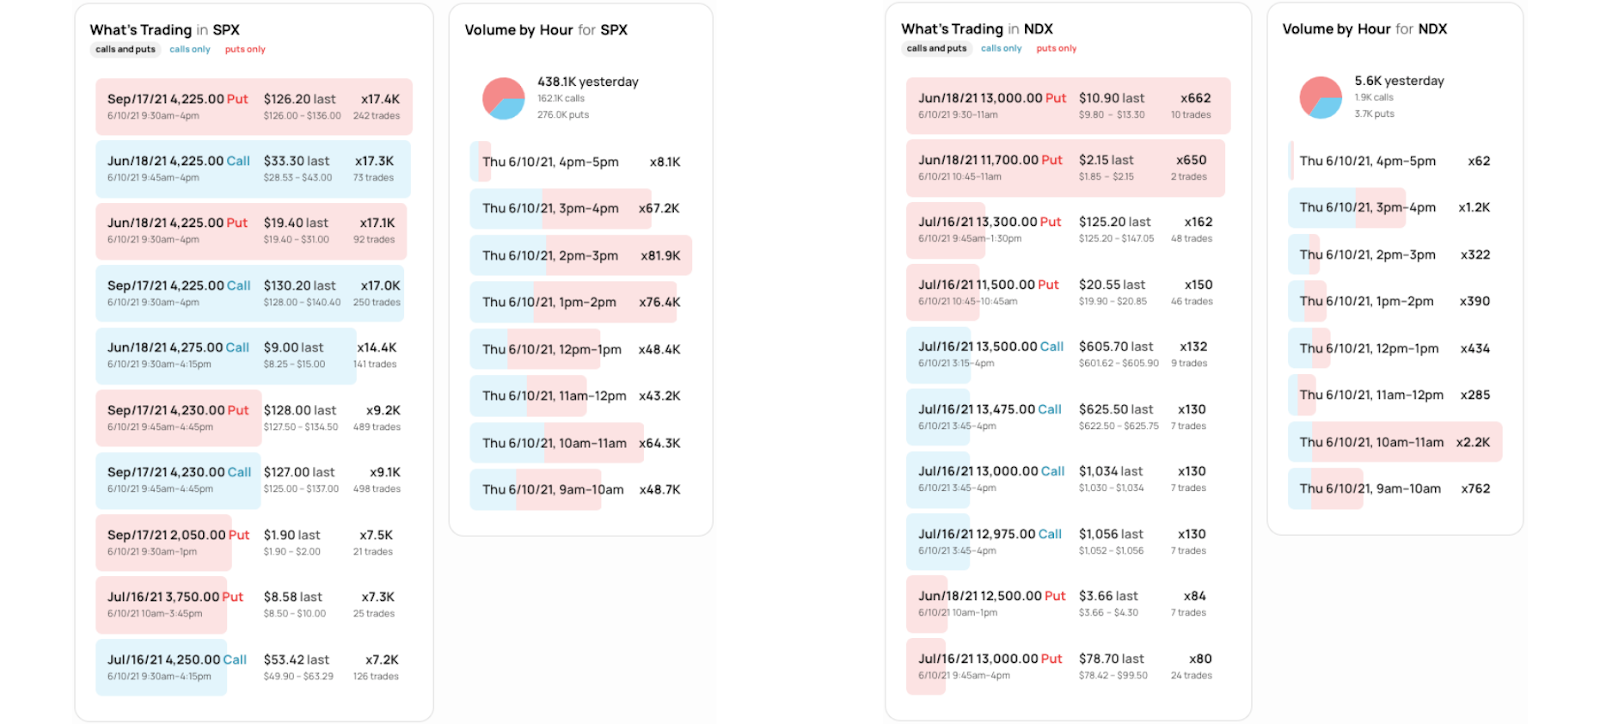
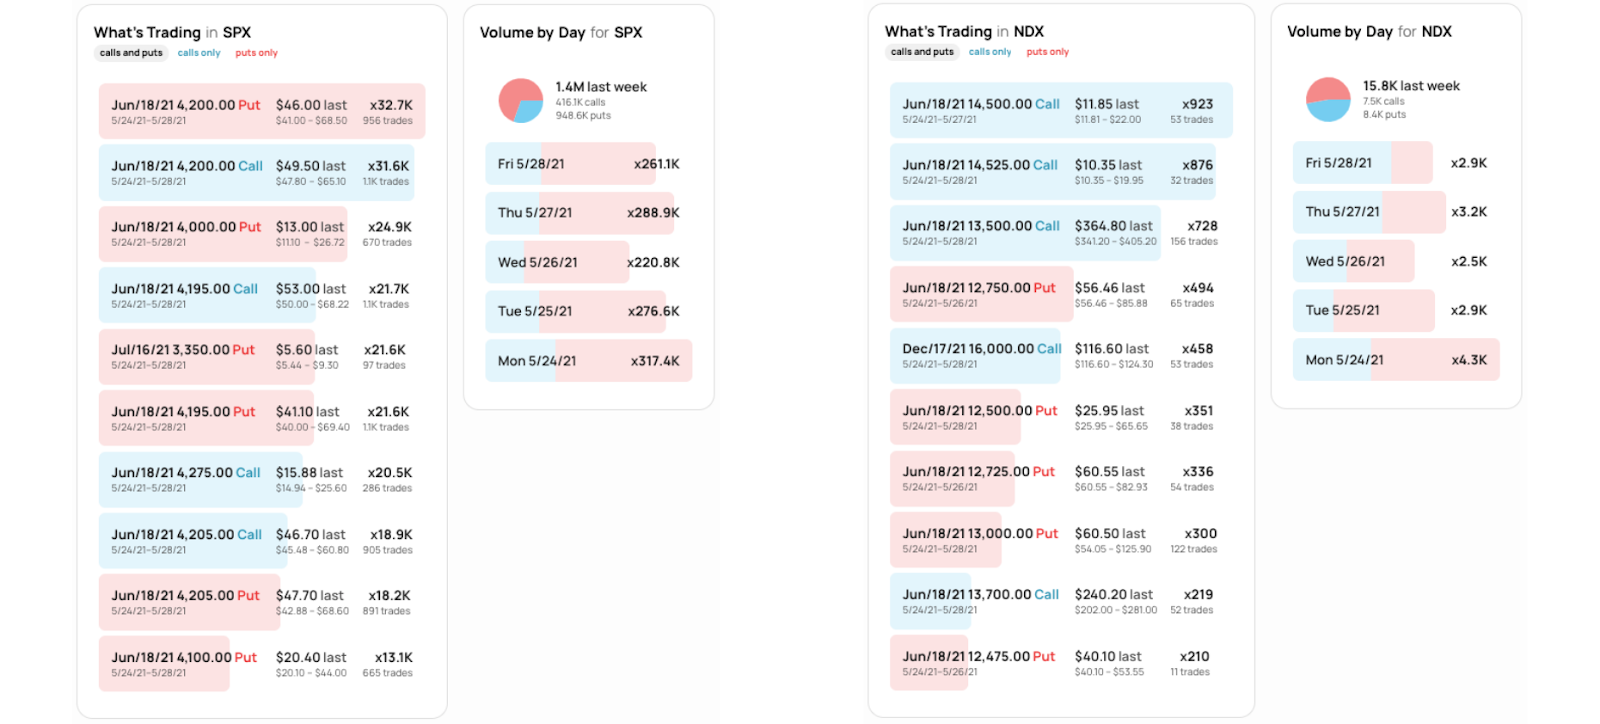
Adding, as SpotGamma said, “over 50% of stocks [had] their largest gamma position” roll-off Friday. This suggests an increased potential for volatility heading into the September 21-22 FOMC event. SqueezeMetrics confirms.
Moreover, for today, participants may make use of the following frameworks.
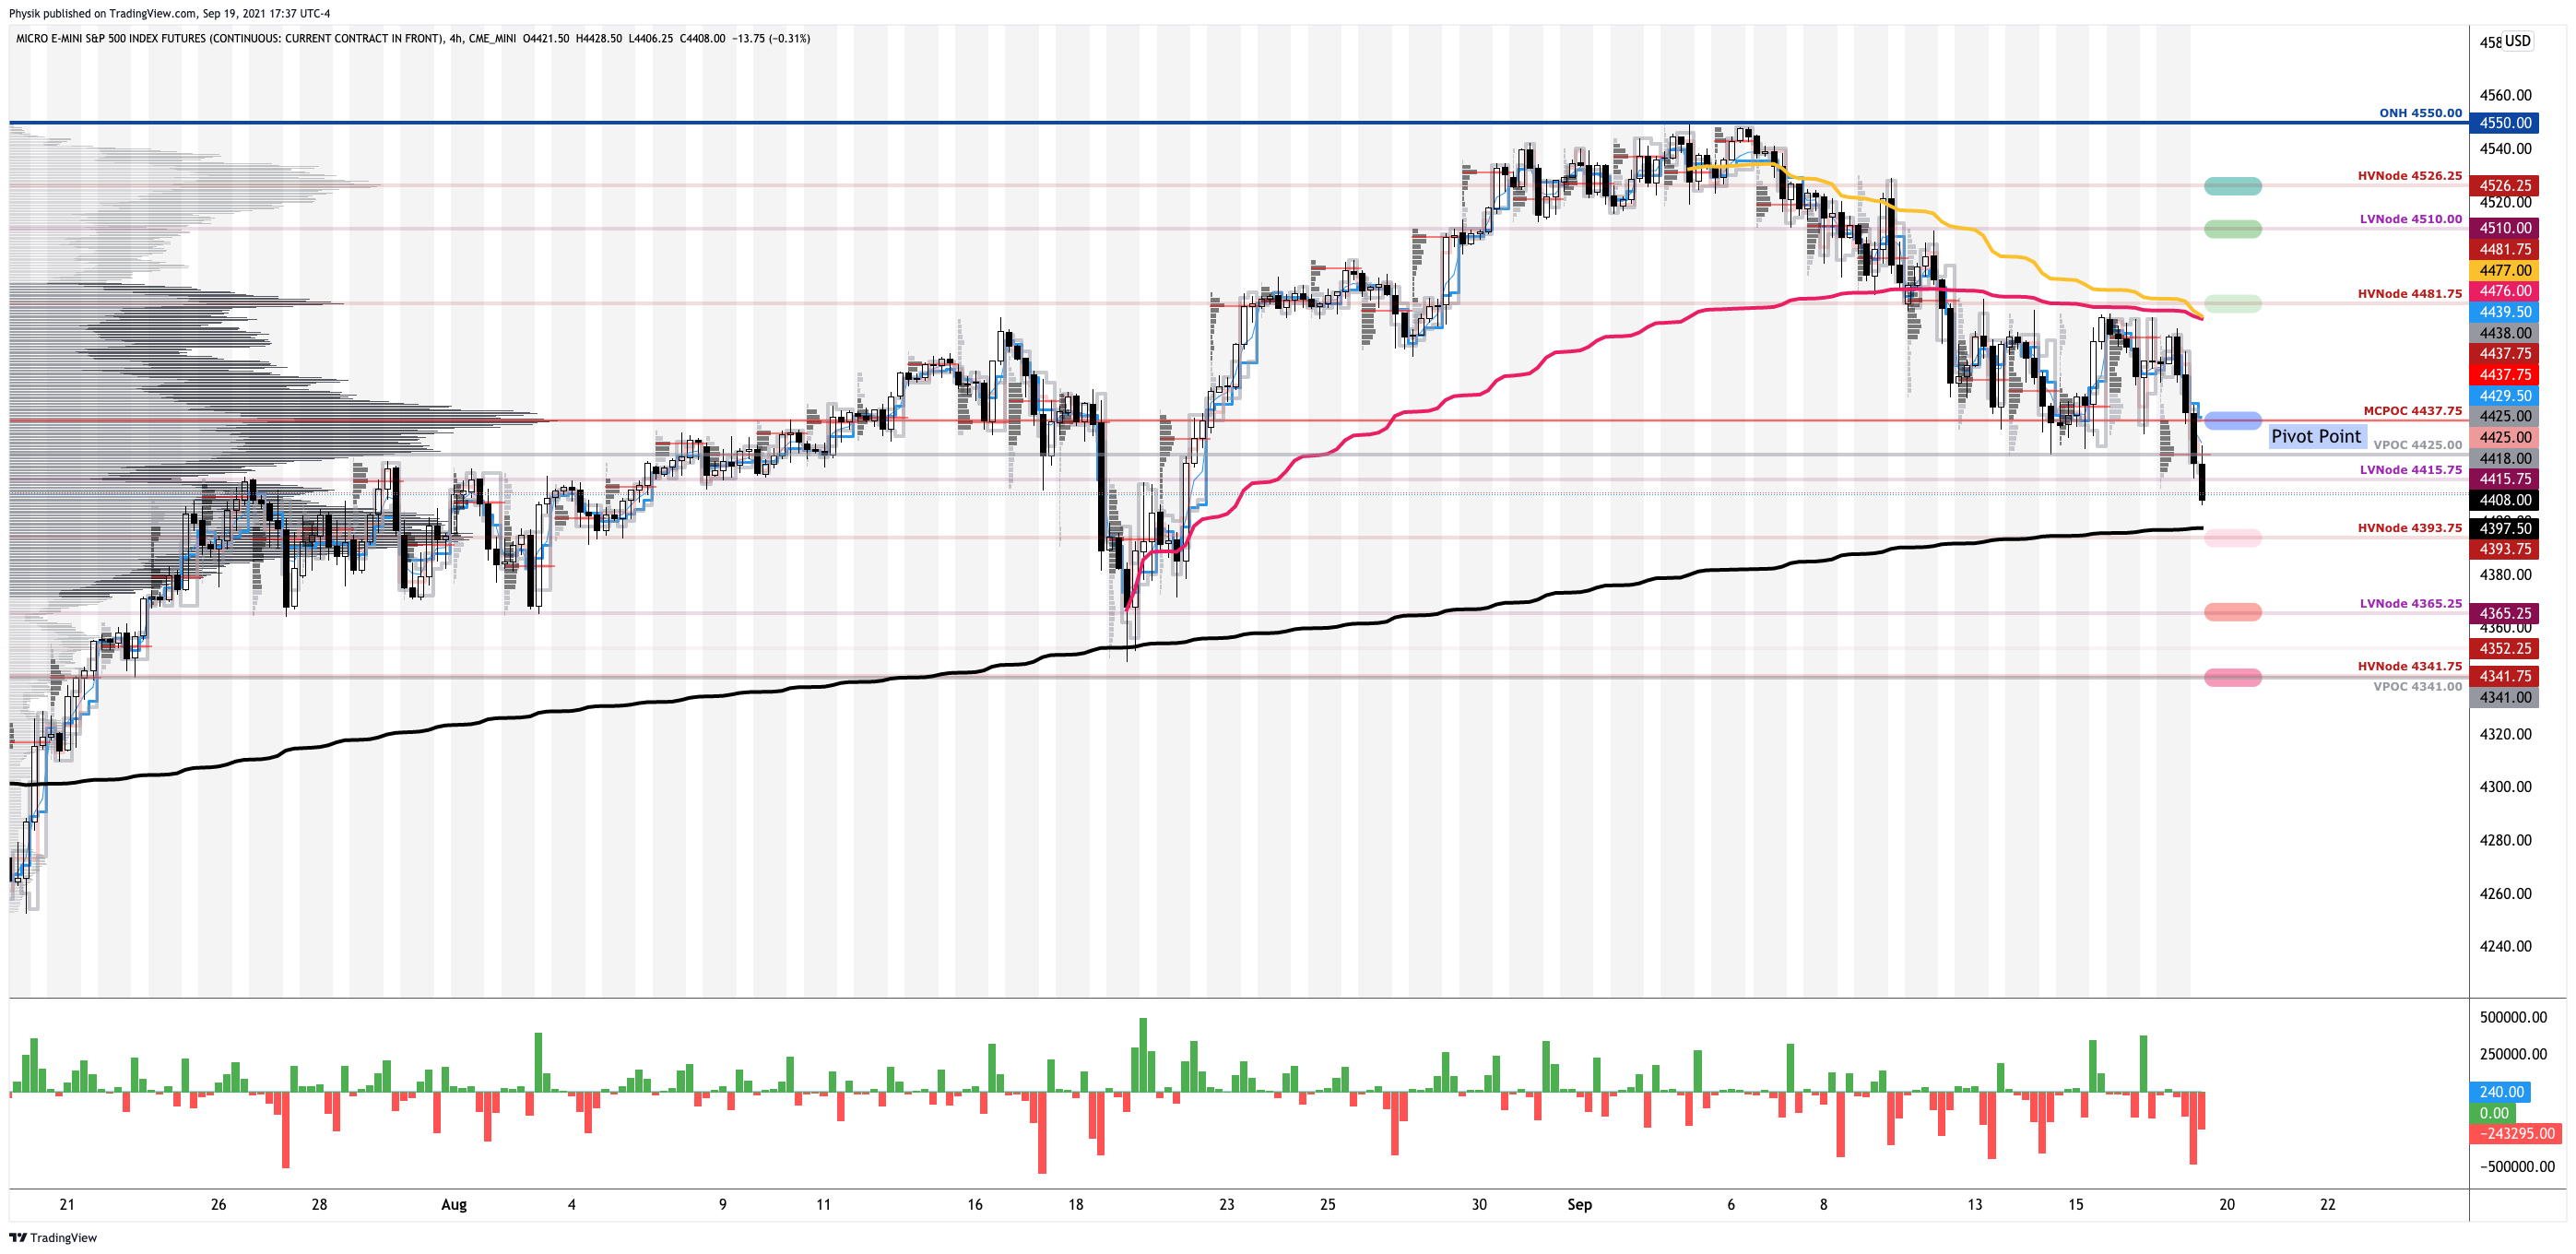
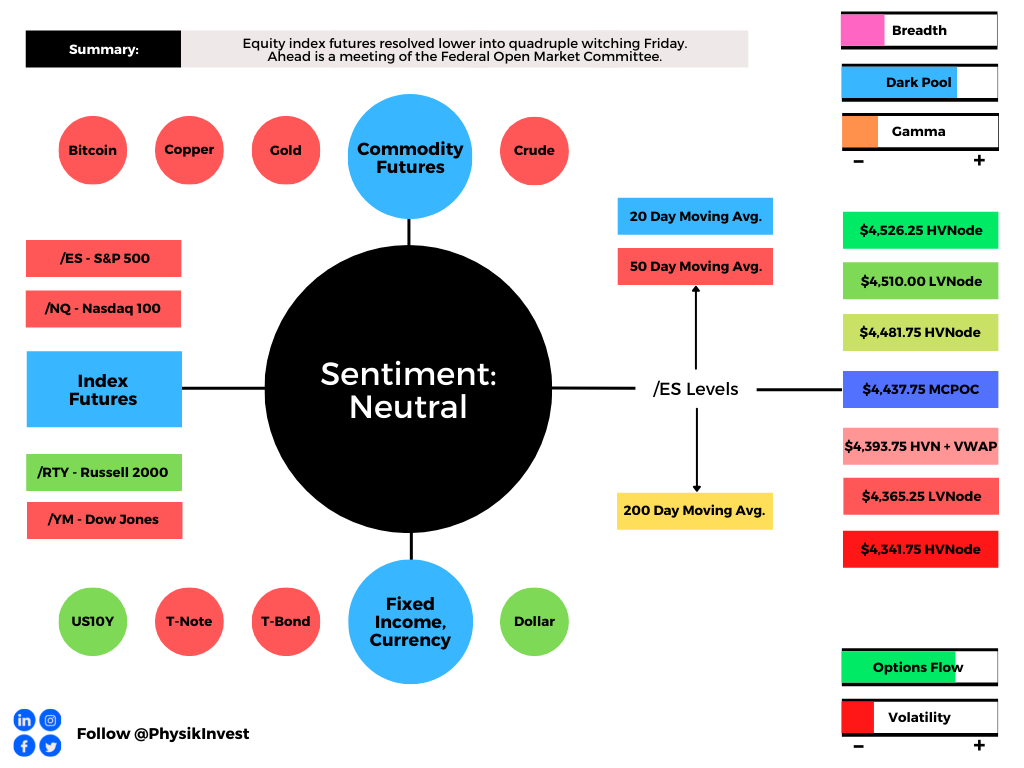
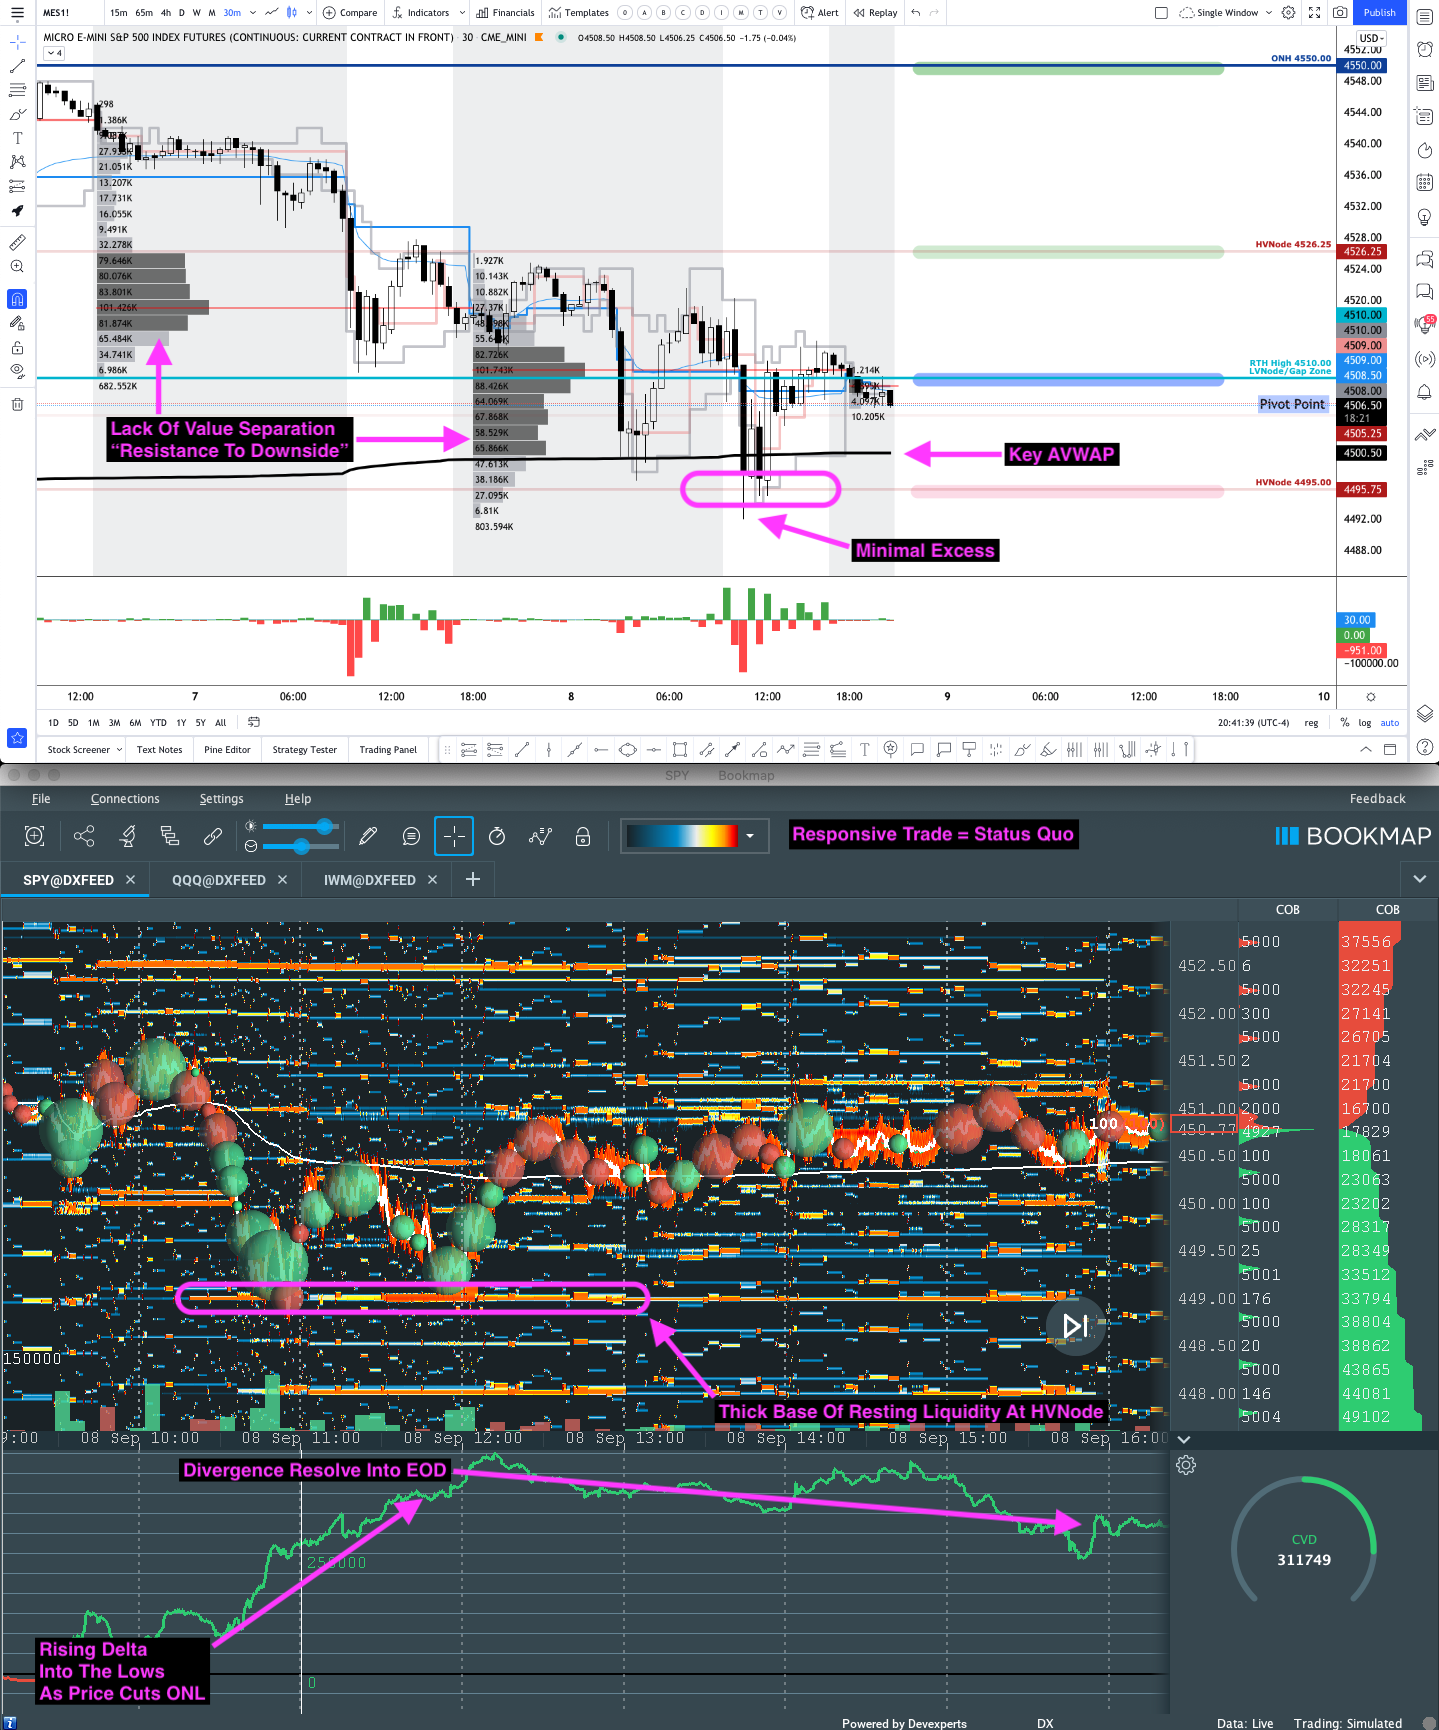
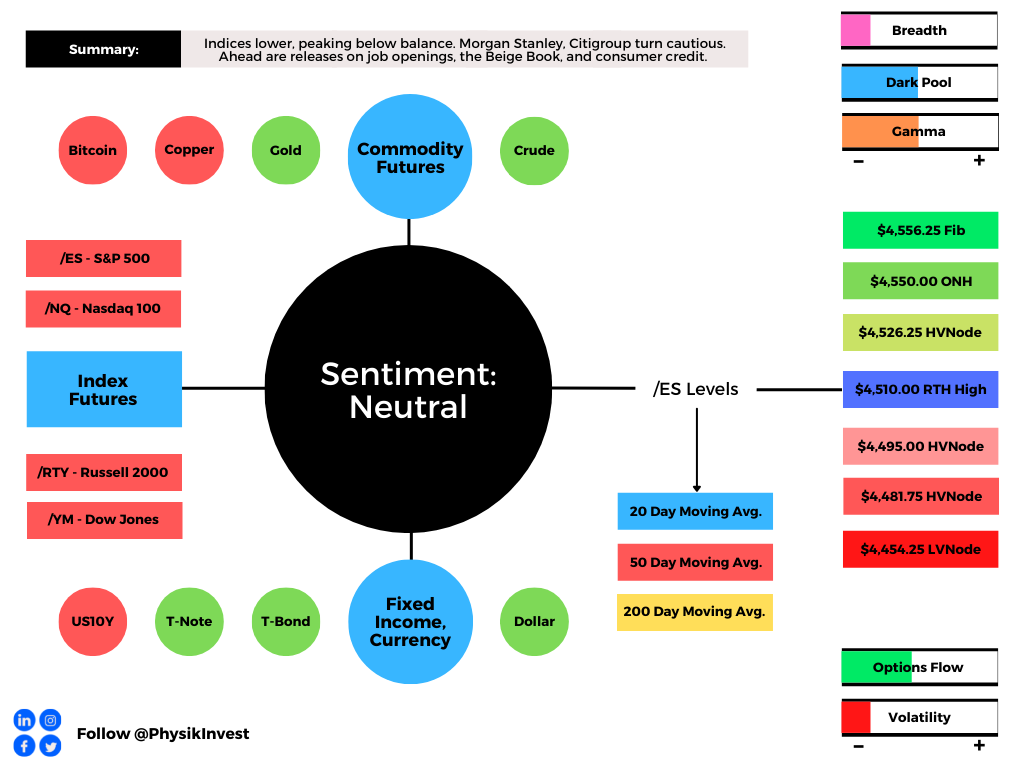
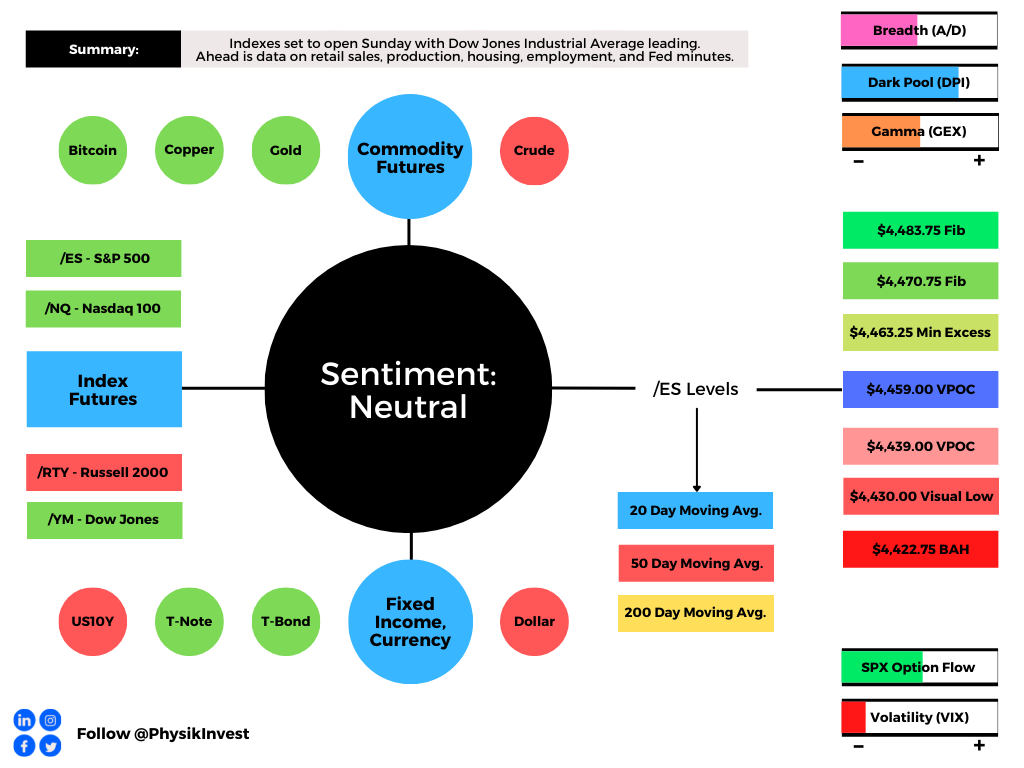
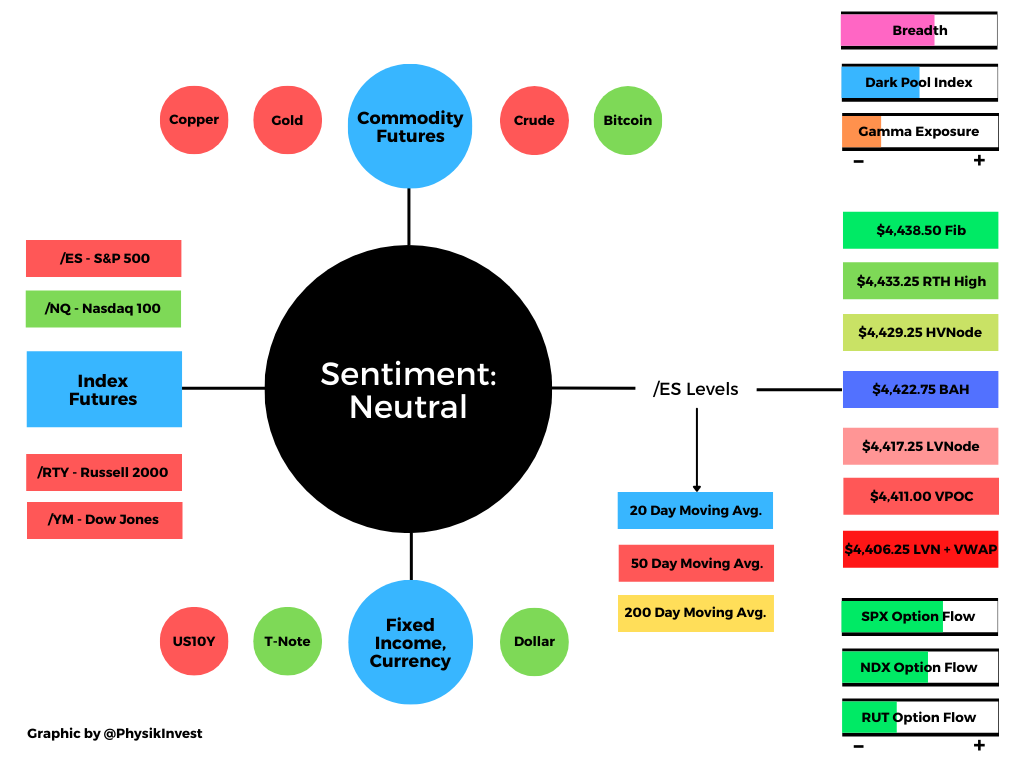
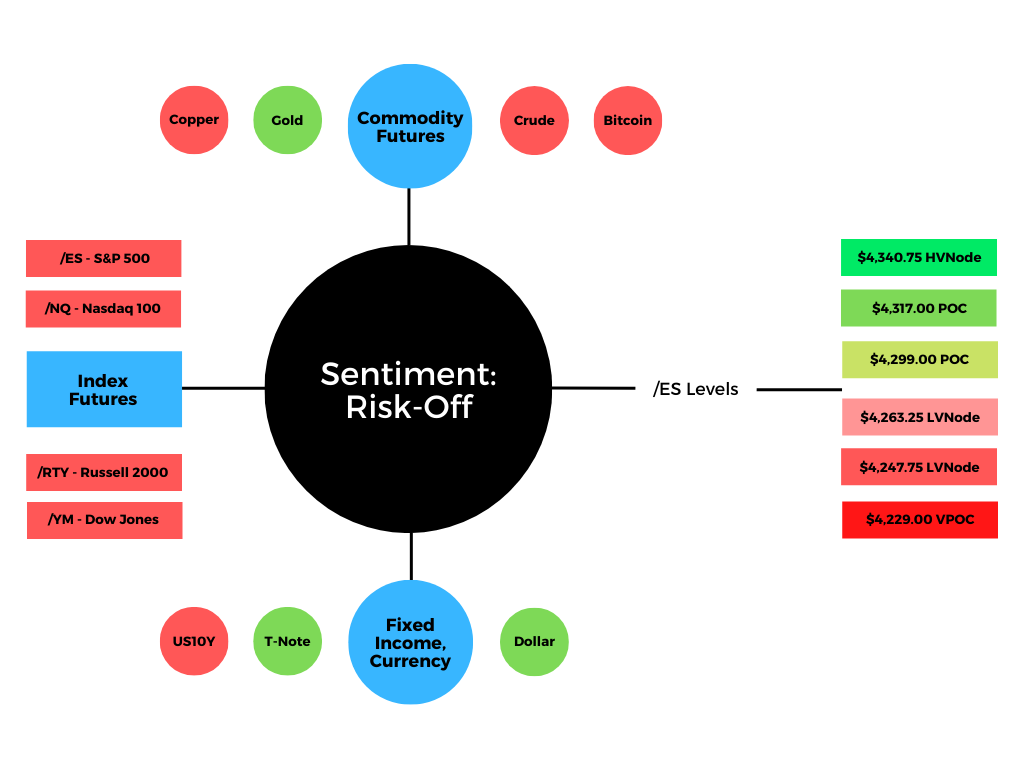
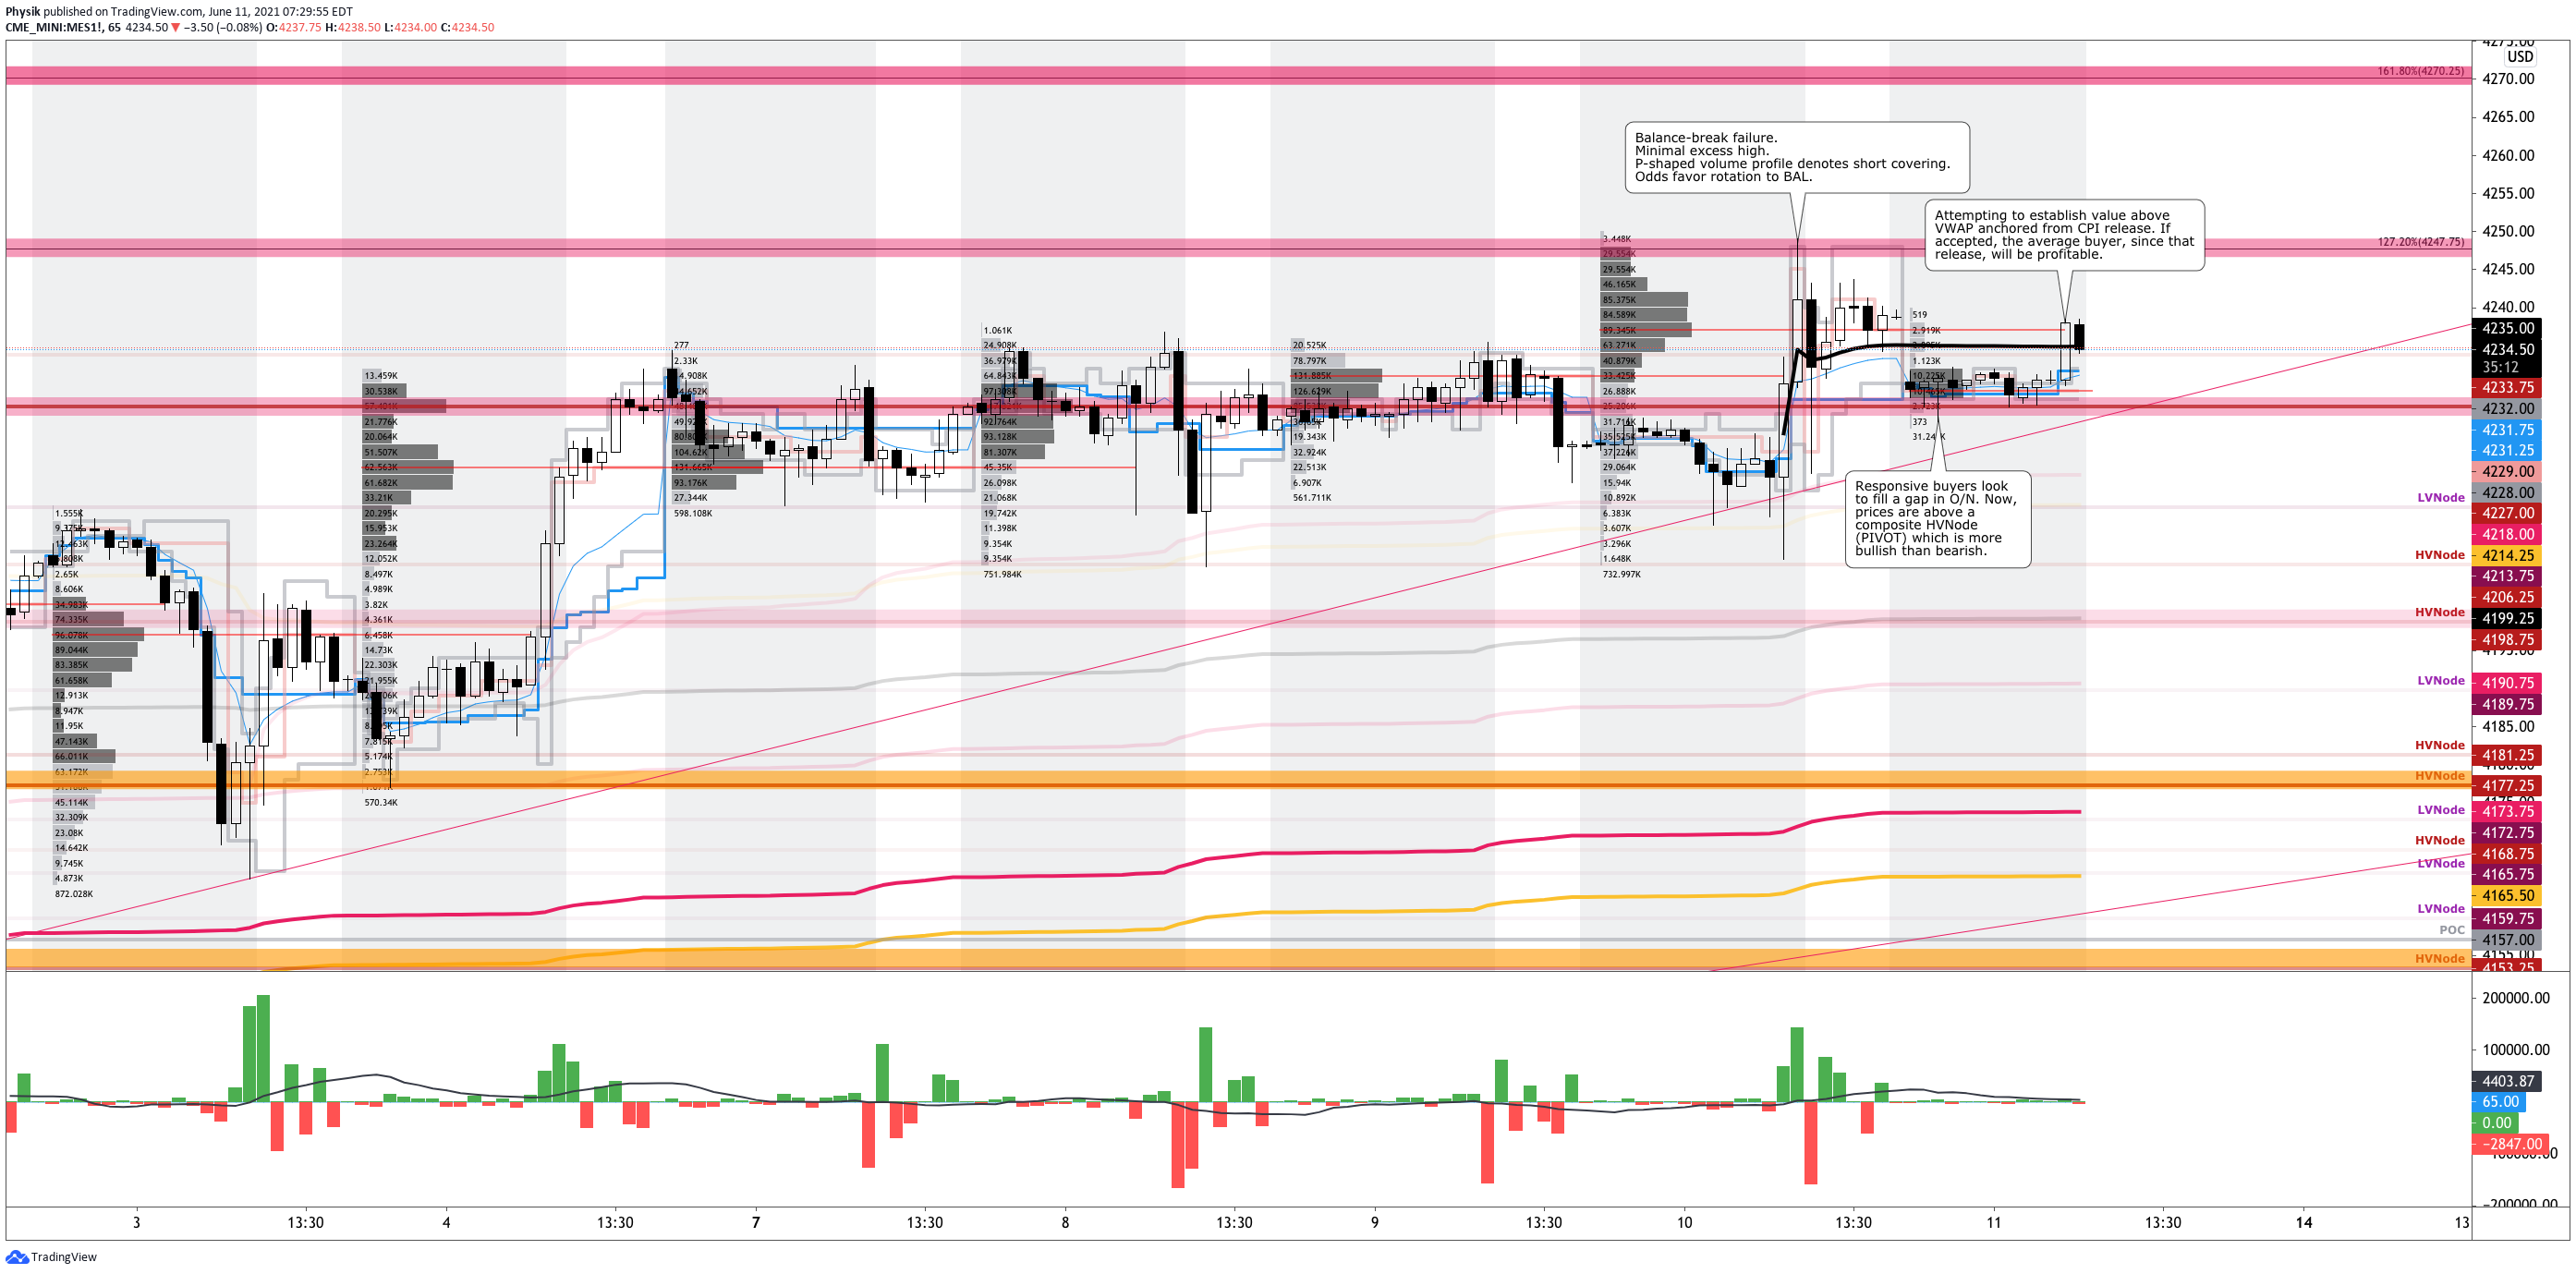
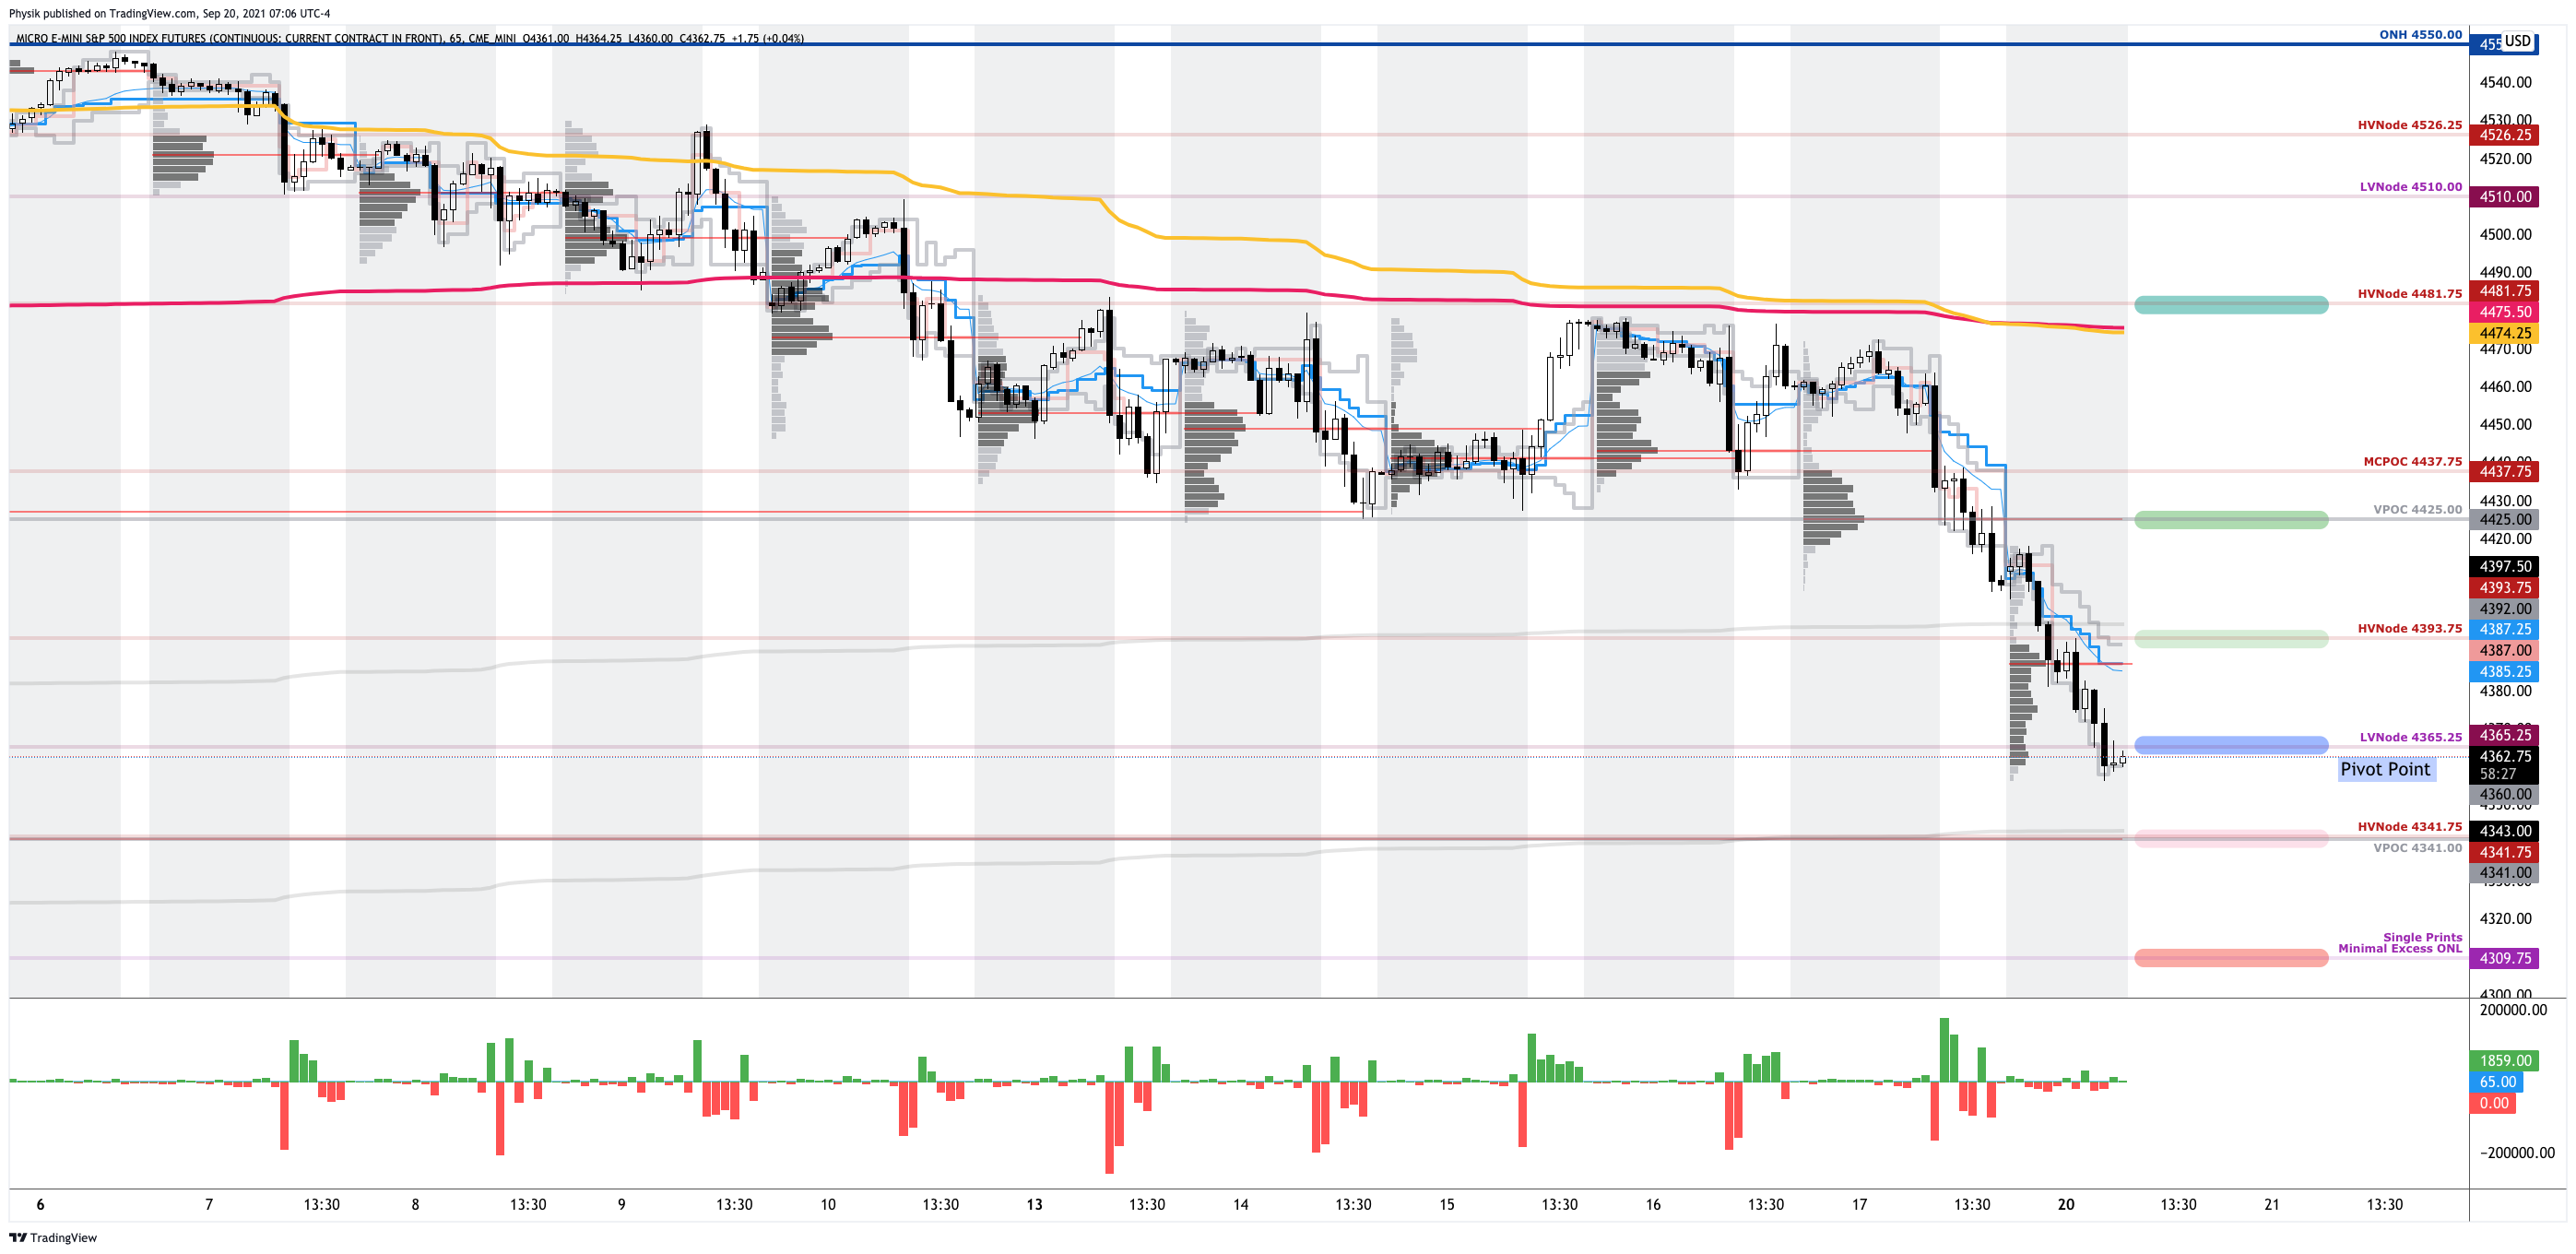
In the best case, the S&P 500 trades sideways or higher; activity above the $4,365.25 low volume area (LVNode) pivot puts in play the $4,393.75 high volume area (HVNode). Initiative trade beyond the HVNode could reach as high as the $4,425.00 untested point of control (VPOC) and $4,481.75 HVNode, or higher.
In the worst case, the S&P 500 trades lower; activity below the $4,365.25 LVNode puts in play the $4,341.00 VPOC. Initiative trade beyond the VPOC could reach as low as $4,309.75 (the intersection of a minimal excess overnight low and poor structure in a prior day session), or lower.
Definitions
Volume Areas: A structurally sound market will build on areas of high volume (HVNodes). Should the market trend for long periods of time, it will lack sound structure, identified as low volume areas (LVNodes). LVNodes denote directional conviction and ought to offer support on any test.
If participants were to auction and find acceptance into areas of prior low volume (LVNodes), then future discovery ought to be volatile and quick as participants look to HVNodes for favorable entry or exit.
POCs: POCs are valuable as they denote areas where two-sided trade was most prevalent in a prior day session. Participants will respond to future tests of value as they offer favorable entry and exit.
News And Analysis
Analyzing the nightmare scenario for China’s economy.
FOMC preview: How to make tapering data-dependent.
China’s property fear is spreading beyond Evergrande.
Goldman Sachs: Low-rate world favors quality growth.
Airbnb CEO Brian Chesky to herald a travel revolution.
Pfizer/BioNTech vaccine is safe and protective for kids.
Risks associated with rising government debt, inflation.
The global housing market is broken dividing countries.
Trudeau set for slimmer victory than hoped in election.
Yellen renews call to up debt limit to avoid catastrophe.
Solana blackout reveals the fragility of cryptocurrency.
FX Weekly: There’s a Lehman in China every 3 years.
What People Are Saying
About
After years of self-education, strategy development, and trial-and-error, Renato Leonard Capelj began trading full-time and founded Physik Invest to detail his methods, research, and performance in the markets.
Additionally, Capelj is a finance and technology reporter. Some of his biggest works include interviews with leaders such as John Chambers, founder and CEO, JC2 Ventures, Kevin O’Leary, businessman and Shark Tank host, Catherine Wood, CEO and CIO, ARK Invest, among others.
Disclaimer
At this time, Physik Invest does not manage outside capital and is not licensed. In no way should the materials herein be construed as advice. Derivatives carry a substantial risk of loss. All content is for informational purposes only.