Categories
Commentary

Weekly Brief For May 9, 2021

Market Commentary

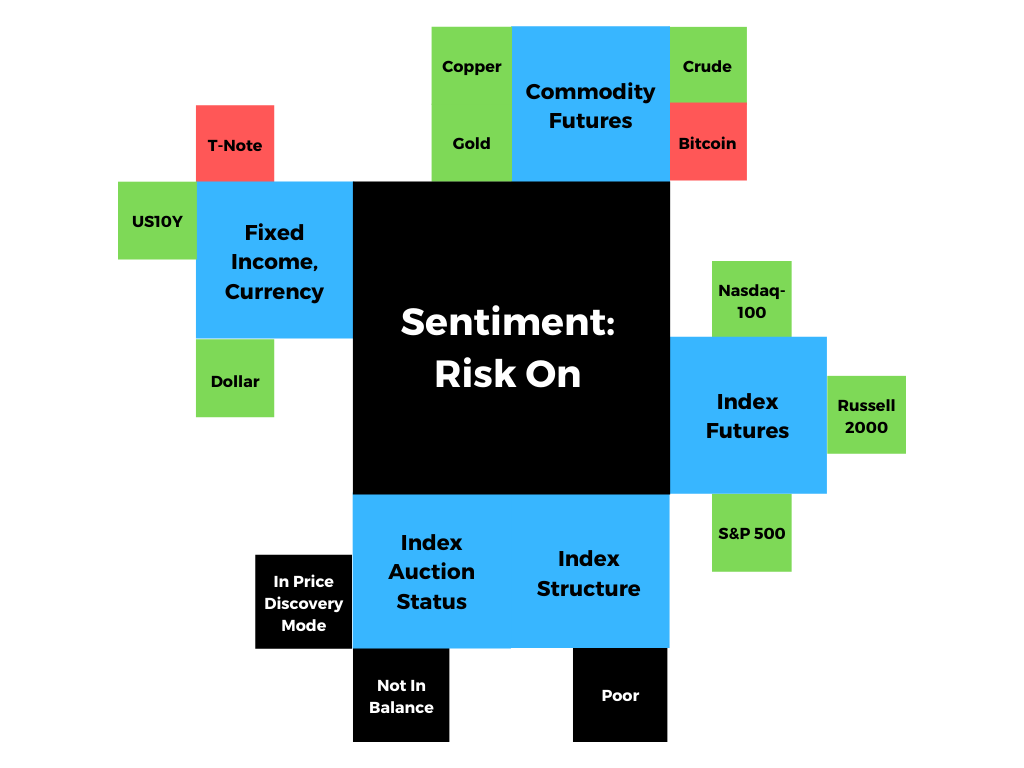
Key Takeaways: Index futures in price discovery.

  • JPMorgan puts emphasis on reflation.
  • Earnings were great. NFP not so much.
  • Indices diverge. S&P 500, Dow higher.

What Happened: Last week, U.S. stock index futures were divergent with the Nasdaq 100 and Russell 2000 lagging behind the S&P 500 and Dow Jones Industrial Average.

The push-pull between equity indices comes as market participants doubled down on the so-called “reflation” trade. JPMorgan Chase & Co (NYSE: JPM) strategists, led by Marko Kolanovic, warned many managers will “need to quickly switch gears from their deflationary playbook or risk an ‘inflation shock,’” according to Bloomberg.

“We expect a strong pickup in inflation this year, which the market will likely be slow to recognize and is poorly positioned for,” Kolanovic and his colleagues said. “A combination of boomy global growth and significant bottleneck price pressures should keep inflation on an upward trajectory while most central banks remain committed to their very accommodative stances and are looking through the inflation pickups.”

Kolanovic recommends participants cut cash and credit to increase their allocations to cyclical and value assets.

In parallel, while companies look to cut costs and boost prices, the April jobs report failed to meet expectations as people who increasingly looked for jobs had a difficult time getting hired.

Graphic: Bloomberg data shows first-quarter earnings from S&P 500 companies surging.

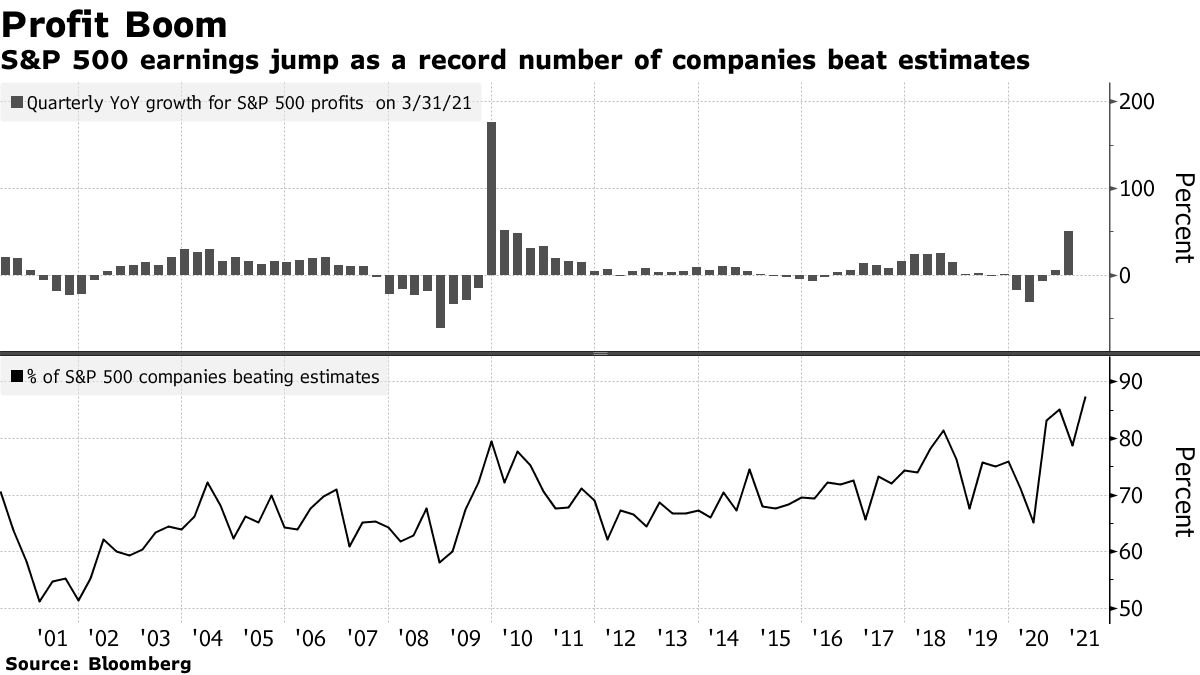
“We still think growth will be historically strong this year, but today’s jobs report is a reminder that there’s still work to be done,” Ally Inc-owned Ally Invest strategist Callie Cox said. “It’s a big data point for the inflation worries, too. If hiring slows for the next few months, businesses may not be able to pass on higher costs to consumers.”

Adding, though the April payroll miss was big enough to likely limit the Federal Reserve’s taper or rate hike discussions, traders signaled otherwise.

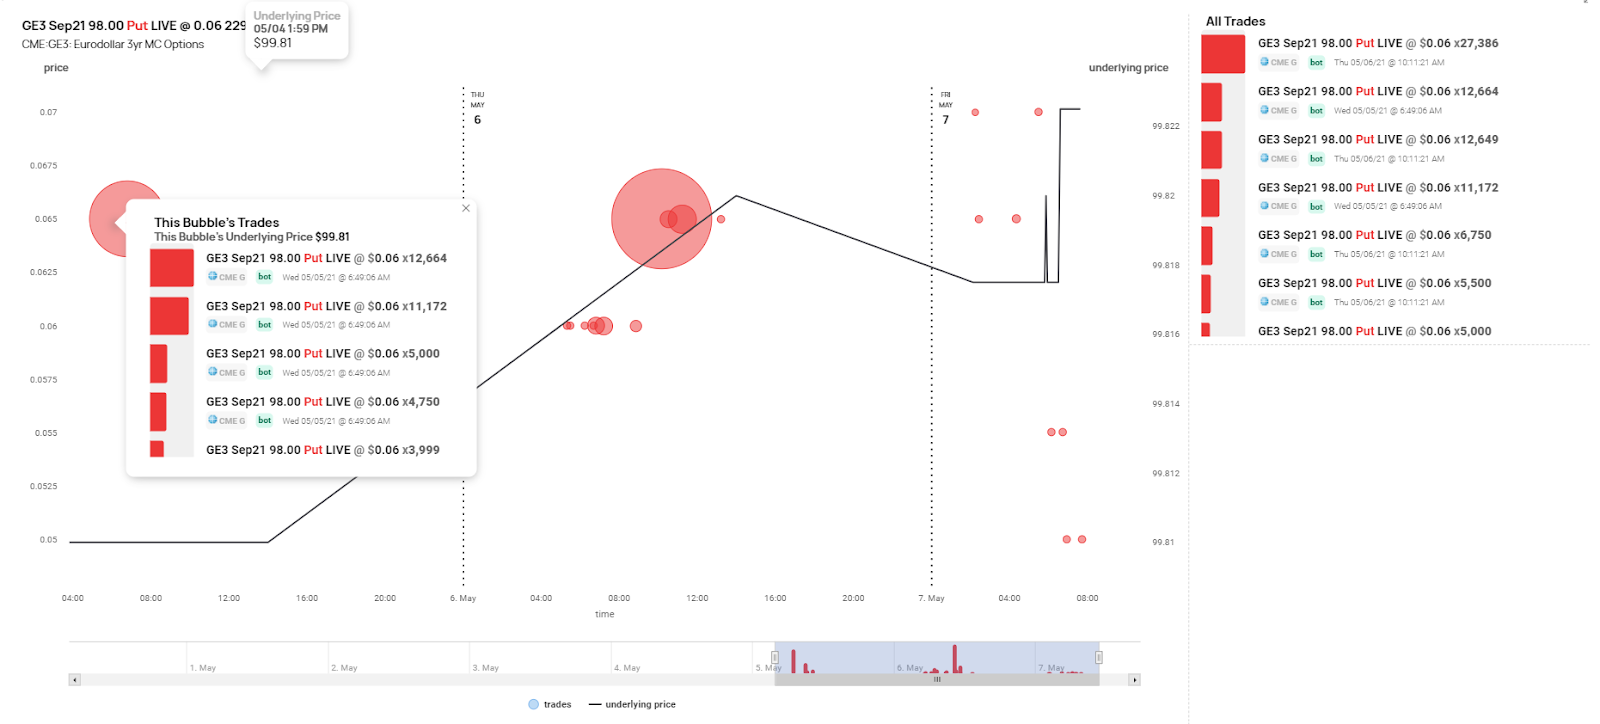
Earlier this week, Bloomberg reported on a large option bet over quicker rate hikes by the Federal Reserve. The Eurodollar bet carries a notional value of $40 billion and is focused on a potential surprise at the Jackson Hole symposium, used in the past to signal policy changes.

Graphic: Eurodollar bet on SHIFT’s institutional platform. The purchase of 98.00 strike put options suggests traders are looking to add “two Fed hikes to [current] expectations.”

Moving on, technically speaking, equity indexes are at an interesting juncture. 

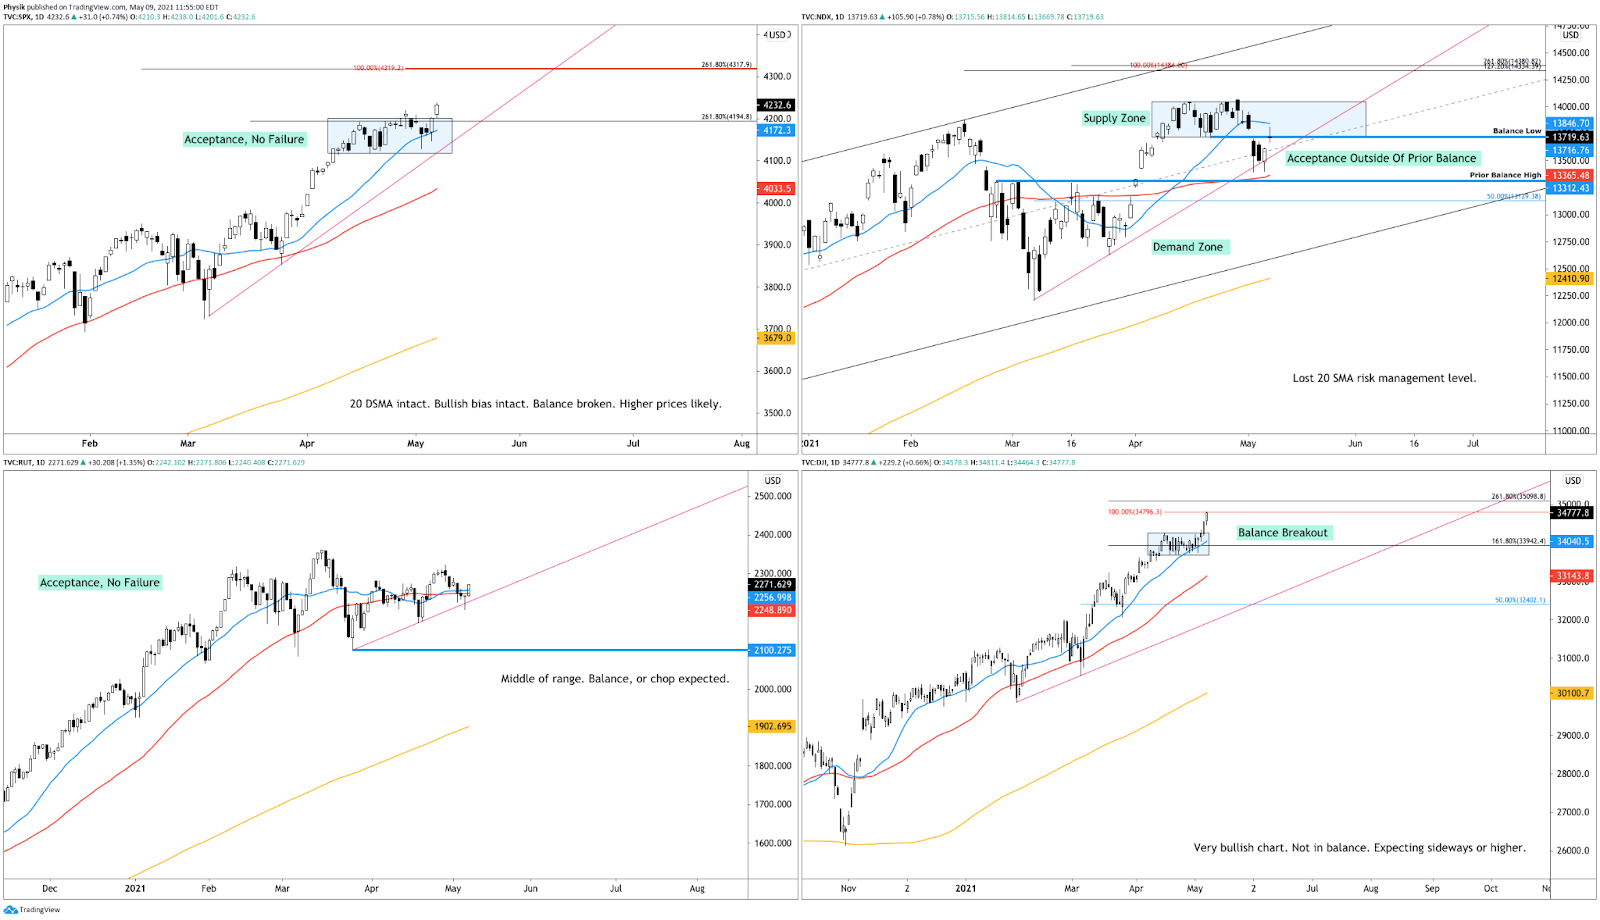
The Dow Jones Industrial Average and S&P 500 resolved their multi-week consolidations, to the upside, while the Russell 2000 is rotating within prior range and Nasdaq 100 is relatively weak, losing support and auctioning into a low-volume area.

Volume Areas: A structurally sound market will build on past areas of high volume. Should the market trend for long periods of time, it will lack sound structure (identified as a low-volume area which denotes directional conviction and ought to offer support on any test). 

If participants were to auction and find acceptance into areas of prior low-volume, then future discovery ought to be volatile and quick as participants look to areas of high volume for favorable entry or exit.

Further, the strong break in the S&P 500, which targets the Fibonacci-derived price extension near $4,300, has thus far been validated by numerous hours of trade outside of the consolidation zone (i.e., balance area). To note, though, the structure left behind Friday’s price discovery was very poor, opening the door for potential repair.

Balance (Two-Timeframe Or Bracket): Rotational trade that denotes current prices offer favorable entry and exit. Balance-areas make it easy to spot a change in the market (i.e., the transition from two-time frame trade, or balance, to one-time frame trade, or trend).

Participants ought to be cautiously optimistic given the weakness in heavily-weighted sectors like technology. Should weakness accelerate, the S&P 500 may succumb. 

Graphic: Daily candlestick charts of the S&P 500 (top left), Nasdaq 100 (top right), Russell 2000 (bottom left), and Dow Jones Industrial Average (bottom right). The Dow is the strongest of the four. The Nasdaq is the weakest.

What To Expect: In the coming sessions, participants will want to focus their attention on where the S&P 500 trades in relation to the balance area it just broke from.

That said, participants can trade from the following frameworks.

In the best case, the index trades sideways or higher; activity above the $4,210.75 boundary targets the $4,235.25 price extension. Initiative trade beyond the price extension could reach as high as the $4,266.50-$4,272.75 confluence of Fibonacci-derived price targets.

In the worst case, the index trades lower; activity below $4,210.75 puts in play the $4,179.50 spike base. Trading below the spike base negates end-of-week bullishness.

Spikes: Spike’s mark the beginning of a break from value. Spikes higher (lower) are validated by trade at or above (below) the spike base (i.e., the origin of the spike).
Graphic: 65-minute profile chart of the Micro E-mini S&P 500 Futures.
Graphic: Physik Invest maps out the purchase of call and put options in the SPDR S&P 500 ETF Trust (NYSE: SPY), for the week ending May 7, 2021. Activity in the options market was primarily concentrated in short-dated tenors, in strikes as low as $404.00, which corresponds with $4,030.00 in the cash-settled S&P 500 Index (INDEX: SPX).

News And Analysis

Economy | Forbearance exits soar as more plans expire last week. (MND)

Economy | Demand decline fuels price wars across mortgage industry. (WSJ)

Markets | Focus shifts to U.S. prices after the jobs disappointment. (BBG)

Politics | Infrastructure talks could set course of Biden spending plans. (WSJ)

Markets | New SEC chairman sets sights on firms Citadel and Virtu. (WSJ)

Markets | Pipeline hack may push pump rices to $3, ahead of holiday. (BBG)

Recovery | Fauci says ‘no doubt’ the U.S. undercounted virus deaths. (BBG)

What People Are Saying

Innovation And Emerging Trends

Crypto | German, U.S. regulators tighten focus on the crypto market. (FT)

Space | China’s ambitions in space: national pride or taking on U.S. (FT)

Crypto | Crypto startup Dfinity set to launch a blockchain AWS rival. (FT

About

Renato founded Physik Invest after going through years of self-education, strategy development, and trial-and-error. His work reporting in the finance and technology space, interviewing leaders such as John Chambers, founder, and CEO, JC2 Ventures, Kevin O’Leary, businessman and Shark Tank host, Catherine Wood, CEO and CIO, ARK Invest, among others, afforded him the perspective and know-how very few come by.

Having worked in engineering and majored in economics, Renato is very detailed and analytical. His approach to the markets isn’t built on hope or guessing. Instead, he leverages the unique dynamics of time and volatility to efficiently act on opportunity.

 Disclaimer

At this time, Physik Invest does not manage outside capital and is not licensed. In no way should the materials herein be construed as advice. Derivatives carry a substantial risk of loss. All content is for informational purposes only.

Categories
Commentary

Daily Brief For April 29, 2021

Market Commentary

Index futures in price discovery mode.

  • Market up on earnings, Fed support.
  • Ahead: Earnings and GDP forecasts.
  • Futures out of balance, off new highs.

What Happened: U.S. stock index futures auctioned higher overnight after President Joe Biden’s joint session of Congress, Fed Chair Jerome Powell’s assessment of the economy, and blowout earnings by heavily weighted index constituents. 

Graphic updated at 8:20 AM ET.

What To Expect: Thursday’s regular session (9:30 AM – 4:00 PM EST) will likely open on a gap, outside of prior-range and -value, suggesting the potential for directional opportunity.

Balance-Break + Gap Scenarios: Monitor for acceptance (i.e., more than 1-hour of trade) outside of the balance area. 

Gaps ought to fill quickly. Should they not, that’s a signal of strength; do not fade. Leaving value behind on a gap-fill or failing to fill a gap (i.e., remaining outside of the prior session’s range) is a go-with indicator. 

Auctioning and spending at least 1-hour of trade back in the prior range suggests a lack of conviction; in such a case, do not follow the direction of the most recent initiative activity.

Adding, overnight, Wednesday’s best-case outcome occurred, evidence by initiative trade beyond the S&P 500’s $4,186.75 ledge. Thus far, the index has taken out all major upside references.

Initiative Buying: Buying within or above the previous day’s value area.

Ledges: Flattened area on the profile which suggests responsive participants are in control, or initiative participants lack the confidence to continue the discovery process. The ledge will either hold and force participants to liquidate (cover) their positions, or crack and offer support (resistance).

Initiative Buying: Buying within or above the previous day’s value area.

To note, the Fed strengthened its assessment of the economy and reaffirmed the need for aggressive support. 

Charlie Ripley, Senior Investment Strategist for Allianz Investment Management states: “With no meaningful change to monetary policy or communication, this meeting was simply a message to market participants to sit back and observe as the economic recovery continues to unfold.”

“For now, the Fed is maintaining a tight grip on the bond market, but it appears like a discussion on tapering bond purchases is right around the corner.”

Moving on, for today, participants can trade from the following frameworks. 

In the best case, the S&P 500 trades sideways or higher; activity between the $4,203.25 Fibonacci-derived price extension and $4,186.75 ledge calls for balance or responsive trade. Initiative trade beyond the $4,203.25 price extension could reach as high as $4,228.00 and $4,263.00. 

Responsive Buying (Selling): Buying (selling) in response to prices below (above) area of recent price acceptance.

Balance (Two-Timeframe Or Bracket): Rotational trade that denotes current prices offer favorable entry and exit. Balance-areas make it easy to spot change in the market (i.e., the transition from two-time frame trade, or balance, to one-time frame trade, or trend).

In the worst case, the S&P 500 trades lower; activity below the $4,186.75 ledge targets the $4,181.00 POC. 

POCs: POCs (like HVNodes described above) are valuable as they denote areas where two-sided trade was most prevalent. Participants will respond to future tests of value as they offer favorable entry and exit.

Thereafter, if lower, participants should look for a rotation to the other balance, or $4,110.50. 

Graphic: 65-minute profile chart of the Micro E-mini S&P 500 Futures.
Graphic: Physik Invest maps out the purchase of call and put options in the SPDR S&P 500 ETF Trust (NYSE: SPY), for April 28. Impactful activity in the options market was primarily concentrated on the call side, in short-dated tenors, in strikes as high as $425.00, which corresponds with $4,250.00 in the cash-settled S&P 500 Index (INDEX: SPX).

News And Analysis

Economy | Mortgage application volume falls despite lower rates. (MND)

Recovery | De Blasio says New York City plans full reopen in July. (Axios)

Economy | EU industry calls for a carbon border tax as prices soar. (FT)

Technology | Chip drought hits Apple, BMW, Ford as crisis worsens. (BBG)

M&A | LSEG, and Euronext completed the Borsa Italiana transaction. (TTN)

Economy | German joblessness unexpectedly rises on virus curb. (BBG)

Markets | Getting harder to argue that price increases are temporary. (BBG)

Commodities | Goldman sees commodities rallying on strong demand. (REU)

Economy | Roads across the world busier than at the start of the year. (BBG)

What People Are Saying

Innovation And Emerging Trends

FinTech | State Of Fintech Q1 2021 Report: Investment, Sector Trends. (CBI)

MiamiTech | ‘Miami Tech Week’ wasn’t planned. But the hype is infectious. (Wired)

FinTech | Ethereum jumps to high on a report of EIB digital bond issuance. (REU)

 About

Renato founded Physik Invest after going through years of self-education, strategy development, and trial-and-error. His work reporting in the finance and technology space, interviewing leaders such as John Chambers, founder, and CEO, JC2 Ventures, Kevin O’Leary, Canadian businessman and Shark Tank host, Catherine Wood, CEO and CIO, ARK Invest, among others, afforded him the perspective and know-how very few come by.

Having worked in engineering and majored in economics, Renato is very detailed and analytical. His approach to the markets isn’t built on hope or guessing. Instead, he leverages the unique dynamics of time and volatility to efficiently act on opportunity.

 Disclaimer

At this time, Physik Invest does not manage outside capital and is not licensed. In no way should the materials herein be construed as advice. Derivatives carry a substantial risk of loss. All content is for informational purposes only.

Categories
Commentary

Market Commentary For 3/4/2021

Notice: To view this week’s big picture outlook, click here.

What Happened: After Tuesday’s end-of-day spike liquidation, U.S. stock index futures were further sold, during Wednesday’s sessions.

What Does It Mean: Broad market indices are mixed.

On a relative basis, the Nasdaq-100 is weaker, while the S&P 500 and Russell 2000 are stronger. This push-pull dynamic is making it hard for participants to resolve directionally, evidenced by recent volatility.

Based on Wednesday’s action, the S&P 500 and Russell 2000 are in balance, while the Nasdaq-100 is in price-discovery mode, evidenced by a successful break from balance. In other words, the outlook is mixed; one may argue that lower prices in the S&P 500 are likely, given the relative weakness of the Nasdaq.

Adding, there’s one guarantee over the next few sessions: volatility.

Given that the S&P 500 and Nasdaq-100 are in short-gamma territory (Graphic 1), option dealers are required to hedge their exposure in a manner that exacerbates volatility. This hedging activity will worsen with the purchase of put options by market participants looking to hedge their downside, which is happening, as evidenced by Graphic 2.

More On Gamma: Gamma is the sensitivity of an option to changes in underlying price. Dealers that take the other side of option trades hedge their exposure to risk by buying and selling the underlying. When dealers are short-gamma, they hedge by buying into strength and selling into weakness. When dealers are long-gamma, they hedge by selling into strength and buying into weakness. The former exacerbates volatility. The latter calms volatility.
Graphic 1: SpotGamma data suggests Nasdaq-100 at or below “Short-Gamma” juncture.
Graphic 2: Option activity for the largest ETFs that track the S&P 500, Nasdaq-100, and Russell 2000.

Important to note is market liquidity, which suggests (1) buying pressure is increasing or (2) sellers are absorbing resting liquidity (which could be opportunistic buying or short covering into weakness).

What To Expect: Thursday’s regular session (9:30 AM – 4:00 PM ET) will likely open just inside of prior-value and -range, suggesting a limited potential for immediate directional opportunity.

During Wednesday’s trade, the worst case outcome occurred: participants auctioned past Tuesday’s regular trade low, emboldening sellers and starting a new auction, to the downside. The session ended on a spike lower, away from value, with the Nasdaq-100 breaking its week-long balance area, to the downside.

More On Spikes: Spike’s mark the beginning of a break from value. Spikes higher (lower) are validated by trade at or above (below) the spike base (i.e., the origin of the spike).

More On Balance (Two-Timeframe Or Bracket): Rotational trade that denotes current prices offer favorable entry and exit. Balance-areas make it easy to spot change in the market (i.e., the transition from two-time frame trade, or balance, to one-time frame trade, or trend).

Important to mention is overnight discovery, which established clear excess on the composite profile.

More On Excess: A proper end to price discovery; the market travels too far while advertising prices. Responsive, other-timeframe (OTF) participants aggressively enter the market, leaving tails or gaps which denote unfair prices.

Given the aforementioned dynamics, participants can trade from the following frameworks.

In the best case, the S&P 500 either (1) remains rotational, trading responsively between the $3,785.00 gap boundary and $3,837.75 high-volume area (HVNode), or (2) auctions past the $3,837.75 HVNode.

Thereafter, if higher, attention shifts to whether the S&P 500 can get past the $3,861.25 low-volume area (LVNode). Doing so suggests the most recent downside probe was an auction failure (i.e, participants rejected lower prices, sparking a rapid recovery).

In the worst case, participants auction past the $3,777.75 regular trade low (RTH Low). In such a case participants may target the $3,727.75 and $3,689.50 HVNodes.

More On Volume Areas: A structurally sound market will build on past areas of high-volume. Should the market trend for long periods of time, it will lack sound structure (identified as a low-volume area which denotes directional conviction and ought to offer support on any test). 

If participants were to auction and find acceptance into areas of prior low-volume, then future discovery ought to be volatile and quick as participants look to areas of high-volume for favorable entry or exit.
Pictured: Profile overlays on a 4-hour chart of the Micro E-mini S&P 500 Futures.

Levels Of Interest: $3,837.75 HVNode, $3,777.75 RTH Low, and $3,727.75 HVNode.

Categories
Commentary

Market Commentary For 2/16/2021

Notice: To view this week’s big picture outlook, click here.

What Happened: U.S. stock index futures auctioned higher, over the holiday weekend, as investors remained optimistic on the progress of coronavirus relief.

What Does It Mean: After a v-pattern recovery and sideways trade in the weeks prior, stock index futures auctioned out of prior-balance and -range, via Friday’s end-of-day spike.

More On Spikes: Spike’s mark the beginning of a break from value. Spikes higher (lower) are validated by trade at or above (below) the spike base (i.e., the origin of the spike).

Adding, the spike makes it easy to spot the shift from balance (i.e., the transition from two- to one-time frame trade). For the entirety of Friday’s session, prices rotated in the face of increased buying interest, as observed by volume delta. At the outset, buying pressure looked as thought it was absorbed by sellers. Eventually, the rise in delta was resolved when participants broke through a ledge of responsive selling, and established record highs.

More On Volume Delta: Buying and selling power as calculated by the difference in volume traded at the bid and offer.

What To Expect: Tuesday’s regular session (9:30 AM – 4:00 PM ET) will likely open outside of prior-balance and -range, suggesting the potential for immediate directional opportunity.

This comes alongside a resumption in trend and an overnight rally-high at $3,959.25.

More On Overnight Rally Highs: Typically, there is a low historical probability associated with overnight rally-highs ending the upside discovery process.

Given the spike, balance-break and subsequent resumption in trend, as well as the overnight high (ONH), participants are aware that favorable opportunities primarily rest on the long-side.

Thus, given the aforementioned dynamics, the following frameworks ought to be applied.

In the best case, the S&P 500 opens and remains above the $3,919.75 spike base, confirming last week’s higher prices. In the worst case, the S&P 500 auctions below the $3,919.75 spike base.

Trade below the spike base would be the most negative outcome and could trigger a new wave of downside discovery, repairing some of the poor structures left in the wake of the aforementioned advance.

Levels Of Interest: $3,919.75 spike base.

Categories
Commentary

Market Commentary For The Week Ahead: ‘To The Moon’

Key Takeaways:

  • Positive earnings revisions nearing records
  • Equity mutual funds attract strong inflows.
  • Multi-asset funds raising equity allocations.

What Happened: U.S. stock indexes resolved a week-long trading range, Friday.

What Does It Mean: As the new administration looked to advance the status of coronavirus relief, U.S. stock index futures established record highs.

This comes as stock indexes, particularly the S&P 500, traded sideways after a rapid de-risking event associated with the GameStop Corporation (NYSE: GME) crisis, and subsequent v-pattern recovery.

More On The V-Pattern: A pattern that forms after a market establishes a high, retests some support, and then breaks above said high. In most cases, this pattern portends continuation.

As stated on Friday, the tight trading range is most likely attributable to the large February monthly options expiration (OPEX), after which, the interest at the $3,900.00 S&P 500 option strike will roll-off. 

Graphic 1: Physik Invest maps out the purchase of call and put options in the SPDR S&P 500 ETF Trust (NYSE: SPY), for the week ending February 12, 2021. Activity in the option market was primarily concentrated in short-dated tenors near $390, a strike that corresponds with $3,900.00 in the cash-settled S&P 500 Index (INDEX: SPX).

Why’s this? Most funds are committed to holding long positions. In the interest of lower volatility returns, these funds will collar off their positions, selling calls to finance the purchase of downside put protection.

As a result of this activity, option dealers are long upside and short downside protection.

This exposure must be hedged; dealers will sell into strength as their call (put) positions gain (lose) value and buy into weakness as their call (put) positions lose (gain) value.

Now, unlike theory suggests, dealers will hedge call losses (gains) quicker (slower). This leads to “long-gamma,” a dynamic that crushes volatility and promotes momentum, observed by lengthy sprints, followed by rapid de-risking events as the market transitions into “short-gamma.”

If the interest near $3,900.00 S&P 500 is not rolled up in price and out in time, then option hedging requirements will change.

However, it is important to note that, in recent days, some exposure has been rolled up in price and out in time. This suggests an inclination by participants to maintain long exposure through OPEX, a day that would mark an end to pinning (which we’ve seen over the past weeks).

One such example can be seen below.

Graphic 4: Purchase of call positions higher in price and farther out in time in the cash-settled S&P 500 Index

What To Do: In coming sessions, participants will want to pay attention to the $3,919.75 spike base and $3,928.25 balance-area high.

More On Spikes: Spike’s mark the beginning of a break from value. Spikes higher (lower) are validated by trade at or above (below) the spike base (i.e., the origin of the spike).

Balance-areas make it easy to spot change in the market (i.e., the transition from two-time frame trade, or balance, to one-time frame trade, or trend).

Given the spike out of balance, the following frameworks ought to be applied. 

In the best case, the S&P 500 opens and remains above the $3,919.75 spike base, confirming last week’s higher prices. In the worst case, the S&P 500 auctions below the $3,919.75 spike base.

Trade below the spike base would be the most negative outcome and may trigger a new wave of downside discovery, repairing some of the poor structures left in the wake of the aforementioned advance.

Graphic 5: Profile overlays on a 30-minute candlestick chart of the Micro E-mini S&P 500 Futures.

Conclusions: The go/no-go level for next week’s shortened holiday trade is $3,919.75. Trade below this level suggests markets are not yet ready to rally.

Levels Of Interest: $3,919.75 spike base.

Cover photo by Pixabay, from Pexels.

Categories
Commentary

Market Commentary For The Week Ahead: ‘Follow The Flow’

Key Takeaways:

What Happened: After prices were advertised below balance in the week prior, responsive buyers in the S&P 500 began a rally that found acceptance back inside a larger balance-area, near the $3,800 high-open interest strike.

Thereafter, initiative buyers extended the S&P 500’s rally, breaking the index above its $3,824.25 balance-area high (BAH), before establishing acceptance near the $3,850.00 price extension, an upside target, and auctioning back into range, repairing poor structures left in the wake of discovery.

What Does It Mean: In light of a failed breakdown in the week prior, U.S. stock indexes were best positioned for further downside discovery. However, after what appears to be aggressive buying in response to prices below value, it was clear that was not the case.

This leads to the following question: why did selling stop on January 15? One answer, aside from a positive start to the earnings season and prospects for further stimulus, may be OPEX, the January 15 option expiry. On expiration days, delta and gamma exposures change — depending on how derivatives exposure is removed or rolled — which causes dealers to adjust hedges.

According to SpotGamma, the January 15 expiry “resulted in a ~50% reduction in single stock gamma … [which] creates volatility because, as large options positions expire[], are closed and/or rolled, dealers have large hedges they need to adjust. There is a trove of data to suggest that the bulk of single stock call activity is long calls, and based on that we believe dealers (who are short calls vs long stock) therefore have long stock positions to sell.”

Put more simply, the price action may have been attributable to the sale of long stock that hedged expiring short derivatives exposure above the market (i.e., call side).

Per the SpotGamma S&P 500 dealer hedging graphic for the January 15 expiry below, “The black line was the mark on Thursday evening, with the red line being the forecasted position on Tuesday. This red line being substantially lower than the black suggests that dealers had to reduce delta exposure as a result of expiration. Note there is a larger shift at overhead prices suggesting this was a ‘call heavy’ expiration.”

Graphic 1: SpotGamma S&P 500 dealer hedging graphic for the January 15 options expiry

After the VIX (i.e., CBOE’s Volatility Index) expiry on January 20, alongside the inauguration of President Joe Biden, the prospects for a rally improved as “event premium in IV dries up … [and] put values drop, which allows dealers (who are short puts) to buy back short hedges … [fueling] a quick rally up to the 3850SPX/385SPY level (green arrow).”

Graphic 2: SpotGamma S&P 500 Gamma Levels

Adding, the number of put options sold to open exceeded the number bought to open, per SpotGamma, suggesting increased confidence in higher prices as market participants look to options for income, and not insurance.

Historically, the returns after such developments are mixed — more often the appearance of strong initiative buying surfaces (e.g., August and January 2020) before a liquidation helps correct excess inventory, and bring sense back into the market.

Graphic 3: SpotGamma plots opening option positions.

What To Expect: During Friday’s session in the S&P 500, responsive buying surfaced after a test of the $3,818.25 High-Volume Node (HVNode), above the $3,813.50 ledge (below which is a pocket of low-volume).

In the simplest way, high-volume areas can be thought of as building blocks. A structurally sound market will build on past areas of high-volume. Should the market trend for long periods of time, it will lack sound structure (identified as a low-volume area which denotes directional conviction and ought to offer support on any test).

If participants were to auction and find acceptance into areas of prior low-volume, then future discovery ought to be volatile and quick as participants look to areas of value for favorable entry or exit.

After the S&P 500 found acceptance above the $3,813.50 ledge and $3,824.25 BAH, it encountered responsive selling near the $3,840.75 HVNode, the site of a downtrend line. Since the selling transpired at a visual level, market participants know that technically-driven, short-term traders in control. In other words, institutions (e.g, funds) tend not to transact at exact technical levels.

Given the aforementioned dynamics, participants will come into Monday’s session knowing the following:

  1. The S&P 500’s higher-time frame breakout remains intact, per graphics 7, 8, and 9.
  2. Late last year, JPMorgan Chase & Co. (NYSE: JPM) strategist Marko Kolanovic suggested equities would rally with the S&P 500 auctioning as high as $4,000 on the basis of low rates, improved fundamentals, buybacks, as well as systematic and hedge fund strategies. Since then, Kolanovic downgraded growth and expressed the limited potential for further upside.
  3. The earnings of heavily weighted index constituents suggests participants discount improved speculative flows and delta (e.g., presence of committed buying or selling as measured by volume delta). Please see graphics 4, 5, and 6.
Graphic 4: Supportive order flow in the SPDR S&P 500 ETF Trust (NYSE: SPY), the largest ETF that tracks the S&P 500, on January 20 trend day.
Graphic 5: Supportive order flow in the SPDR S&P 500 ETF Trust (NYSE: SPY), the largest ETF that tracks the S&P 500, on January 22.
Graphic 6: Speculative derivatives activity for the week ending January 23, 2021.
Graphic 7: Daily candlestick chart of the cash S&P 500 Index

Given the above dynamics, the following frameworks apply for next week’s trade.

In the best case, the S&P 500 takes back Friday’s liquidation and auctions above the $3,840.75 HVNode. Expectations thereafter include continued balance or initiative buying to take out the $3,859.75 overnight all-time high (there is a low probability that overnight all-time highs end the upside discovery process). Thereafter buying continues as high as the $3,884.75 price projection, or double the width of the balance-area, the typical target on a balance-area breakout.

In the worst case, any break that finds increased involvement (i.e., supportive flows and delta) below $3,824.25 BAH, would favor continuation as low as the $3,763.75 BAL.

Graphic 8: Profile overlays on a 15-minute candlestick chart of the Micro E-mini S&P 500 Futures

Conclusions: Despite broad-market indices being in a longer-term uptrend, the odds of substantial upside resolve are low. Participants ought to look for favorable areas to transact, such as those high-volume areas in the S&P 500 featured in graphic 8.

All in all, the risk and reward dynamics, at these price levels, are poor.

Graphic 9: 4-hour profile chart of the Micro E-mini S&P 500 Futures

Levels Of Interest: $3,884.75, $3,859.75, $3,840.75 HVNode, $3,824.25 BAH, $3,763.75 BAL.

Cover photo by Jayant Kulkarni from Pexels.

Categories
Commentary

Market Commentary For 1/21/2021

Notice: To view this week’s big picture outlook, click here.

What Happened: After a day of active discovery, U.S. index futures established a new all-time high in the overnight session, before backing off into prior-range and -value.

What Does It Mean: Initiative buyers extended the S&P 500’s rally, breaking the index above its $3,824.25 balance-area high (BAH). Later, market participants found acceptance near the $3,850.00 price extension, an upside target.

What To Expect: Thursday’s regular session (9:30 AM – 4:00 PM ET) will likely open close to prior-balance and -range, implying higher volatility at the open.

Few dynamics to note: (1) poor structure in prior sessions, as evidenced by the low-volume areas (LVNodes) in the graphic above, (2) a new overnight all-time high (i.e., historically, there is a low probability that overnight all-time highs end the upside discovery process), (3) a break that finds acceptance outside of a larger balance-area portends continuation up to the 100% price projection, or double the width of the balance-area.

In the best case, given that the open will occur after a day of active discovery, participants can expect overnight balancing activity to carry on. If initiative buying was to take out the $3,859.75 overnight high (ONH), then participants ought to target the $3,884.75 balance-break projection.

The go/no-go level for further upside is the $3,859.75 (ONH). The go/no-go level for downside is the $3,824.25 balance-area high (BAH). Anything in-between classifies as rotation, or the potential repair of poor structures left in the session prior.

Noting: Low-volume areas denote conviction and should hold against future probes. If a market was to break into a low-volume area, then odds favor discovery through the entire area, to the next high-volume concentration, or the market’s most recent perception of value.

Levels Of Interest: $3,824.25 BAH, $3,859.75 ONH, $3,884.75 projection.

Categories
Commentary

Market Commentary For The Week Ahead: ‘Rally On Pause’

Key Takeaways:

What Happened:

Alongside mixed economic releases, plans for added fiscal stimulus, as well as a start to the Q4 earnings season, U.S. index futures broke balance and auctioned lower.

Given that Friday’s worst case scenario was realized, U.S. stock indexes are positioned for further downside discovery.

Graphic 1: Profile overlays on a 30-minute candlestick chart of the Micro E-mini S&P 500 Futures

What To Expect: Friday’s session in the S&P 500 found responsive buying surface after a test of the $3,741.25 Virgin Point of Control, or VPOC (i.e., the fairest price to do business in a prior session).

Noting: POCs are valuable as they denote areas where two-sided trade was most prevalent. Participants will respond to future tests of value as they offer favorable entry and exit.

In the simplest way, high-volume areas can be thought of as building blocks. A structurally sound market will build on past areas of high-volume. Should the market trend for long periods of time, it will lack sound structure. If participants were to auction and find acceptance into areas of prior low-volume, then future discovery ought to be volatile and quick as participants look to areas of value for favorable entry or exit.

Thereafter, buying pressure quickly disappeared, and the S&P 500 confirmed the balance-break. Now, in light of the market’s search for an area to establish balanced, two-sided trade, participants will come into Tuesday’s session knowing the following:

  1. Prior to a multi-session consolidation, profile structures denoted the presence of short-covering. This was the result of old, weak-handed business emotionally buying to cover short positions, causing swift movement, followed by a stalled advance, or two-sided trade.
  2. Unsupportive speculative flows and delta (e.g., non-presence of committed buying or selling) in some instances, as can be viewed by the order flow graphics 2 and 3 below.
  3. The multi-month upside breakout targeting S&P 500 prices as high as $4,000.00 remains intact, per graphic 4.
  4. After a v-pattern recovery, the S&P 500 consolidated near the $3,800 high-open interest strike, forming a balance-area. This structure was resolved with Friday’s balance-break. A break-out from balance is usually the start of a short-term auction. Therefore, placing trades in the direction of the break is the normal course of action. Trading back into the consolidation (above $3,763.75), thereby invalidating the break-out, may portend a move to the other end of balance ($3,824.25).
Graphic 2: Divergent delta in the iShares Russell 2000 ETF (NYSE: IWM), one of the largest ETFs that track the Russell 2000
Graphic 3: Order flow in the SPDR S&P 500 ETF Trust (NYSE: SPY), the largest ETF that tracks the S&P 500
Graphic 4: Daily candlestick chart of the cash S&P 500 Index

Given the above dynamics, the following frameworks apply for next week’s shortened holiday trade.

In the best case, the S&P 500 remains above its $3,763.75 balance-area low (BAL). Expectations thereafter include continued balance or initiative buying to take out the $3,824.25 balance-area high (BAH).

In the worst case, the S&P 500 remains below its $3,763.75 BAL. Expectations thereafter include a test of the low-volume node (LVNode) near $3,732.75. A break of the LVNode would portend a response near the $3,703.25 balance-break projection.

Conclusions: For now, despite a negative balance-break jeopardizing the bullish thesis, broad-market indices are in a longer-term uptrend. Participants ought to look for favorable areas to transact, such as those big-picture high-volume areas featured in graphic 5.

Graphic 5: 4-hour profile chart of the Micro E-mini S&P 500 Futures

Levels Of Interest: $3,763.75 BAL, $3,824.25 BAH, $3,732.75 LVNode, $3,703.25 balance-break projection.

Cover photo by Oleg Magni from Pexels.

Categories
Commentary

Market Commentary For 12/1/2020

What Happened: Alongside optimism surrounding a coronavirus vaccine and the economic recovery, stock index futures are trading out of range and balance, improving the prospects for further upside.

What Does It Mean: In Monday’s regular trading, responsive buying surfaced after the repair of poor structures left behind the November 24 upside discovery process.

Simply put, the S&P 500 established a v-shaped recovery — 100% retracement of the November 30 session high — after a test of the high-volume node near $3,600 offered responsive participants a favorable buying opportunity.

Overnight, buyers further extended range, breaking a week-long balance area.

Given the bullish break above the responsive selling ledge at $3,640, participants now know that initiative buyers are firmly in control, and the primary target remains the $3,668.75 all-time rally high.

Due to the gap’s size, the odds of range expansion during the day session are lower. As a result, participants should monitor whether the resistive $3,640 ledge now turns into support. Breaking below that level puts the rally on hold, and suggests further balance.

Levels Of Interest: $3,640 ledge, $3,664.75 overnight high, $3,668.75 all-time rally high.

Categories
Commentary

‘Dualism’: Market Commentary For The Week Ahead

Key Takeaways:

  • Decline in cash levels is a sign of stretched sentiment. 
  • Positioning: Odds of sustained directional resolve low.
  • Potential confirmation of multi-month balance-break.

What Happened: During last week’s shortened holiday trade, U.S. index futures broke out to new all-time highs.

What Does It Mean: After Tuesday’s initiative upside drive alongside news that provided clarity on the election transition, participants rotated back over the $3,580 balance-area boundary, invalidating the prior week’s initiative selling activity. Thereafter, conviction disappeared and the market remained range-bound, as evidenced by a non-participatory delta (i.e., the non-presence of committed buying) and mechanical trade (i.e., low-excess at the edges of developing balance).

Pictured: Profile overlays on a 15-minute candlestick chart of the Micro E-mini S&P 500 Futures

What To Expect: During Friday’s shortened holiday session, the S&P 500 remained in balance, further auctioning and accepting value into Tuesday’s excess high, which marked an end to the upside discovery process. 

Given that initiative buyers remained in control after auctioning into the micro-composite high-volume node at $3,631, the fairest price to do business after Tuesday’s upside drive, participants come into Monday’s session knowing the following: 

  1. The amount of cash investors are holding in their portfolios fell to levels last seen prior to the February sell-off. 
  2. Market sentiment, as represented by Citigroup Inc’s (NYSE: C) Panic/Euphoria Model, is historically stretched.
  3. Tuesday’s upside impulse, through the low-volume node at $3,580, was reminiscent of short-term, momentum-driven buying. 
  4. Holiday trade was dominated by low-volume and responsive participation, implying the non-presence of conviction and institutions (e.g., funds that transact at non-technical levels).
  5. Positioning suggests dealers are long gamma, meaning they sell into strength and buy into weakness, suppressing volatility and the potential for directional resolve.
Graphic by Spotgamma, taken from The Market Ear

Therefore, given the acceptance of higher prices, the following frameworks for next week’s trade apply.

If participants manage to spend time and build value above the $3,631 micro-composite high-volume node, then initiative buyers remain in control — nearest targets include the $3,655 and $3,668.75 rally highs.

Otherwise, the auction ought to find responsive buyers near the high-volume node. An initiative drive below that figure would put the rally on hold, and would target first $3,620, and then the node near $3,610.

Conclusion: Though sentiment and positioning imply limited potential for further upside, the market remains in a strong technical uptrend bolstered by factors including a divided government, vaccine administration, rebound in profits, low rates, and a small rise in the yield curve.

As of now, the S&P 500 is on the verge of confirming a multi-month balance-break.

Pictured: Daily candlestick chart of the cash S&P 500 Index

Levels Of Interest: Micro-composite HVN at $3,631, the $3,655 and $3,668.75 rally highs, as well as the nodes near $3,620 and $3,610.

Cover photo courtesy by cottonbro from Pexels.