
Market Commentary
Equity index futures trade higher ahead of key fundamental events.
- ECB comments, COVID, geopolitics.
- Ahead: Trade data, FOMC, earnings.
- Mixed bag. No follow-through lower.
What Happened: U.S. stock index futures auctioned sideways to higher ahead of some key fundamental developments.
In addition to the 8:30 AM release on advance trade in goods, as well as key earnings from heavily-weighted index constituents like Facebook Inc (NASDAQ: FB), participants will look to also price in the 2:00 PM ET Federal Open Market Committee (FOMC) announcement and Fed Chair Jerome Powell’s press conference.
As stated in the Weekly Brief, the U.S. is in a different place from the rest of the world and is likely to eliminate its output gap this year which would call for a tightening in policy and dollar strengthening, helping douse inflation.
Moody’s strategists note: “The impressive growth in value across many asset classes is projected to taper off within the next couple of years as supportive policy is unwound. The 10-year Treasury yield will rise above 2% by 2022 and the fiscal tailwinds will also have faded by then.”
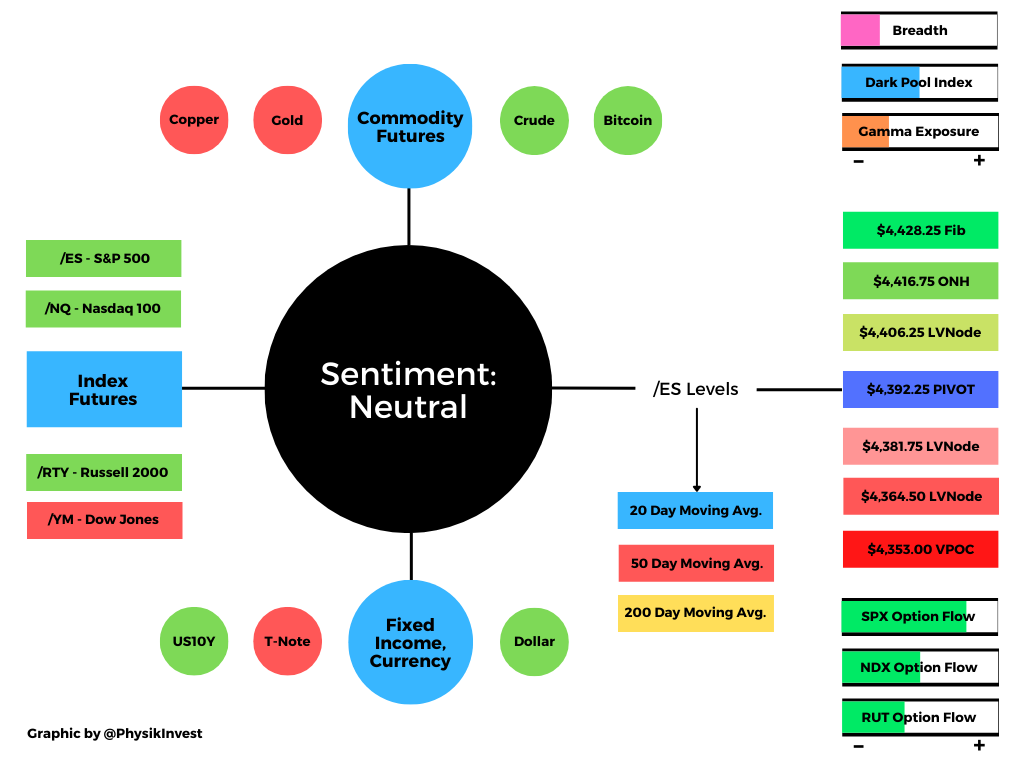
What To Expect: As of 7:00 AM ET, Wednesday’s regular session (9:30 AM – 4:00 PM EST) in the S&P 500 will likely open inside of prior-range and -value, suggesting a limited potential for immediate directional opportunity.
Adding, during Tuesday’s volatile trade, the best case outcome occurred, evidenced by the S&P 500’s trade above a developing Volume Weighted Average Price (VWAP) pinch. This suggests the average buyer since the overnight high – $4,416.76 ONH – is in a winning position.
Overnight Rally Highs (Lows): Typically, there is a low historical probability associated with overnight rally-highs (lows) ending the upside (downside) discovery process.
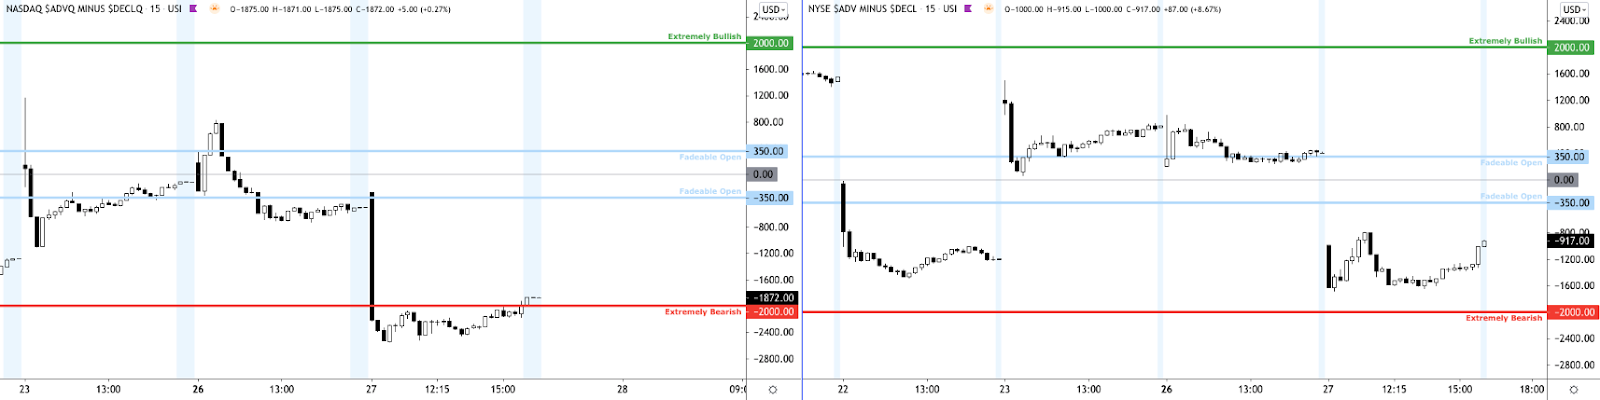
Moving on, it’s important to take note of some topline and internal divergences.
After establishing the new ONH, weakness in China spilled over; U.S. equity index futures, led by the Russell 2000 and Nasdaq 100 sold fast and heavy up until the Nasdaq 100 found responsive buyers at a key technical level – the 20-day simple moving average – that corresponded with a thick base of resting liquidity. After, the entire market reversed and closed in range.
In terms of internal divergences, breadth was significantly weaker on the Nasdaq side.
Given the technical context, for today, participants can trade from the following frameworks.
In the best case, the S&P 500 trades sideways or higher; activity above the $4,392.25 high volume area (HVNode) pivot likely puts in play the $4,406.25 low volume area (LVNode). Trade beyond the LVNode could reach as high as the $4,416.75 ONH and $4,428.25 Fibonacci extension.
In the worst case, the S&P 500 trades lower; activity below the $4,392.25 HVNode pivot likely puts in play the $4,381.75 LVNode. Trade beyond the $4,381.75 figure could reach as low as the $4,364.50 LVNode and $4,353.00 untested Point of Control (VPOC).
Volume Areas: A structurally sound market will build on past areas of high volume. Should the market trend for long periods of time, it will lack sound structure (identified as a low volume area which denotes directional conviction and ought to offer support on any test).

If participants were to auction and find acceptance into areas of prior low volume, then future discovery ought to be volatile and quick as participants look to areas of high volume for favorable entry or exit.

POCs: POCs are valuable as they denote areas where two-sided trade was most prevalent. Participants will respond to future tests of value as they offer favorable entry and exit.

News And Analysis
The COVID trauma has changed economics forever.
Credit Suisse probe is showing due diligence failings.
Spiraling debt crisis confronts Evergrande billionaire.
American job market optimism reached 21-year high.
What People Are Saying
About
After years of self-education, strategy development, and trial-and-error, Renato Leonard Capelj began trading full-time and founded Physik Invest to detail his methods, research, and performance in the markets. Additionally, Capelj is a finance and technology reporter. Some of his biggest works include interviews with leaders such as John Chambers, founder and CEO, JC2 Ventures, Kevin O’Leary, businessman and Shark Tank host, Catherine Wood, CEO and CIO, ARK Invest, among others.
Disclaimer
At this time, Physik Invest does not manage outside capital and is not licensed. In no way should the materials herein be construed as advice. Derivatives carry a substantial risk of loss. All content is for informational purposes only.