Equity index futures diverge, trading sideways to lower with commodities.
Themes: COVID-19, taper, infrastructure.
Ahead: JOLTS, Fed speak, and earnings.
Indices negate breakout and trade lower.
What Happened: U.S. stock index futures auctioned sideways to lower alongside talk of infrastructure and taper, as well as a resurgence in the COVID-19 coronavirus.
Adding, in research put out by Nordea, Andreas Steno Larsen said: “Powell hinted that the Fed has already reached one out of two targets and that full employment and inflation ‘moderately exceeding the 2% target’ are not prerequisites for a taper decision.”
Moreover, ahead is data on job openings, earnings, and Fed speak.
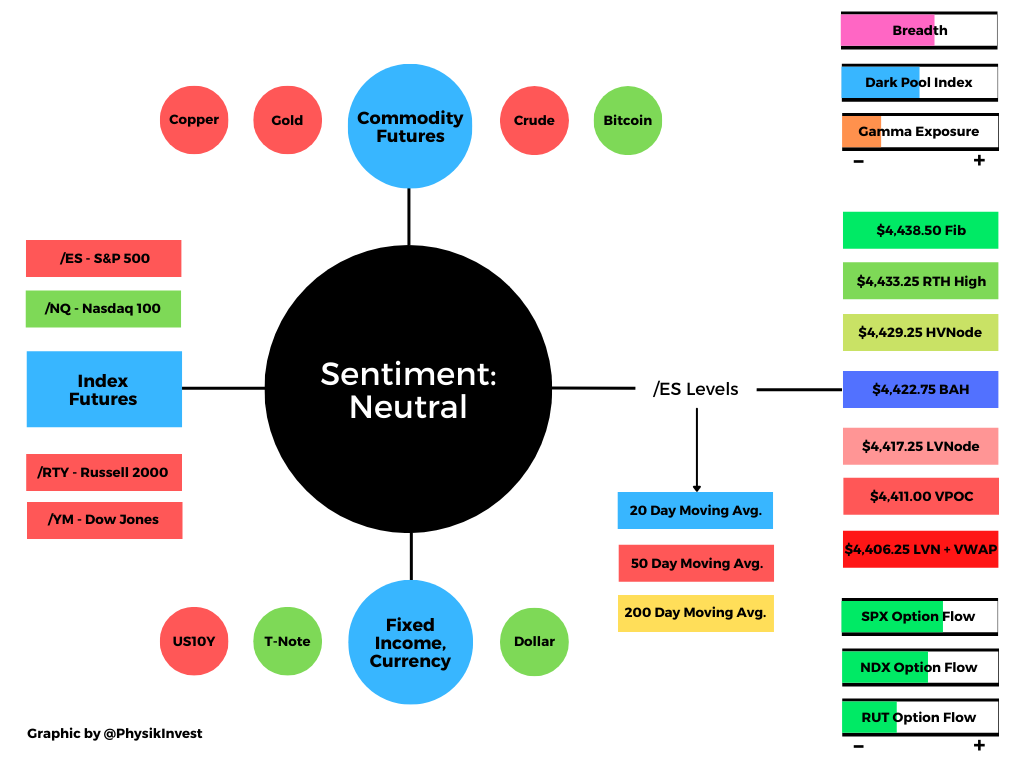
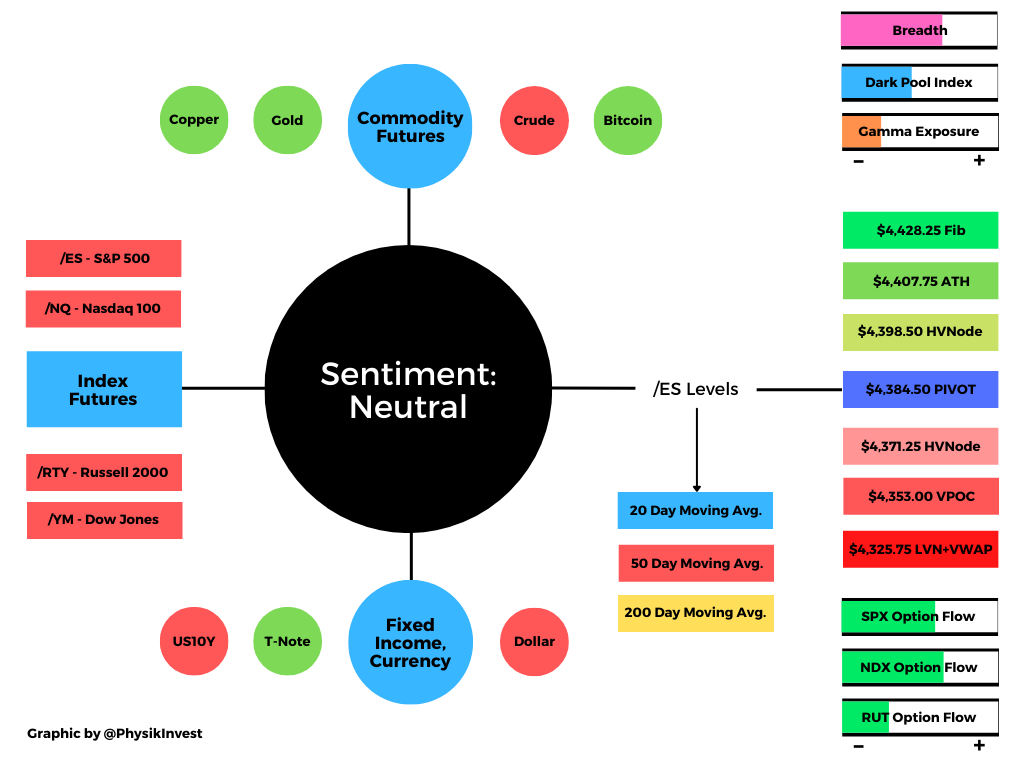
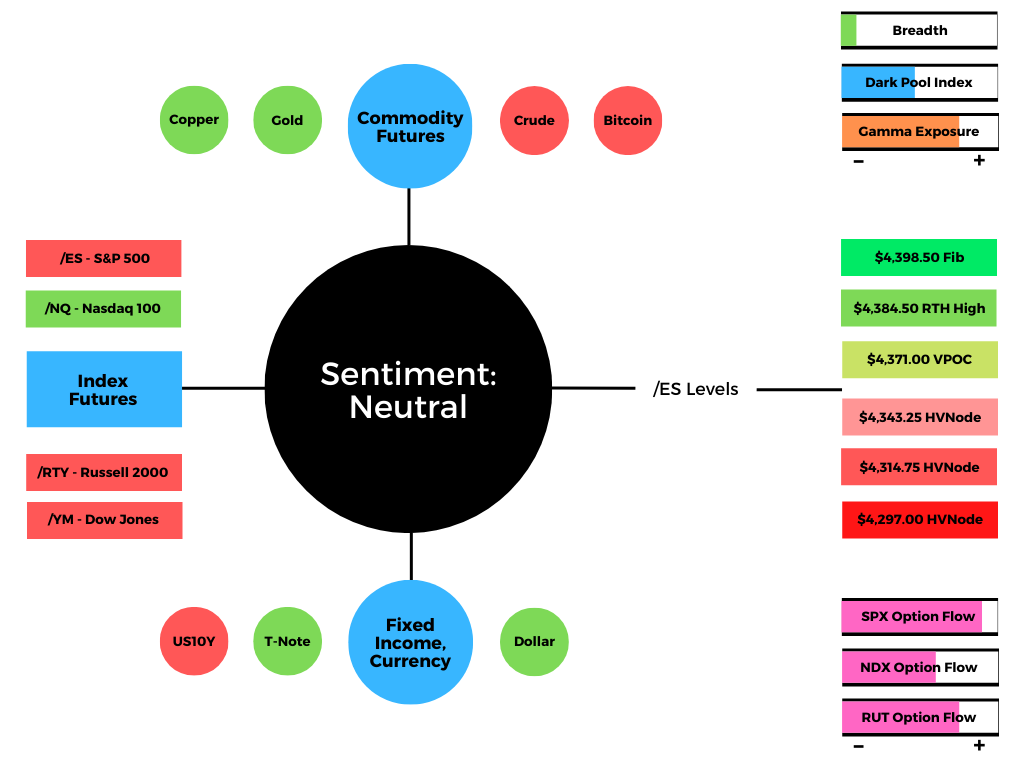
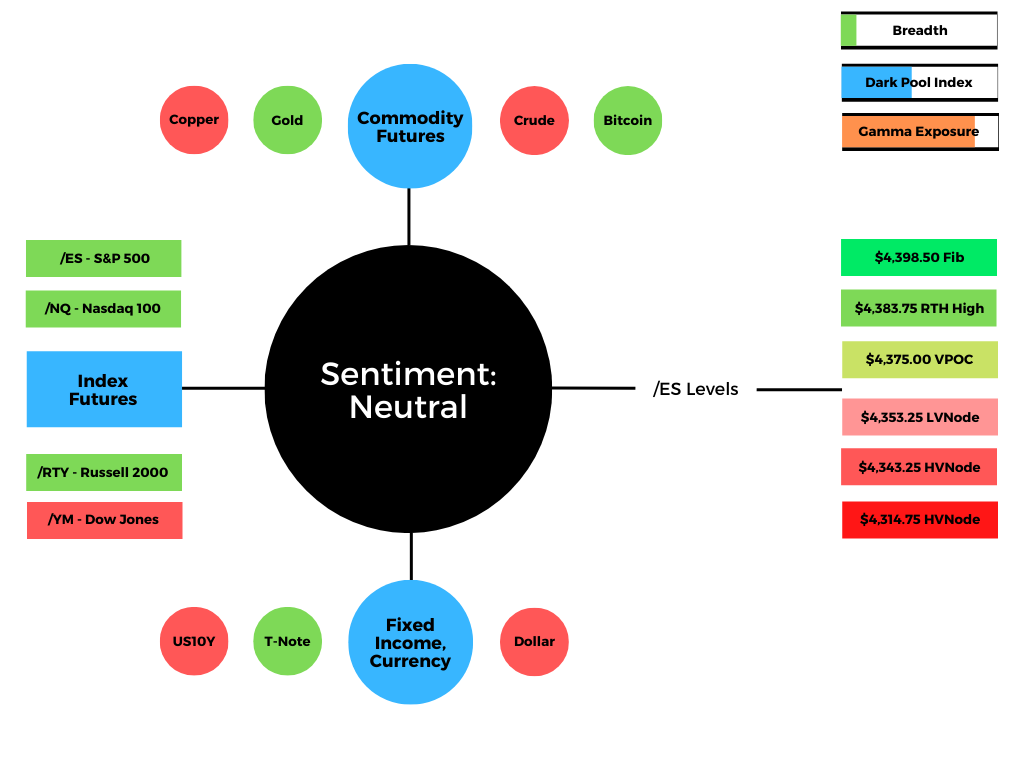
Graphic updated 6:30 AM ET. Sentiment Neutral if expected /ES open is inside of the prior day’s range. See here for more on the Dark Pool Index and Gamma. A positive Dark Pool Index reading is bullish. At the same time, the higher (lower) the gamma, the less (more) volatility. SHIFT Search data used for options activity. Note that options flow is sorted by the call premium spent; if green and more (less) positive then more (less) was spent on call options. Breadth reflects a reading of the prior day’s Advance/Decline indicator.
What To Expect: As of 6:30 AM ET, Monday’s regular session (9:30 AM – 4:00 PM EST) in the S&P 500 will likely open on a small gap just below prior-range and -value, suggesting a potential for immediate directional opportunity.
Gap Scenarios: Gaps ought to fill quickly. Should they not, that’s a signal of strength; do not fade. Leaving value behind on a gap-fill or failing to fill a gap (i.e., remaining outside of the prior session’s range) is a go-with indicator.

Auctioning and spending at least 1-hour of trade back in the prior range suggests a lack of conviction; in such a case, do not follow the direction of the most recent initiative activity.
Adding, during the prior day’s regular trade, the best case outcome occurred – a balance area breakout – evidenced by trade above the $4,422.75 balance area high (BAH). This is significant because it marked a shift in tone (i.e., a transition from two-time frame trade, or balance, to one-time frame trade, or trend).
In such a case, the modus operandi shifts from responsive trade (i.e., fade the edges) to initiative trade (i.e., play the break).
A failure to expand range in the indexes – as evidenced by Friday’s lackluster breakout and early trade Monday – portends a rotation back toward the lower end of the balance, which corresponds with the $4,365.25 low volume area (LVNode) in the S&P 500 Future.
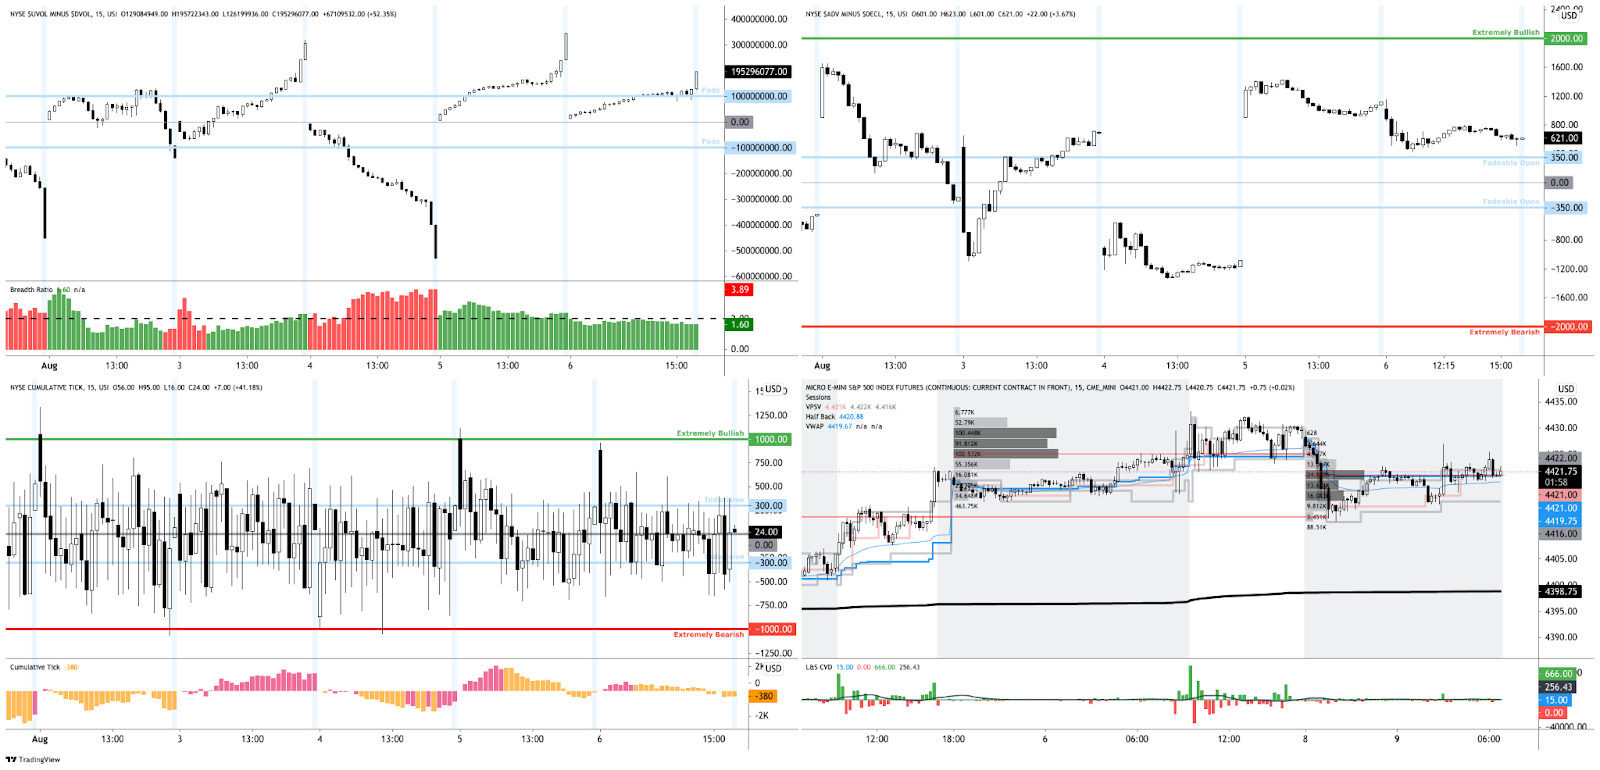
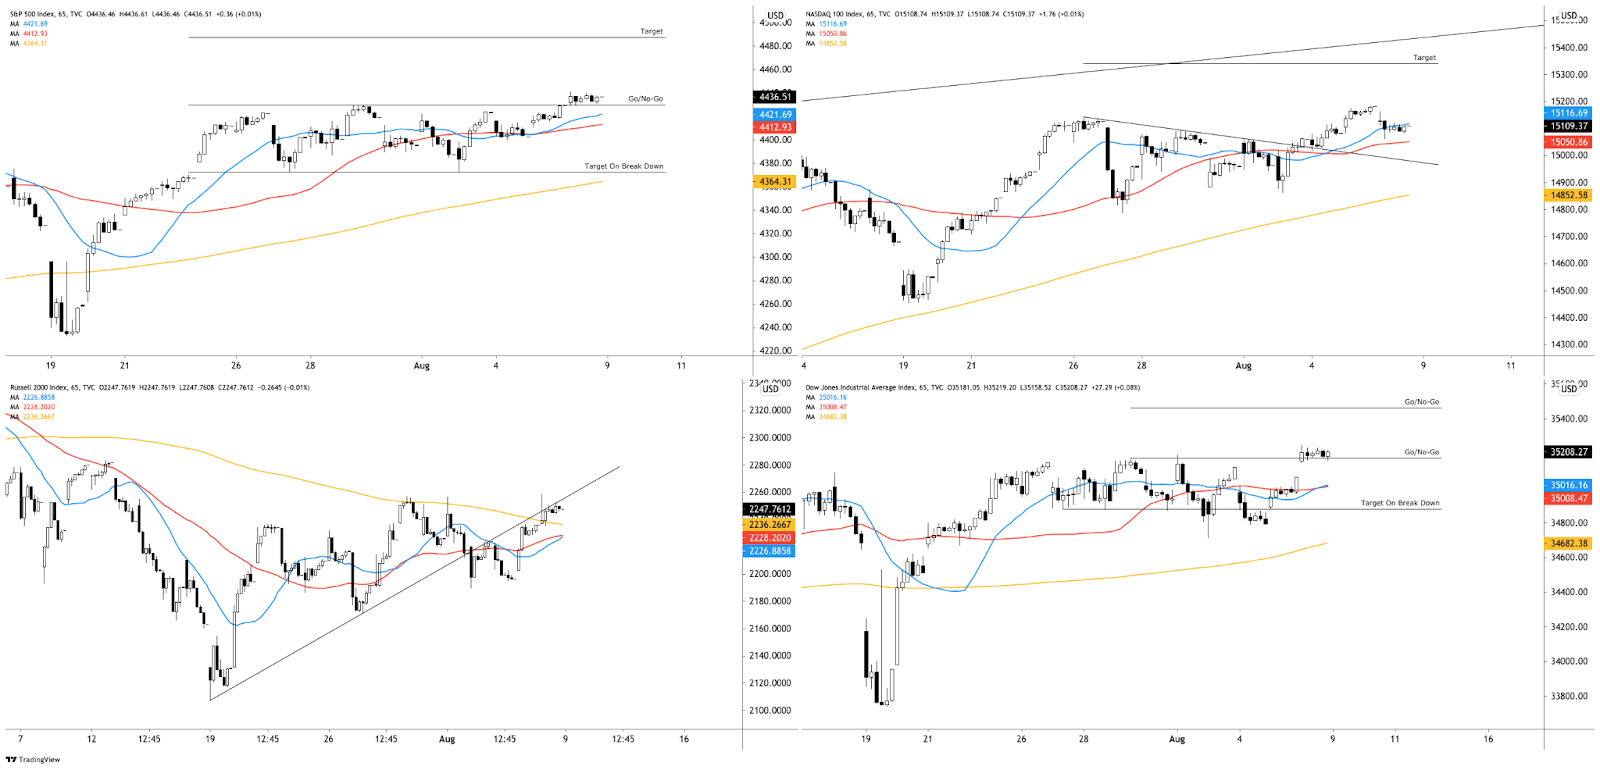
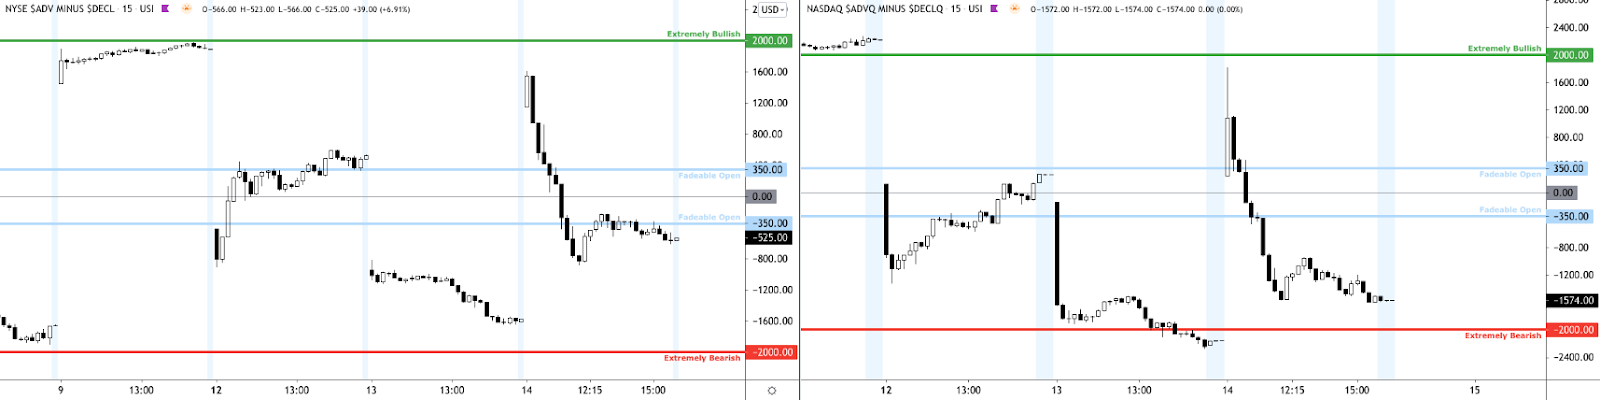
Graphic: Market Internals (Advance/Decline, Up-Volume/Down-Volume, Tick) displayed as Peter Reznicek at ShadowTrader teaches.Graphic: 65-minute candlestick charts of the cash-settled S&P 500 (INDEX: SPX), Nasdaq 100 (INDEX: NDX), Russell 2000 (INDEX: RUT), and Dow Jones Industrial Average (INDEX: DJI).
For today, participants can trade from the following frameworks.
In the best case, the S&P 500 trades sideways or higher; activity above the $4,422.75 BAH puts in play the $4,429.25 high volume area (HVNode). Initiative trade beyond the HVNode could reach as high as the $4,433.25 regular trade high (RTH High) and $4,438.50 fibonacci-derived price target.
In the worst case, the S&P 500 trades lower; activity below the $4,422.75 BAH puts in play the $4,417.25 low volume area (LVNode). Initiative trade beyond the LVNode could reach as low as the $4,411.00 untested point of control (VPOC) and $4,406.25 LVNode.
To note, the $4,406.25 level corresponds with a key anchored volume-weighted average price (VWAP), a metric highly regarded by chief investment officers, among other participants, for quality of trade. Additionally, liquidity algorithms are benchmarked and programmed to buy and sell around VWAPs.
Volume Areas: A structurally sound market will build on past areas of high volume. Should the market trend for long periods of time, it will lack sound structure (identified as a low volume area which denotes directional conviction and ought to offer support on any test).

If participants were to auction and find acceptance into areas of prior low volume, then future discovery ought to be volatile and quick as participants look to areas of high volume for favorable entry or exit.

POCs: POCs are valuable as they denote areas where two-sided trade was most prevalent. Participants will respond to future tests of value as they offer favorable entry and exit.
Graphic: 65-minute profile chart of the Micro E-mini S&P 500 Futures. Graphic updated 6:38 AM ET.
News And Analysis
Moody’s Weekly Market Outlook: Jobs and talk of tapering plans.
Oil tumbles to three-week low as virus spread menaces outlook.
Why it is too early to celebrate the blockbuster July jobs report.
The key lessons for traders from fund managers with Ken Katzen.
The financial fragility of U.S. households and businesses hit low.
A large loosening of consumer underwriting standards continues.
U.S. labor market job loss mismatch could persist through 2022.
China’s semiconductor self-reliance is posing overcapacity risks.
The technology upside from the COVID-19 coronavirus pandemic.
Homeowners have a tough time finding themselves underwater.
VC tear continues with $61B invested and 53 new unicorns born.
What People Are Saying
At 40, Jim Simons left a famed math career to launch the most successful hedge fund ever: Renaissance Tech.
Even though it only won 51% of trades, the fund made 66%/yr for 30yrs (Simons worth = $25B). It's a story of genius, but also of how hard it is to beat markets.
I know this is old 🎩 to most of my followers @ this point… but 99% of the traditional asset management world still doesn’t understand or pay attention to Volatility as an asset class…Blows my 🧠. If you’re not paying attention to Vol flows, you’re ignoring >50% of the 🥧… pic.twitter.com/4BDILoxxrf
We're going to be keeping an eye on the $SPY Market Pressure Accumulator. Seeing this much of a decline in demand at a market high is important and if it continues, will mark an important point in time and price. pic.twitter.com/Xj2rwgfmHM
One of my mentors beat this into me. "Traders are not born with the patience gene. It's learned the hard way. This is a game of the patient taking money from the impatient."
After years of self-education, strategy development, and trial-and-error, Renato Leonard Capelj began trading full-time and founded Physik Invest to detail his methods, research, and performance in the markets.
Additionally, Capelj is a finance and technology reporter. Some of his biggest works include interviews with leaders such as John Chambers, founder and CEO, JC2 Ventures, Kevin O’Leary, businessman and Shark Tank host, Catherine Wood, CEO and CIO, ARK Invest, among others.
Disclaimer
At this time, Physik Invest does not manage outside capital and is not licensed. In no way should the materials herein be construed as advice. Derivatives carry a substantial risk of loss. All content is for informational purposes only.
Editor’s Note: On Thursday (8/5) and Friday (8/6) there will be no Daily Brief newsletter. Additionally, there will be no Weekly Brief Sunday (8/8), either. All commentaries to resume August 9, 2021.
Market Commentary
Equity index futures trade higher ahead of key fundamental events.
Worry dwindles and volatility ebbs.
Ahead: Data on jobs and services.
A mixed bag. Positioned for higher.
What Happened: U.S. stock index futures auctioned higher and sideways as participants discounted drivers like the COVID-19 coronavirus and China clampdown.
At the same time, earnings are robust and stimulus remains in play; “Aside from the healthy earnings outlook, we also see equities being supported by continued monetary stimulus from the Federal Reserve and the attractiveness of stocks relative to low bond yields,” said Mark Haefele of UBS Group AG (NYSE: UBS). “Cyclicals are expected to benefit from the shift in consumer spending away from pandemic winners such as mega-cap tech.”
Ahead is data on ADP employment, Markit services PMI, and the ISM services index.
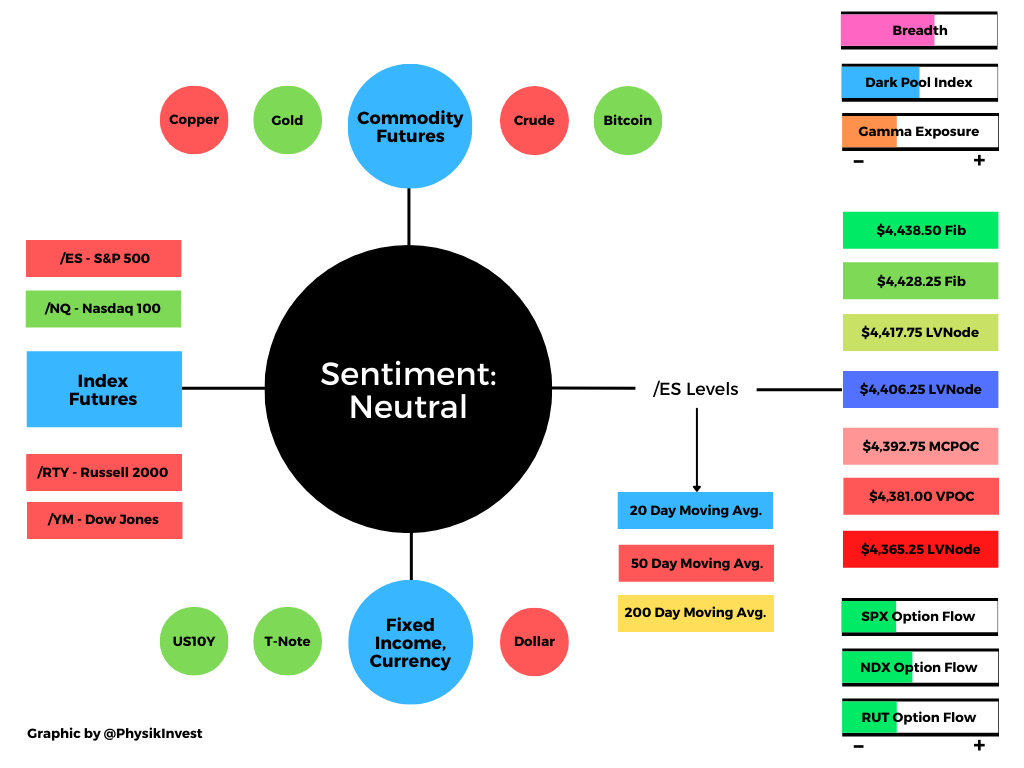
Graphic updated 6:30 AM ET. Sentiment Neutral if expected /ES open is inside of the prior day’s range. See here for more on the Dark Pool Index and Gamma. A positive Dark Pool Index reading is bullish. At the same time, the higher (lower) the gamma, the less (more) volatility. SHIFT Search data used for options activity. Note that options flow is sorted by the call premium spent; if green and more (less) positive then more (less) was spent on call options. Breadth reflects a reading of the prior day’s Advance/Decline indicator.
What To Expect: As of 6:30 AM ET, Wednesday’s regular session (9:30 AM – 4:00 PM EST) in the S&P 500 will likely open just inside of prior-range and -value, suggesting a limited potential for immediate directional opportunity.
Adding, during the prior day’s regular trade, the best case outcome occurred after a repair of the $4,370.50 minimal excess low; after testing the low (a level which corresponded with a volume-weighted average price or VWAP anchored from the July 19 swing low), responsive buyers initiated a rally that pushed prices to a higher close, away from value.
Excess: A proper end to price discovery; the market travels too far while advertising prices. Responsive, other-timeframe (OTF) participants aggressively enter the market, leaving tails or gaps which denote unfair prices.

More On Volume-Weighted Average Prices (VWAPs): A metric highly regarded by chief investment officers, among other participants, for quality of trade. Additionally, liquidity algorithms are benchmarked and programmed to buy and sell around VWAPs.
In doing so, participants negated all of Monday’s selling which, as stated Tuesday, was not supported by value or strong metrics with respect to breadth and market liquidity.
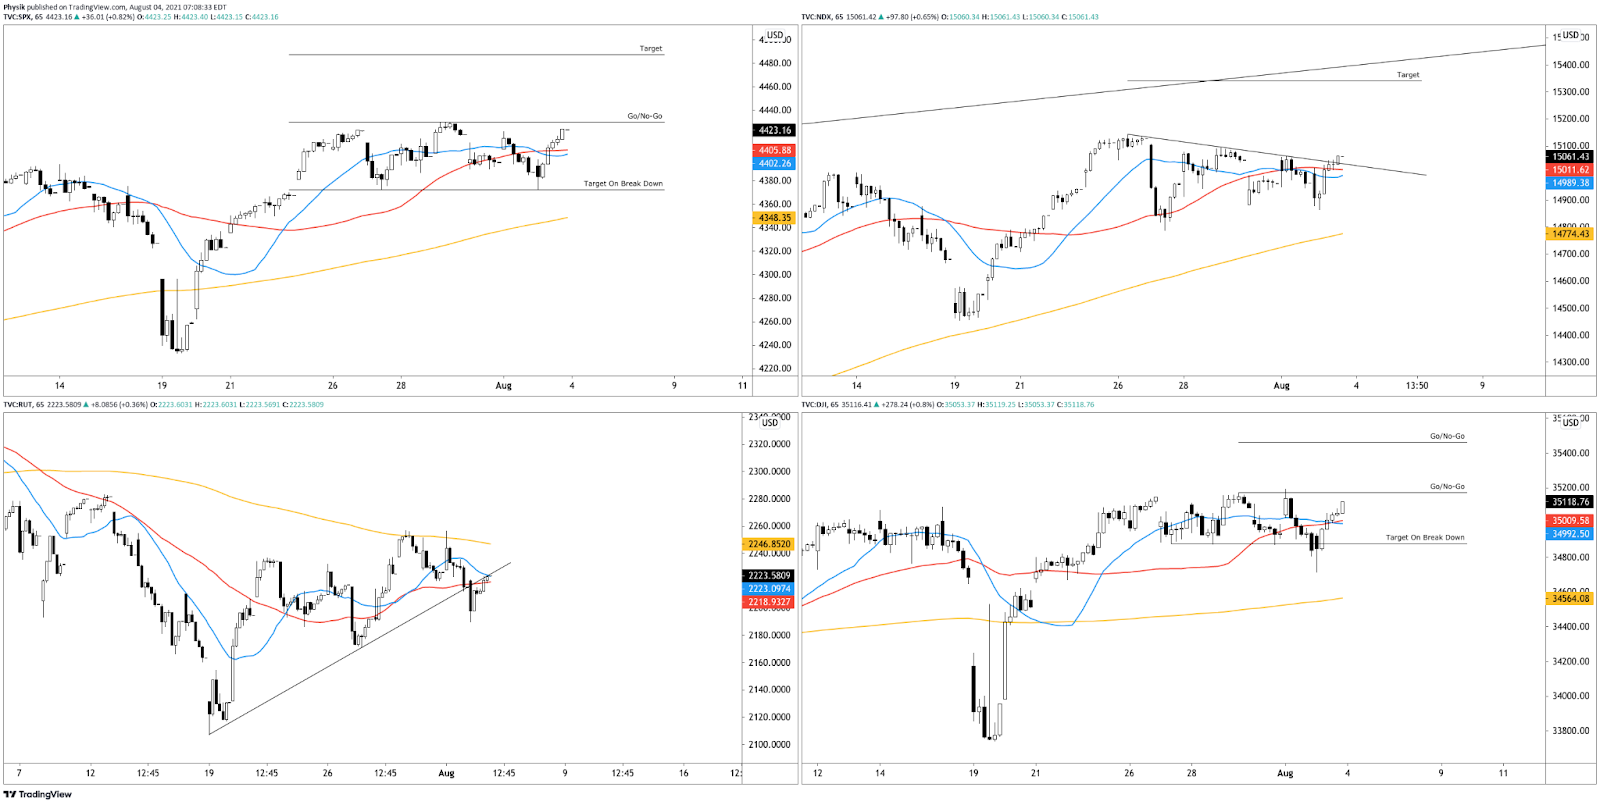
Coming into today’s session, opportunity resides in the S&P 500, Nasdaq 100, and Dow Jones Industrial Average; indices are trading at key go/no-go levels.
Further up movement puts in play balance-area breakouts. In such a case, the modus operandi shifts from responsive trade (i.e., fade the edges) to initiative trade (i.e., play the break). Failure to expand range portends a rotation back into balance.
Balance (Two-Timeframe Or Bracket): Rotational trade that denotes current prices offer favorable entry and exit. Balance-areas make it easy to spot a change in the market (i.e., the transition from two-time frame trade, or balance, to one-time frame trade, or trend).
Below are some rough levels to base expectations around. The width of the balance area, projected off the high end of the balance, is the typical target in such a breakout (e.g., $4,490 SPX cash).
Graphic: 65-minute candlestick charts of the cash-settled S&P 500 (INDEX: SPX), Nasdaq 100 (INDEX: NDX), Russell 2000 (INDEX: RUT), and Dow Jones Industrial Average (INDEX: DJI).
Moreover, for today, participants can trade from the following frameworks.
In the best case, the S&P 500 trades sideways or higher; activity above the $4,406.25 low volume area (LVNode) pivot puts in play the $4,417.75 LVNode. Initiative trade beyond the $4,417.75 LVNode could reach as high as the $4,428.25 and $4,438.50 Fibonacci price extensions.
In the worst case, the S&P 500 trades lower; activity below the $4,406.25 LVNode puts in play the $4,392.75 micro-composite point of control (MCPOC). Initiative trade beyond the MCPOC could reach as low as the $4,381.75 untested point of control (VPOC) and $4,365.25 LVNode.
Volume Areas: A structurally sound market will build on past areas of high volume. Should the market trend for long periods of time, it will lack sound structure (identified as a low volume area which denotes directional conviction and ought to offer support on any test).

If participants were to auction and find acceptance into areas of prior low volume, then future discovery ought to be volatile and quick as participants look to areas of high volume for favorable entry or exit.

POCs: POCs are valuable as they denote areas where two-sided trade was most prevalent. Participants will respond to future tests of value as they offer favorable entry and exit.
Graphic: 65-minute profile chart of the Micro E-mini S&P 500 Futures. Graphic updated 6:30 AM ET.
News And Analysis
Markets primed for Powell second term at risk from surprise pick.
China typhoons create latest supply-chain threat as ports close.
Economic data positive for risk but business cycle risks building.
New York City to require proof of vaccination for indoor activities.
Asia-Pacific on track for a strong rebound although scars will last.
What People Are Saying
The $QQQ once again found buyers at the conjunction of the VWAPs anchored from the mid July high and low of the month. Today's low also tested the rising 20DMA pic.twitter.com/WCkU6lELwI
After years of self-education, strategy development, and trial-and-error, Renato Leonard Capelj began trading full-time and founded Physik Invest to detail his methods, research, and performance in the markets.
Additionally, Capelj is a finance and technology reporter. Some of his biggest works include interviews with leaders such as John Chambers, founder and CEO, JC2 Ventures, Kevin O’Leary, businessman and Shark Tank host, Catherine Wood, CEO and CIO, ARK Invest, among others.
Disclaimer
At this time, Physik Invest does not manage outside capital and is not licensed. In no way should the materials herein be construed as advice. Derivatives carry a substantial risk of loss. All content is for informational purposes only.
Editor’s Note: On Thursday (8/5) and Friday (8/6) there will be no Daily Brief newsletter. Additionally, there will be no Weekly Brief Sunday (8/8), either. All commentaries to resume August 9, 2021.
If in the Miami, Florida area please contact renato@physikinvest.com if interested in connecting over markets, fintech, and the like.
PS: Added a new “Weekly Trade Ideas” section. Hope it provides added value!
Regards,
Renato Leonard Capelj
Market Commentary
Key Takeaways: Equity index futures to start the week off neutral, in prior-range and -value.
Debt limit, China, fiscal policy cloud outlook.
Expecting a heavy week for economic data.
Responsive trade until key levels are taken.
Amazon Inc (NASDAQ: AMZN) trade ideas.
What Happened: With respect to hot topic market risks, the week prior offered a ton of information to add to our narrative. We list for clarity.
Debt Limit: The August 1 reinstatement of the U.S. debt limit may have severe consequences, increasing the odds of a rating downgrade on government debt.
Monetary: Come September, participants will likely receive increased clarity over taper timelines with an official start early next year. Adding, Chairman Jerome Powell expressed inflation as temporary and the committee announced the creation of a pair of standing facilities to strengthen its ability to be the lender of last resort in the repo market.
China: Cross-asset volatility in China worsened, prompting talk of a yuan devaluation. A devaluation is something to fear; to note, The People’s Bank of China (PBOC) roiled global equity markets after its 2015 yuan devaluation.
Growth: U.S. economic data came in weaker suggesting growth likely peaked. Notwithstanding, consumer confidence improved markedly with sentiment recovering fully. Moody’s strategists look for real GDP to rise 6.7% this year, a downward revision on some fiscal policy assumptions.
Fiscal: Lawmakers debate another round of stimulus to ensure the strong long-term growth of lower- and middle-income households. The proposed legislation is receiving pushback with respect to its impact on inflation and taxes. Moody’s strategists note “higher taxes will weigh on economic growth, but the impact on the economy from the higher proposed taxes will be small.”
Pandemic: COVID-19 variants are a cause for concern – especially with respect to the Federal Reserve’s tapering of quantitative easing – but hospitalization ratios and mobility metrics suggest the crisis is likely over. In other areas, the CDC’s rental eviction moratorium and FHFA’s foreclosure moratorium expired with forbearance on government-backed mortgages and student loans ending September, also.
Yields: Technical factors – issuance, short coverings, a fading reflation trade, and peak growth – are to blame for lower Treasury yields. A longer-term deviation from the implied “economic fair value” of 1.6% and 1.65% for the 10-year yield would suggest other forces are driving long-term interest rates.
Earnings: Year-over-year profit growth of S&P 500 constituents stands at 85% with 88% of companies beating estimates for revenue and profit, according to Business Insider.
Positioning: According to one Bank of America Corporation (NYSE: BAC) comment, highlighted by The Market Ear, “The average recovery time following 2-sigma one-day S&P declines has shortened significantly post-GFC, reaching an all-time low this year.” This has a lot to do with the inventory positioning of participants; volatility is oversupplied and associated heading forces make it so there is more liquidity and less movement. Should the market unpin, there’s “not enough liquidity” to absorb leverage on the tails.
Putting it all together, Goldman Sachs Group Inc (NYSE: GS) believes “[e]xpectations of higher interest rates and higher corporate tax rates by year-end are the primary reasons [to] forecast that the S&P 500 will trade sideways,” into end-of-year.
What To Expect: The S&P 500, Nasdaq 100, and Dow Jones Industrial Average are above their key 20-, 50-, and 200-week moving averages while the Russell 2000 is stuck inside a multi-month trading range, between its 20- and 50-week moving averages.
Given the higher long-term trend, traders of the S&P 500, in particular, must contend with a week-long balance area, the result of participants finding higher prices valuable as they position themselves for a directional move, given increased clarity on earnings, taper, and more.
Balance (Two-Timeframe Or Bracket): Rotational trade that denotes current prices offer favorable entry and exit. Balance-areas make it easy to spot a change in the market (i.e., the transition from two-time frame trade, or balance, to one-time frame trade, or trend).
In the coming sessions, given that the modus operandi is responsive trade (i.e., fade the edges), rather than initiative trade (i.e., play the break), participants will want to focus their attention on where the S&P 500 trades in relation to the $4,392.25 high volume area (HVNode) pivot.
In the best case, the S&P 500 trades sideways or higher; activity above the $4,392.25 HVNode pivot puts in play the $4,406.25 low volume area (LVNode) and $4,419.00 untested point of control (VPOC). Initiative trade beyond the VPOC portends a potential breakout above the $4,422.75 minimal excess high, up to the $4,428.25 Fibonacci extension.
In the worst case, the S&P 500 trades lower; activity below the $4,392.25 HVNode pivot puts in play the $4,381.75 LVNode. Initiative trade beyond the LVNode portends a potential breakdown below the $4,370.50 minimal excess low, down to the $4,353.00 VPOC and $4,341.75 micro-composite point of control (MCPOC).
Volume Areas: A structurally sound market will build on past areas of high volume. Should the market trend for long periods of time, it will lack sound structure (identified as a low volume area which denotes directional conviction and ought to offer support on any test).

If participants were to auction and find acceptance into areas of prior low volume, then future discovery ought to be volatile and quick as participants look to areas of high volume for favorable entry or exit.

POCs: POCs are valuable as they denote areas where two-sided trade was most prevalent. Participants will respond to future tests of value as they offer favorable entry and exit.

Excess: A proper end to price discovery; the market travels too far while advertising prices. Responsive, other-timeframe (OTF) participants aggressively enter the market, leaving tails or gaps which denote unfair prices.
Graphic: 65-minute profile chart of the Micro E-mini S&P 500 Futures. Note the blue anchored Volume Weighted Average Price (VWAP) which suggests the average buyer, since FOMC, is underwater. To note, VWAP is a metric highly regarded by chief investment officers, among other participants, for quality of trade. Additionally, liquidity algorithms are benchmarked and programmed to buy and sell around VWAPs.
Weekly Trade Idea
Please Note: In no way is the below a trade recommendation. It is a peek into the thought process here at Physik Invest. To cover my butt, so to speak, I say DO NOT take this trade. Also, if you would like to see this section included in future commentaries, email me at renato@physikinvest.comwith the subject line “Please Include Weekly Trade Ideas”.
Options offer an efficient way to gain directional exposure.
If an option buyer was short (long) stock, he or she could buy a call (put) to hedge upside (downside) exposure. Additionally, one can spread, or buy (+) and sell (-) options together, strategically.
Commonly discussed spreads include credit, debit, ratio, back, and calendar.
Credit: Sell -1 option closer to the money. Buy +1 option farther out of the money.
Debit: Buy +1 option closer to the money. Sell -1 option farther out of the money.
Ratio: Buy +1 option closer to the money. Sell -2 options farther out of the money.
Back: Sell -1 option closer to the money. Buy +2 options farther out of the money.
Calendar: Sell -1 option. Buy +1 option farther out in time, at the same strike.
Typically, if bullish (bearish), sell at-the-money put (call) credit spread and/or buy a call (put) debit/ratio spread structured around target price. Alternatively, if the expected directional move is great (small), opt for a back spread (calendar spread). Also, if credit spread, capture 50-75% of the premium collected. If debit spread, capture 2-300% of the premium paid.
Be cognizant of risk exposure to direction (delta), time (theta), and volatility (vega).
Negative (positive) delta = synthetic short (long).
Negative (positive) theta = time decay hurts (helps).
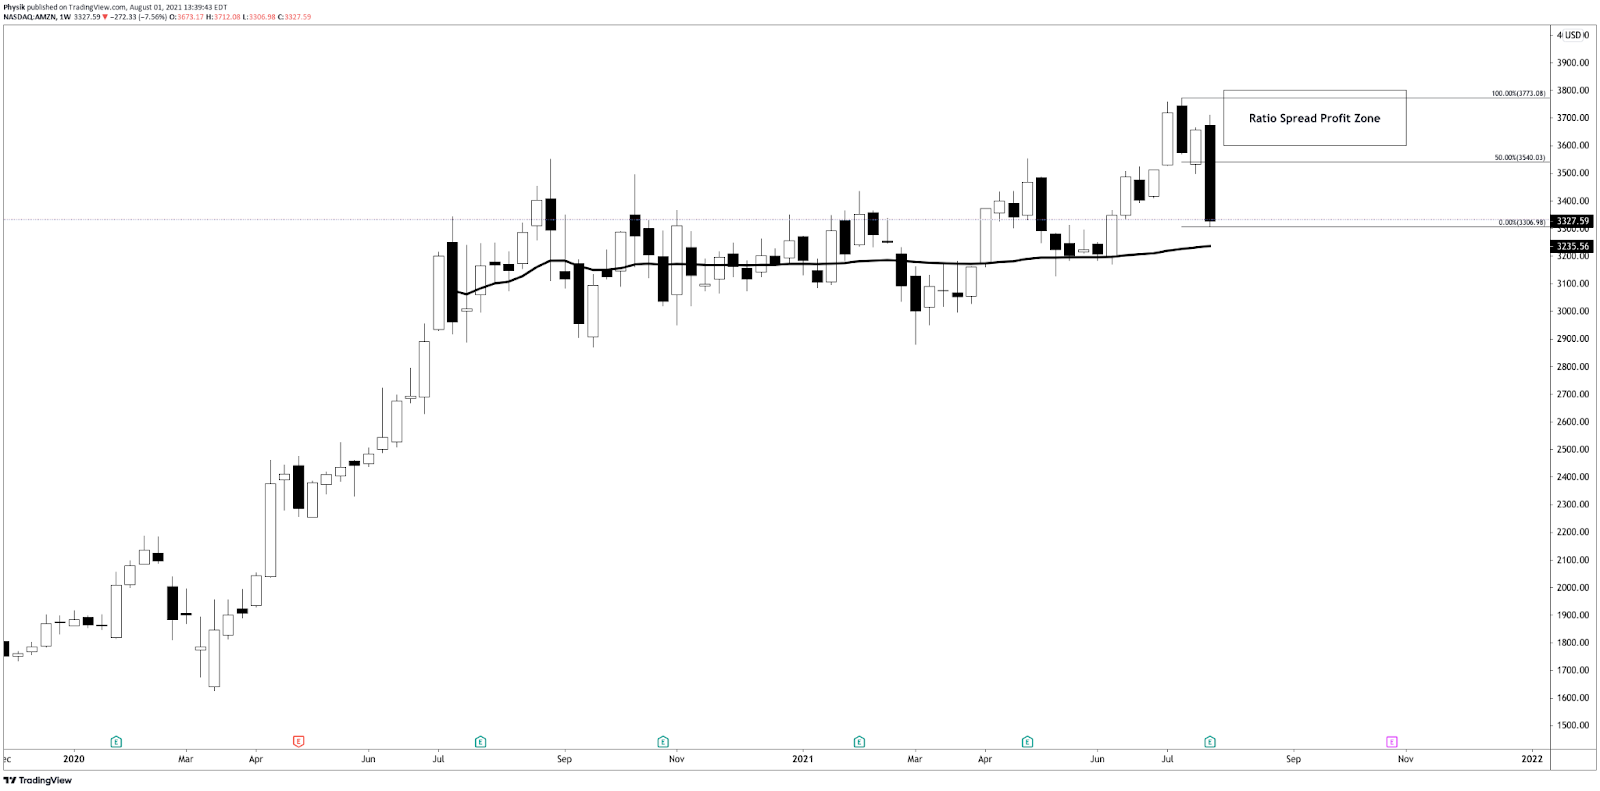
I’m bullish on Amazon and I think the stock may climb over the next week, toward $3,600. I will structure a spread above the current stock price, expiring in 1 week. I will buy the 3600 call option once (+1) and sell the 3700 call option twice (-2) for a $0.50 credit. Should the stock not move to my target, I keep the $50 credit. Should it move to $3,700, I could make $10,050.00 at expiry. Should the stock move past $3,850.00, I may incur unlimited losses. My goal, with this spread, is to capture the initial credit and close for additional credit if the stock moves higher.
If necessary, I will hedge the position by either (A) buying long stock, (B) widening strikes, (C) buying a far out-of-the-money call option to cap upside in case of an unpredictable move higher, or (D) roll strikes up in price and out in time.
What People Are Saying
In my opinion, the biggest tell for the sentiment of belief in the "Fed put" comes directly from CDS spreads.
— Christian Fromhertz 🇺🇸 (@cfromhertz) July 30, 2021
New blog on the Employment Cost Index (ECI) w/ Willie Powell. A summary🧵. TL;DR: NOMINAL compensation has steadily increased even w/ high unemp (consistent with a tightish labor market). But those gains have been eroded by inflation so REAL comp is down. https://t.co/0BSlcsJnnc
After years of self-education, strategy development, and trial-and-error, Renato Leonard Capelj began trading full-time and founded Physik Invest to detail his methods, research, and performance in the markets.
Additionally, Capelj is a finance and technology reporter. Some of his biggest works include interviews with leaders such as John Chambers, founder, and CEO, JC2 Ventures, Kevin O’Leary, businessman and Shark Tank host, Catherine Wood, CEO and CIO, ARK Invest, among others.
Disclaimer
At this time, Physik Invest does not manage outside capital and is not licensed. In no way should the materials herein be construed as advice. Derivatives carry a substantial risk of loss. All content is for informational purposes only.
Equity index futures trade sideways to lower. Yields lead lower.
China tension, infrastructure, COVID talk.
Ahead are new home sales and earnings.
S&P plays with a potential auction failure.
What Happened: U.S. stock index futures auctioned sideways to lower overnight alongside narratives surrounding a U.S. and China stalemate, progress on infrastructure, as well as the spread of COVID-19 variants.
On COVID-19, Nordea analysts conclude: “Delta is a cause for concern around the globe, but judging from the case to hospitalization ratio, it seems as if the crisis is already mostly over. Central banks will conclude the same soon, even if the initial reaction to Delta is clearly dovish.”
Moreover, ahead is data on new home sales, as well as earnings reports by Tesla Inc (NASDAQ: TSLA) and Lockheed Martin Corporation (NYSE: LMT), among other companies.
Graphic updated 6:40 AM ET. Sentiment Neutral if expected /ES open is inside of the prior day’s range. See here for more on the Dark Pool Index and Gamma. A positive Dark Pool Index reading is bullish. At the same time, the higher (lower) the gamma, the less (more) volatility. SHIFT Search data used for options activity. Note that options flow is sorted by the call premium spent; if green and more (less) positive then more (less) was spent on call options. Breadth reflects a reading of the prior day’s Advance/Decline indicator.
What To Expect: As of 6:40 AM ET, Monday’s regular session (9:30 AM – 4:00 PM EST) in the S&P 500 will likely open inside of prior-range and -value, suggesting a limited potential for immediate directional opportunity.
Adding, during Friday’s trade, the best case outcome occurred, evidenced by trade above $4,384.50, a prior all-time high (ATH) and balance-area high (BAH).
Balance (Two-Timeframe Or Bracket): Rotational trade in which current prices offer favorable entry and exit. Balance-areas make it easy to spot a change in the market (i.e., the transition from two-time frame trade, or balance, to one-time frame trade, or trend).
To note, Friday’s trade happened on positive, albeit weaker breadth. This is in comparison to Thursday’s session during which breadth, measured by the Advance/Decline indicator, was negative and not supportive of an advance in price.
A key thing to watch for is acceptance (i.e., more than 1-hour of trade) and whether an auction failure transpires.
If initiative buyers were to further expand the range, then all is well. However, in a failure to move higher, confirmed by trade below Friday’s $4,372.50 regular trade low (RTH Low), an auction failure may foreshadow a liquidation break.
Liquidation Breaks: A profile shape that suggests participants were “too” long and had poor location.
For today, participants can trade from the following frameworks.
In the best case, the S&P 500 trades sideways or higher; activity above the $4,384.50 pivot puts in play the $4,398.50 high volume area (HVNode). Initiative trade beyond the $4,398.50 HVNode could reach as high as the $4,407.75 ATH and $4,428.25 Fibonacci-derived target.
In the worst case, the S&P 500 trades lower; activity below the $4,384.50 pivot puts in play a potential auction failure confirmed by trade below the $4,372.50 RTH Low. Initiative trade beyond the RTH Low may reach as low as the $4,353.00 untested Point of Control (VPOC) and $4,325.75 LVNode.
To note, the last key level corresponds with two anchored Volume Weighted Average Price (VWAP) levels, a metric highly regarded by chief investment officers, among other participants, for quality of trade. Additionally, liquidity algorithms are benchmarked and programmed to buy and sell around VWAPs.
POCs: POCs are valuable as they denote areas where two-sided trade was most prevalent. Participants will respond to future tests of value as they offer favorable entry and exit.

Volume Areas: A structurally sound market will build on past areas of high volume. Should the market trend for long periods of time, it will lack sound structure (identified as a low volume area which denotes directional conviction and ought to offer support on any test).

If participants were to auction and find acceptance into areas of prior low volume, then future discovery ought to be volatile and quick as participants look to areas of high volume for favorable entry or exit.
Graphic: 65-minute profile chart of the Micro E-mini S&P 500 Futures. Graphic updated 6:30 AM ET.
News And Analysis
China stocks tumble in panic selling amid a broad crackdown.
U.S. infrastructure talks near finish as Senators face pressure.
U.S. real yields fell to a record low alongside growth concerns.
The COVID-19 coronavirus crisis is officially over (in the West).
U.S. home price appreciation to moderate as supply increases.
What People Are Saying
4400 BOOM OR BUST – EXHAUSTION GAP? I have identified the current market as one of the 3 riskiest short-term in my 50 years of trading. 1987/2000/Today. See important details on graphic regarding monitoring for continuation.#ES_F#futures$SPY#JimDalton$ES_Fpic.twitter.com/Ux2WXAlkh3
$BTC Update: Not out of the woods yet but seems like low volatility condition is resolving on the upside. 42.5 continues to be the hurdle. More likely we have rectangle in hand that is forming above the year-long average. pic.twitter.com/jnIFfVtKD2
After years of self-education, strategy development, and trial-and-error, Renato Leonard Capelj began trading full-time and founded Physik Invest to detail his methods, research, and performance in the markets. Additionally, Capelj is a finance and technology reporter. Some of his biggest works include interviews with leaders such as John Chambers, founder and CEO, JC2 Ventures, Kevin O’Leary, businessman and Shark Tank host, Catherine Wood, CEO and CIO, ARK Invest, among others.
Disclaimer
At this time, Physik Invest does not manage outside capital and is not licensed. In no way should the materials herein be construed as advice. Derivatives carry a substantial risk of loss. All content is for informational purposes only.
Key Takeaways: After a short sell-off, volatility ebbs as equity index futures trade higher.
Unpacking factors lending to the volatility.
Jitters ahead of Federal Reserve meeting.
Earnings outlook up. Priced to perfection?
COVID-19 resurgence to not limit mobility.
Analyzing tightening and the shift to fiscal.
What Happened: Last week’s violent trade came as inflation measures rose the largest since the Global Financial Crisis.
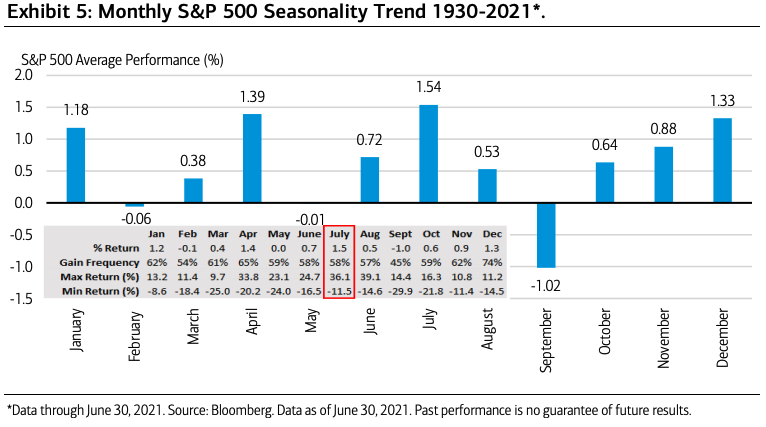
At and around the same time was a monthly options expiration (OPEX) which opened the window to fundamental dynamics (e.g., a shift in preferences from saving and investing to spending, monetary tightening, seasonality, COVID-19 resurgence) given a “reduction in large options positions, and the hedging associated with them,” according to SpotGamma, an authority in the space.
The subsequent sell-off then moved the market into short-gamma, an environment in which the opposing side of options trades hedge by buying into strength and selling into weakness, thereby exacerbating volatility.
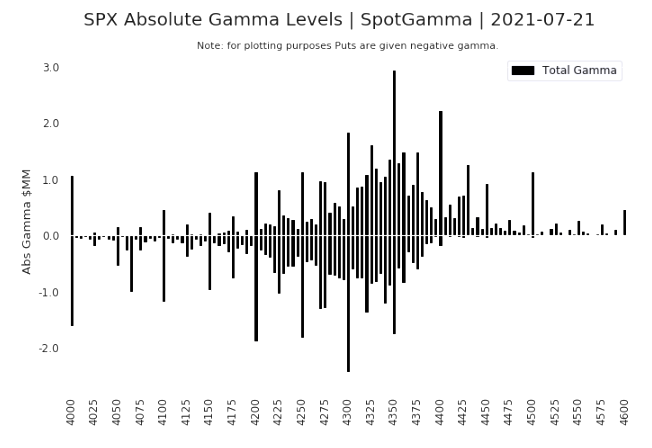
Gamma's slightly negative and currently doesn't show any real +build until ~4400. pic.twitter.com/woXk4qtaxY
To note, we’re discussing the implications of derivatives since option volumes are comparable to stock volumes and, as a result, related hedging flows can represent an increased share of volume in underlying stocks.
Further, the reversal caught many by surprise. Why? Downside risks were thought to have been compounded by equity, bond, and derivatives market positioning, among other factors.
For instance, some metrics implied froth with respect to the number of put options being sold to open, a potentially destabilizing force given associated hedging forces.
To note, put sales, which can be part of sophisticated volatility-based trading strategies, can imply confidence as market participants look to options for income, and not insurance.
Amidst the selling, though, some indicators suggested participants more so became interested in puts as downside protection.
Then, on July 19, the S&P 500 rebounded as near-term discovery reached a potential limit, based on market liquidity metrics and the inventory positioning of participants.
There could be a Part Two to today's S&P 500 gamma squeeze. We're right on the cusp of it at SPX 4330. Note the characteristic GammaVol slip 'n slide.
SpotGamma’s metrics confirmed; participants bought calls and sold puts suggesting confidence in the low.
In explaining the violent reversal and follow-through, it’s useful to point to three factors – the change in the underlying price (gamma), implied volatility (vanna), and time (charm) – known to impact an options exposure to directional risk or delta.
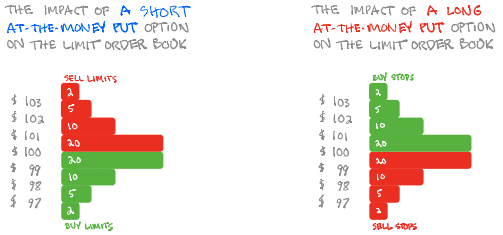
Graphic: SqueezeMetrics details the implications of customer activity in the options market, on an underlying’s order book.
In short, in selling a put, for instance, customers indirectly add liquidity and stabilize the market.
How? The market maker long the put will buy (sell) the underlying to neutralize directional risk as price falls (rises).
On the other hand, as the market reverses and continues rising, volatility compresses, and any puts that were bought quickly lose value, thereby lowering the opposing side’s directional risk.
Also, in spite of extreme fear in the face of a COVID-19 resurgence, red states, where the risks of transmission are greater given lower vaccination rates, will likely not limit mobility while blue states are more so highly vaccinated and will remain mobile, according to Bloomberg.
That brings us to the topic of monetary policy.
The U.S. is in a different place from the rest of the world and is likely to eliminate its output gap this year which would call for a tightening in policy and dollar strengthening, helping douse inflation.
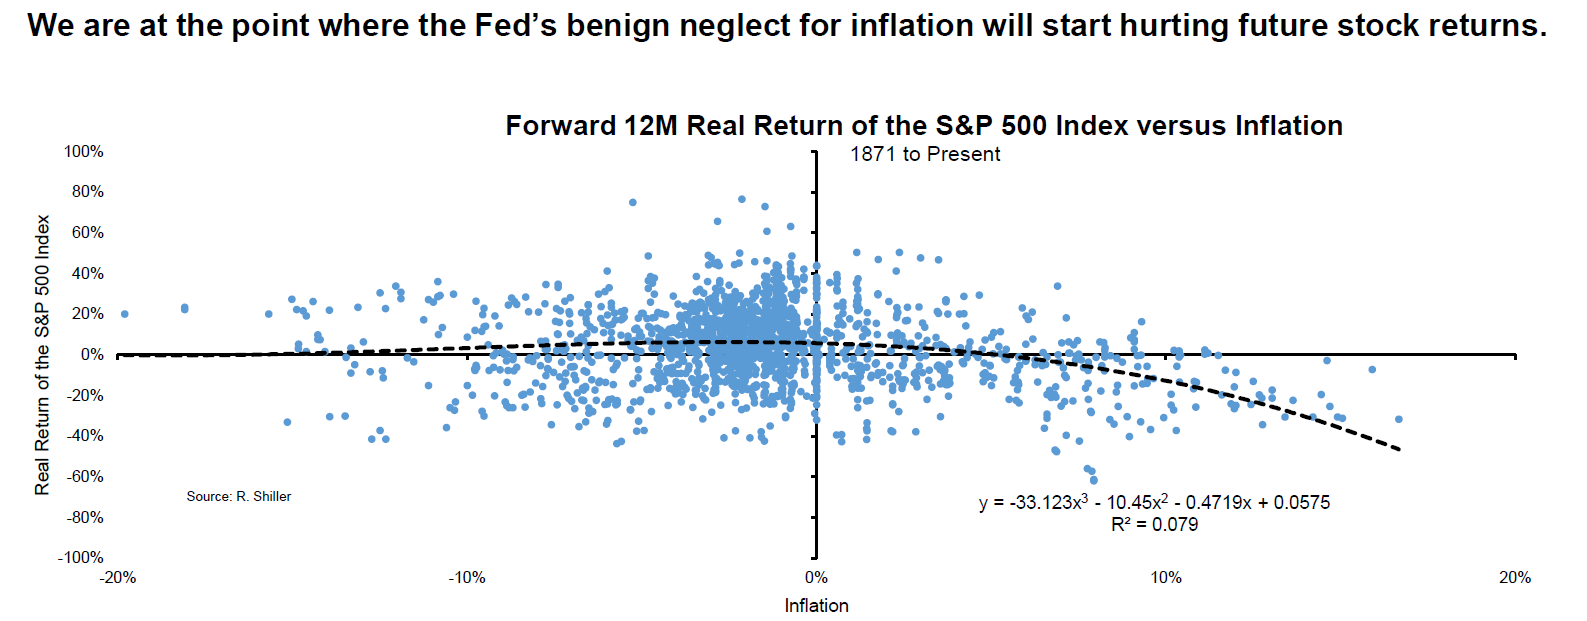
Graphic: Implications of high single-digit inflation on S&P 500 returns via Bloomberg.
On that note, Moody’s strategists comment: “The impressive growth in value across many asset classes is projected to taper off within the next couple of years as supportive policy is unwound. The 10-year Treasury yield will rise above 2% by 2022 and the fiscal tailwinds will also have faded by then.”
When liquidity is removed, as policymakers look to fiscal policy to address inequality, for instance, corporations may have to worry about making money, again.
“That’s ultimately how we grow out of these valuations,” Kai Volatility’s Cem Karsan explained to me in an article Benzinga will release next week. “These cycles are a lot shorter than the monetary supply-side cycles but they tend to be very bad for multiples and great for economic growth.”
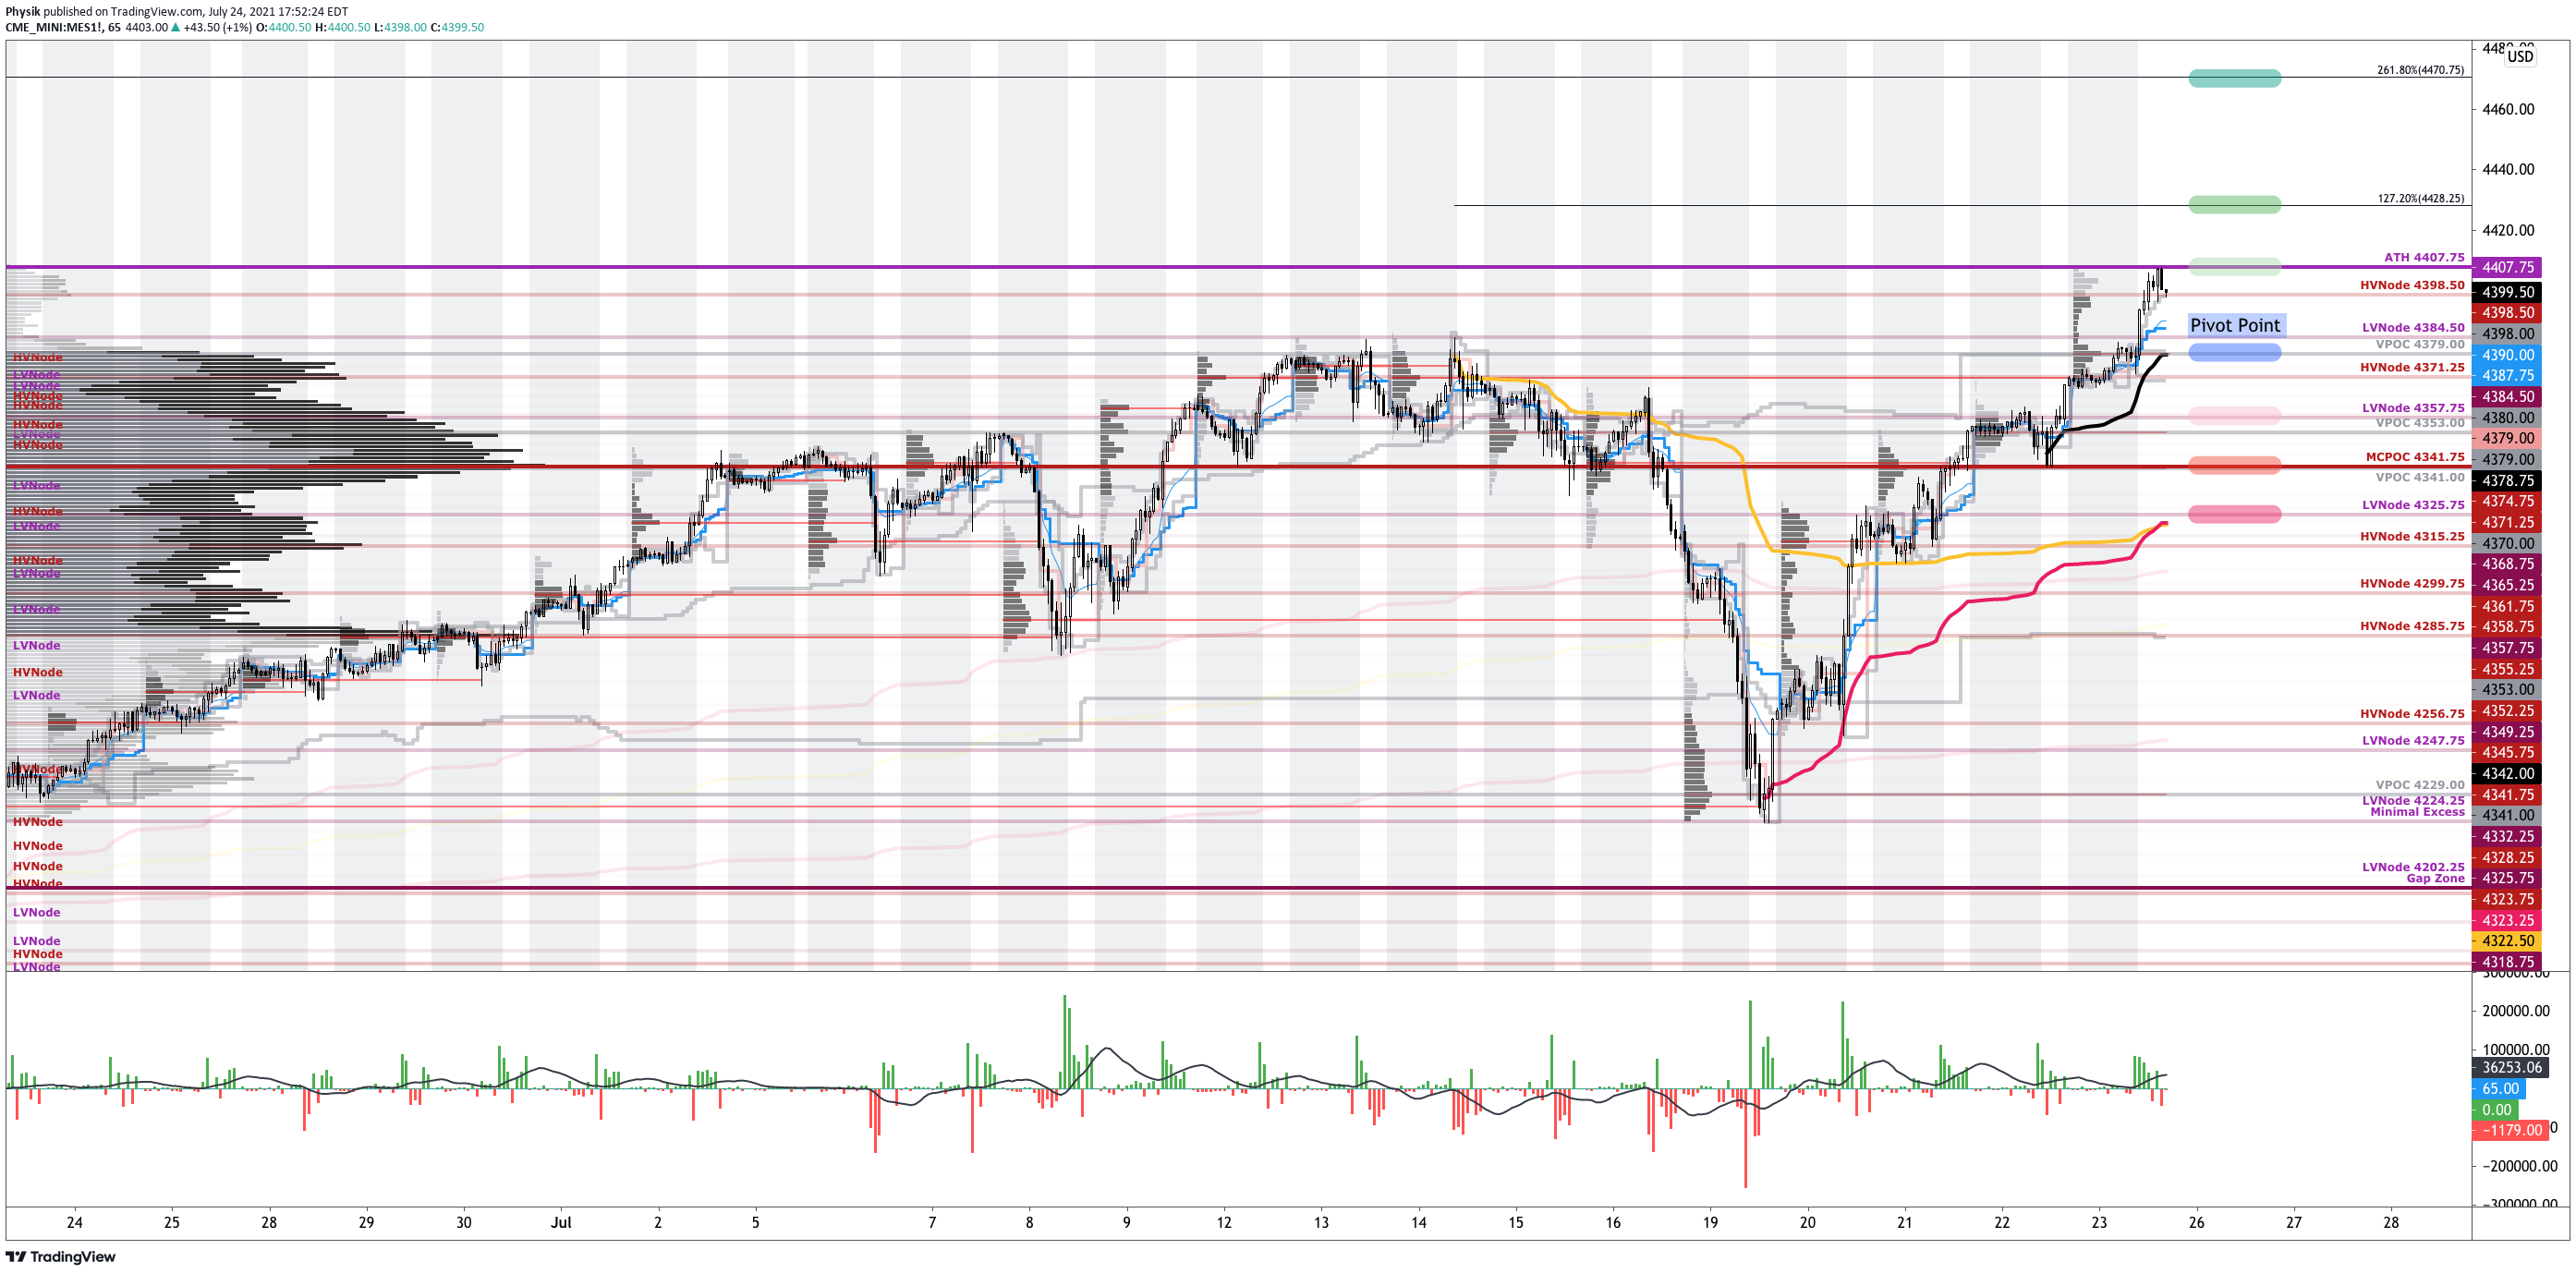
What To Expect: Ahead of the upcoming Federal Reserve meeting, participants will want to temper their expectations on future volatility and focus their attention on where the S&P 500 trades in relation to the $4,384.50 low volume area (LVNode) pivot, a prior all-time high (ATH).
In the best case, the S&P 500 trades sideways or higher; activity above the $4,384.50 LVNode puts in play the $4,407.75 ATH. Initiative trade beyond the ATH could reach as high as the $4,428.25 and $4,470.75 Fibonacci-derived price extensions.
In the worst case, the S&P 500 trades lower; activity below the $4,384.50 LVNode puts in play the $4,357.75 LVNode. Initiative trade beyond the $4,357.75 LVNode could reach as low as the $4,341.75 micro-composite Point of Control (MCPOC) and $4,325.75 LVNode.
Note also that the last key level corresponds with two key Volume Weighted Average Price (VWAP) levels, a metric highly regarded by chief investment officers, among other participants, for quality of trade. Additionally, liquidity algorithms are benchmarked and programmed to buy and sell around VWAPs.
Volume Areas: A structurally sound market will build on past areas of high volume. Should the market trend for long periods of time, it will lack sound structure (identified as a low volume area which denotes directional conviction and ought to offer support on any test).

If participants were to auction and find acceptance into areas of prior low volume, then future discovery ought to be volatile and quick as participants look to areas of high volume for favorable entry or exit.

POCs: POCs are valuable as they denote areas where two-sided trade was most prevalent. Participants will respond to future tests of value as they offer favorable entry and exit.

Significance Of Prior ATHs, ATLs: Prices often encounter resistance (support) at prior highs (lows) due to the supply (demand) of old business. These areas take time to resolve. Breaking and establishing value (i.e., trading more than 30-minutes beyond this level) portends continuation.
Graphic: 65-minute profile chart of the Micro E-mini S&P 500 Futures.
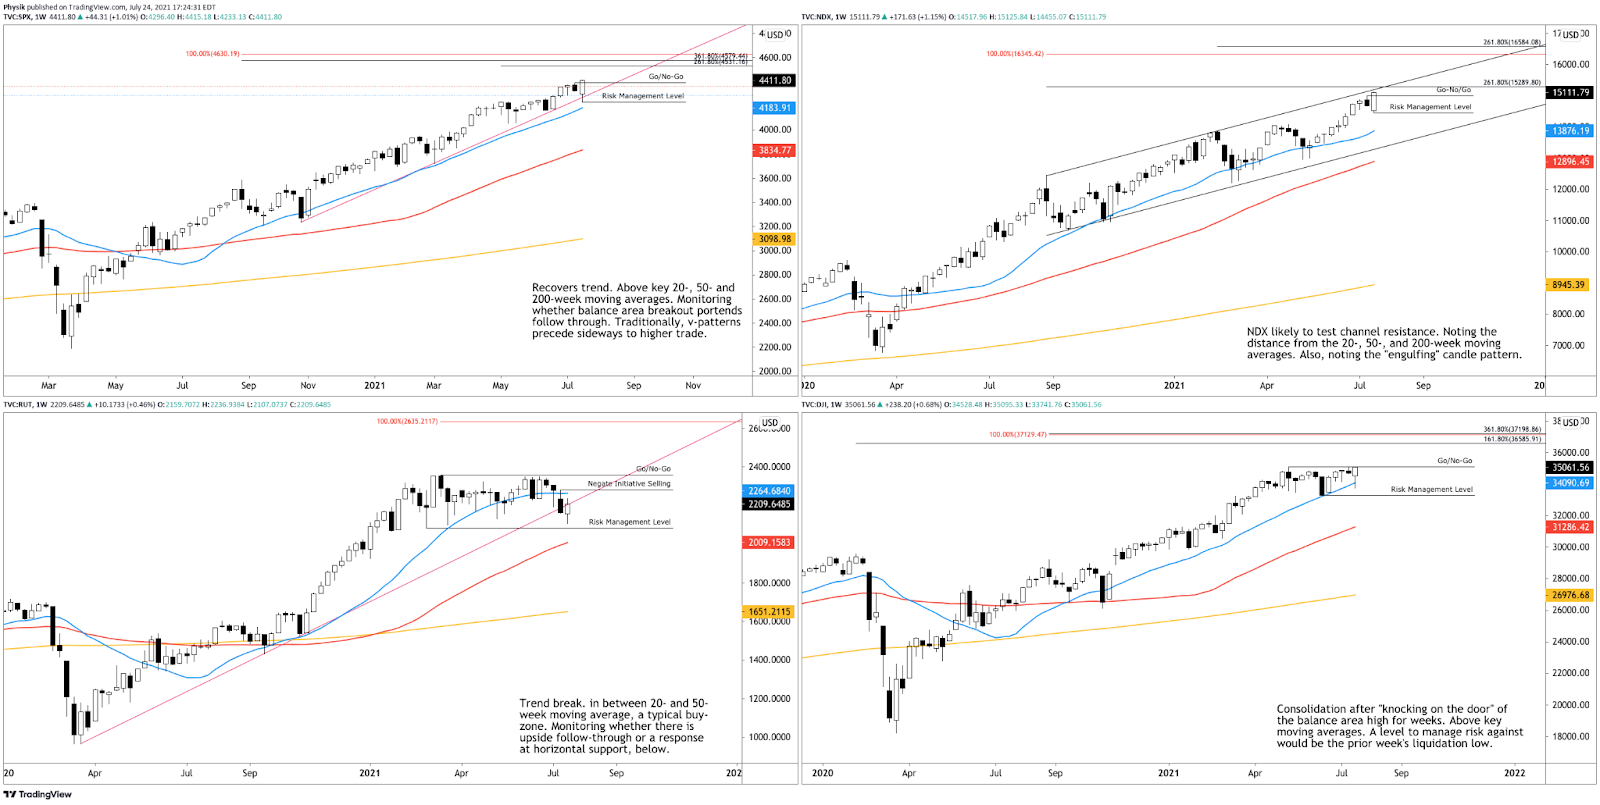
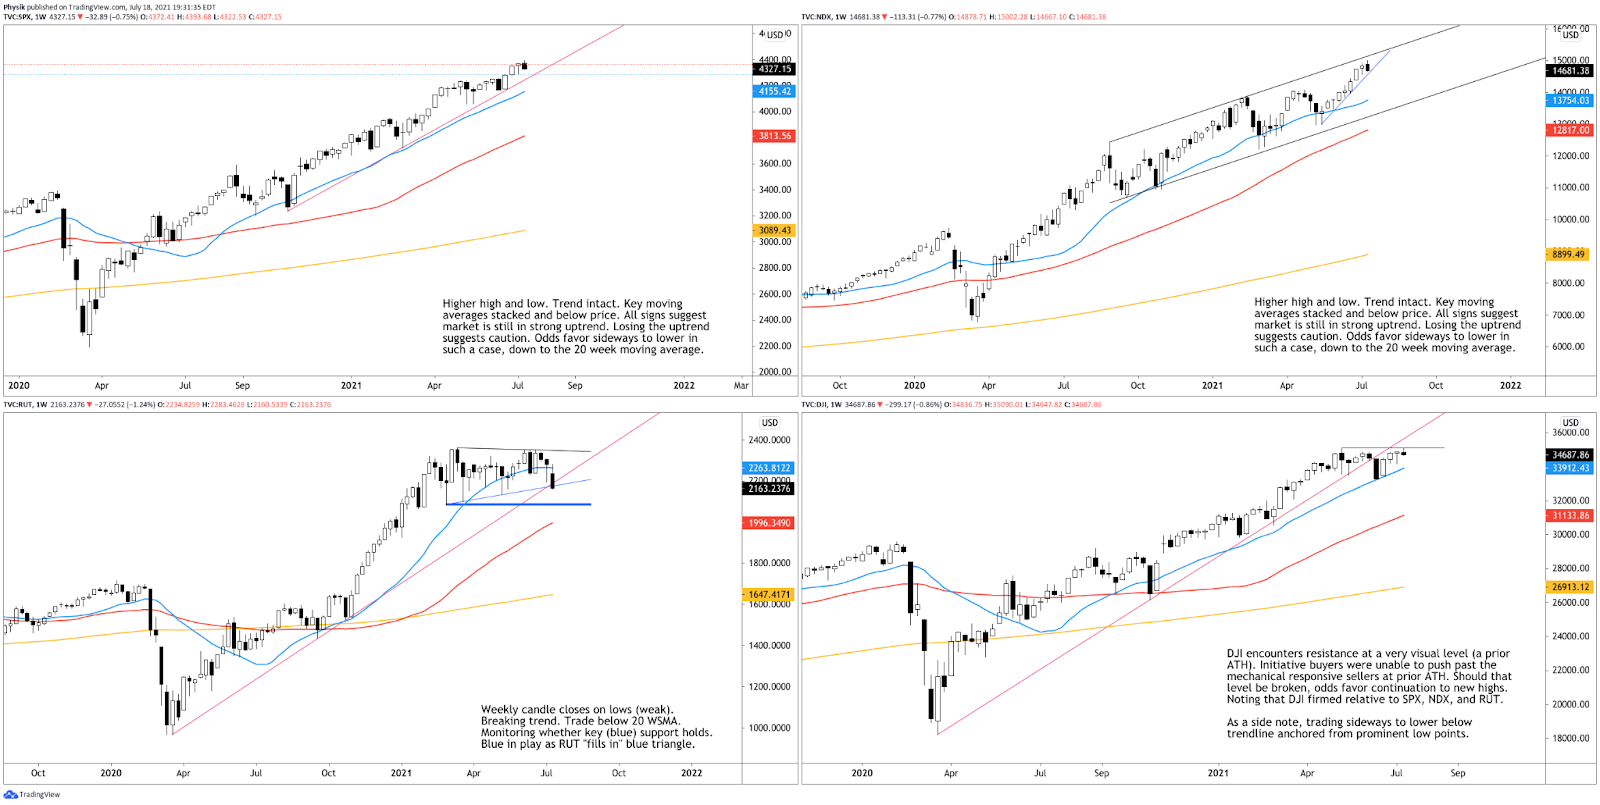
Graphic: Weekly candlestick charts of the S&P 500 (top left), Nasdaq 100 (top right), Russell 2000 (bottom left), and Dow Jones Industrial Average (bottom right).
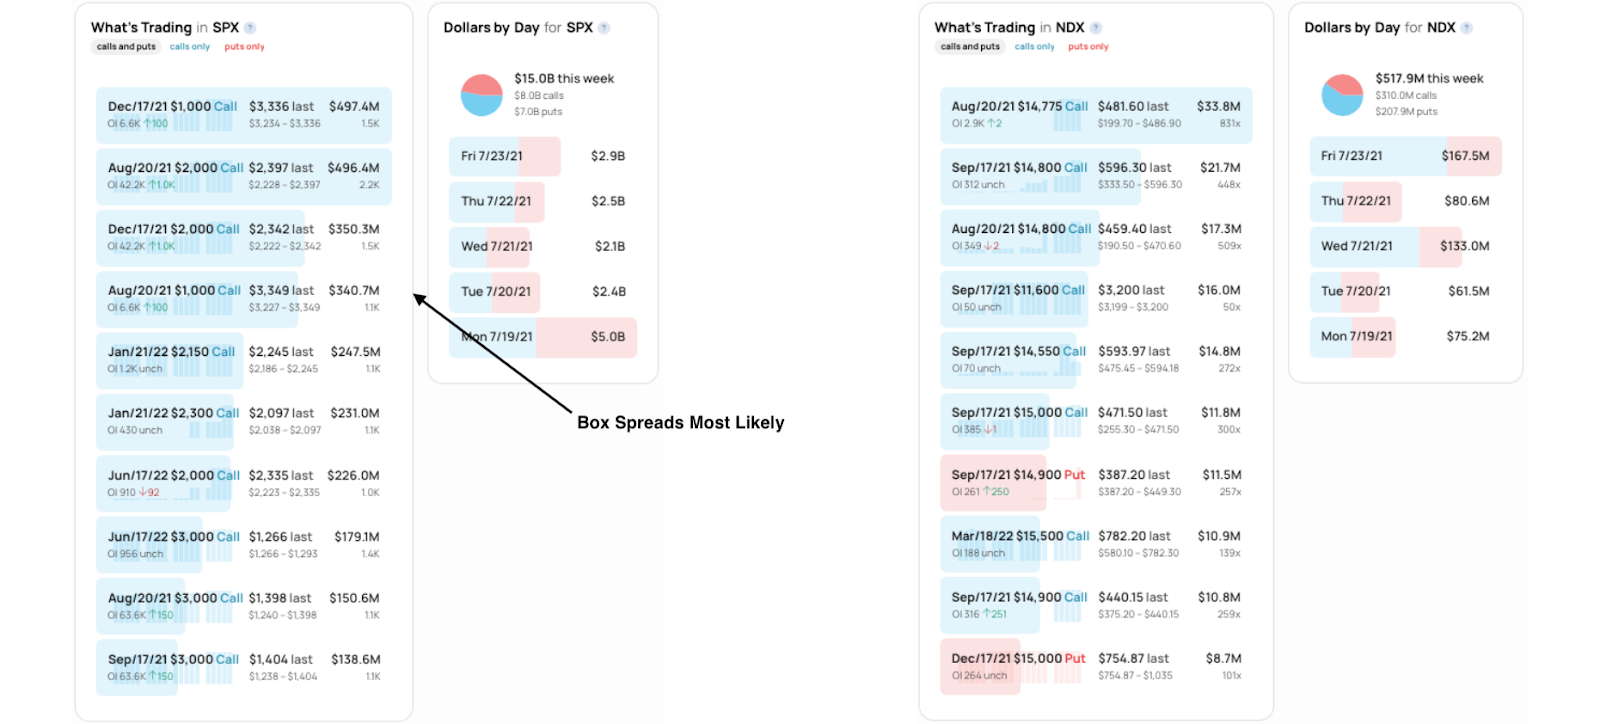
Graphic: SHIFT search suggests participants were committing the most capital to call strikes at and below current prices in the cash-settled S&P 500 Index (INDEX: SPX) and Nasdaq 100 (INDEX: NDX), last week. Note, flow in the S&P 500 may denote the trade of box spreads.
About
After years of self-education, strategy development, and trial-and-error, Renato Leonard Capelj began trading full-time and founded Physik Invest to detail his methods, research, and performance in the markets. Additionally, Capelj is a finance and technology reporter. Some of his biggest works include interviews with leaders such as John Chambers, founder and CEO, JC2 Ventures, Kevin O’Leary, businessman and Shark Tank host, Catherine Wood, CEO and CIO, ARK Invest, among others.
Disclaimer
At this time, Physik Invest does not manage outside capital and is not licensed. In no way should the materials herein be construed as advice. Derivatives carry a substantial risk of loss. All content is for informational purposes only.
Equity index futures trade higher as breadth weakens. Commodities are mixed and yields are higher, also.
Earnings balance COVID danger.
Ahead is PMI and some earnings.
Participants look to all-time highs.
What Happened: U.S. stock index futures auctioned higher overnight alongside positive developments with respect to earnings offsetting the negatives of a COVID-19 coronavirus resurgence.
“One of the most under-appreciated things about the equity markets right now is just how much these earnings have risen, and how much analysts have had to revise their earnings estimates up,” said Tracie McMillion, head of global asset allocation strategy at Wells Fargo Investment Institute.
Ahead is PMI for services and manufacturing as well as few earnings releases.
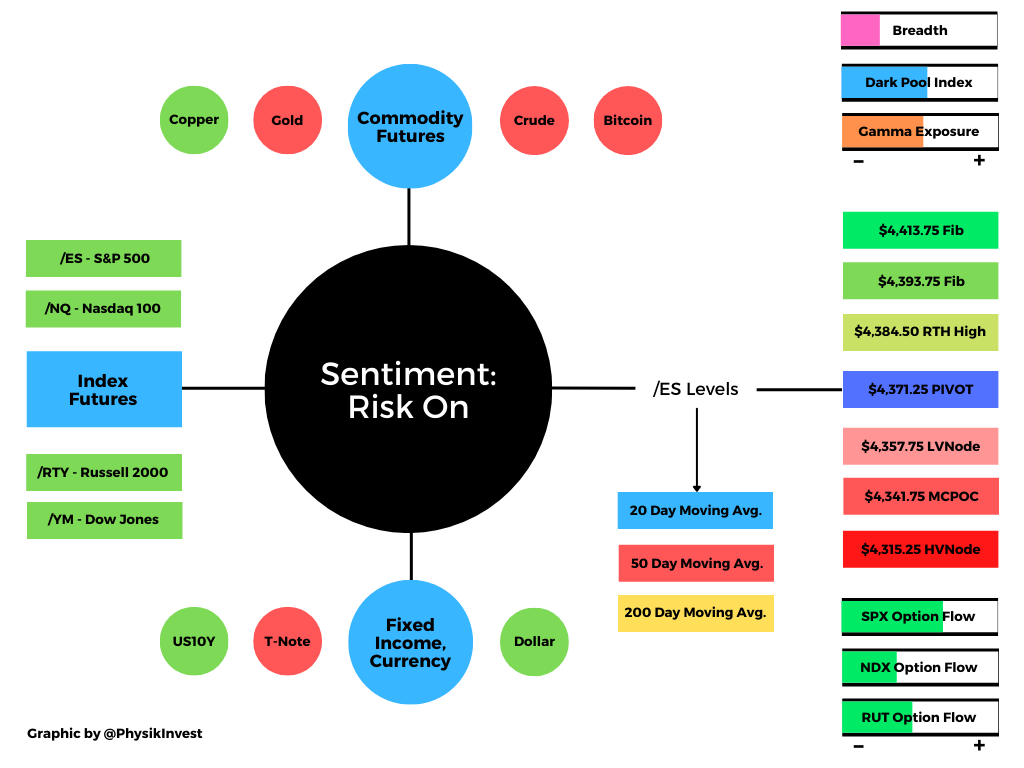
Graphic updated 6:45 AM ET. Sentiment Risk-On if expected /ES open is above the prior day’s range. See here for more on the Dark Pool Index and Gamma. A positive Dark Pool Index reading is bullish. At the same time, the higher (lower) the gamma, the less (more) volatility. SHIFT Search data used for options activity. Note that options flow is sorted by the call premium spent; if green and more (less) positive then more (less) was spent on call options. Breadth reflects a reading of the prior day’s Advance/Decline indicator.
What To Expect: As of 6:45 AM ET, Friday’s regular session (9:30 AM – 4:00 PM EST) in the S&P 500 will likely open outside of prior-range and -value, suggesting a potential for immediate directional opportunity.
Gap Scenario: Gaps ought to fill quickly. Should they not, that’s a signal of strength; do not fade. Leaving value behind on a gap-fill or failing to fill a gap (i.e., remaining outside of the prior session’s range) is a go-with indicator.

Auctioning and spending at least 1-hour of trade back in the prior range suggests a lack of conviction; in such a case, do not follow the direction of the most recent initiative activity.
Adding, during the prior day’s regular trade, the best case outcome occurred, evidenced by trade that later moved participants into a balance area, above the $4,357.75 low volume area (LVNode). This is significant because the initial breakdown, from that area, signaled a clear transition from two-time frame trade, or balance, to one-time frame trade, or trend.
Volume Areas: A structurally sound market will build on past areas of high volume. Should the market trend for long periods of time, it will lack sound structure (identified as a low volume area which denotes directional conviction and ought to offer support on any test).

If participants were to auction and find acceptance into areas of prior low volume, then future discovery ought to be volatile and quick as participants look to areas of high volume for favorable entry or exit.
Coming into Thursday’s session, markets were positioned for higher. Increased acceptance at higher prices moved the micro-composite Point of Control (MCPOC) up to $4,341.75, breadth was fantastic, and dynamics with respect to market liquidity, and the derivatives market, were confirmations.
POCs: POCs are valuable as they denote areas where two-sided trade was most prevalent. Participants will respond to future tests of value as they offer favorable entry and exit.
Coming into Friday’s session, conditions are less favorable.
Yesterday, the so-called other timeframes (OTFs) – those larger participants that have the wherewithal to move price – were not far apart in their views. The S&P 500 was rangebound between the $4,341.75 MCPOC and $4,357.75 LVNode – key levels highlighted in the morning commentary – as participants worked off the near-vertical price from day’s prior, positioning themselves for new information.
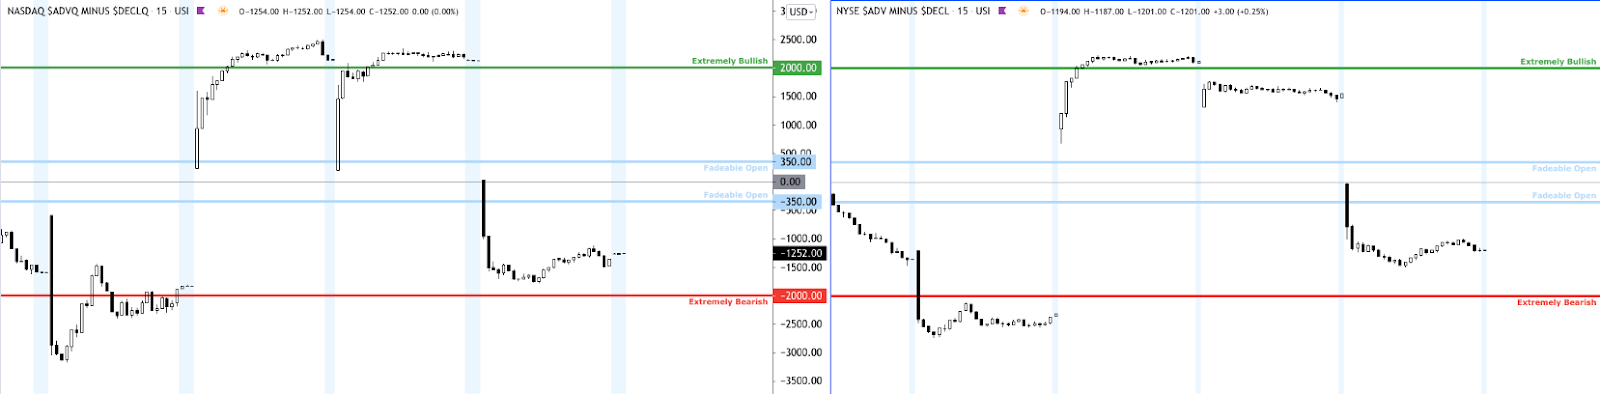
In the face of that balancing activity, the market was not supported, internally; among other factors, breadth, measured by the Advance/Decline indicator, was divergent.
Graphic: Equity index leaders rose in price as internal divergences – like the ratio of advancers to decliners – grew. Noting a bigger divergence in internals tracking Nasdaq issues.
So, with that, despite the path of least resistance being higher, participants are to limit their expectations for future trade. Certain mechanics are likely to quell upside volatility, leading to a stall or slower advance.
For today, participants can trade from the following frameworks.
In the best case, the S&P 500 trades sideways or higher; activity above the $4,317.25 high volume area (HVNode) puts in play the $4,384.50 minimal excess, regular trade high (RTH High). Initiative trade beyond the RTH High could reach as high as the Fibonacci-derived price targets at $4,393.75 and $4,413.75.
Excess: A proper end to price discovery; the market travels too far while advertising prices. Responsive, other-timeframe (OTF) participants aggressively enter the market, leaving tails or gaps which denote unfair prices.
In the worst case, the S&P 500 trades lower; activity below the $4,371.25 HVNode puts in play the low end of the balance or the $4,357.75 LVNode. Initiative trade beyond the LVNode could reach as low as the $4,341.75 MCPOC and $4,315.25 HVNode.
It is important to note also that the last two key levels correspond with key Volume Weighted Average Price (VWAP) levels, a metric highly regarded by chief investment officers, among other participants, for quality of trade. Additionally, liquidity algorithms are benchmarked and programmed to buy and sell around VWAPs.
Graphic: 65-minute profile chart of the Micro E-mini S&P 500 Futures. Graphic updated 6:45 AM ET.
News And Analysis
Pfizer shot halts severe illness, allows infection in Israel. (BBG)
Delinquencies fall below the pre-great recession average. (MND)
Analysis: Case for stablecoins being new shadow banks. (BBG)
Study: Sharp dip in antibody levels after first Pfizer dose. (REU)
Fed seen speeding taper of MBS in early-2022 pullback. (BBG)
Digital euro poses disintermediation risks to Euro banks. (Moody’s)
Car chip shortage to abate, smartphones probably next. (REU)
U.K.’s growth slows sharply in July amid COVID’s return. (REU)
What People Are Saying
Had the honor of speaking to @PeterReznicek, founder at ShadowTrader and mentor to many, including myself.
In my @Benzinga interview, Peter details his start, perspectives, tips for success, and vision for the future.
After years of self-education, strategy development, and trial-and-error, Renato Leonard Capelj began trading full-time and founded Physik Invest to detail his methods, research, and performance in the markets. Additionally, Capelj is a finance and technology reporter. Some of his biggest works include interviews with leaders such as John Chambers, founder and CEO, JC2 Ventures, Kevin O’Leary, businessman and Shark Tank host, Catherine Wood, CEO and CIO, ARK Invest, among others.
Disclaimer
At this time, Physik Invest does not manage outside capital and is not licensed. In no way should the materials herein be construed as advice. Derivatives carry a substantial risk of loss. All content is for informational purposes only.
Equity index futures trade higher as volatility implodes. Yields, commodities are higher, too.
President Biden played down inflation.
Ahead: Claims, home sales, earnings.
Equity indices up on fantastic breadth.
What Happened: U.S. stock index futures auctioned higher alongside comments against inflation by President Joe Biden, yesterday. Virus fears ebbed as infections accelerated.
Bitcoin extended its advance after Elon Musk, Catherine Wood, and Jack Dorsey talked cryptocurrency at a virtual event.
Ahead is data on weekly jobless claims, existing home sales, and corporate earnings.
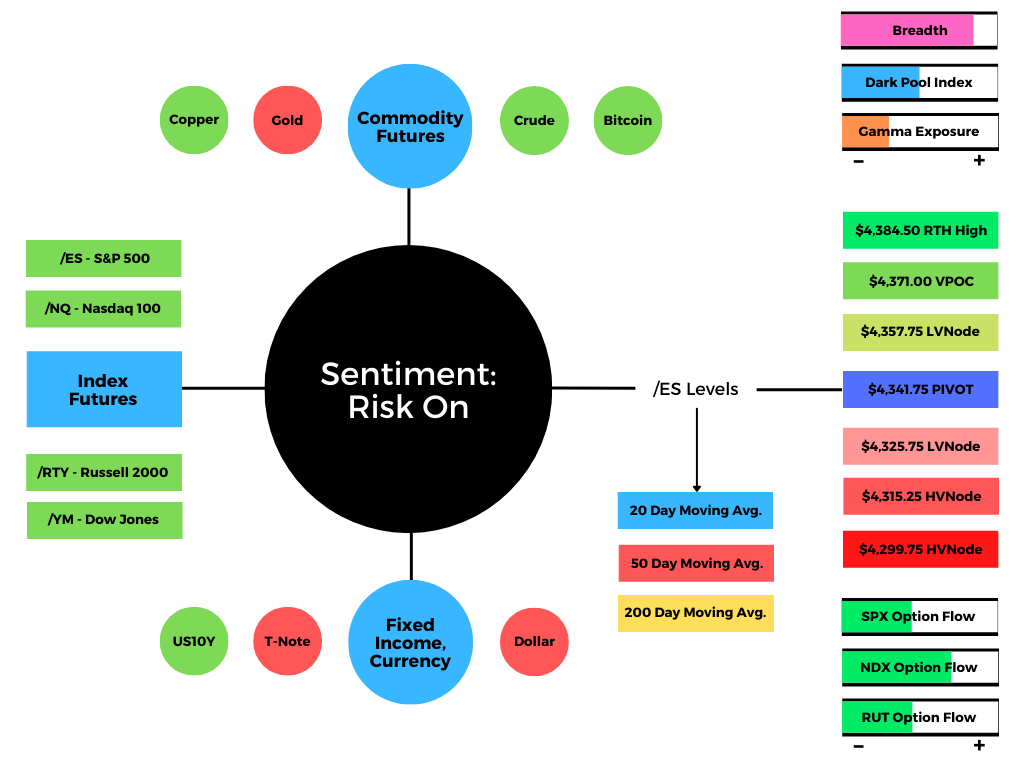
Graphic updated 6:30 AM ET. Sentiment Risk-On if expected /ES open is above the prior day’s range. See here for more on the Dark Pool Index and Gamma. A positive Dark Pool Index reading is bullish. At the same time, the higher (lower) the gamma, the less (more) volatility. SHIFT Search data used for options activity. Note that options flow is sorted by the call premium spent; if green and more (less) positive then more (less) was spent on call options. Breadth reflects a reading of the prior day’s Advance/Decline indicator.
What To Expect: As of 6:30 AM ET, Thursday’s regular session (9:30 AM – 4:00 PM EST) in the S&P 500 will likely open on a small gap, just outside of prior-range and -value, suggesting a potential for immediate directional opportunity.
Balance-Break and/or Gap Scenarios: Monitor for acceptance (i.e., more than 1-hour of trade) outside of the balance area.

Gaps ought to fill quickly. Should they not, that’s a signal of strength; do not fade. Leaving value behind on a gap-fill or failing to fill a gap (i.e., remaining outside of the prior session’s range) is a go-with indicator.

Auctioning and spending at least 1-hour of trade back in the prior range suggests a lack of conviction; in such a case, do not follow the direction of the most recent initiative activity.
Adding, during the prior day’s regular trade, the best case outcome occurred, evidenced by trade above the $4,334.25 spike base. As that happened, participants found increased acceptance at higher prices, moving the micro-composite Point of Control (MCPOC) up to $4,341.75, a pivot point (i.e., above = bullish, below = bearish) for today’s trade. This is noteworthy since it suggests the fairest price to do business, on a larger timeframe, is higher.
At the same time, in support of the price rise was fantastic breadth and dynamics with respect to the derivatives market; amidst a crash in volatility, associated hedging activities bolster the rally.
Coming into the balance-area sellers initiated from the weak prior, however, certain mechanics may quell the upside volatility, potentially leading to a stall or slower advance.
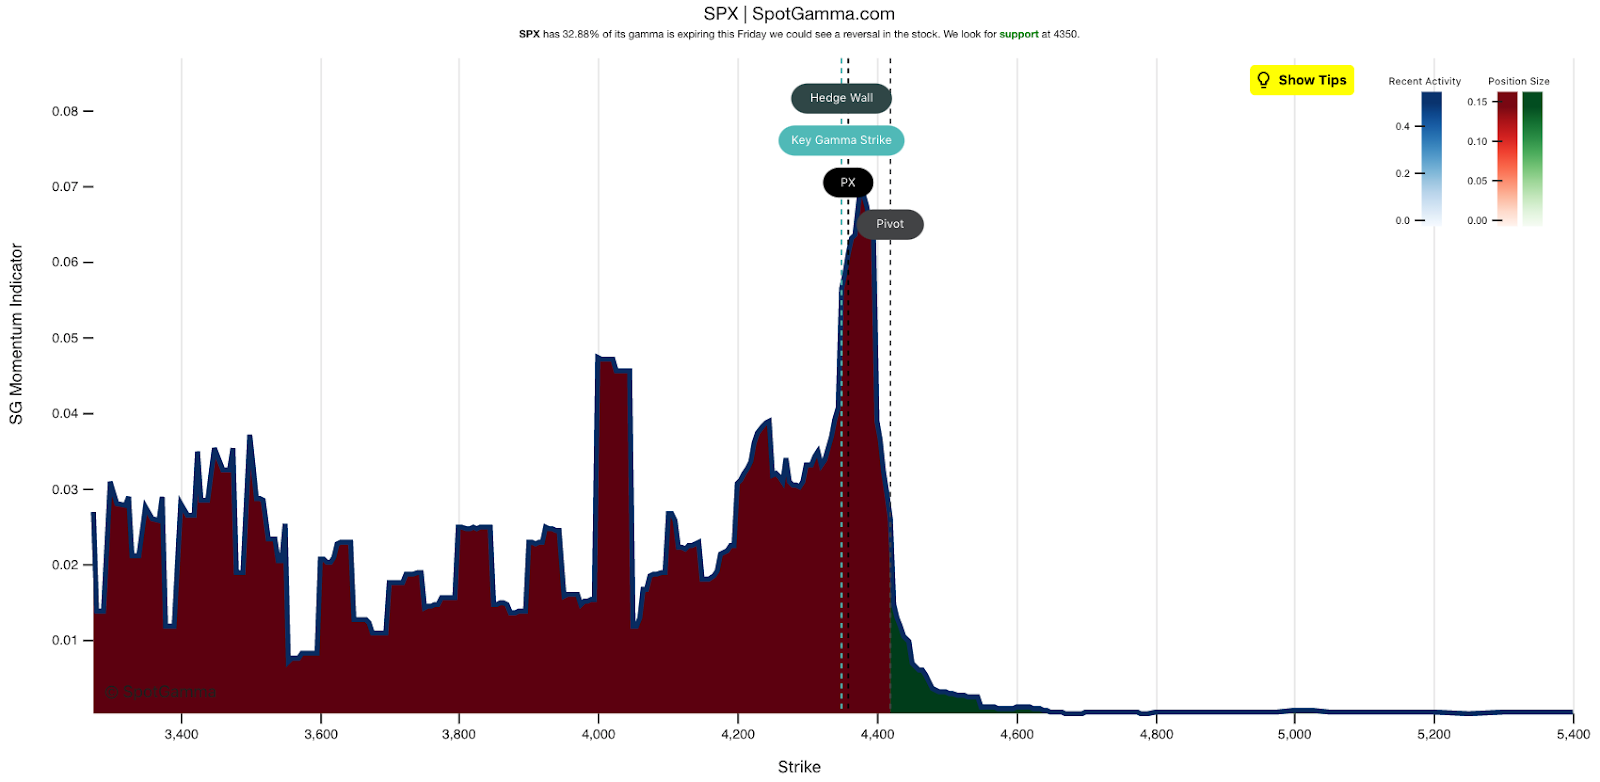
Graphic: SpotGamma data suggests the S&P 500 is back in so-called “long-gamma” territory. Gamma is the sensitivity of an option to changes in the underlying price. Dealers that take the other side of options trades hedge their exposure to risk by buying and selling the underlying. When dealers are short-gamma, they hedge by buying into strength and selling into weakness. When dealers are long-gamma, they hedge by selling into strength and buying into weakness. The former exacerbates volatility. The latter calms volatility.
Moreover, for today, participants can trade from the following frameworks.
In the best case, the S&P 500 trades sideways or higher; activity above the $4,341.75 MCPOC puts participants just short of entry into a prior balance area, near the $4,357.75 low volume area (LVNode). Initiative trade beyond the $4,357.75 LVNode could reach as high as the $4,371.00 POC and $4,384.50 minimal excess regular trade high (RTH), the typical scenario on re-entry into balance.
In the worst case, the S&P 500 trades lower; activity below the $4,341.75 MCPOC puts in play the $4,325.75 LVNode. Initiative trade beyond the $4,325.75 LVNode could reach as low as the $4,315.25 and $4,299.75 high volume areas (HVNodes).
It is important to note also that the prior two HVNodes correspond with key Volume Weighted Average Price (VWAP) levels, a metric highly regarded by chief investment officers, among other participants, for quality of trade. Additionally, liquidity algorithms are benchmarked and programmed to buy and sell around VWAPs.
Balance (Two-Timeframe Or Bracket): Rotational trade that denotes current prices offer favorable entry and exit. Balance-areas make it easy to spot a change in the market (i.e., the transition from two-time frame trade, or balance, to one-time frame trade, or trend).

POCs: POCs are valuable as they denote areas where two-sided trade was most prevalent. Participants will respond to future tests of value as they offer favorable entry and exit.

Volume Areas: A structurally sound market will build on past areas of high volume. Should the market trend for long periods of time, it will lack sound structure (identified as a low volume area which denotes directional conviction and ought to offer support on any test).

If participants were to auction and find acceptance into areas of prior low volume, then future discovery ought to be volatile and quick as participants look to areas of high volume for favorable entry or exit.

Excess: A proper end to price discovery; the market travels too far while advertising prices. Responsive, other-timeframe (OTF) participants aggressively enter the market, leaving tails or gaps which denote unfair prices.
Graphic: 65-minute profile chart of the Micro E-mini S&P 500 Futures. Updated 6:30 AM ET.
News And Analysis
Strong job and real estate markets support credit. (Moody’s)
Federal Reserve ramps up debate on taper timing. (WSJ)
China offers oil reserves in a move to cool oil rally. (BBG)
Biden dismisses inflation worries, warns on hiring. (BBG)
Here's a simple chart that tracks the 1 year trailing correlation of daily E-mini returns and volume. Large down days have always tended to have higher volume, but the correlation is more negative now than any recent time other than Feb 2020 and Feb 2018. Warning shot or noise? pic.twitter.com/VeuUv3FTBj
After years of self-education, strategy development, and trial-and-error, Renato Leonard Capelj began trading full-time and founded Physik Invest to detail his methods, research, and performance in the markets. Additionally, Capelj is a finance and technology reporter. Some of his biggest works include interviews with leaders such as John Chambers, founder and CEO, JC2 Ventures, Kevin O’Leary, businessman and Shark Tank host, Catherine Wood, CEO and CIO, ARK Invest, among others.
Disclaimer
At this time, Physik Invest does not manage outside capital and is not licensed. In no way should the materials herein be construed as advice. Derivatives carry a substantial risk of loss. All content is for informational purposes only.
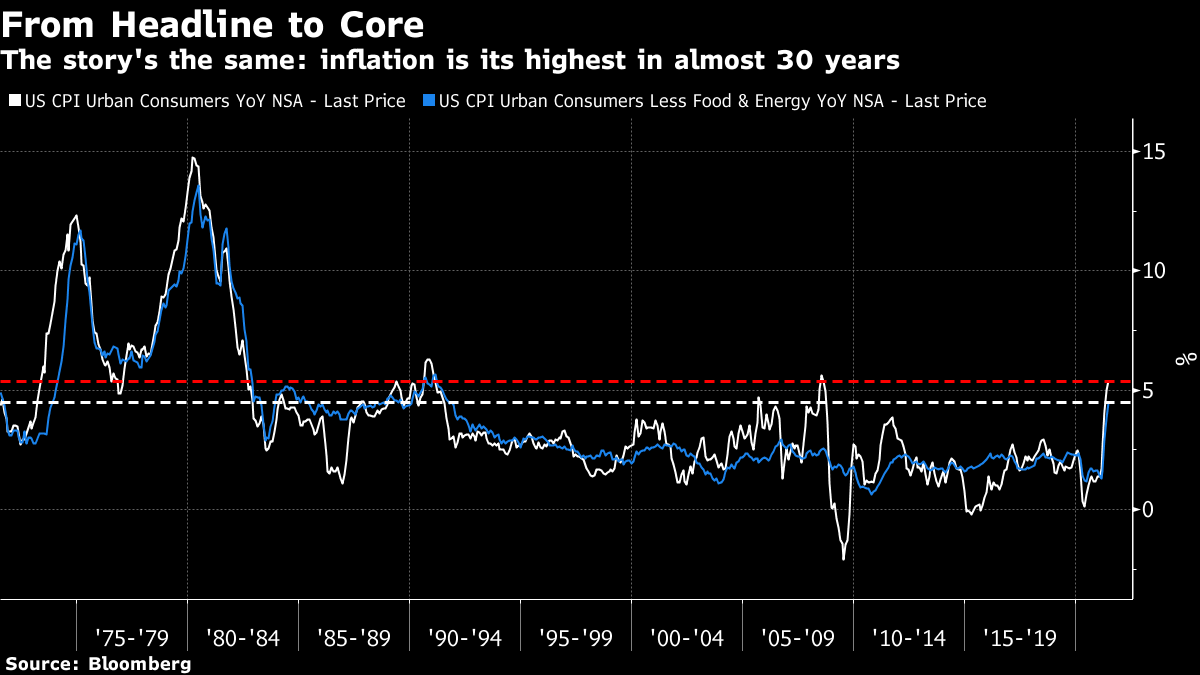
At the same time, a measure of inflation – via the Consumer Price Index (CPI) – rose the largest since the Global Financial Crisis. In response, the 5s30s curve resumed its flattening and the 10-year U.S. Treasury yield ended little changed.
Graphic: Inflation at its highest in almost 30 years via Bloomberg.
Simply put, it’s likely that bond market participants shrugged off the data and an acceleration in inflation will be temporary.
Still, yields could become further depressed due in part to fundamental and technical factors – issuance, short coverings, a fading reflation trade, peak growth – as well as the August 1 reinstatement of the U.S. debt limit.
“[I]f Congress idly stands by, the Treasury will eventually hit the debt limit on October 18. The consequences would be severe,” Moody’s strategists believe. Michael A. Gayed of the Lead-Lag Report adds the odds of a rating downgrade increase, as a result, also.
Is another downgrade at debt ceiling expiry coming soon? From the latest @leadlagreport Check out the dates at bottom of the list. S&P went down from April to September that year…Maybe Gayed should change his tagline from "few understand this" to "few even talk about this". pic.twitter.com/vl8aJysty3
— Peter Reznicek | ShadowTrader.net (@PeterReznicek) July 18, 2021
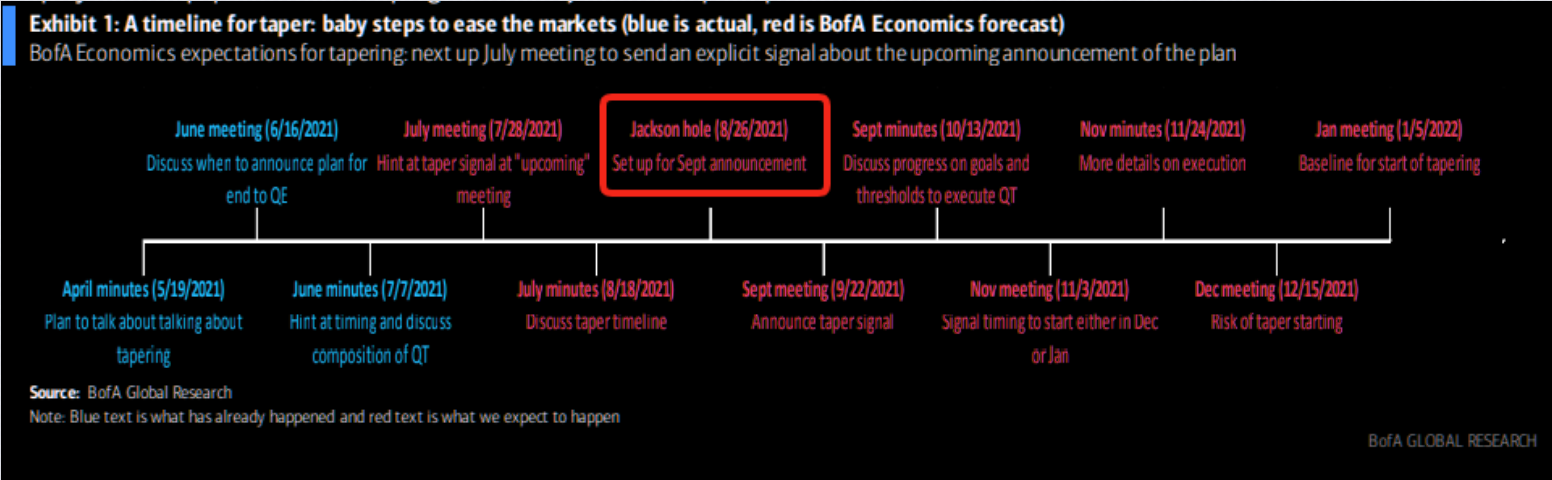
Moody’s concludes: “[T]apering earlier than the markets are pricing would risk causing yields to jump when some of the technical drags are easing.”
Graphic: Bank of America Corp’s (NYSE: BAC) timeline for taper via The Market Ear.
Adding, since inflation and rates move inversely to each other, a mistimed bump in rates – alongside increased nervousness over a COVID-19 resurgence and fading fiscal stimulus – would potentially take away from the commitment to keep inflation expectations closer to the Federal Reserve’s 2%-plus target.
In all, in support of the Fed’s target, COVID-19 must not become a problem, and the Biden administration, alongside Congress, must come to terms on another fiscal package – a few trillion in size – that looks to extend the Treasury debt ceiling.
As unemployment declines and labor force participation increases, expectations of rate normalization will solidify. This is a boon for beta sectors, according to JPMorgan Chase & Co’s (NYSE: JPM) Marko Kolanovic.
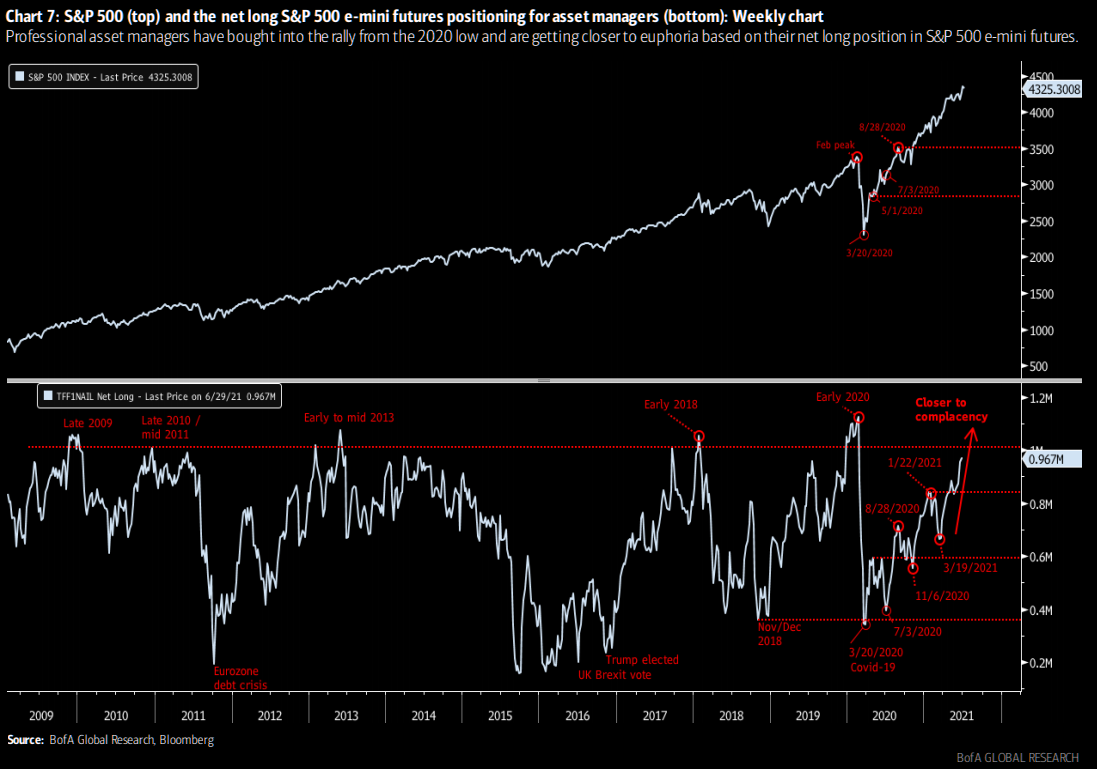
Considerations: Investment bank and financial services company Morgan Stanley (NYSE: MS) believes downside risks are compounded by equity and bond positioning, low short interest, and the involvement of systemic strategies which could intensify a sell-off.
Graphic: Bank of America Corp (NYSE: BAC) chart on futures positioning via The Market Ear.
MS says CTAs are still short bonds which, according to CityWire, could continue the bond rally, pressuring stocks as investors “fear the bond market may know[] something they don’t.”
Add the passage of the July options expiration (OPEX), the window for the aforementioned dynamics (alongside a shift in preferences from saving and investing to spending, monetary tightening, seasonality, as well as a COVID-19 resurgence) to take over is opened.
After OPEX, according to SpotGamma, “the market tends to experience its largest intraday volatility which corresponds to the reduction in large options positions, and the hedging associated with them.”
Graphic: SpotGamma’s EquityHub showed 30% of the S&P 500’s gamma expiring July 16 which, as SpotGamma has said in the past, “creates volatility because, as large options positions expire[], are closed and/or rolled, dealers have large hedges they need to adjust.”
What To Expect: In the coming sessions, participants will want to focus their attention on where the S&P 500 trades in relation to the $4,334.25 spike base.
Spikes: Spike’s mark the beginning of a break from value. Spikes higher (lower) are validated by trade at or above (below) the spike base (i.e., the origin of the spike).
In the best case, the S&P 500 trades sideways or higher; activity above $4,334.25 puts in play the $4343.00 VPOC. Trade beyond that signposts may then put in play the $4,346.75 HVNode – which corresponds with two anchored Volume Weighted Average Prices (VWAPs).
POCs: POCs are valuable as they denote areas where two-sided trade was most prevalent. Participants will respond to future tests of value as they offer favorable entry and exit.

More On Volume-Weighted Average Prices (VWAPs): A metric highly regarded by chief investment officers, among other participants, for quality of trade. Additionally, liquidity algorithms are benchmarked and programmed to buy and sell around VWAPs.

Volume Areas: A structurally sound market will build on past areas of high volume. Should the market trend for long periods of time, it will lack sound structure (identified as a low volume area which denotes directional conviction and ought to offer support on any test).

If participants were to auction and find acceptance into areas of prior low volume, then future discovery ought to be volatile and quick as participants look to areas of high volume for favorable entry or exit.
If higher, entry into an overhead supply area, above the $4,357.75 low volume area (LVNode), portends continuation to the $4,371.00 VPOC and$4,384.50 RTH High.
In the worst case, the S&P 500 trades lower; activity below $4,334.25 puts in play the $4,314.75 high volume area (HVNode). Initiative trade beyond $4,314.75 could reach as low as the $4,297.00 HVNode. Closeby is the $4,291.00 VPOC and $4,285.00 composite HVNode.
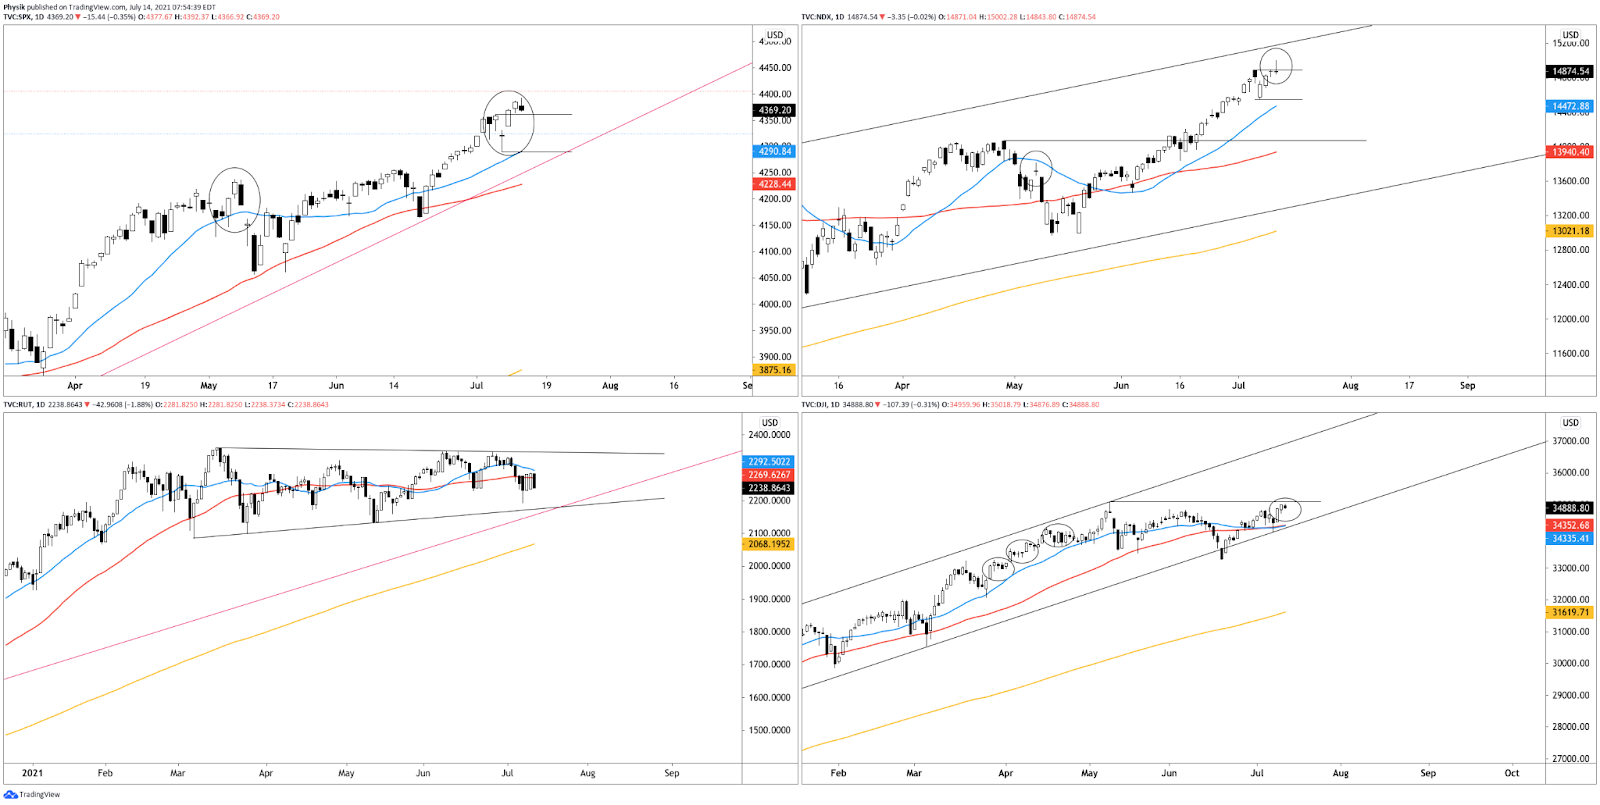
Graphic: 65-minute profile chart of the Micro E-mini S&P 500 Futures.Graphic: Daily candlestick charts of the S&P 500 (top left), Nasdaq 100 (top right), Russell 2000 (bottom left), and Dow Jones Industrial Average (bottom right).
News And Analysis
When VIX hits an extreme, options traders look to volatility arbitrage. (tasty)
Identifying gamma squeezes with SpotGamma’s options modeling. (BZ)
U.S. banks see loan, revenue pressure despite consumer spending. (Fitch)
The U.S. economy continued to strengthen as mobility trended up. (S&P)
‘A free put on the market’: Ambrus CIO talking volatility dislocations. (BZ)
OPEC+ agrees oil supply boost after UAE, Saudi reach compromise. (REU)
An unexpected tightening in policy would generate market volatility. (Moody’s)
Semiconductor supply shortage, inflation, and technology regulation. (S&P)
Frenzied retail investing boom has been cooling off in recent weeks. (Fortune)
Delta Air is seeing positive growth in business travel as offices open. (S&P)
After years of self-education, strategy development, and trial-and-error, Renato Leonard Capelj began trading full-time and founded Physik Invest to detail his methods, research, and performance in the markets. Additionally, Capelj is a finance and technology reporter. Some of his biggest works include interviews with leaders such as John Chambers, founder and CEO, JC2 Ventures, Kevin O’Leary, businessman and Shark Tank host, Catherine Wood, CEO and CIO, ARK Invest, among others.
Disclaimer
At this time, Physik Invest does not manage outside capital and is not licensed. In no way should the materials herein be construed as advice. Derivatives carry a substantial risk of loss. All content is for informational purposes only.
What Happened: U.S. stock index futures resolved lower after underlying breadth metrics failed to support further price discovery.
Such lackluster trade comes ahead of a few key developments, most important of which include testimony by Federal Reserve chair Jerome Powell, employment data, earnings, industrial and manufacturing numbers, as well as the July 16 monthly options expiration.
Graphic updated 7:50 AM ET. See here for more on the Dark Pool Index and Gamma. Check out SHIFT search for data on the options activity.
What To Expect: Thursday’s regular session (9:30 AM – 4:00 PM EST) in the S&P 500 will likely open on a small gap below prior-range and -value. This suggests an increased potential for immediate directional opportunity.
Balance-Break and/or Gap Scenarios: Monitor for acceptance (i.e., more than 1-hour of trade) outside of the balance area.

Gaps ought to fill quickly. Should they not, that’s a signal of strength; do not fade. Leaving value behind on a gap-fill or failing to fill a gap (i.e., remaining outside of the prior session’s range) is a go-with indicator.

Auctioning and spending at least 1-hour of trade back in the prior range suggests a lack of conviction; in such a case, do not follow the direction of the most recent initiative activity.
Adding, during the prior day’s regular trade, the worst-case outcome occurred, evidenced by a failure to expand range above the Volume Weighted Average Price (VWAP) anchored from the CPI release (blue in color on the below profile graphic). Instead, on very slow tempo, indexes traded lower in the face of extremely poor breadth.
Graphic: Equity index leaders rose in price as internal divergences – like the ratio of advancers to decliners – grew. Noting a bigger divergence in internals tracking Nasdaq issues.
As stated yesterday, the push-pull and divergence comes ahead of the options expiration (OPEX) cycle which starts on the third Friday of each month (July 16). Associated hedging forces make it so there’s more liquidity and less movement.
After OPEX, according to SpotGamma, “the market tends to experience its largest intraday volatility which corresponds to the reduction in large options positions, and the hedging associated with them.”
Knowing the above, for today, participants can trade from the following frameworks.
In the best case, the S&P 500 trades sideways or higher; activity above the $4,357.75 low volume area (LVNode) pivot puts in play the $4,371.00 untested Point of Control (POC). Thereafter, if higher, participants can look for responses at the $4,384.50 regular trade high (RTH High) and $4,398.50 Fibonacci price extension.
In the worst case, the S&P 500 trades lower; activity below $4,357.75 puts in play the $4,343.25 HVNode. Trade beyond $4,343.25 could reach as low as the HVNodes at $4,314.75 and $4,297.00.
Significance Of Prior ATHs, ATLs: Prices often encounter resistance (support) at prior highs (lows) due to the supply (demand) of old business. These areas take time to resolve. Breaking and establishing value (i.e., trading more than 30-minutes beyond this level) portends continuation.

POCs: POCs are valuable as they denote areas where two-sided trade was most prevalent. Participants will respond to future tests of value as they offer favorable entry and exit.

Volume Areas: A structurally sound market will build on past areas of high volume. Should the market trend for long periods of time, it will lack sound structure (identified as a low volume area which denotes directional conviction and ought to offer support on any test).

If participants were to auction and find acceptance into areas of prior low volume, then future discovery ought to be volatile and quick as participants look to areas of high volume for favorable entry or exit.
Graphic: 65-minute profile chart of the Micro E-mini S&P 500 Futures.
News And Analysis
Politics | Biden agenda gains Senate ground with big hurdles remaining. (BBG)
Economy | Restaurants signing most new retail leases as rents plummet. (CNBC)
Markets | Executive orders on competition and policy tightening impact. (Moody’s)
Economy | Jerome Powell dismisses claims of complacency on inflation. (FT)
Politics | China has accused Biden administration of hurting global trade. (Axios)
Markets | Reddit traders are upending the world of credit investing, also. (BBG)
Markets | No market breadth, no problem as Faangs lift S&P 500 higher. (BBG)
Economy | CEOs speak on elevated levels of inflation which may persist. (Axios)
Economy | China warns economic uncertainty despite moderate recovery. (FT)
What People Are Saying
At major market tops, money flows to the big cap highly liquid issues that dominate the majority of the indexes masking the carnage going on inside the overall market. https://t.co/MbVvJcIuBM
1/x A trip down the market stairsteps doesn’t always have to be stressful…As those that have followed these 🥐 for some time know, an opening of a 🪟 of weakness does not necessarily mean a major decline, but what it means is a removal of the powerful 👸& 🦥 buying pressures pic.twitter.com/9TUWTdglm4
Renato founded Physik Invest after going through years of self-education, strategy development, and trial-and-error. His work reporting in the finance and technology space, interviewing leaders such as John Chambers, founder, and CEO, JC2 Ventures, Kevin O’Leary, businessman and Shark Tank host, Catherine Wood, CEO and CIO, ARK Invest, among others, afforded him the perspective and know-how very few come by.
Having worked in engineering and majored in economics, Renato is very detailed and analytical. His approach to the markets isn’t built on hope or guessing. Instead, he leverages the unique dynamics of time and volatility to efficiently act on opportunity.
Disclaimer
At this time, Physik Invest does not manage outside capital and is not licensed. In no way should the materials herein be construed as advice. Derivatives carry a substantial risk of loss. All content is for informational purposes only.
What Happened: U.S. stock index futures resolved lower after underlying breadth metrics failed to support the post-CPI recovery.
Thereafter, indices traded sideways overnight alongside news Senate Democrats on the Budget Committee agreed to a $3.5 trillion spending bill. The bill would carry President Biden’s economic agenda without Republican support.
Ahead, participants are expecting testimony by Federal Reserve Chair Jerome Powell, earnings releases from heavily weighted index constituents, as well as the latest Fed Beige Book.
Graphic updated 6:44 AM ET.
What To Expect: Wednesday’s regular session (9:30 AM – 4:00 PM EST) in the S&P 500 will likely open just inside of prior-range and -value, suggesting a limited potential for immediate directional opportunity.
Adding, during the prior day’s regular trade, the worst-case outcome occurred, evidenced by an intraday liquidation break and the subsequent acceptance below a Volume Weighted Average Price (VWAP) anchored from the CPI release (blue in color on the below profile graphic).
Liquidation Breaks: The profile shape suggests participants were “too” long and had poor location. Such dynamic offers responsive buyers (initiative sellers) favorable entry (exit).

Volume-Weighted Average Prices (VWAPs): A metric highly regarded by chief investment officers, among other participants, for quality of trade. Additionally, liquidity algorithms are benchmarked and programmed to buy and sell around VWAPs.
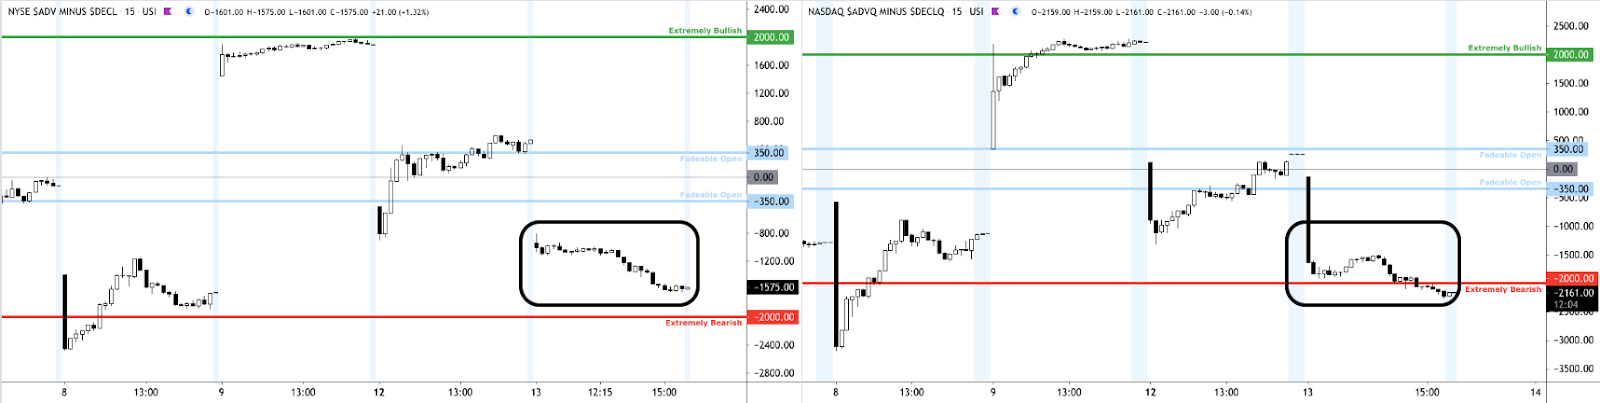
Prior to the liquidation, breadth metrics were firmly negative. Despite what appeared to be a strong recovery post-CPI, internal divergences via breadth metrics became more pronounced, while profile dynamics revealed weak commitment at higher prices and an abundance of poor structures (e.g., low-volume areas).
Graphic: Equity index leaders rose in price as internal divergences – like the ratio of advancers to decliners – grew. Noting a bigger divergence in internals tracking Nasdaq issues.
This push-pull and divergence comes ahead of the options expiration (OPEX) cycle which starts on the third Friday of each month (July 16). Associated hedging forces make it so there’s more liquidity and less movement. In other words, the market tends to pin.
Options Expiration (OPEX): Option expiries mark an end to pinning (i.e, the theory that market makers and institutions short options move stocks to the point where the greatest dollar value of contracts will expire worthless) and the reduction dealer gamma exposure.

Gamma: Gamma is the sensitivity of an option to changes in the underlying price. Dealers that take the other side of options trades hedge their exposure to risk by buying and selling the underlying. When dealers are short-gamma, they hedge by buying into strength and selling into weakness. When dealers are long-gamma, they hedge by selling into strength and buying into weakness. The former exacerbates volatility. The latter calms volatility.
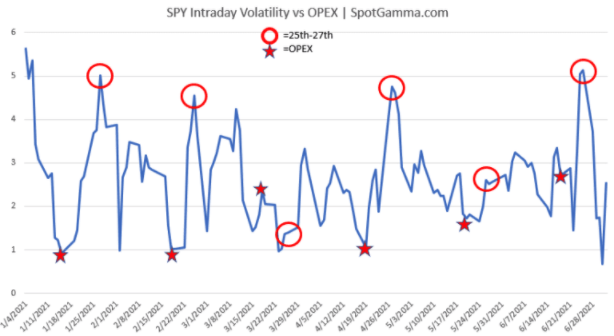
Center chart is SPX intraday volatility, which is reaching a lower bound (ie tight trading ranges) as we approach Fridays OPEX. pic.twitter.com/19RnupzaBD
Thereafter, according to SpotGamma, “[t]he week after expiration the market tends to experience its largest intraday volatility which corresponds to the reduction in large options positions, and the hedging associated with them.”
Graphic: Volatility before and after OPEX, via SpotGamma.
For today, participants can trade from the following frameworks.
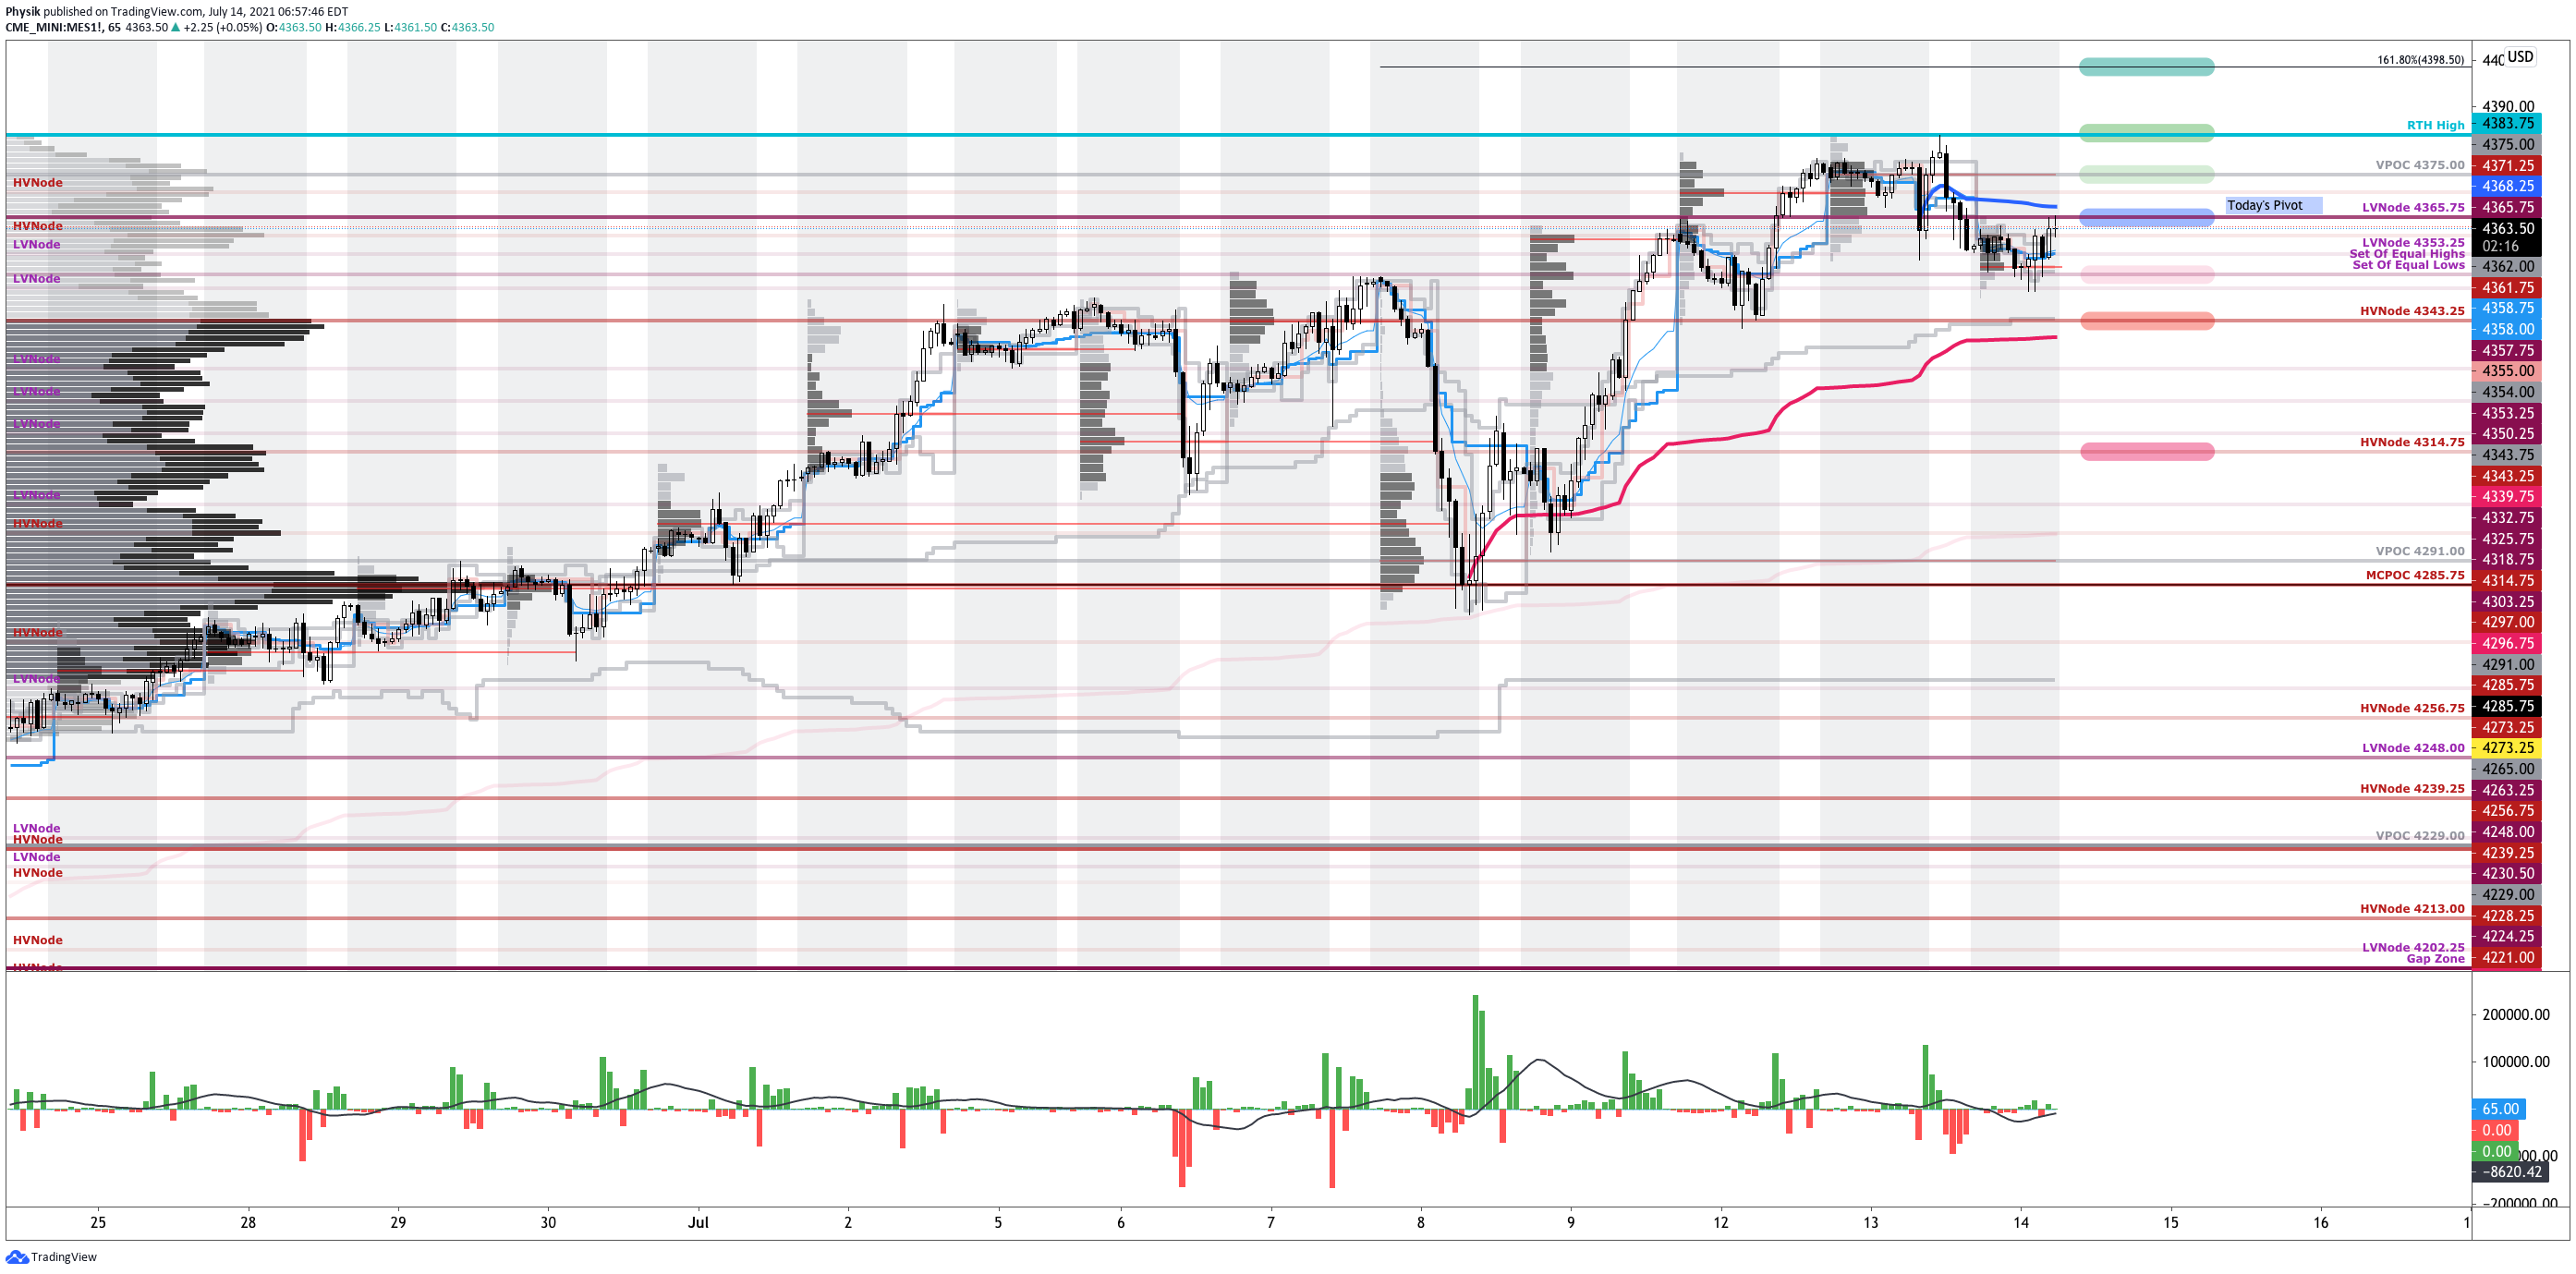
In the best case, the S&P 500 trades sideways or higher; activity above the $4,365.75 low volume area (LVNode) pivot puts in play the $4,375.00 untested Point of Control (POC), first. Then, the $4,383.75 regular trade high (RTH High) and $4,398.50 Fibonacci extension come into play.
In the worst case, the S&P 500 trades lower; activity below the $4,365.75 LVNode pivot puts in play the $4,353.25 LVNode. Trade beyond that figure puts in play the high volume areas (HVNodes) at $4,343.25 and $4,314.75.
Significance Of Prior ATHs, ATLs: Prices often encounter resistance (support) at prior highs (lows) due to the supply (demand) of old business. These areas take time to resolve. Breaking and establishing value (i.e., trading more than 30-minutes beyond this level) portends continuation.

POCs: POCs are valuable as they denote areas where two-sided trade was most prevalent. Participants will respond to future tests of value as they offer favorable entry and exit.

Volume Areas: A structurally sound market will build on past areas of high volume. Should the market trend for long periods of time, it will lack sound structure (identified as a low volume area which denotes directional conviction and ought to offer support on any test).

If participants were to auction and find acceptance into areas of prior low volume, then future discovery ought to be volatile and quick as participants look to areas of high volume for favorable entry or exit.
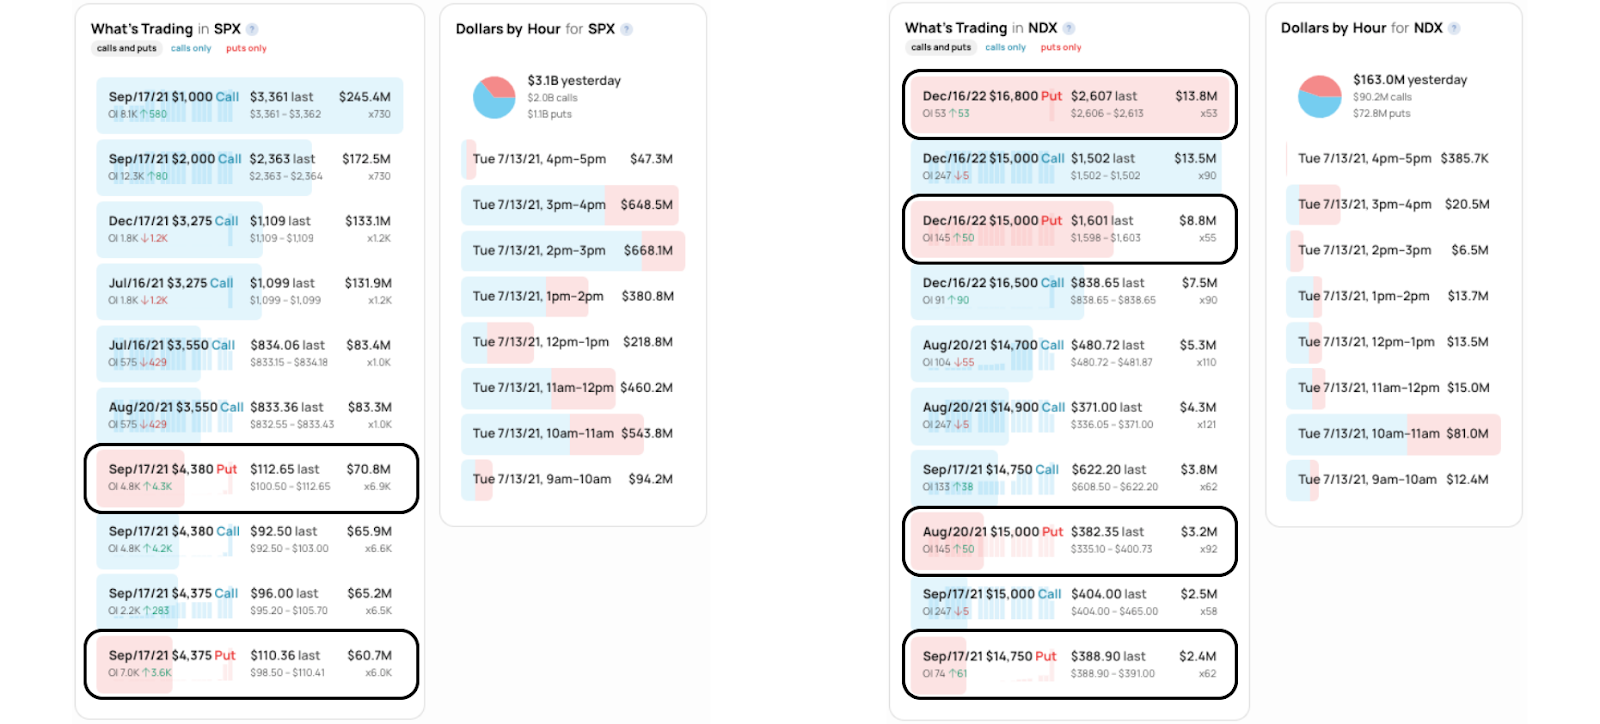
Graphic: 65-minute profile chart of the Micro E-mini S&P 500 Futures.Graphic: Daily candlestick charts of the S&P 500 (top left), Nasdaq 100 (top right), Russell 2000 (bottom left), and Dow Jones Industrial Average (bottom right).Graphic: SHIFT search suggests participants were most interested in call strikes at and below the price in the cash-settled S&P 500 (INDEX: SPX) and Nasdaq 100 (INDEX: NDX), yesterday. Noting, yesterday and over the past few weeks, there’s been increased activity in long-dated put options.
Renato founded Physik Invest after going through years of self-education, strategy development, and trial-and-error. His work reporting in the finance and technology space, interviewing leaders such as John Chambers, founder, and CEO, JC2 Ventures, Kevin O’Leary, businessman and Shark Tank host, Catherine Wood, CEO and CIO, ARK Invest, among others, afforded him the perspective and know-how very few come by.
Having worked in engineering and majored in economics, Renato is very detailed and analytical. His approach to the markets isn’t built on hope or guessing. Instead, he leverages the unique dynamics of time and volatility to efficiently act on opportunity.
Disclaimer
At this time, Physik Invest does not manage outside capital and is not licensed. In no way should the materials herein be construed as advice. Derivatives carry a substantial risk of loss. All content is for informational purposes only.