Market Commentary
Equity index futures rotate after participants initiated the bracketing process.
- Bad news for China tech & vaccine hesitancy.
- Ahead: Fed minutes, Mortgage Apps, JOLTS.
- Equity index futures see volatility before open.
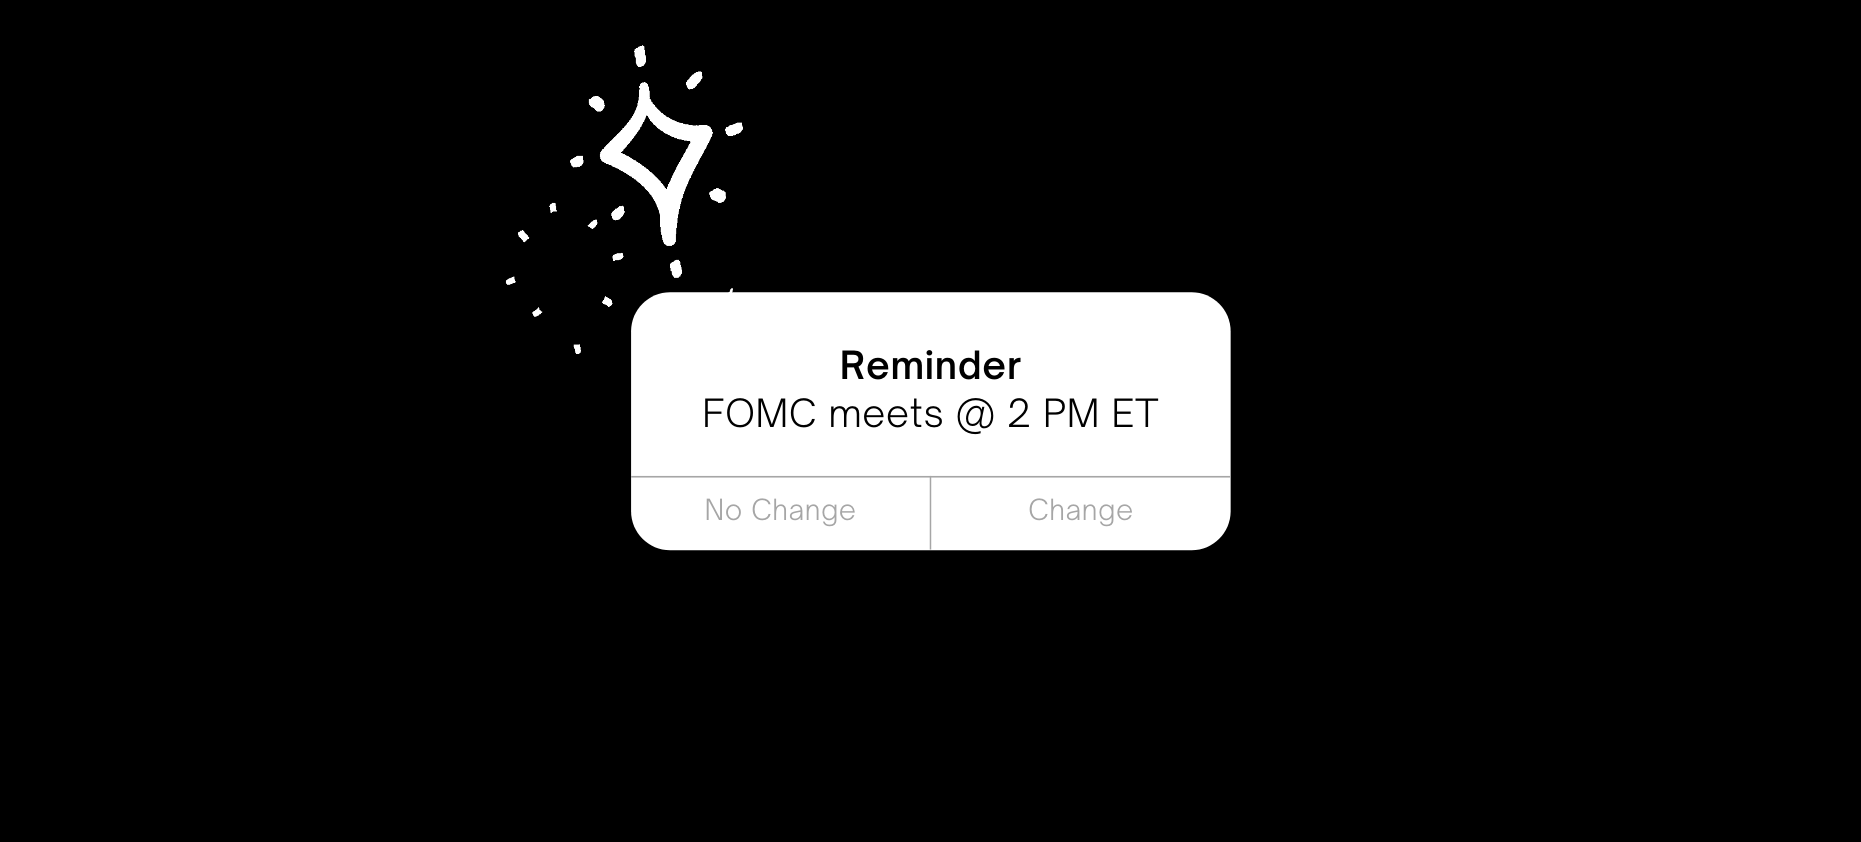
What Happened: U.S. stock index futures auctioned higher ahead of June’s Federal Reserve meeting minutes release at 2:00 PM ET.
The release should provide participants clarity over the Fed’s intent to taper asset purchases and the expected path for inflation.
In other areas, so-called vaccine hesitancy is a concern as President Joe Biden’s target to get up to 70% of Americans vaccinated, by July 4, was missed.
Also, participants get data on U.S. mortgage applications, JOLTS, and the EIA energy outlook, as well as Fed-speak by President Raphael Bostic.
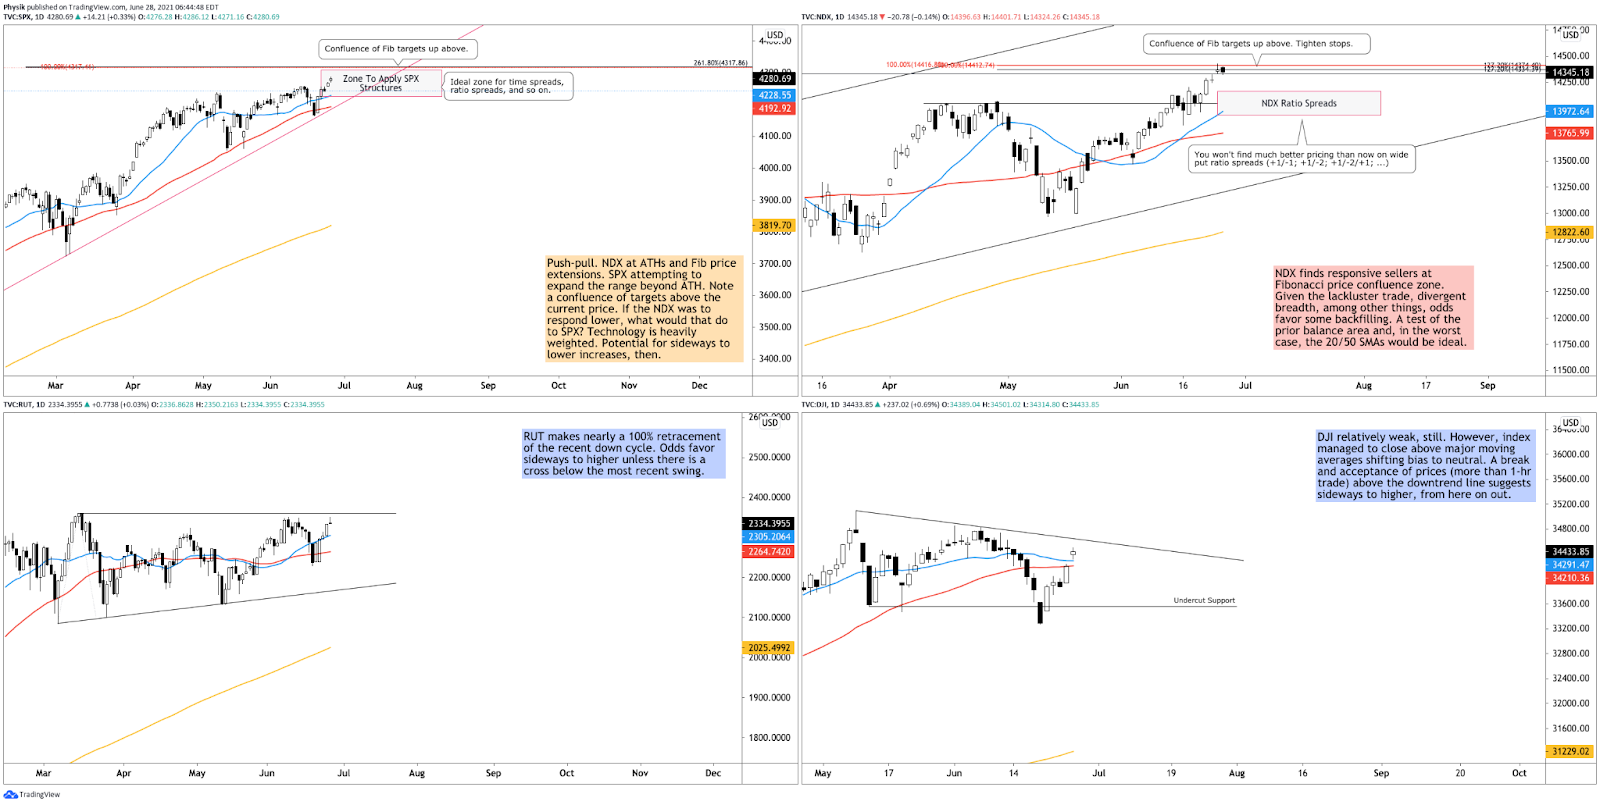
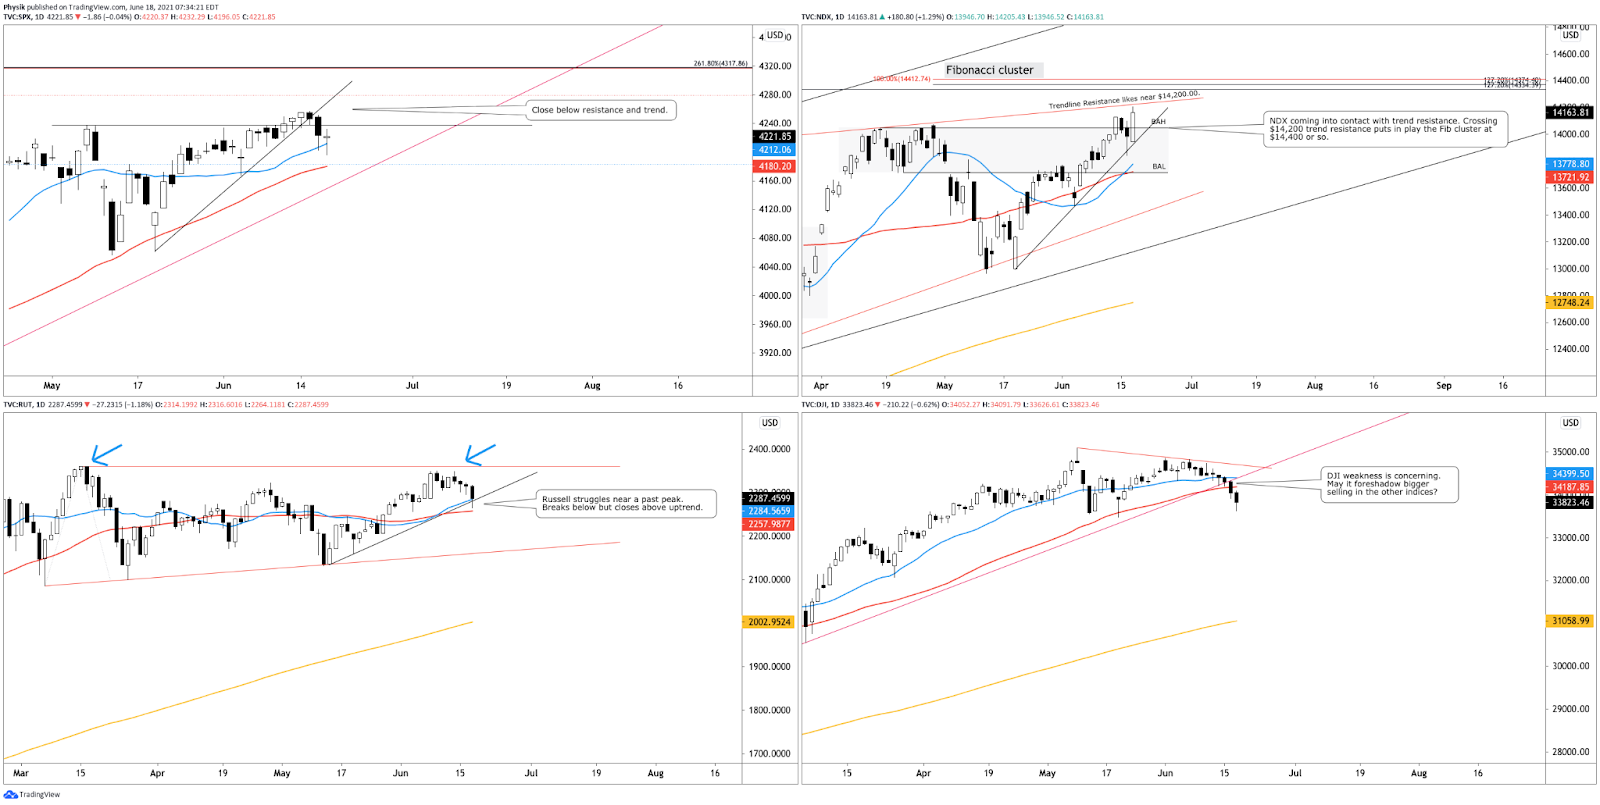
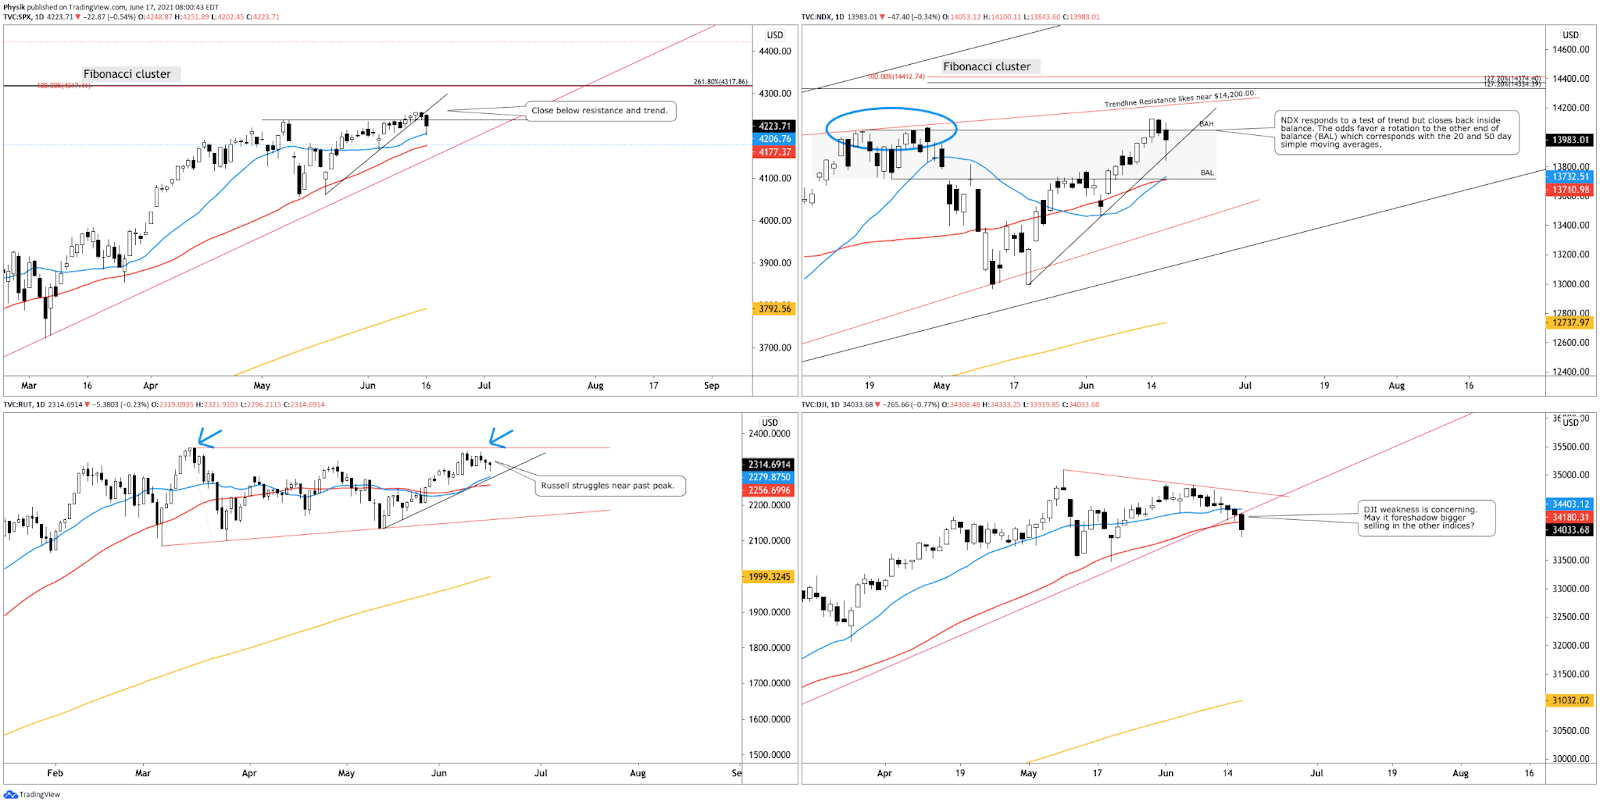
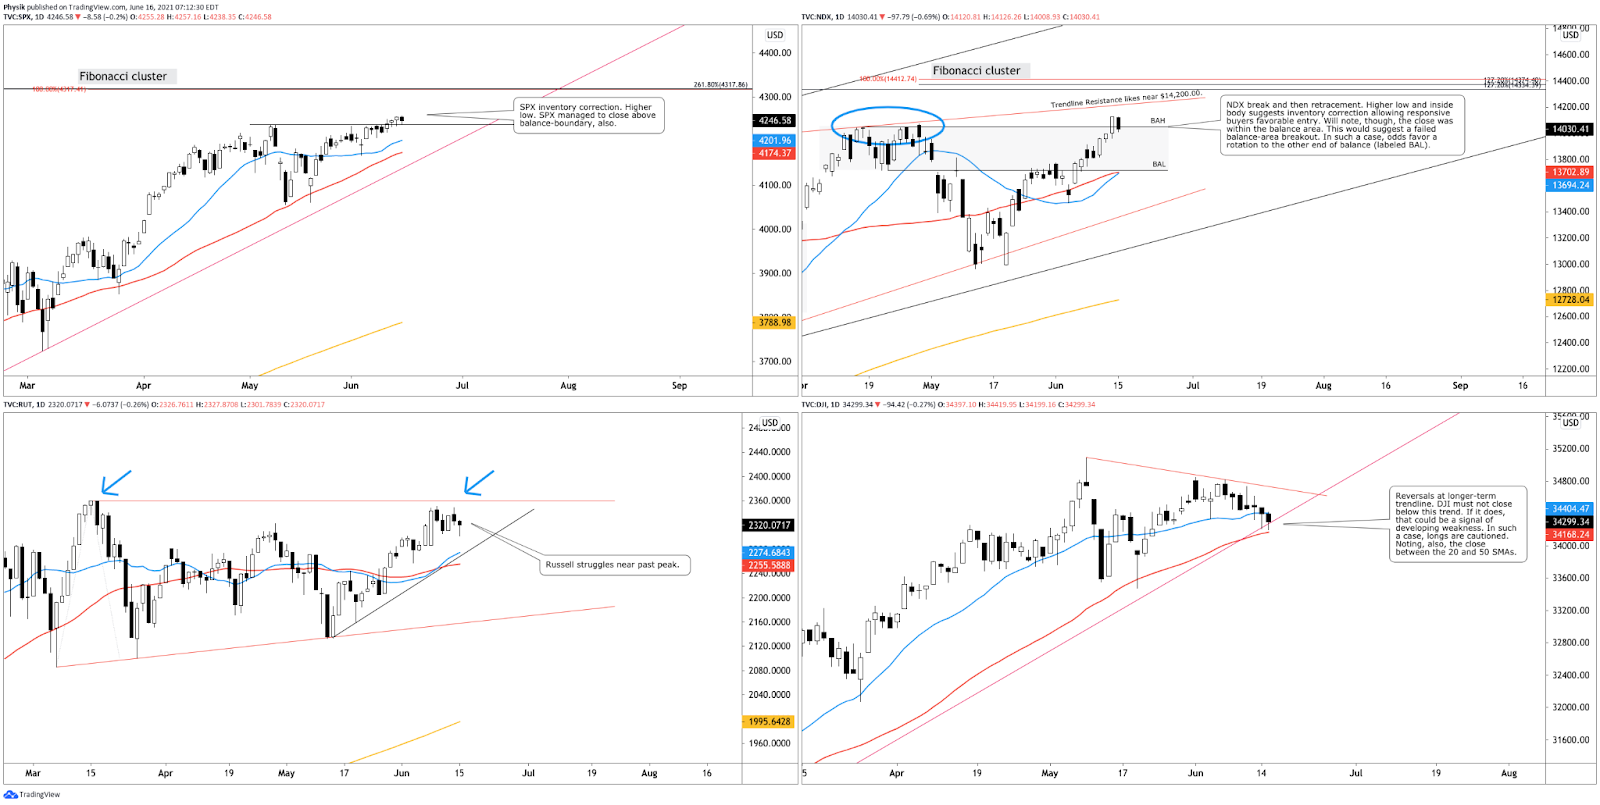
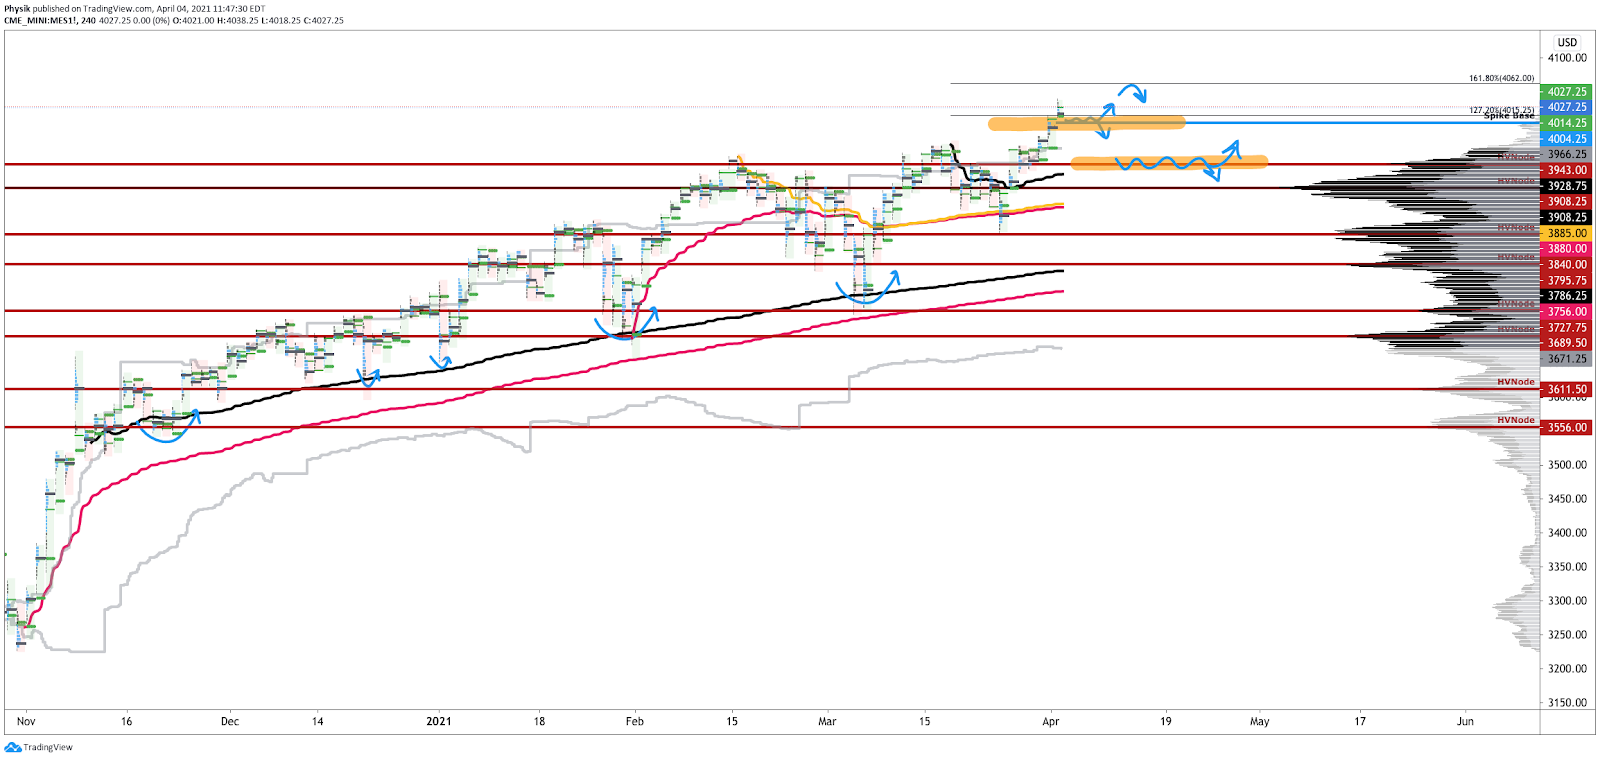
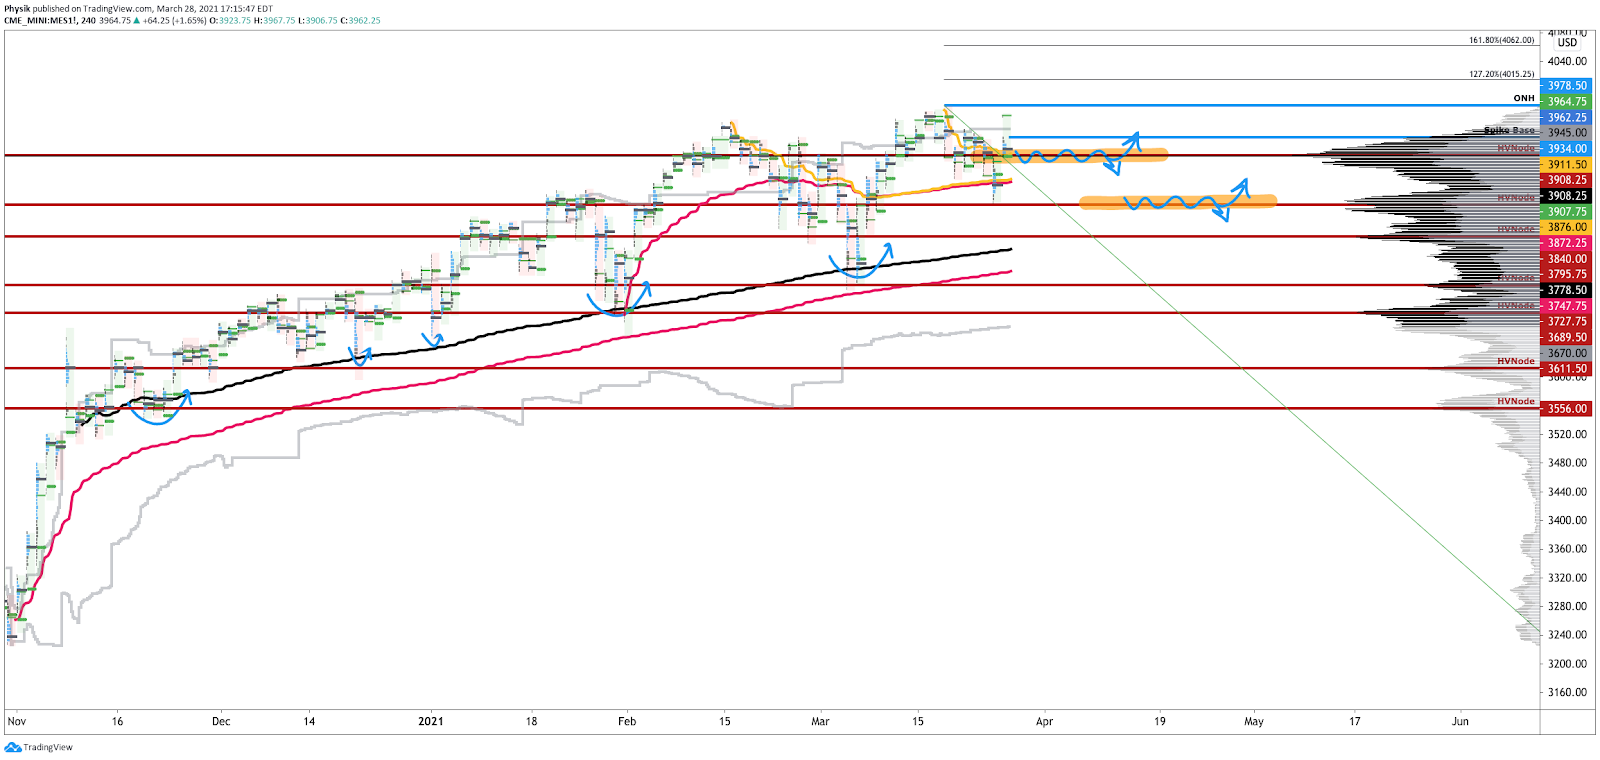
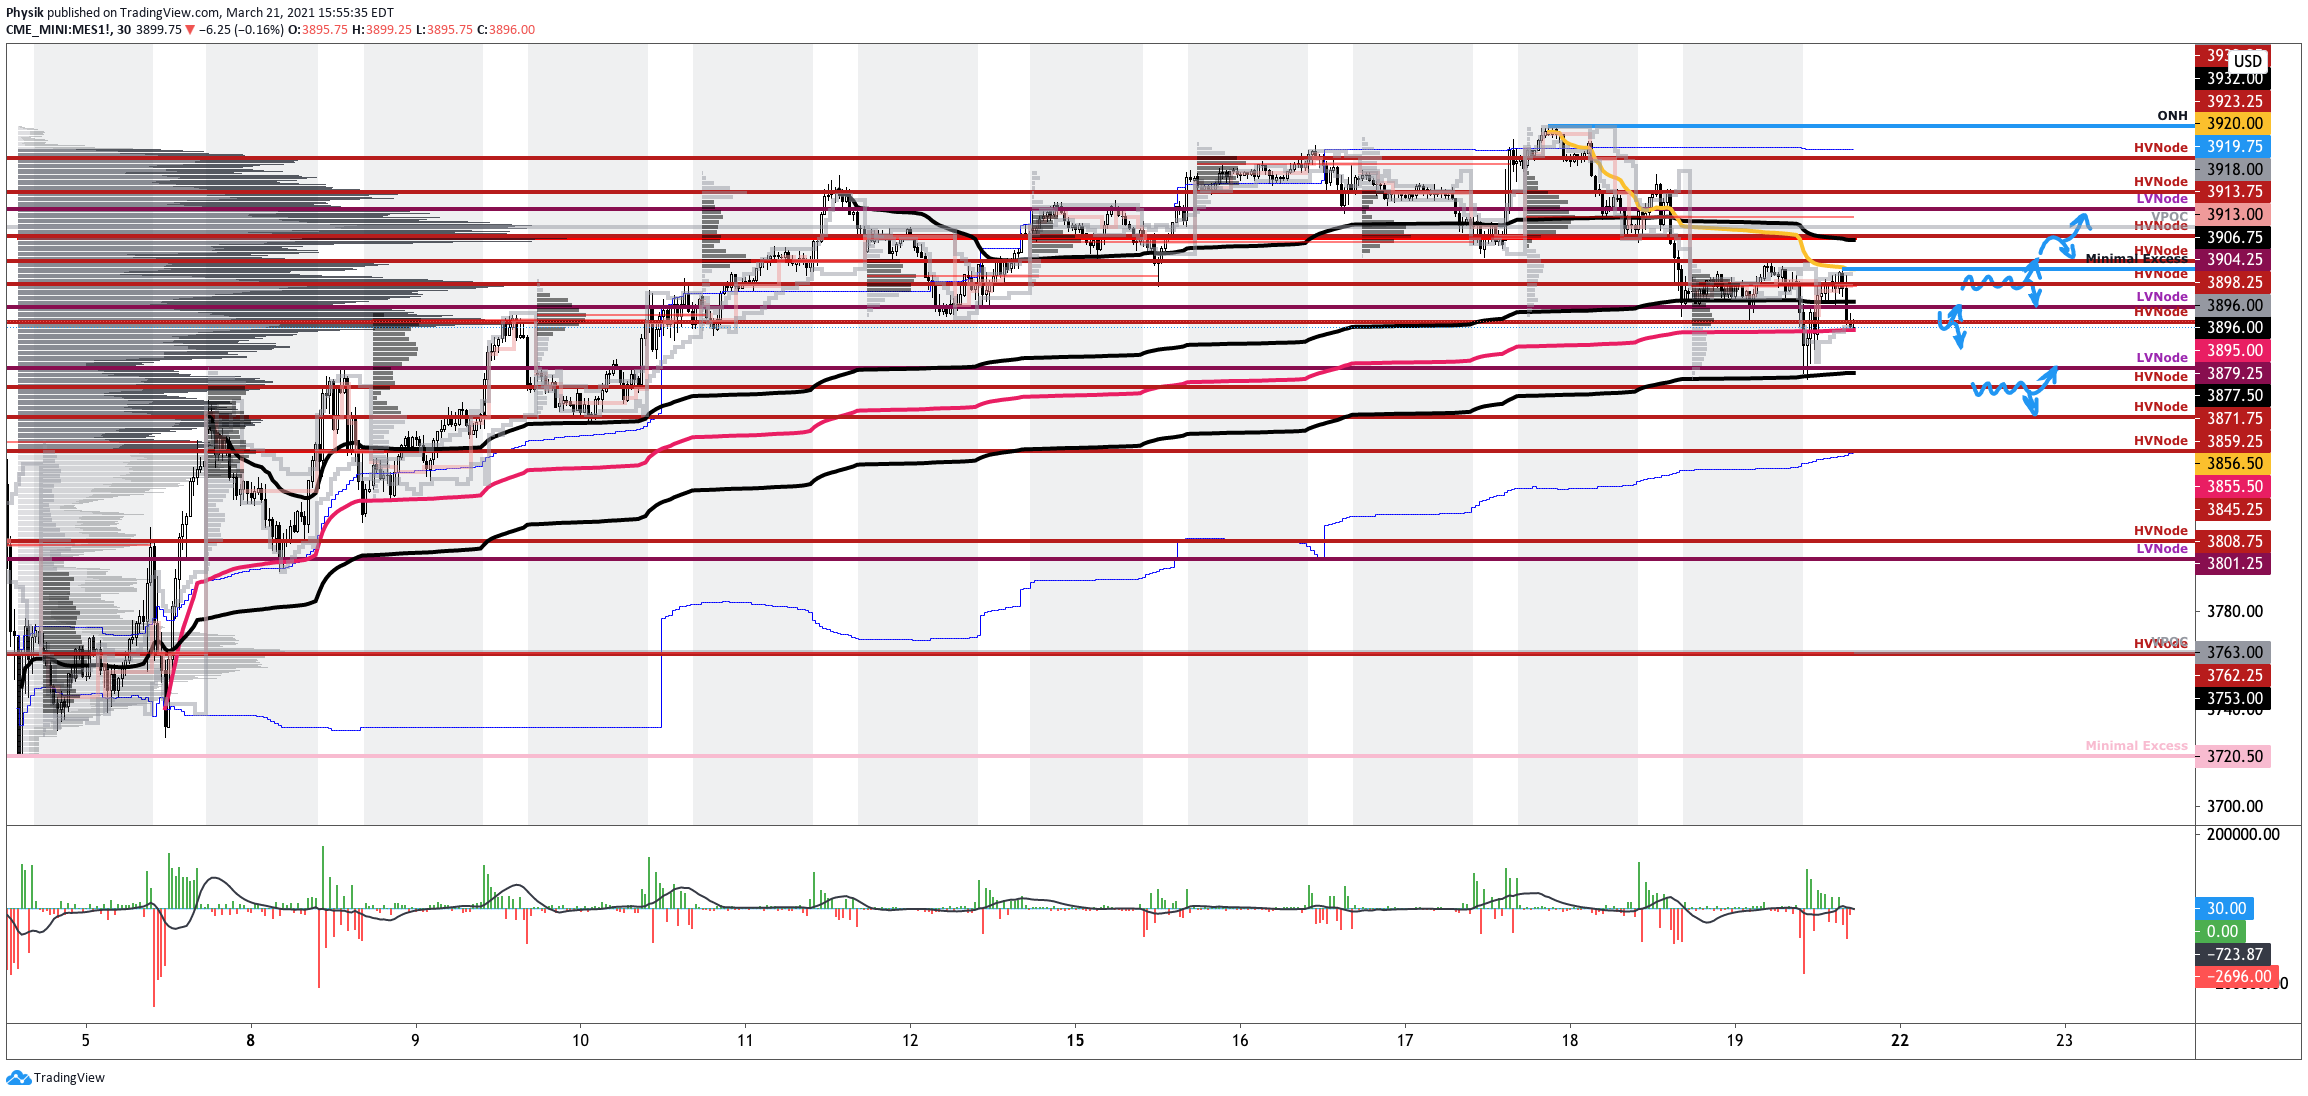
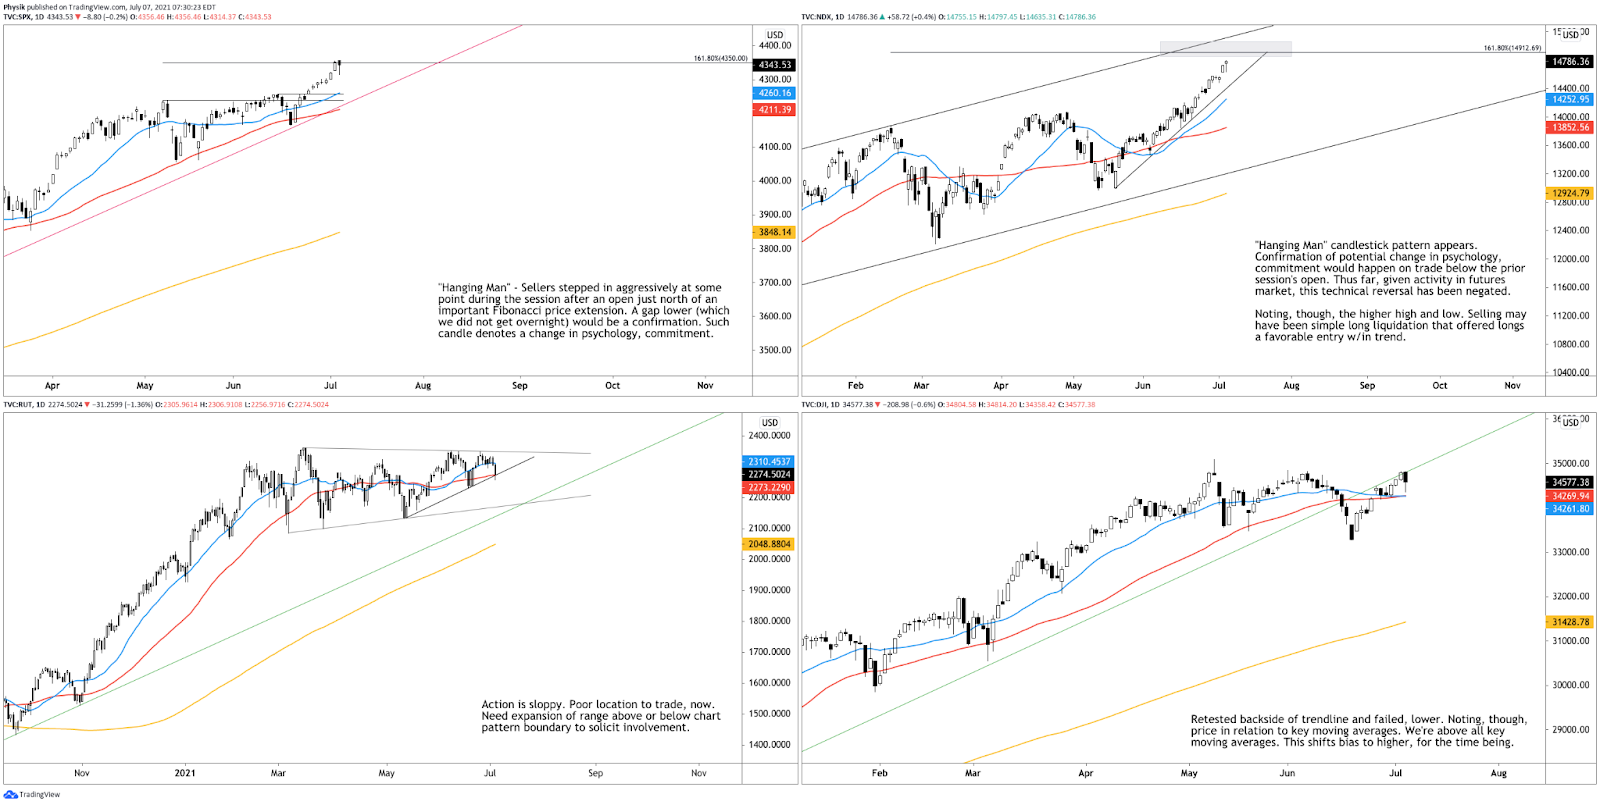
What To Expect: Wednesday’s regular session (9:30 AM – 4:00 PM EST) in the S&P 500 will likely open outside of prior value but inside of range. Such dynamic increases the potential for directional opportunity.
Adding, during the prior day’s regular trade, the best case outcome occurred, evidenced by a liquidation break that found responsive buyers at a key anchored Volume Weighted Average Price (VWAP). Thereafter, on lighter volume, the S&P 500 established value (i.e., evidenced by more than 30-minutes of trade) above the VWAP anchored from the $4,348.25 overnight high (ONH). This suggests the average buyer, since the peak, is in a winning position.
Liquidation Breaks: The profile shape suggests participants were “too” long and had poor location. Such dynamic offers responsive buyers (initiative sellers) favorable entry (exit).

More On Volume-Weighted Average Prices (VWAPs): A metric highly regarded by chief investment officers, among other participants, for quality of trade. Additionally, liquidity algorithms are benchmarked and programmed to buy and sell around VWAPs.

Overnight Rally Highs (Lows): Typically, there is a low historical probability associated with overnight rally-highs (lows) ending the upside (downside) discovery process.
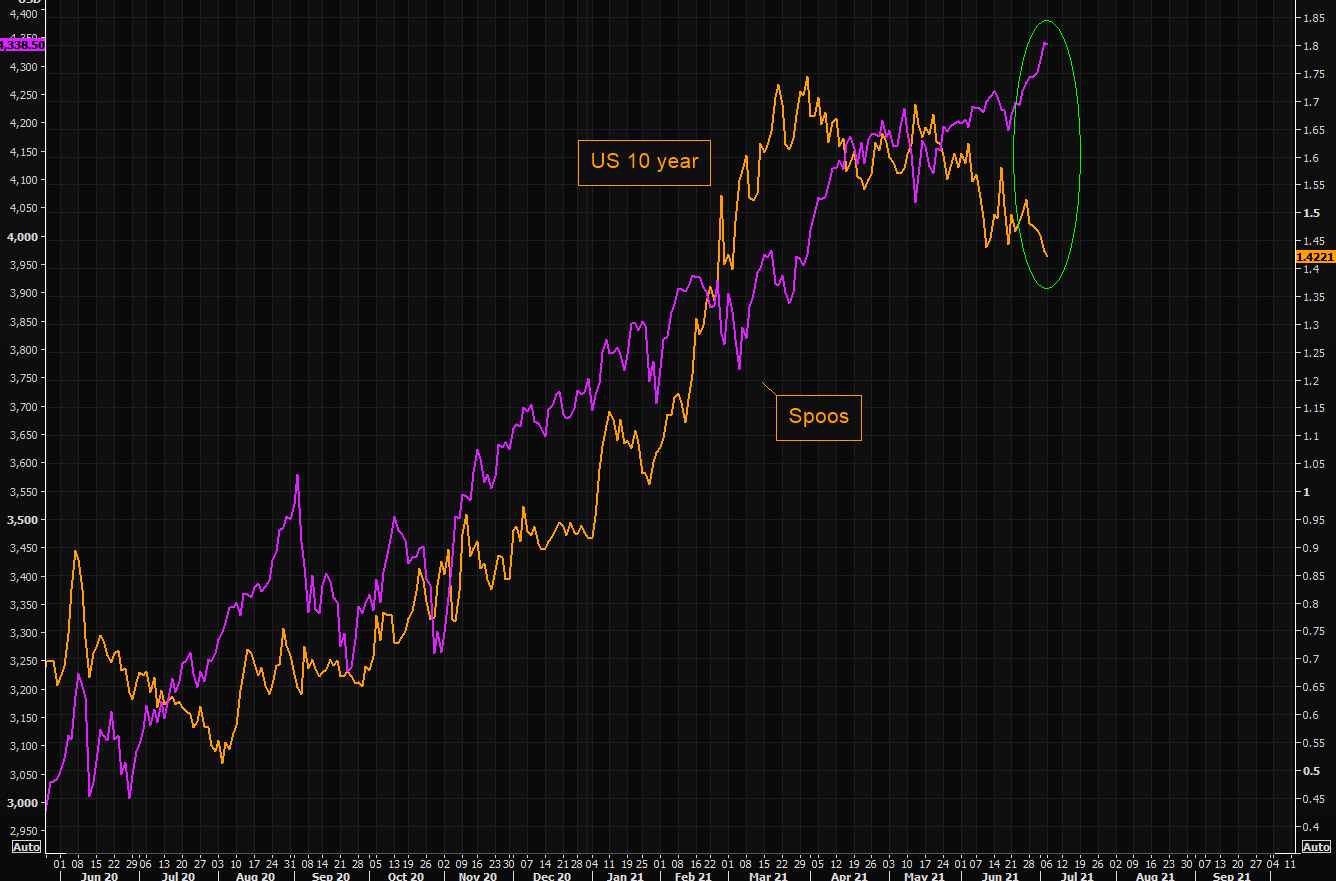
Adding, Tuesday’s liquidation break marked the start of balance as participants look to establish value at higher prices. This, in conjunction with a severe breakdown in yields, was a boon for the tech-heavy Nasdaq 100 which, unlike the S&P 500, closed higher.
Balance (Two-Timeframe Or Bracket): Rotational trade that denotes current prices offer favorable entry and exit. Balance-areas make it easy to spot a change in the market (i.e., the transition from two-time frame trade, or balance, to one-time frame trade, or trend).
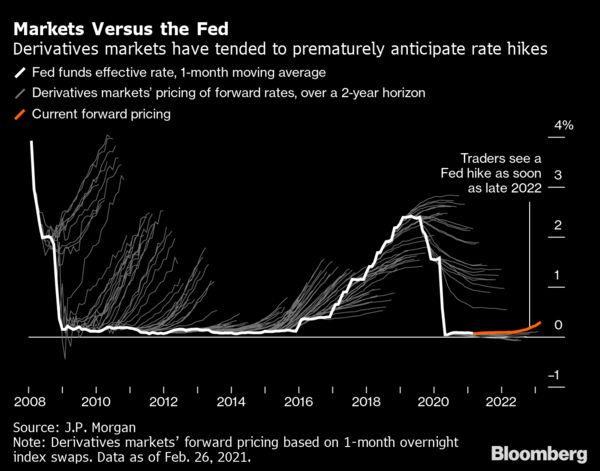
Low rates have to potential to increase the present value of future earnings making stocks, especially those that are high growth, more attractive. To note, inflation and rates move inversely to each other. Low rates stimulate demand for loans (i.e., borrowing money is more attractive). In conjunction with the rapid recovery, lower rates may solicit hawkish commentary as policymakers look to inhibit inflation.
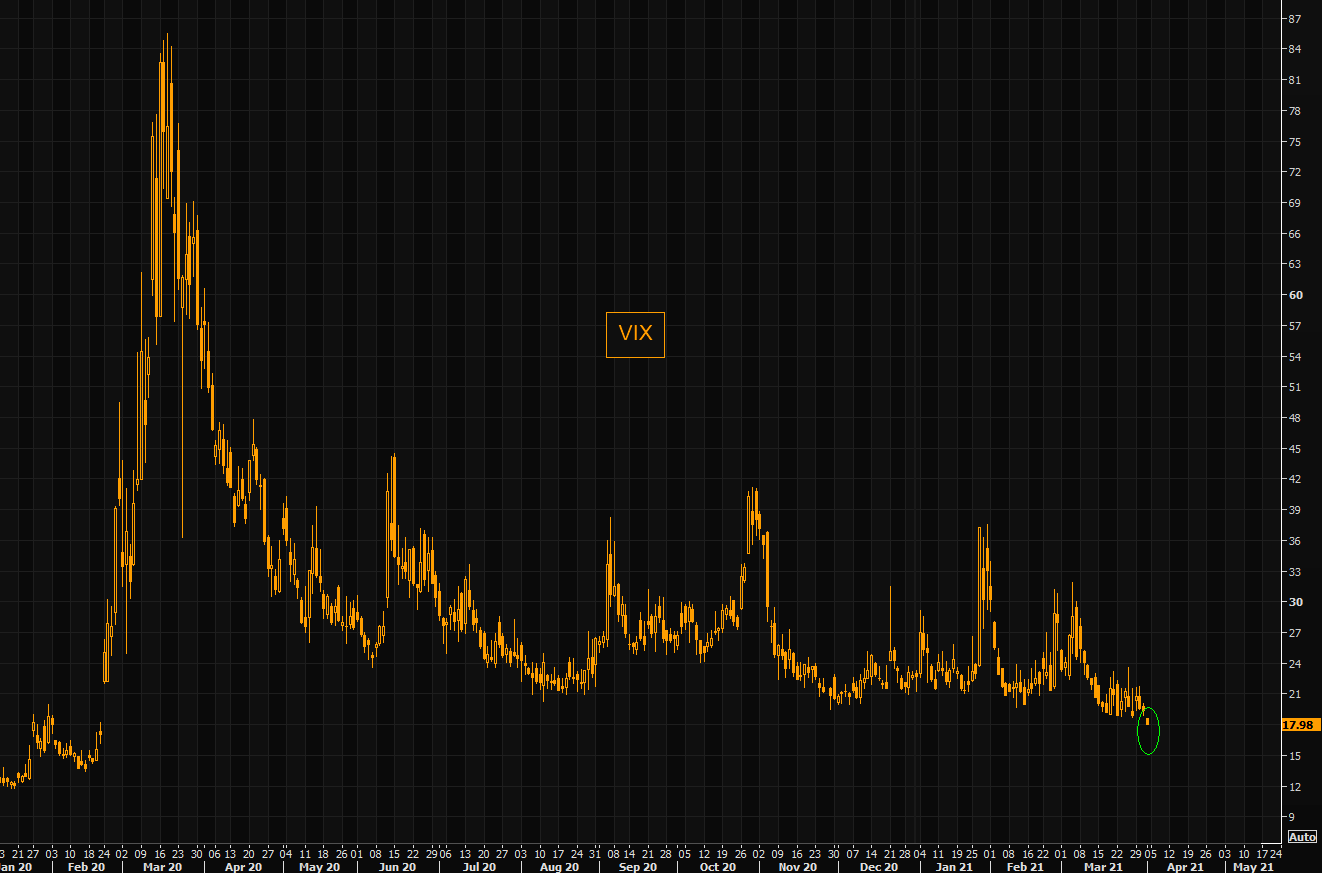
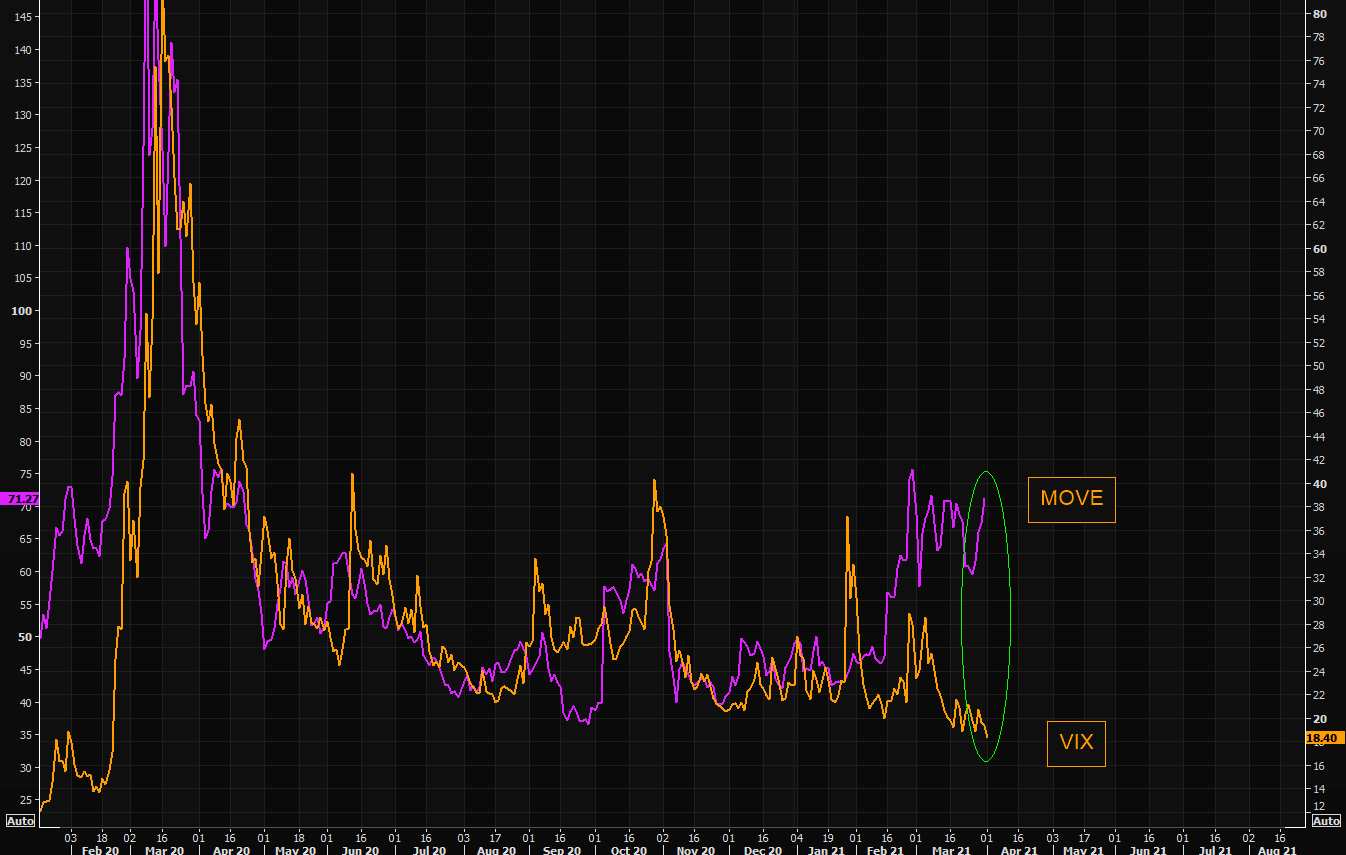
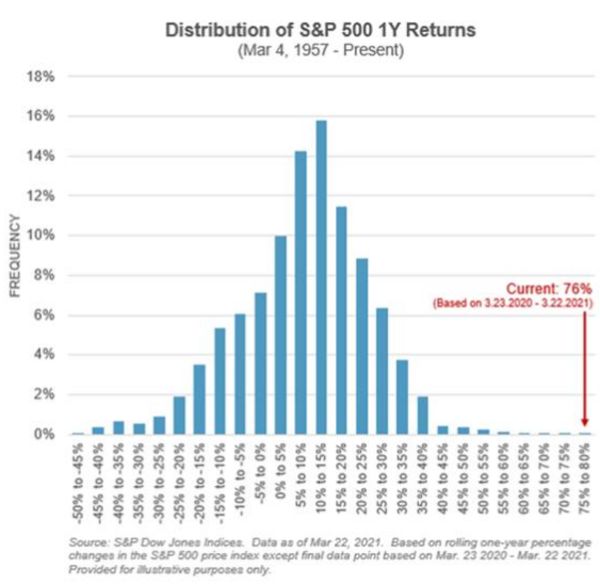
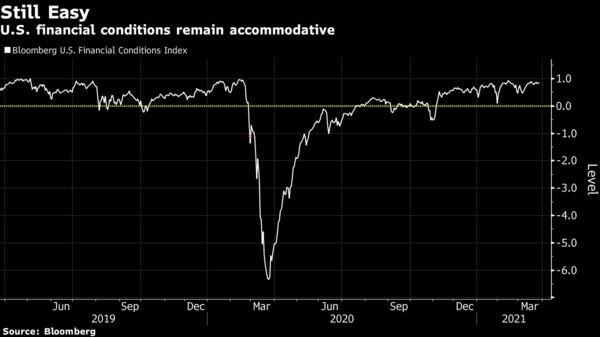
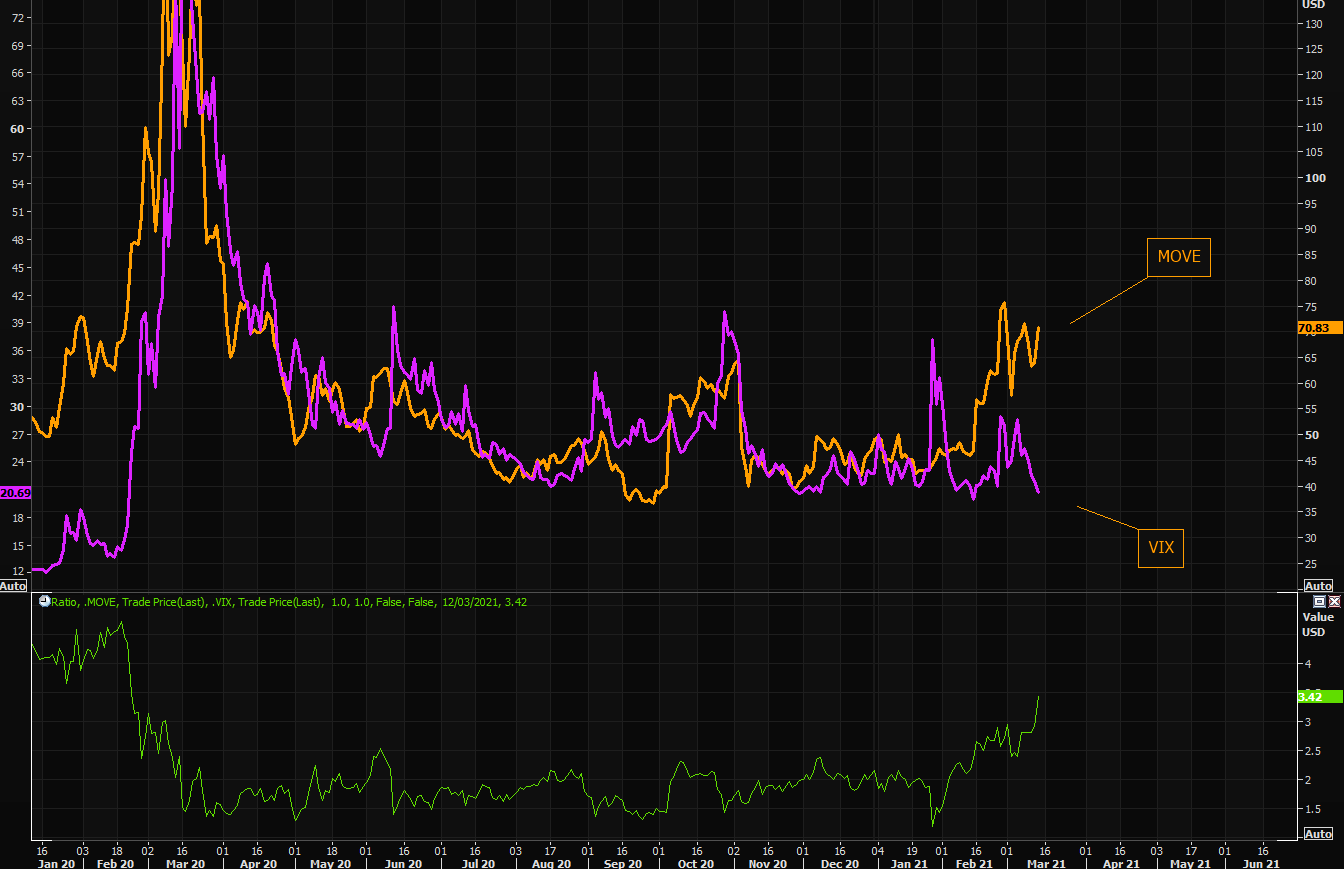
Important to note, also, as stated in the weekly commentary, the CBOE Volatility Index (INDEX: VIX), a measure of the stock market’s expectation of volatility, recently traded to its lowest level since February 2020. This dynamic has the potential to solicit the involvement of certain systematic strategies which can not only add fuel to the price rise but, potentially, exacerbate any future liquidation.
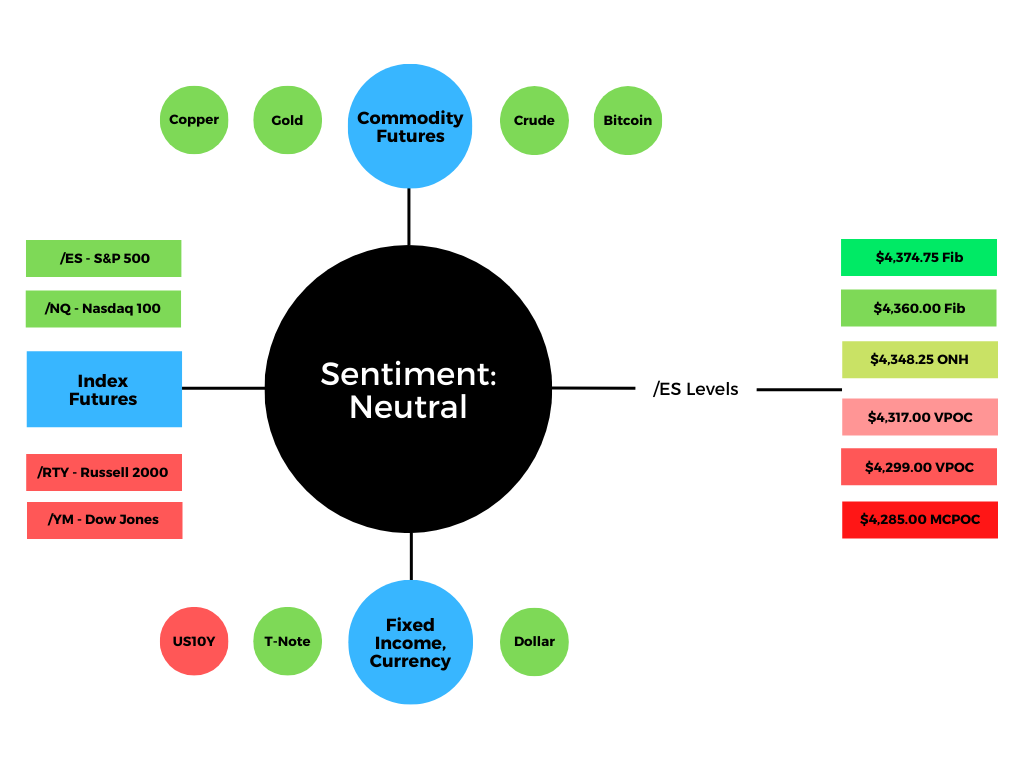
Putting it all together, for today, participants can trade from the following frameworks.
In the best case, the S&P 500 trades sideways or higher; activity above the yellow AVWAP (near $4,325.00) puts in play the $4,348.25 ONH. Thereafter, if higher, participants can look for responses at the $4,360.00 and $4,374.75 Fibonacci-derived price extensions.
In the worst case, the S&P 500 trades lower; activity below the yellow AVWAP (near $4,325.00) puts in play the $4,317.00 untested Point of Control (POC). Initiative trade beyond the POC could reach as low as the $4,299.00 POC and $4,285.00 micro-composite high volume area (HVNode).
POCs: POCs are valuable as they denote areas where two-sided trade was most prevalent. Participants will respond to future tests of value as they offer favorable entry and exit.

Volume Areas: A structurally sound market will build on past areas of high volume. Should the market trend for long periods of time, it will lack sound structure (identified as a low volume area which denotes directional conviction and ought to offer support on any test).

If participants were to auction and find acceptance into areas of prior low volume, then future discovery ought to be volatile and quick as participants look to areas of high volume for favorable entry or exit.

News And Analysis
Economy | America is hitting its vaccination ceiling. (Axios)
Economy | Mortgage applications sinking to lowest. (CNBC)
Markets | Nomura’s prime brokerage is pulling back. (BBG)
Economy | EU forecasts higher growth in eurozone. (REU)
Trade | Cargo glut at key shipping port has loosened. (Axios)
What People Are Saying
About
Renato founded Physik Invest after going through years of self-education, strategy development, and trial-and-error. His work reporting in the finance and technology space, interviewing leaders such as John Chambers, founder, and CEO, JC2 Ventures, Kevin O’Leary, businessman and Shark Tank host, Catherine Wood, CEO and CIO, ARK Invest, among others, afforded him the perspective and know-how very few come by.
Having worked in engineering and majored in economics, Renato is very detailed and analytical. His approach to the markets isn’t built on hope or guessing. Instead, he leverages the unique dynamics of time and volatility to efficiently act on opportunity.
Disclaimer
At this time, Physik Invest does not manage outside capital and is not licensed. In no way should the materials herein be construed as advice. Derivatives carry a substantial risk of loss. All content is for informational purposes only.