Categories
Commentary

Daily Brief For August 31, 2021

Market Commentary

Equity index futures, VIX sideways to higher. Commodities, bonds, dollar lower.

  • Ahead: Home prices, PMI, and more.
  • The path of least resistance is higher.

What Happened: U.S. stock index futures auctioned sideways to higher overnight alongside an absence in fundamental catalysts.

Ahead is data on the Case-Shiller national home price index (9:00 AM ET), Chicago PMI (9:45 AM ET), and consumer confidence index (10:00 AM ET).
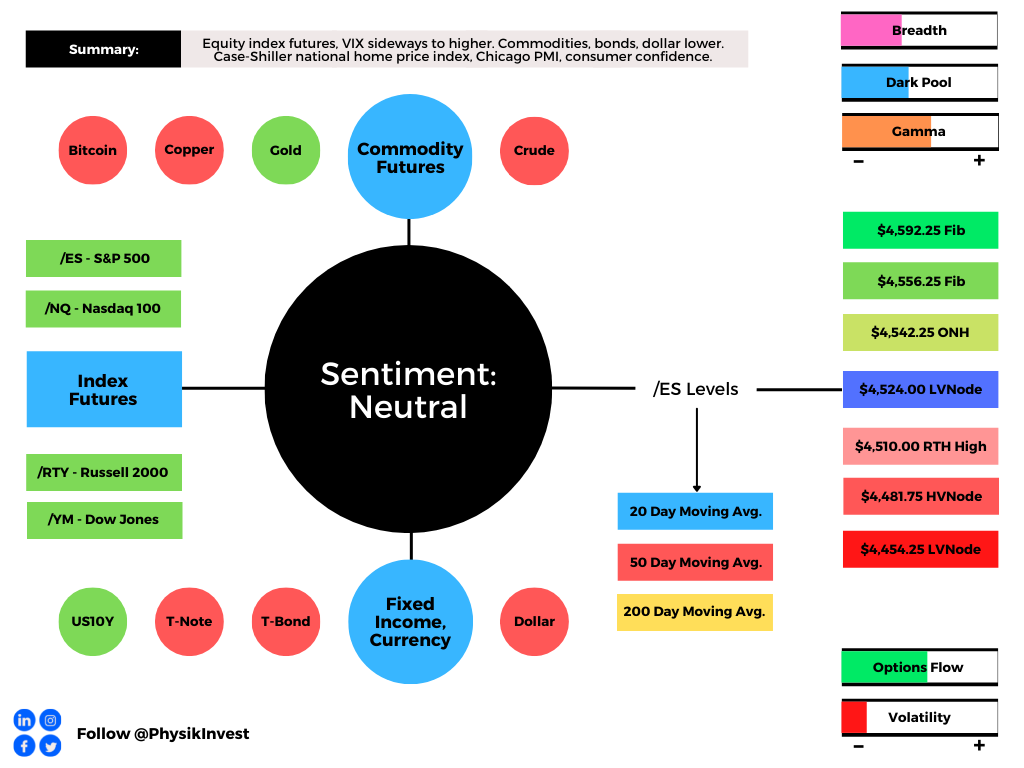
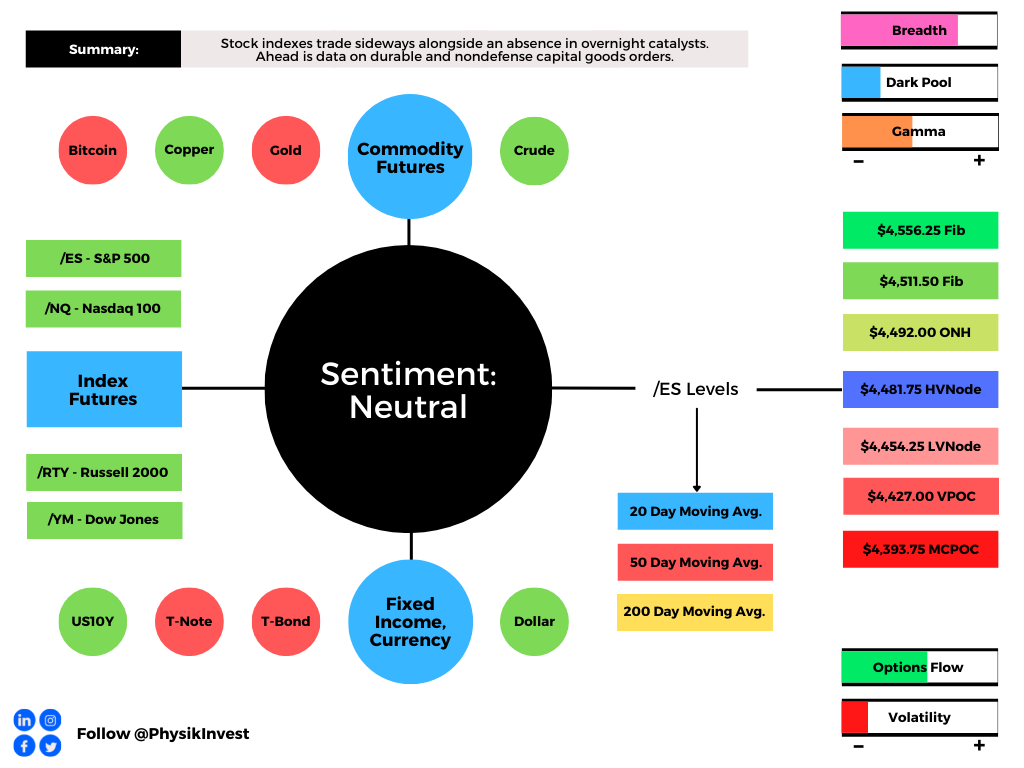
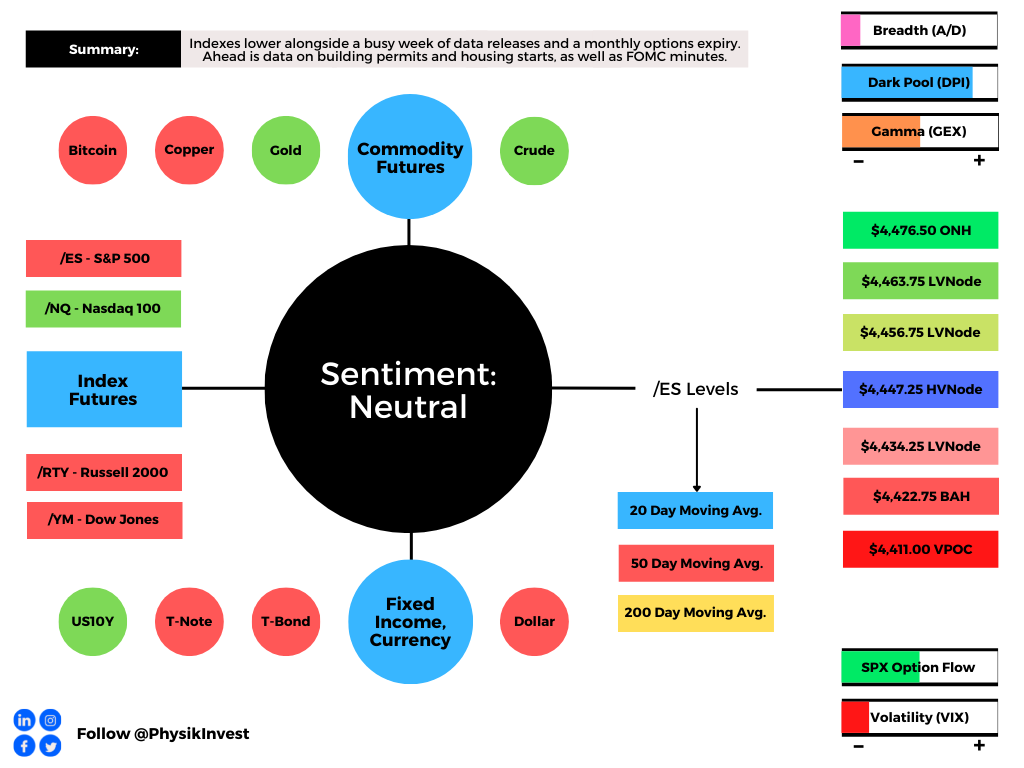
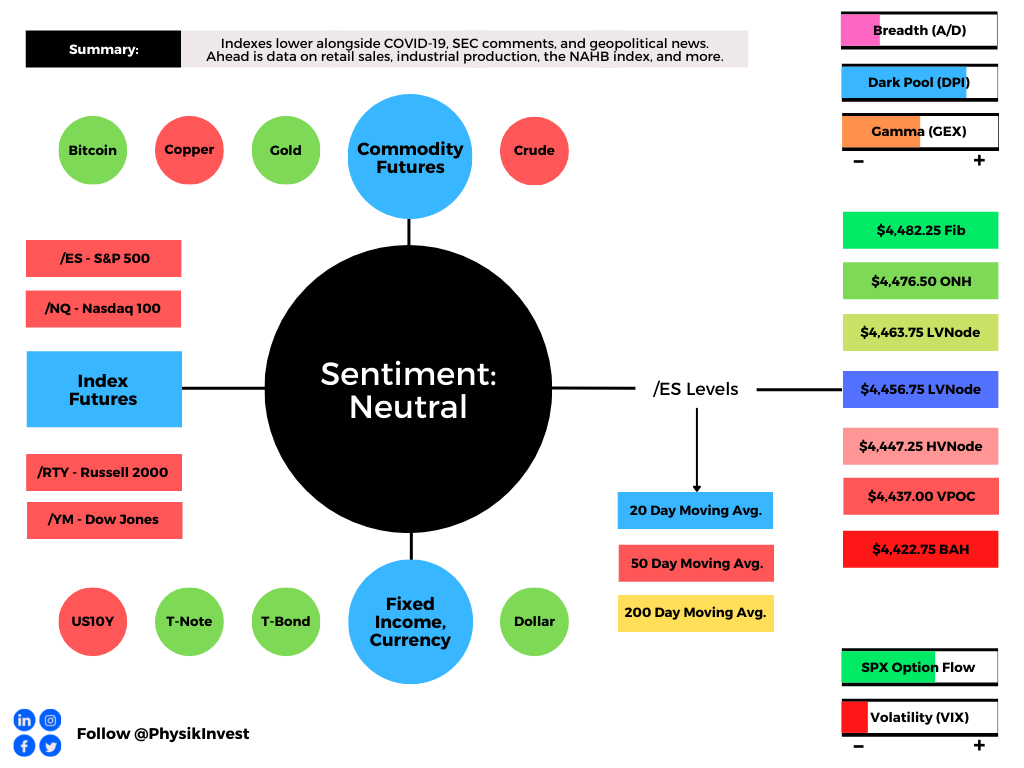
Graphic updated 6:30 AM ET. Sentiment Neutral if expected /ES open is inside of the prior day’s range. SqueezeMetrics Dark Pool Index (DIX) and Gamma (GEX) calculations are based on where the prior day’s reading falls with respect to the MAX and MIN of all occurrences available. A higher DIX is bullish. At the same time, the lower the GEX, the more (expected) volatility. SHIFT data used for S&P 500 (INDEX: SPX) options activity approximation. Note that options flow is sorted by the call premium spent; if more positive then more was spent on call options. Breadth reflects a reading of the prior day’s NYSE Advance/Decline indicator. VIX reflects a current reading of the CBOE Volatility Index (INDEX: VIX) from 0-100.

What To Expect: As of 6:30 AM ET, Tuesday’s regular session (9:30 AM – 4:00 PM EST) in the S&P 500 will likely open inside of prior-range and -value, suggesting a limited potential for immediate directional opportunity.

Adding, during the prior day’s regular trade, on weak intraday breadth and middling market liquidity metrics, the best case outcome occurred, evidenced by further price discovery. 

Price Discovery (One-Timeframe Or Trend): Market seeking new prices to establish value, or acceptance (i.e., more than 30-minutes of trade at a particular price level). 

Despite the low volume, p-shaped profile structures (which denote short covering), and a lack of intraday range expansion, the aforementioned trade is significant because it suggests continued bullishness after a v-pattern recovery.

V-Pattern: A pattern that forms after a market establishes a high, retests some support, and then breaks above said high. In most cases, this pattern portends continuation.

Further, the aforementioned trade is happening in the context of non-seasonally aligned inflows, impactful options market dynamics, divergent sentiment, and fears of a mid-cycle transition. 

The implications of these themes on price are contradictory; to elaborate, on one hand, August, over the past 25 years, has historically been the largest month for equity outflows. According to Goldman Sachs Group Inc’s (NYSE: GS) Scott Rubner, “We have seen none of these outflows and it has been buying the dip (TINA).”

Given this divergence from the norm, an advance (such as the one we’re in presently) is not “welcomed and may lead to a quick right tail edging … [as] option volume notional is 120% of stock volume notional.”

To put it simply, 75% of the options being traded expire within two weeks. The related hedging flows of these directionally sensitive options can represent an increased share of volume in underlying stocks.

To put it simply, option flows impact the underlying’s price, markedly.

We couple this so-called right-tail hedging with the structural positioning that drives the market through the three factors – the change in the underlying price (gamma), implied volatility (vanna), and time (charm) – that are well known to impact an options exposure to directional risk or delta.

“Charm is a major driver for support in the markets,” said Cem Karsan of Kai Volatility Advisors. “All of that support is leading up to and accelerating into that Monday-Wednesday window” ahead of OpEx. “And then the window really opens for lack of support. It’s not like there’s a bunch of selling all of a sudden. It’s a window of non-strength; a lack of these supportive flows that have been there prior.”

With the August monthly options expiration (OPEX) behind, the focus shifts to September, at and around the same time Morgan Stanley’s (NYSE: MS) Michael Wilson expects a formal signal – which would align with Karsan’s window of non-strength – on the taper of asset purchases, leading to a mid-cycle transition and 10% S&P 500 correction.

Options Expiration (OPEX): Option expiries mark an end to pinning (i.e, the theory that market makers and institutions short options move stocks to the point where the greatest dollar value of contracts will expire worthless) and the reduction dealer gamma exposure.

“Assuming a stable equity risk premium at 345bp, P/Es would fall to 19x, or 10% lower.”
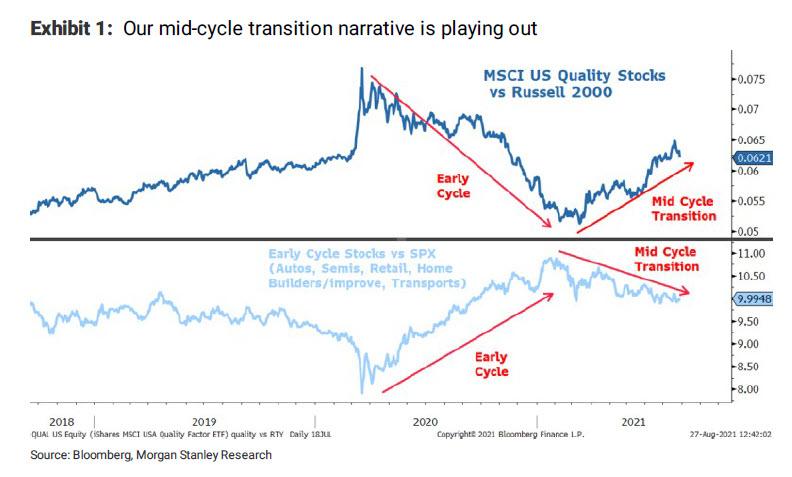
Graphic: Morgan Stanley unpacks mid-cycle transition thesis. Image retrieved from ZeroHedge.

Moreover, for today, participants may make use of the following frameworks.

In the best case, the S&P 500 trades sideways or higher; activity above the $4,524.00 low volume area (LVNode) pivot puts in play the $4,542.25 overnight high (ONH). Initiative trade beyond the ONH could reach as high as the $4,556.25 and $4,592.25 Fibonacci extensions.

In the worst case, the S&P 500 trades lower; activity below the $4,524.00 LVNode puts in play $4,510.00, the convergence of a regular-trade high and LVNode. Initiative trade beyond the $4,510.00 figure could reach as low as the $4,481.75 high volume area (HVNode) and $4,454.25 LVNode.

To note, the $4,454.25 LVNode corresponds with an anchored volume-weighted average price (VWAP), a metric highly regarded by chief investment officers, among other participants, for quality of trade. Additionally, liquidity algorithms are benchmarked and programmed to buy and sell around VWAPs.

Overnight Rally Highs (Lows): Typically, there is a low historical probability associated with overnight rally-highs (lows) ending the upside (downside) discovery process.

Volume Areas: A structurally sound market will build on past areas of high volume. Should the market trend for long periods of time, it will lack sound structure (identified as a low volume area which denotes directional conviction and ought to offer support on any test). 

If participants were to auction and find acceptance into areas of prior low volume, then future discovery ought to be volatile and quick as participants look to areas of high volume for favorable entry or exit.
Graphic: 65-minute profile chart of the Micro E-mini S&P 500 Futures updated 6:30 AM ET.

News And Analysis

Inventories continue to constrain home purchase activity.

The Fed now risking too-slow taper after too-fast in 2013.

A fast lane for the ECB to taper purchases ahead of Fed.

OPEC+ faces mixed market signals after U.S. pressures.

Capital raises from infotech sector simmering down July.

Fitch Ratings unpacks commodities and energy research.

Battery storage capacity likely to double inside California.

Moderna creates twice as many antibodies as Pfizer vax.

What People Are Saying

About

After years of self-education, strategy development, and trial-and-error, Renato Leonard Capelj began trading full-time and founded Physik Invest to detail his methods, research, and performance in the markets. 

Additionally, Capelj is a finance and technology reporter. Some of his biggest works include interviews with leaders such as John Chambers, founder and CEO, JC2 Ventures, Kevin O’Leary, businessman and Shark Tank host, Catherine Wood, CEO and CIO, ARK Invest, among others.

Disclaimer

At this time, Physik Invest does not manage outside capital and is not licensed. In no way should the materials herein be construed as advice. Derivatives carry a substantial risk of loss. All content is for informational purposes only.

Categories
Commentary

Daily Brief For August 30, 2021

Market Commentary

Equity index futures, bonds, dollar, VIX sideways to higher. Commodities were mixed.

  • Positioning lightened. Ample liquidity.
  • Ahead: Data on pending home sales.

What Happened: U.S. stock index futures auctioned sideways to higher overnight alongside news that the Federal Reserve would not make changes to its policy.

Ahead is data on pending home sales (10:00 AM ET).

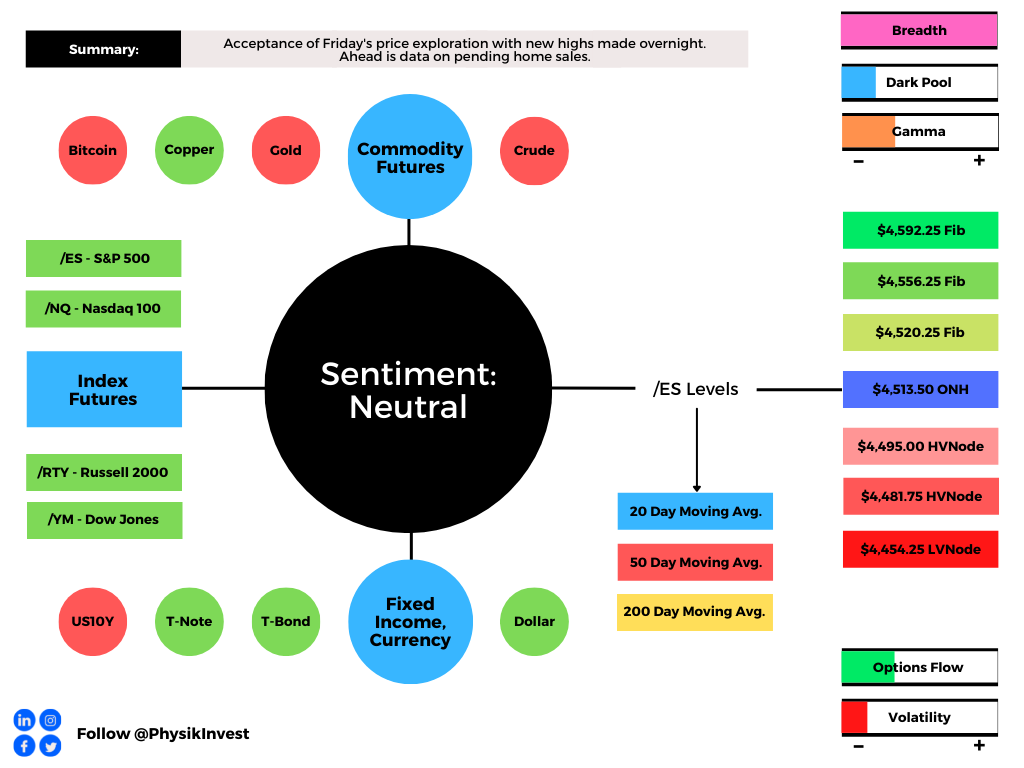
Graphic updated 6:30 AM ET. Sentiment Neutral if expected /ES open is inside of the prior day’s range. SqueezeMetrics Dark Pool Index (DIX) and Gamma (GEX) calculations are based on where the prior day’s reading falls with respect to the MAX and MIN of all occurrences available. A higher DIX is bullish. At the same time, the lower the GEX, the more (expected) volatility. SHIFT data used for S&P 500 (INDEX: SPX) options activity approximation. Note that options flow is sorted by the call premium spent; if more positive then more was spent on call options. Breadth reflects a reading of the prior day’s NYSE Advance/Decline indicator. VIX reflects a current reading of the CBOE Volatility Index (INDEX: VIX) from 0-100.

What To Expect: As of 6:30 AM ET, Monday’s regular session (9:30 AM – 4:00 PM EST) in the S&P 500 will likely open near prior-range and -value, suggesting a more limited potential for immediate directional opportunity.

Adding, during the prior day’s regular trade, on strong intraday breadth and lackluster market liquidity metrics, the best case outcome occurred, evidenced by new all-time highs in the S&P 500 and Nasdaq 100. This is significant because it suggests continued bullishness after a v-pattern recovery.

V-Pattern: A pattern that forms after a market establishes a high, retests some support, and then breaks above said high. In most cases, this pattern portends continuation.

Further, the aforementioned trade is happening in the context of the Federal Reserve’s commitment to stay the course with respect to monetary policy. This theme’s implications on price are supportive; to elaborate, the absence of a rate hike or taper, alongside low bond and equity market volatility, among other things, suggests liquidity will remain ample.

The key for this week is U.S. jobs data later; those metrics will allow participants to better contextualize the taper timeline. At the same time, there’s been a cooling amongst some positioning metrics, also.

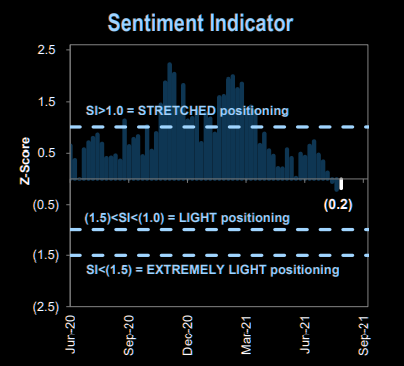
Graphic: Goldman Sachs Group Inc (NYSE: GS) Sentiment Indicator. According to The Market Ear, the “indicator measures stock positioning across retail, institutional, and foreign investors versus the past 12 months. Readings below -1.0 or above +1.0 indicate extreme positions that are significant in predicting future returns.”

Moreover, for today, given poor structure, a divergent volume delta Friday, as well as a decline in metrics like DIX and GEX, the odds of significant upside volatility are lower. Still, participants may make use of the following objective frameworks for today’s trade.

In the best case, the S&P 500 trades sideways or higher; activity above the $4,513.50 overnight high (ONH) puts in play the $4,520.25 Fibonacci extension. Initiative trade beyond the Fibonacci level could reach as high as $4,556.25 and $4,592.25, two other key Fibonacci extensions.

In the worst case, the S&P 500 trades lower; activity below the $4,513.50 ONH puts in play the $4,495.00 high volume area (HVNode). Initiative trade beyond the $4,495.00 HVNode could reach as low as the $4,481.75 HVNode and $4,454.25 LVNode, or lower. 

To note, the $4,454.25 LVNode corresponds with an anchored volume-weighted average price (VWAP), a metric highly regarded by chief investment officers, among other participants, for quality of trade. Additionally, liquidity algorithms are benchmarked and programmed to buy and sell around VWAPs.

Overnight Rally Highs (Lows): Typically, there is a low historical probability associated with overnight rally-highs (lows) ending the upside (downside) discovery process.

Volume Areas: A structurally sound market will build on past areas of high volume. Should the market trend for long periods of time, it will lack sound structure (identified as a low volume area which denotes directional conviction and ought to offer support on any test). 

If participants were to auction and find acceptance into areas of prior low volume, then future discovery ought to be volatile and quick as participants look to areas of high volume for favorable entry or exit.

Volume Delta: Buying and selling power as calculated by the difference in volume traded at the bid and offer.

DIX: For every buyer is a seller (usually a market maker). Using DIX — which is derived from short sales (i.e., liquidity provision on the market-making side) — we can measure buying pressure.

Gamma: Gamma is the sensitivity of an option to changes in the underlying price. Dealers that take the other side of options trades hedge their exposure to risk by buying and selling the underlying. When dealers are short-gamma, they hedge by buying into strength and selling into weakness. When dealers are long-gamma, they hedge by selling into strength and buying into weakness. The former exacerbates volatility. The latter calms volatility.
Graphic: 65-minute profile chart of the Micro E-mini S&P 500 Futures updated 6:30 AM ET.

News And Analysis

Banks are effectively sterilizing central bank liquidity.

Morgan Stanley eyes mid-cycle transition, correction.

An options turn upheavals into mid-month sure thing.

Ida made landfall in Louisiana, stronger than Katrina.

Sustained vaccine demand to support pharma growth.

Billionaire Paulson is calling cryptocurrency a bubble.

Crypto nomads – surfing the world for risk and profit.

Cadano’s Ada is the latest cryptocurrency surging up.

What People Are Saying

About

After years of self-education, strategy development, and trial-and-error, Renato Leonard Capelj began trading full-time and founded Physik Invest to detail his methods, research, and performance in the markets. 

Additionally, Capelj is a finance and technology reporter. Some of his biggest works include interviews with leaders such as John Chambers, founder and CEO, JC2 Ventures, Kevin O’Leary, businessman and Shark Tank host, Catherine Wood, CEO and CIO, ARK Invest, among others.

Disclaimer

At this time, Physik Invest does not manage outside capital and is not licensed. In no way should the materials herein be construed as advice. Derivatives carry a substantial risk of loss. All content is for informational purposes only.
Categories
Commentary

Daily Brief For August 27, 2021

Market Commentary

Equity index futures, commodities, bonds, and the dollar were sideways to higher overnight.

  • Some complacency? Let’s talk it out.
  • Ahead: Misc data and Jackson Hole.
  • Building a base for directional move.

What Happened: U.S. stock index futures auctioned higher overnight as investors continued to position themselves to better act on new monetary policy information.

Ahead is data on personal income (8:30 AM ET), consumer spending (8:30 AM ET), core PCE (8:30 AM ET), trade in goods (8:30 AM ET), University of Michigan sentiment (10:00 AM ET). Later, Federal Reserve Chair Jerome Powell speaks at the Jackson Hole Economic Symposium (10:00 AM ET).

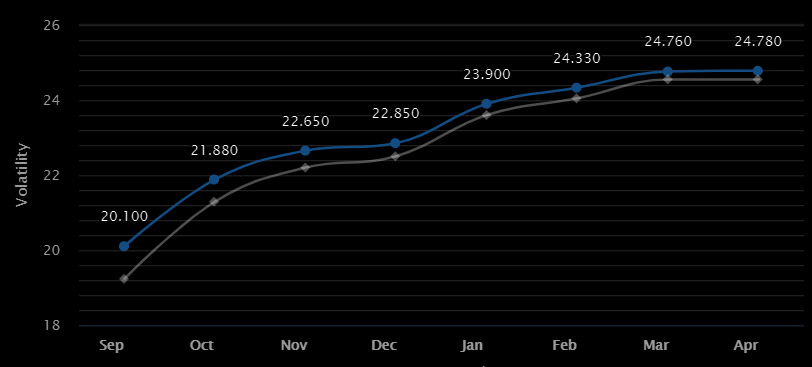
Graphic updated 6:30 AM ET. Sentiment Neutral if expected /ES open is inside of the prior day’s range. SqueezeMetrics Dark Pool Index (DIX) and Gamma (GEX) calculations are based on where the prior day’s reading falls with respect to the MAX and MIN of all occurrences available. A higher DIX is bullish. At the same time, the lower the GEX, the more (expected) volatility. SHIFT data used for S&P 500 (INDEX: SPX) options activity approximation. Note that options flow is sorted by the call premium spent; if more positive then more was spent on call options. Breadth reflects a reading of the prior day’s Advance/Decline indicator. VIX reflects a current reading of the CBOE Volatility Index (INDEX: VIX) from 0-100.

What To Expect: As of 6:30 AM ET, Friday’s regular session (9:30 AM – 4:00 PM EST) in the S&P 500 will likely open inside of prior-range and -value, suggesting a limited potential for immediate directional opportunity.

Adding, during the prior day’s regular trade, on weak intraday breadth and divergent market liquidity metrics, the worst-case outcome occurred, evidenced by trade below the $4,484.25 high volume area (HVNode) pivot. This is significant because S&P 500 printed prices in a pocket of low-volume left behind by strong initiative buying earlier in the week. Given the overnight retracement, the index is back to basing for what may be strong directional resolve.

Balance (Two-Timeframe Or Bracket) Trade Is In Play: Rotational trade that denotes current prices offer favorable entry and exit. Balance-areas make it easy to spot a change in the market (i.e., the transition from two-time frame trade, or balance, to one-time frame trade, or trend). 

Modus operandi is responsive trade (i.e., fade the edges), rather than initiative trade (i.e., play the break).

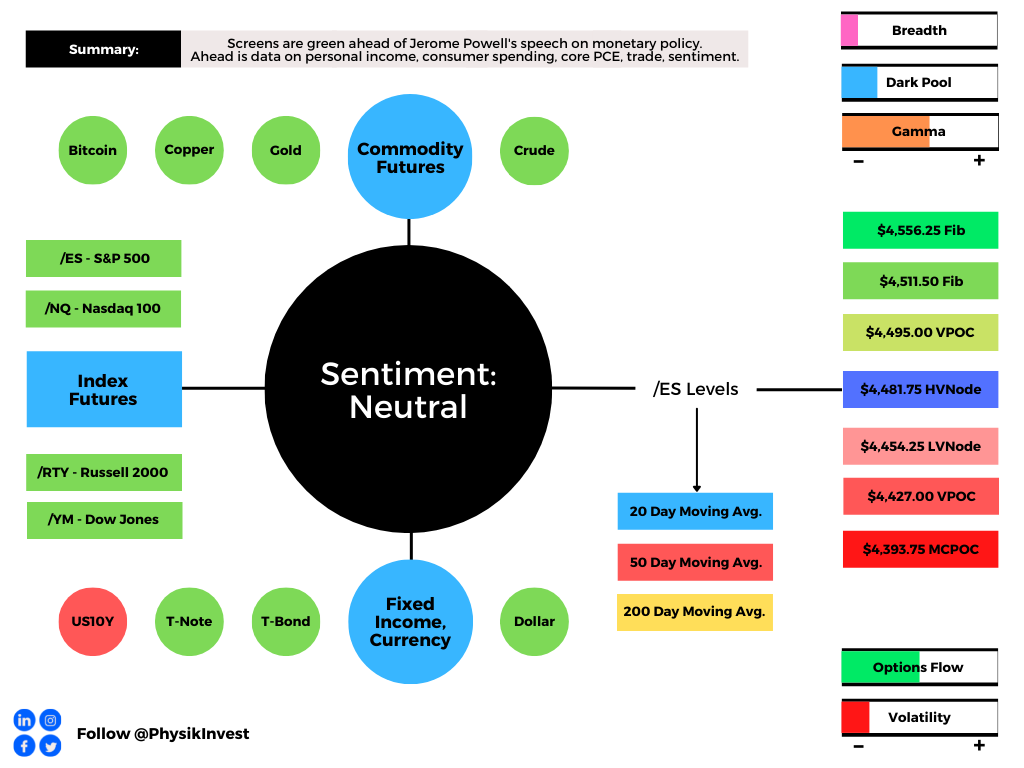
Further, the aforementioned trade is happening in the context of the important Jackson Hole event and a shift higher in the VIX futures terms structure into and through the August 26-28 event. The implications of these events on price are contradictory; to elaborate, extended positioning – which alone suggests risks are asymmetric – coupled with a pronounced shift in shorter-dated VIX expiries, warns of elevated near-term risks for equity market stability.

Graphic: VIX term structure shifts higher with the biggest move happening at the short end of the curve from The Market Ear.

Moreover, for today, participants may make use of the following frameworks.

In the best case, the S&P 500 trades sideways or higher; activity above the $4,481.75 high volume area (HVNode) pivot puts in play the $4,495.00 untested point of control (VPOC). Initiative trade beyond the VPOC could reach as high as the $4,511.50 and $4,556.25 Fibonacci-derived price targets.

In the worst case, the S&P 500 trades lower; activity below the $4,481.75 HVNode pivot likely puts in play the $4,454.25 low volume area (LVNode), a ledge resolved during Monday’s breakout. Initiative trade beyond the LVNode could reach as low as the $4,427.00 VPOC and $4,393.75 micro-composite point of control (MCPOC). 

Volume Areas: A structurally sound market will build on past areas of high volume. Should the market trend for long periods of time, it will lack sound structure (identified as a low volume area which denotes directional conviction and ought to offer support on any test). 

If participants were to auction and find acceptance into areas of prior low volume, then future discovery ought to be volatile and quick as participants look to areas of high volume for favorable entry or exit.

POCs: POCs are valuable as they denote areas where two-sided trade was most prevalent. Participants will respond to future tests of value as they offer favorable entry and exit.

Ledges: Flattened area on the profile which suggests responsive participants are in control, or initiative participants lack the confidence to continue the discovery process. The ledge will either hold and force participants to liquidate (cover) their positions, or crack and offer support (resistance).
Graphic: 65-minute profile chart of the Micro E-mini S&P 500 Futures updated 6:30 AM ET.

News And Analysis

Previous COVID preventing infection better than shot.

Critical battle for support as rates risk pivoting higher.

Tax clash testing unity over President Biden’s agenda.

China planning to ban U.S. IPOs for some tech firms.

Southwest to cut fall flights following a tough summer.

Soviet Union collapse turned Russia into powerhouse.

European speculative-grade defaults may fall to 3.5%.

What People Are Saying

About

After years of self-education, strategy development, and trial-and-error, Renato Leonard Capelj began trading full-time and founded Physik Invest to detail his methods, research, and performance in the markets. 

Additionally, Capelj is a finance and technology reporter. Some of his biggest works include interviews with leaders such as John Chambers, founder and CEO, JC2 Ventures, Kevin O’Leary, businessman and Shark Tank host, Catherine Wood, CEO and CIO, ARK Invest, among others.

Disclaimer

At this time, Physik Invest does not manage outside capital and is not licensed. In no way should the materials herein be construed as advice. Derivatives carry a substantial risk of loss. All content is for informational purposes only.

Categories
Commentary

Daily Brief For August 26, 2021

Market Commentary

Equity index futures traded lower overnight. Commodities, the dollar, and yields rose.

  • Jackson Hole Economic Symposium starts.
  • Ahead: Data on GDP, jobless claims, profit.
  • Participants position for a directional move.

What Happened: U.S. stock index futures auctioned lower overnight ahead of the Federal Reserve’s Jackson Hole Economic Symposium August 26-28, 2021.

Ahead is data on GDP, corporate profits, and jobless claims (8:30 AM ET).

Graphic updated 6:20 AM ET. Sentiment Neutral if expected /ES open is inside of the prior day’s range. SqueezeMetrics Dark Pool Index (DIX) and Gamma (GEX) calculations are based on where the prior day’s reading falls with respect to the MAX and MIN of all occurrences available. A higher DIX is bullish. At the same time, the lower the GEX, the more (expected) volatility. SHIFT data used for S&P 500 (INDEX: SPX) options activity approximation. Note that options flow is sorted by the call premium spent; if more positive then more was spent on call options. Breadth reflects a reading of the prior day’s Advance/Decline indicator. VIX reflects a current reading of the CBOE Volatility Index (INDEX: VIX) from 0-100.

What To Expect: As of 6:20 AM ET, Thursday’s regular session (9:30 AM – 4:00 PM EST) in the S&P 500 will likely open inside of prior-range and -value, suggesting a limited potential for immediate directional opportunity.

Adding, during the prior day’s regular trade, on weaker intraday breadth, volume, and market liquidity metrics, the best case outcome occurred, evidenced by trade above the $4,481.75 high volume area (HVNode) pivot. This trade is significant because it marked the repair of the $4,492.00 overnight, a minimal excess all-time high (ONH), and a move higher in value (i.e., an acceptance of higher prices). 

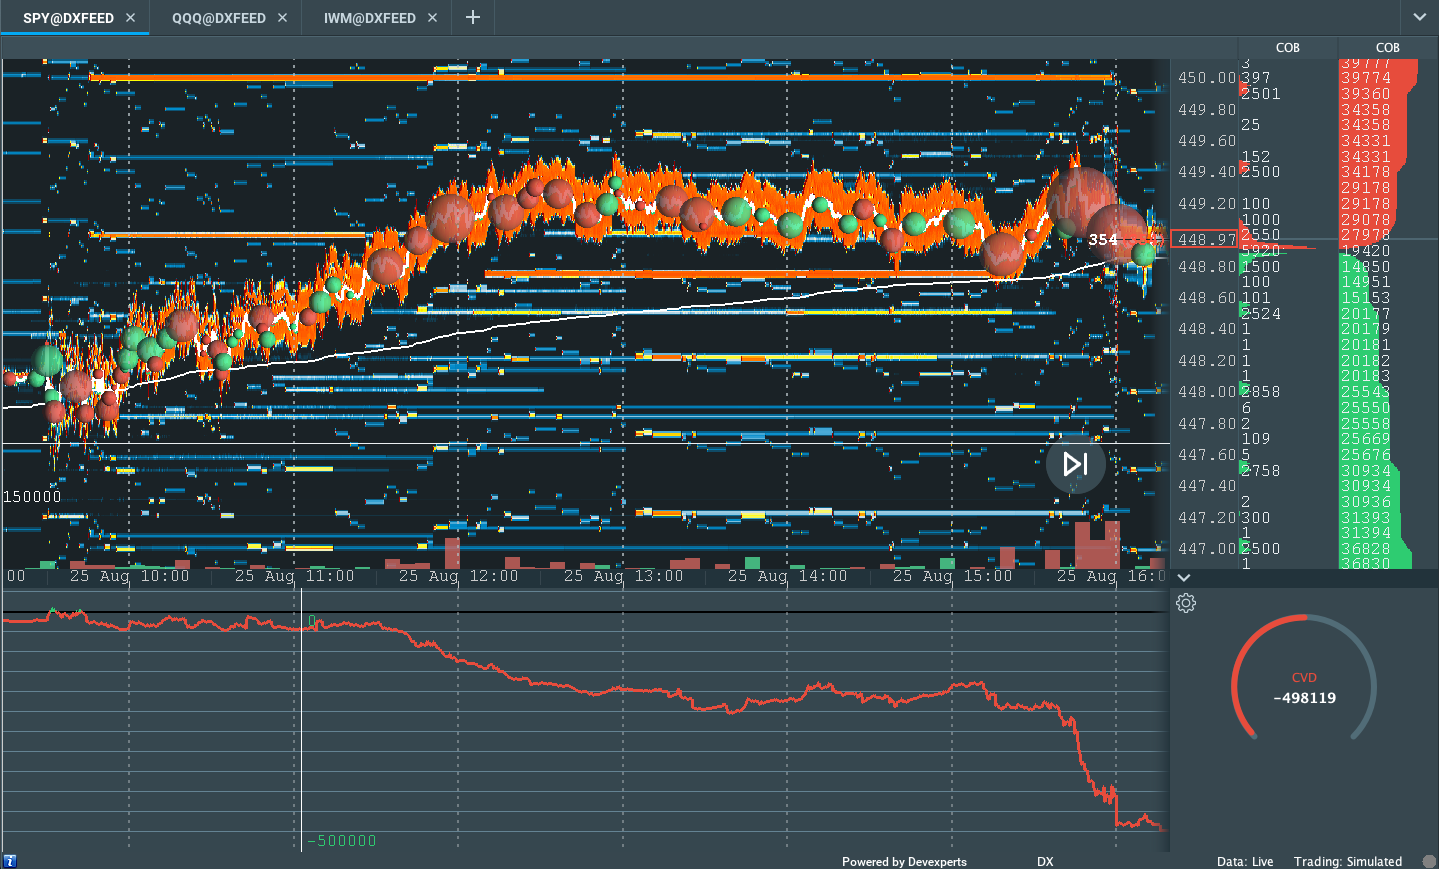
Graphic: Divergent delta (i.e., non-committed buying as measured by volume delta) in SPDR S&P 500 ETF Trust (NYSE: SPY), one of the largest ETFs that track the S&P 500 index. 

Further, the aforementioned trade is happening in the context of the highly anticipated Jackson Hole Economic Symposium. This event may have a large impact on the price as policymakers reinforce the message of taper to bond-buying; to elaborate, “The Fed has fostered a broad range of bubbles because their massive liquidity injections have been trapped in the financial economy,” Rich Bernstein of Richard Bernstein Associates said in a summary quoted by Bloomberg

“As with any cornered market, there are limited buyers and prices fall as the “cornerer” sells. Accordingly, bond prices seem likely to fall (interest rates rise) [as the] Fed reduces its cornered positions. Rising interest rates could be the kryptonite to the bubble in long-duration assets (long-term bonds, technology, innovation, disruption, bitcoin, etc.).”

At the same time, according to JPMorgan Chase & Co (NYSE: JPM) metrics published by The Market Ear, the market isn’t pricing too much risk ahead of the event; “the SPX and the SX5E are pricing in a 1% move, … but on the other hand 1 day realized vol for Jackson Hole events has been around 0.45% for SX5E writes JPM.”

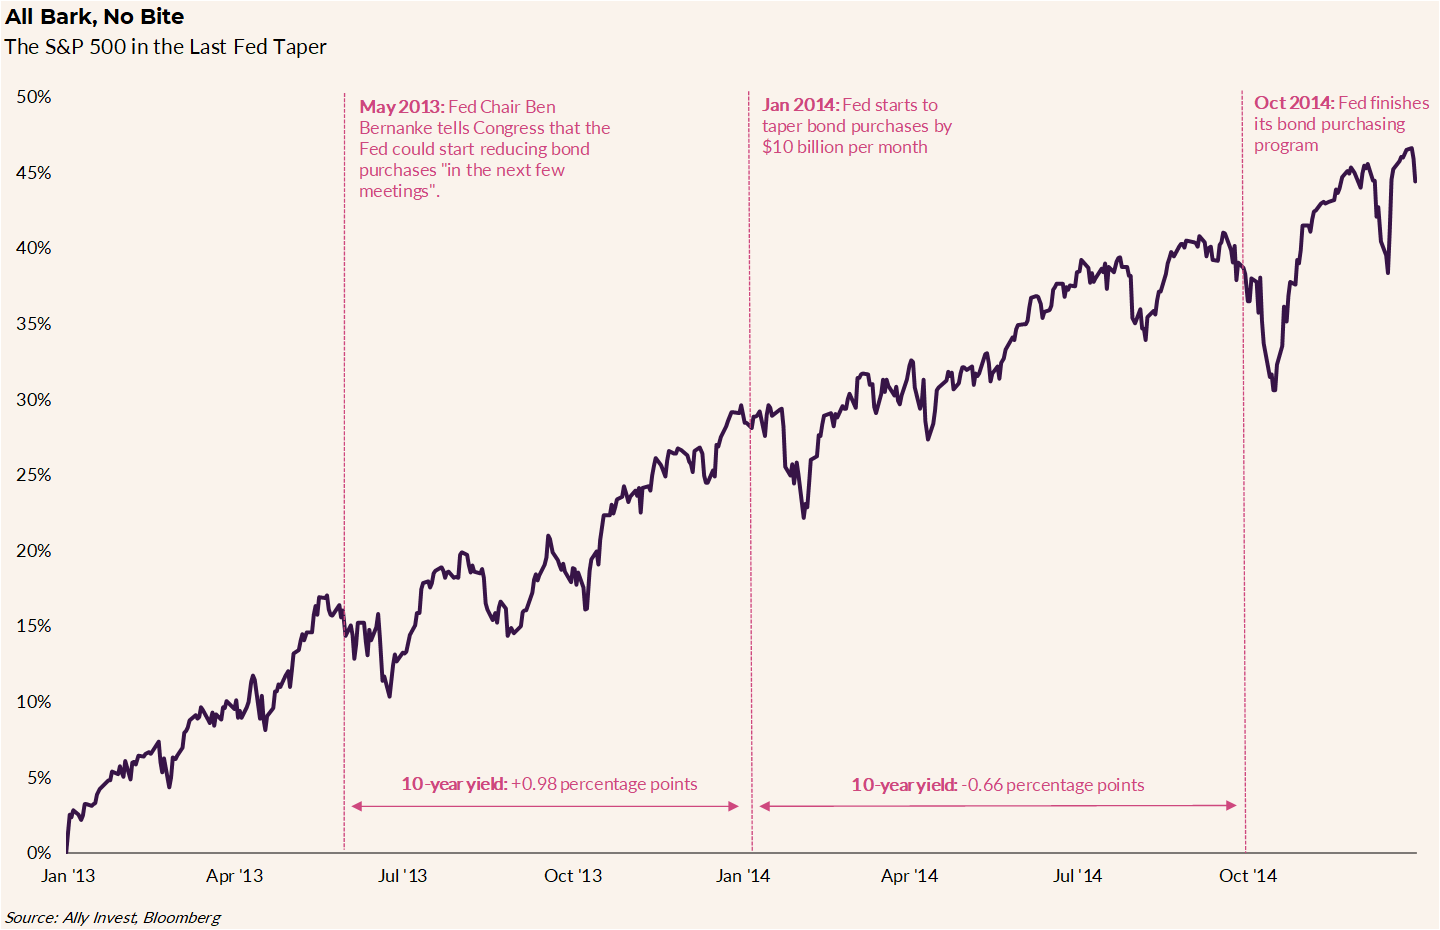
We balance the risks presented by the event by looking back to 2014 when the Fed was scaling back bond purchases and the S&P 500 rose over 10% as rates fell after spiking initially.

Graphic: Ally Financial Inc-owned (NYSE: ALLY) Ally Invest unpacks 2014 taper of Federal Reserve bond buying.

Moreover, for today, participants may make use of the following frameworks.

In the best case, the S&P 500 trades sideways or higher; activity above the $4,494.25 high volume area (HVNode) puts in play the $4,495.00 untested point of control (VPOC). Initiative trade beyond the VPOC could reach as high as the $4,511.50 and $4,556.25 Fibonacci extensions.

In the worst case, the S&P 500 trades lower; activity below the $4,484.25 HVNode puts in play the $4,454.25 low volume area (LVNode). Initiative trade beyond the LVNode could reach as low as the $4,427.00 VPOC and $4,393.75 micro composite point of control (MCPOC).

Volume Areas: A structurally sound market will build on past areas of high volume. Should the market trend for long periods of time, it will lack sound structure (identified as a low volume area which denotes directional conviction and ought to offer support on any test). 

If participants were to auction and find acceptance into areas of prior low volume, then future discovery ought to be volatile and quick as participants look to areas of high volume for favorable entry or exit.

POCs: POCs are valuable as they denote areas where two-sided trade was most prevalent. Participants will respond to future tests of value as they offer favorable entry and exit.
Graphic: 65-minute profile chart of the Micro E-mini S&P 500 Futures updated 6:20 AM ET.

News And Analysis

Good times keep rolling for U.S. alternative asset managers.

Virtual Jackson Hole underscores uncertainty in Fed’s vision.

Small caps are having a nice move higher on fundamentals.

Bank of Korea ups rate with debt risk seen bigger than virus.

La Nina’s return could threaten South American crops again.

As labor demand exceeds supply it may be the time to taper.

Asian banks’ crypto-asset push calls for regulatory harmony.

PIIE: There’s another reason to up the Fed’s inflation target.

Dick’s Sporting Goods, other retailers, unpack higher profits.

Delta Air Lines imposes monthly surcharge on unvaccinated.

What People Are Saying

About

After years of self-education, strategy development, and trial-and-error, Renato Leonard Capelj began trading full-time and founded Physik Invest to detail his methods, research, and performance in the markets. 

Additionally, Capelj is a finance and technology reporter. Some of his biggest works include interviews with leaders such as John Chambers, founder and CEO, JC2 Ventures, Kevin O’Leary, businessman and Shark Tank host, Catherine Wood, CEO and CIO, ARK Invest, among others.

Disclaimer

At this time, Physik Invest does not manage outside capital and is not licensed. In no way should the materials herein be construed as advice. Derivatives carry a substantial risk of loss. All content is for informational purposes only.

Categories
Commentary

Daily Brief For August 25, 2021

Editor’s Note: Dark Pool Index (DIX) and Gamma (GEX) visuals are based on where each metric falls with respect to the MAX and MIN for all data available on https://squeezemetrics.com/monitor/dix (i.e., DIX in relation to high and low of the entire DIX data set).

Market Commentary

Equity index futures trade sideways.

  • Updates to DIX, GEX calculation.
  • Implications of Fed’s cash deluge.
  • Ahead: Some goods orders data.
  • Positioned for sideways to higher.

What Happened: U.S. stock index futures auctioned sideways alongside an absence in overnight catalysts.

Ahead is data on durable and nondefense capital goods orders (8:30 AM ET).

Graphic updated 6:30 AM ET. Sentiment Neutral if expected /ES open is inside of the prior day’s range. SqueezeMetrics Dark Pool Index (DIX) and Gamma (GEX) calculations are based on where the prior day’s reading falls with respect to the MAX and MIN of all occurrences available. A higher DIX is bullish. At the same time, the lower the GEX, the more (expected) volatility. SHIFT data used for S&P 500 (INDEX: SPX) options activity approximation. Note that options flow is sorted by the call premium spent; if more positive then more was spent on call options. Breadth reflects a reading of the prior day’s Advance/Decline indicator. VIX reflects a current reading of the CBOE Volatility Index (INDEX: VIX) from 0-100.

What To Expect: As of 6:30 AM ET, Wednesday’s regular session (9:30 AM – 4:00 PM EST) in the S&P 500 will likely open inside of prior-range and -value, suggesting a limited potential for immediate directional opportunity.

Adding, during the prior day’s regular trade, on strong intraday breadth and lackluster market liquidity metrics, the best case outcome occurred, evidenced by sideways trade at the $4,481.75 high volume area (HVNode). This is significant because sideways trade – after the completion of a v-pattern recovery – denotes an acceptance of higher prices (i.e., participants find prices valuable to transact at).

V-Pattern: A pattern that forms after a market establishes a high, retests some support, and then breaks above said high. In most cases, this pattern portends continuation.

Further, ahead of the upcoming Jackson Hole Economic Symposium on August 26-28, 2021, the aforementioned trade is happening in the context of moderating economic growth and monetary distortions.

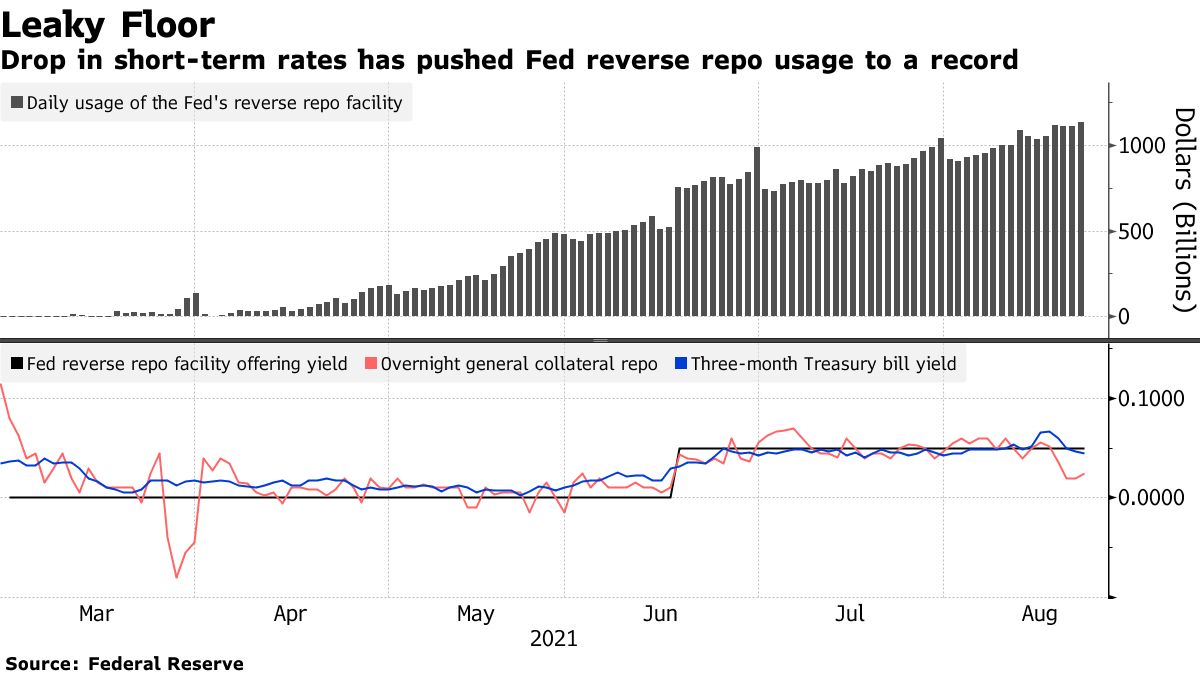
According to Bloomberg, “[d]emand for the so-called RRP facility has surged as a flood of dollars threatens to overwhelm funding markets. That’s in part a result of the central bank’s long-standing asset purchases and drawdowns of the Treasury’s cash account, which is pushing reserves into the system. As a result, liquidity has been swelling, especially as the Treasury cuts supply to create more borrowing room under the debt ceiling.”

“Even if the central bank were to complete tapering by August 2022, as JPMorgan expects, there may still be an additional $850 billion to $1 trillion of additional liquidity injected into the financial system.”

Graphic: Bloomberg plots Federal Reserve data on reverse repo usage.

Moreover, for today, participants may make use of the following frameworks.

In the best case, the S&P 500 trades sideways or higher; activity above the $4,481.75 high volume area (HVNode) puts in play the $4,492.00 overnight, minimal excess all-time high (ONH). Initiative trade beyond the ONH could reach as high as the $4,511.50 and $4,556.25 Fibonacci extensions.

In the worst case, the S&P 500 trades lower; activity below the $4,481.75 HVNode puts in play the $4,454.25 low volume area (LVNode). Initiative trade beyond the LVNode could reach as low as the $4,427.00 untested point of control (VPOC) and $4,393.75 micro composite point of control (MCPOC).

To note, the $4,427.00 level corresponds with an anchored volume-weighted average price (VWAP), a metric highly regarded by chief investment officers, among other participants, for quality of trade. Additionally, liquidity algorithms are benchmarked and programmed to buy and sell around VWAPs.

Overnight Rally Highs (Lows): Typically, there is a low historical probability associated with overnight rally-highs (lows) ending the upside (downside) discovery process.

Excess: A proper end to price discovery; the market travels too far while advertising prices. Responsive, other-timeframe (OTF) participants aggressively enter the market, leaving tails or gaps which denote unfair prices.

Volume Areas: A structurally sound market will build on past areas of high volume. Should the market trend for long periods of time, it will lack sound structure (identified as a low volume area which denotes directional conviction and ought to offer support on any test). 

If participants were to auction and find acceptance into areas of prior low volume, then future discovery ought to be volatile and quick as participants look to areas of high volume for favorable entry or exit.

POCs: POCs are valuable as they denote areas where two-sided trade was most prevalent. Participants will respond to future tests of value as they offer favorable entry and exit.
Graphic: 65-minute profile chart of the Micro E-mini S&P 500 Futures updated 6:30 AM ET.

News And Analysis

MSCI CEO dismisses concern Chinese stocks are uninvestable.

Federal Reserve policy got Chinese criticism as PBOC diverges.

President Biden praises house adoption of a $3.5B budget plan. 

S&P Global: Global oil demand peak by 2025 under UN pathway.

How U.S. infrastructure investment could boost jobs, productivity.

U.S. on a pace to complete a full Afghanistan withdrawal by 8/31.

Catherine Wood is more optimistic than pessimistic about China.

What People Are Saying

About

After years of self-education, strategy development, and trial-and-error, Renato Leonard Capelj began trading full-time and founded Physik Invest to detail his methods, research, and performance in the markets. 

Additionally, Capelj is a finance and technology reporter. Some of his biggest works include interviews with leaders such as John Chambers, founder and CEO, JC2 Ventures, Kevin O’Leary, businessman and Shark Tank host, Catherine Wood, CEO and CIO, ARK Invest, among others.

Disclaimer

At this time, Physik Invest does not manage outside capital and is not licensed. In no way should the materials herein be construed as advice. Derivatives carry a substantial risk of loss. All content is for informational purposes only.
Categories
Commentary

Daily Brief For August 24, 2021

Market Commentary

Equity index and commodity futures trade higher overnight. Yields and VIX are higher, too.

  • Unpacking drivers behind market.
  • Ahead: Data on new home sales.
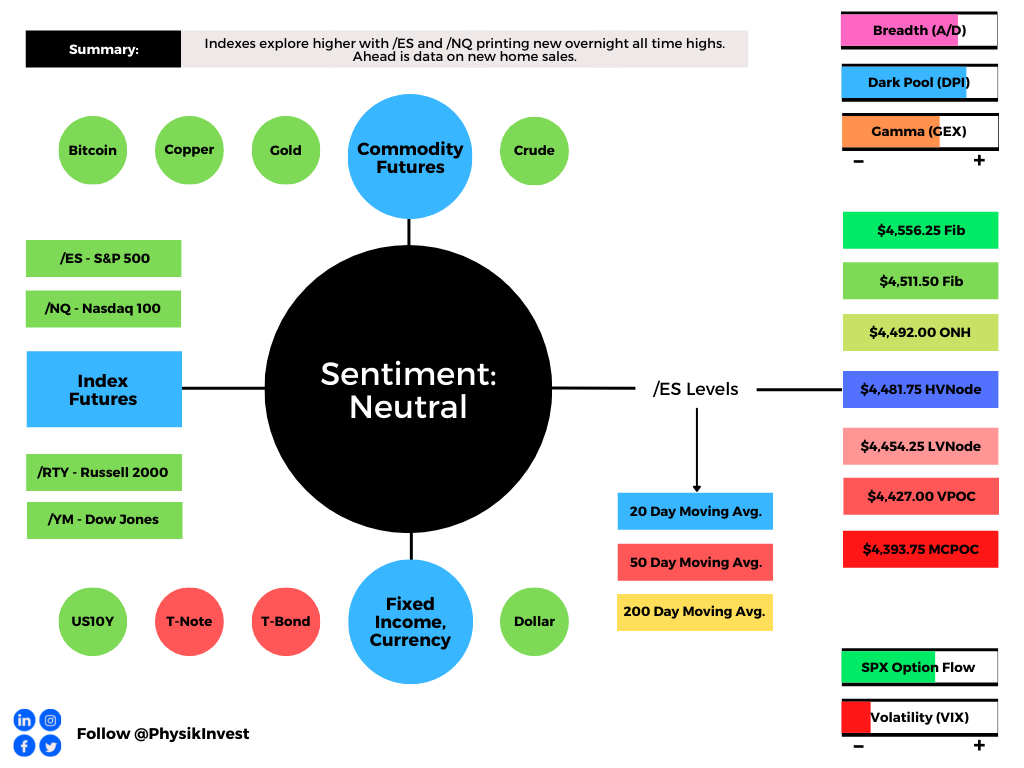
  • Eyeing digestion, sideways trade.

What Happened: U.S. stock index futures explored higher prices overnight as investors looked to position themselves for the upcoming Jackson Hole Economic Symposium August 26-28, 2021. The Russell 2000 is leading the pack alongside the Nasdaq 100.

Ahead is data on new home sales (10:00 AM ET).

Graphic updated 6:30 AM ET. Sentiment Neutral if expected /ES open is inside of the prior day’s range. See here for more on the Dark Pool Index (DPI) and Gamma (GEX). A higher DPI approximation is bullish. At the same time, the lower the GEX approximation, the more volatility. SHIFT data used for options activity approximation. Note that options flow is sorted by the call premium spent; if green and more positive then more was spent on call options. Breadth reflects a reading of the prior day’s Advance/Decline indicator. VIX reflects a current reading of the CBOE Volatility Index from 0-100.

What To Expect: As of 6:30 AM ET, Tuesday’s regular session (9:30 AM – 4:00 PM EST) in the S&P 500 will likely open just inside of prior-range and -value, suggesting a limited potential for immediate directional opportunity.

Adding, during the prior day’s regular trade, on strong intraday breadth and middling market liquidity metrics, the best case outcome occurred, evidenced by trade above the $4,476.50 overnight high (ONH). This is significant because Monday’s trade took back 100% of last week’s liquidation, completing a v-pattern recovery.

V-Pattern: A pattern that forms after a market establishes a high, retests some support, and then breaks above said high. In most cases, this pattern portends continuation.

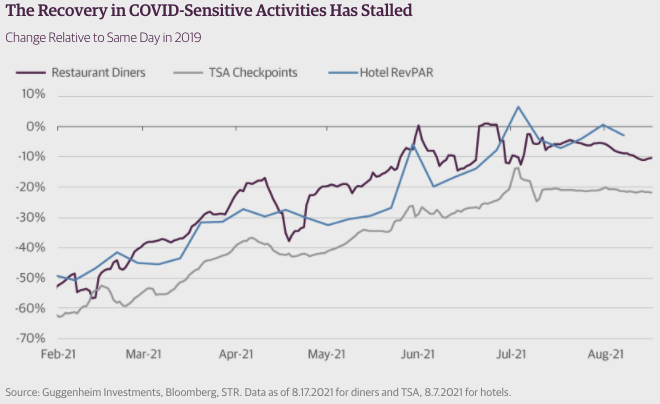
Further, the aforementioned trade is happening in the context of impactful options market dynamics, moderating growth, and inclination to taper stimulus in spite of a resurgence in COVID-19.

Some of the implications of these themes on price are supportive and contradictory; to elaborate, “[t]he good news is that our economic recovery is unlikely to fully reverse, given lack of political will for a return to stricter lockdown measures. But evidence of a slowdown in third-quarter economic activity will continue to mount in the coming weeks, putting the Fed’s 7 percent real GDP growth projection for 2021 out of reach,” strategists at Guggenheim noted.

“This string of weaker data will likely prompt the Fed, led by Chair Powell and Governor Brainard, to take a more cautious approach to the timing and speed of tapering plans, in turn keeping Treasury yields low.”

At the same time, briefly, we should touch on the so-called sale of any volatility spike which can – through the process of hedging – support the market. Here’s just one example that’s been receiving a lot of attention.

“In theory, if a stock was dropping and the retail masses all started to sell puts, they could push market makers to start buying large blocks of shares,” SpotGamma, an important voice in the space, says. “This could stabilize a dropping stock.”

Graphic: SqueezeMetrics details the implications of customer activity in the options market, on the underlying’s order book. For instance, in selling a put, customers add liquidity and stabilize the market. How? The counterparty long the put will buy (sell) the underlying to neutralize directional risk as price falls (rises).

Moreover, for today, given expectations of heightened volatility and responsive trade, participants may make use of the following frameworks.

Responsive Buying (Selling): Buying (selling) in response to prices below (above) an area of recent price acceptance.

In the best case, the S&P 500 trades sideways or higher; activity above the $4,481.75 high volume area (HVNode) puts in play the $4,492.00 overnight, minimal excess all-time high (ONH). Initiative trade beyond the ONH could reach as high as the $4,511.50 and $4,556.25 Fibonacci extensions.

In the worst case, the S&P 500 trades lower; activity below the $4,481.75 HVNode puts in play the $4,454.25 low volume area (LVNode). Initiative trade beyond the LVNode could reach as low as the $4,427.00 untested point of control (VPOC) and $4,393.75 micro composite point of control (MCPOC).

Overnight Rally Highs (Lows): Typically, there is a low historical probability associated with overnight rally-highs (lows) ending the upside (downside) discovery process.

Excess: A proper end to price discovery; the market travels too far while advertising prices. Responsive, other-timeframe (OTF) participants aggressively enter the market, leaving tails or gaps which denote unfair prices.

Volume Areas: A structurally sound market will build on past areas of high volume. Should the market trend for long periods of time, it will lack sound structure (identified as a low volume area which denotes directional conviction and ought to offer support on any test). 

If participants were to auction and find acceptance into areas of prior low volume, then future discovery ought to be volatile and quick as participants look to areas of high volume for favorable entry or exit.

POCs: POCs are valuable as they denote areas where two-sided trade was most prevalent. Participants will respond to future tests of value as they offer favorable entry and exit.
Graphic: 65-minute profile chart of the Micro E-mini S&P 500 Futures updated 6:30 AM ET.

News And Analysis

Ignoring Risk: S&P 500 doubles to the fastest bull market.

Moviegoers return, but COVID, streaming threaten theater.

Fed Chairman Jerome Powell navigating inflation debates.

S&P Global unpacks digital asset infrastructure – custody.

Existing home sales back on a rise as inventory improves.

Latin American conditions are painting a favorable portrait.

Funds trimming hawkish Fed bets as Jackson Hole looms.

Ten cities successfully weathering COVID on management.

Cumberland Advisors: Who is working and who is not yet?

PBOC will boost its credit support, stabilize money growth.

USDC reserve to be converted into less risky investments.

Year-to-date loan default volumes down 88% versus 2020.

Bank acquisitions of big fintechs rare amid startup growth.

What People Are Saying

About

After years of self-education, strategy development, and trial-and-error, Renato Leonard Capelj began trading full-time and founded Physik Invest to detail his methods, research, and performance in the markets. 

Additionally, Capelj is a finance and technology reporter. Some of his biggest works include interviews with leaders such as John Chambers, founder and CEO, JC2 Ventures, Kevin O’Leary, businessman and Shark Tank host, Catherine Wood, CEO and CIO, ARK Invest, among others.

Disclaimer

At this time, Physik Invest does not manage outside capital and is not licensed. In no way should the materials herein be construed as advice. Derivatives carry a substantial risk of loss. All content is for informational purposes only.
Categories
Commentary

Daily Brief For August 23, 2021

Market Commentary

Equity index and commodity futures trade higher overnight. Yields and VIX are higher, too.

  • Post-FOMC minutes recovery continues.
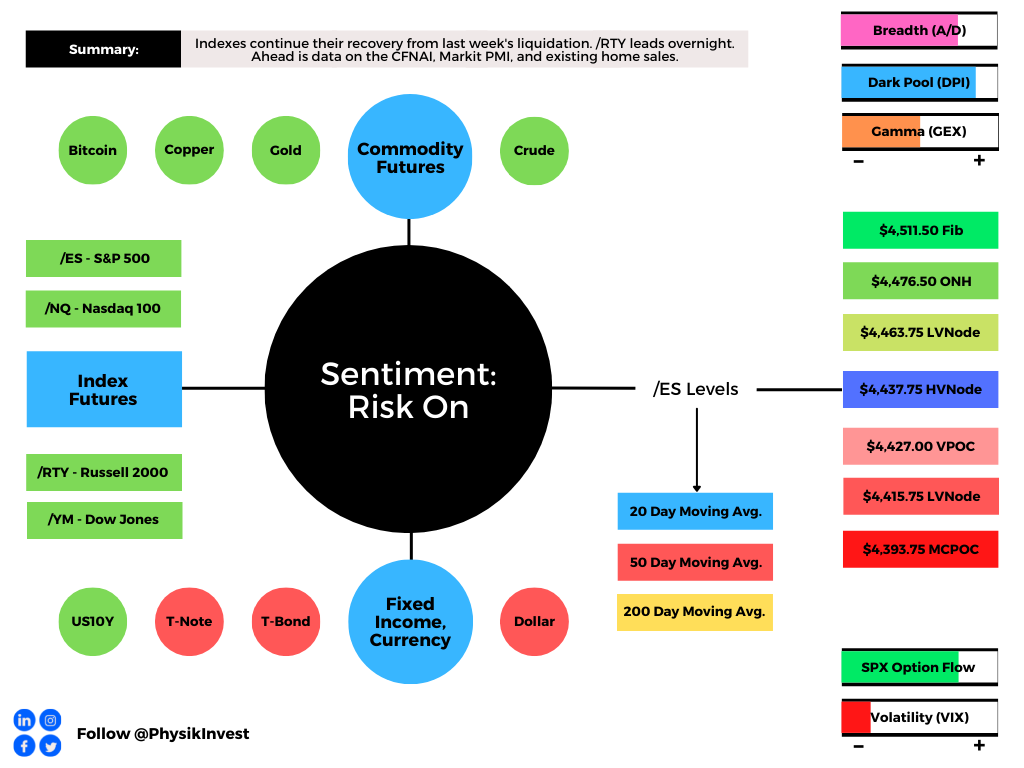
  • Ahead: CFNAI, Markit PMI, home sales.

What Happened: U.S. stock index futures auctioned higher, continuing their recovery from last week’s liquidation that intensified after the release of Federal Open Market Committee (FOMC) minutes. Leading the overnight price rise is the Russell 2000, a laggard in recent trade.

Ahead is data on the Chicago Fed National Activity Index (8:30 AM ET), Markit manufacturing and services PMI (9:45 AM ET), as well as existing home sales (10:00 AM ET). 

Graphic updated 6:40 AM ET. Sentiment Risk-On if expected /ES open is above the prior day’s range. See here for more on the Dark Pool Index (DPI) and Gamma (GEX). A higher DPI approximation is bullish. At the same time, the lower the GEX approximation, the more volatility. SHIFT data used for options activity approximation. Note that options flow is sorted by the call premium spent; if green and more positive then more was spent on call options. Breadth reflects a reading of the prior day’s Advance/Decline indicator. VIX reflects a current reading of the CBOE Volatility Index from 0-100.

What To Expect: As of 6:20 AM ET, Monday’s regular session (9:30 AM – 4:00 PM EST) in the S&P 500 will likely open just outside of prior-range and -value, suggesting a potential for immediate directional opportunity.

Adding, during Friday’s regular trade, on stronger intraday breadth and market liquidity metrics, the best-case outcome occurred, evidenced by trade above the spike base a few ticks below the $4,422.75 balance area high (BAH). This is significant because the post-FOMC minutes liquidation has been negated.

Gap Scenarios In Play: Gaps ought to fill quickly. Should they not, that’s a signal of strength; do not fade. Leaving value behind on a gap-fill or failing to fill a gap (i.e., remaining outside of the prior session’s range) is a go-with indicator.

Auctioning and spending at least 1-hour of trade back in the prior range suggests a lack of conviction; in such a case, do not follow the direction of the most recent initiative activity.

Further, the aforementioned trade is happening in the context of – most importantly – the Federal Reserve’s intent to taper asset purchases. This theme’s implications on price are contradictory; to elaborate, unemployment is falling rapidly, signaling to the Fed the need to reduce support.

“Bottom line, the critical element is inflation expectations,” former Fed Chairman Ben Bernanke says. “As long as they stay in the vicinity of 2%, the Fed’s strategy will achieve its goals. If inflation expectations were to move significantly higher, the Fed would be forced to tighten more quickly and probably slow the economy more than they would like.”

Ultimately, “[r]ising interest rates could be the kryptonite to the bubble in long-duration assets,” Rich Bernstein of Richard Bernstein Associates adds.

Moreover, for today, given expectations of heightened volatility and responsive trade into the Jackson Hole Economic Policy Symposium August 26-28, 2021, participants may make use of the following frameworks.

Responsive Buying (Selling): Buying (selling) in response to prices below (above) an area of recent price acceptance.

In the best case, the S&P 500 trades sideways or higher; activity above the $4,437.75 high volume area (HVNode) puts in play the $4,463.75 low volume area (LVNode). Initiative trade beyond the LVNode could reach as high as the $4,476.50 overnight high (ONH) and $4,511.50 Fibonacci extension.

In the worst case, the S&P 500 trades lower; activity below the $4,437.75 HVNode puts in play the $4,427.00 untested point of control (VPOC). Initiative trade beyond the VPOC could reach as low as the $4,415.75 LVNode and $4,393.75 micro composite point of control (MCPOC).

Overnight Rally Highs (Lows): Typically, there is a low historical probability associated with overnight rally-highs (lows) ending the upside (downside) discovery process.

Volume Areas: A structurally sound market will build on past areas of high volume. Should the market trend for long periods of time, it will lack sound structure (identified as a low volume area which denotes directional conviction and ought to offer support on any test). 

If participants were to auction and find acceptance into areas of prior low volume, then future discovery ought to be volatile and quick as participants look to areas of high volume for favorable entry or exit.

POCs: POCs are valuable as they denote areas where two-sided trade was most prevalent. Participants will respond to future tests of value as they offer favorable entry and exit.
Graphic: 65-minute profile chart of the Micro E-mini S&P 500 Futures updated 6:20 AM ET.

News And Analysis

Jay Powell’s policy revolution was blindsided.

EM central banks’ responses reflect recovery.

The pace of recovery critical to debt reduction.

China adds to list of steel giants with merger.

ECB rate hike bets losing out to dim inflation.

Activity in Japan’s services sector is shrinking.

Harris looks to assure U.S. allies over chaos.

The European services sector outperforming.

What People Are Saying

About

After years of self-education, strategy development, and trial-and-error, Renato Leonard Capelj began trading full-time and founded Physik Invest to detail his methods, research, and performance in the markets. 

Additionally, Capelj is a finance and technology reporter. Some of his biggest works include interviews with leaders such as John Chambers, founder and CEO, JC2 Ventures, Kevin O’Leary, businessman and Shark Tank host, Catherine Wood, CEO and CIO, ARK Invest, among others.

Disclaimer

At this time, Physik Invest does not manage outside capital and is not licensed. In no way should the materials herein be construed as advice. Derivatives carry a substantial risk of loss. All content is for informational purposes only.

Categories
Commentary

Weekly Brief For August 22, 2021

Market Commentary

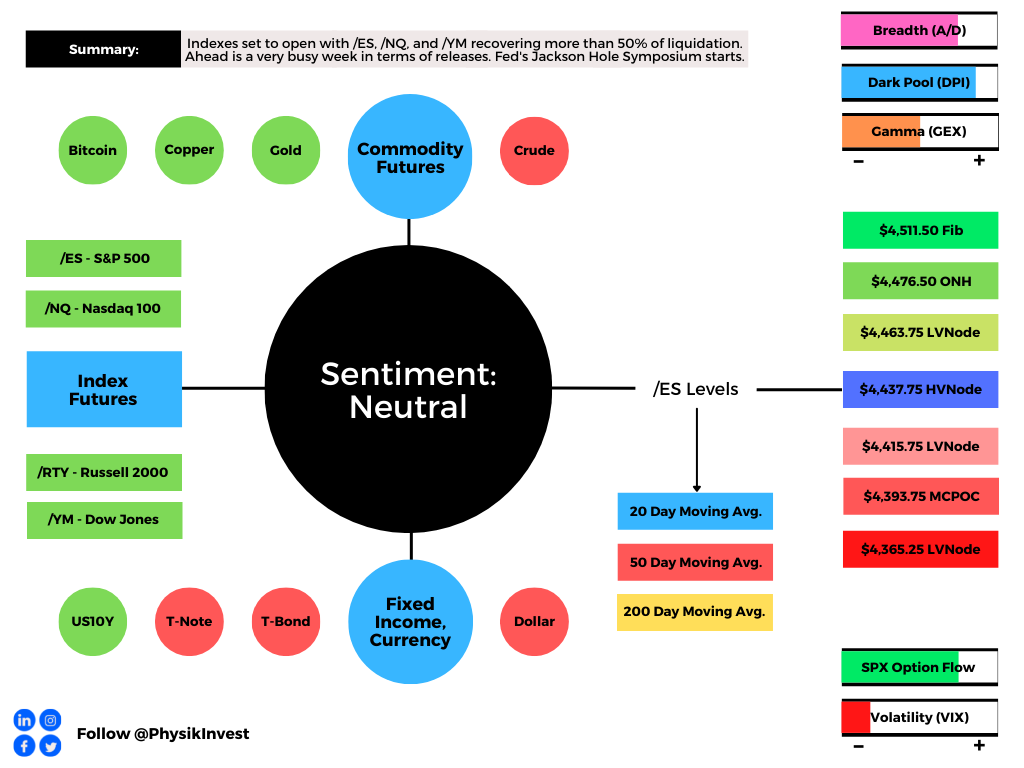
Equity index futures recover after last week’s liquidation.

  • Unpacking the inclination to taper.
  • Ahead: Busy week. Jackson Hole.

What Happened: The S&P 500, Nasdaq 100, and Dow Jones Industrial Average recovered more than 50% of last week’s liquidation. The Russell 2000 remains a laggard, trading weak below the halfway point of a multi-month consolidation.

Ahead is data on the Markit manufacturing and services PMI (Monday), existing-home sales (Monday), new home sales (Tuesday), durable goods orders (Wednesday), nondefense capital goods orders (Wednesday), jobless claims (Thursday), GDP revision (Thursday), personal income (Friday), consumer spending (Friday), core PCE price index (Friday), trade in goods (Friday), as well University of Michigan consumer sentiment (Friday). 

Also, the Jackson Hole Economic Policy Symposium starts Thursday.

Graphic updated 12:30 PM ET Sunday. Sentiment Neutral if expected /ES open is inside of the prior day’s range. See here for more on the Dark Pool Index (DPI) and Gamma (GEX). A higher DPI approximation is bullish. At the same time, the lower the GEX approximation, the more volatility. SHIFT data used for options activity approximation. Note that options flow is sorted by the call premium spent; if green and more positive then more was spent on call options. Breadth reflects a reading of the prior day’s Advance/Decline indicator. VIX reflects a current reading of the CBOE Volatility Index from 0-100.

What To Expect: During the prior week’s trade, on weak intraday breadth and market liquidity metrics, the worst-case outcome occurred, evidenced by a liquidation that repaired poor profile structures as low as the S&P 500’s $4,353.00 point of control (POC).

POCs: POCs are valuable as they denote areas where two-sided trade was most prevalent. Participants will respond to future tests of value as they offer favorable entry and exit.

Then, during Friday’s session, a p-shaped profile structure (which denotes short covering) took back the spike base a few ticks below the $4,422.75 balance area high (BAH) – a prior break from value – negating the post-Federal Open Market Committee (FOMC) minutes liquidation.

Further, the aforementioned trade is happening in the context of moderating growth, peak long equity positioning, breadth divergences, a resurgence in COVID-19, geopolitical tensions, and an inclination to taper stimulus.

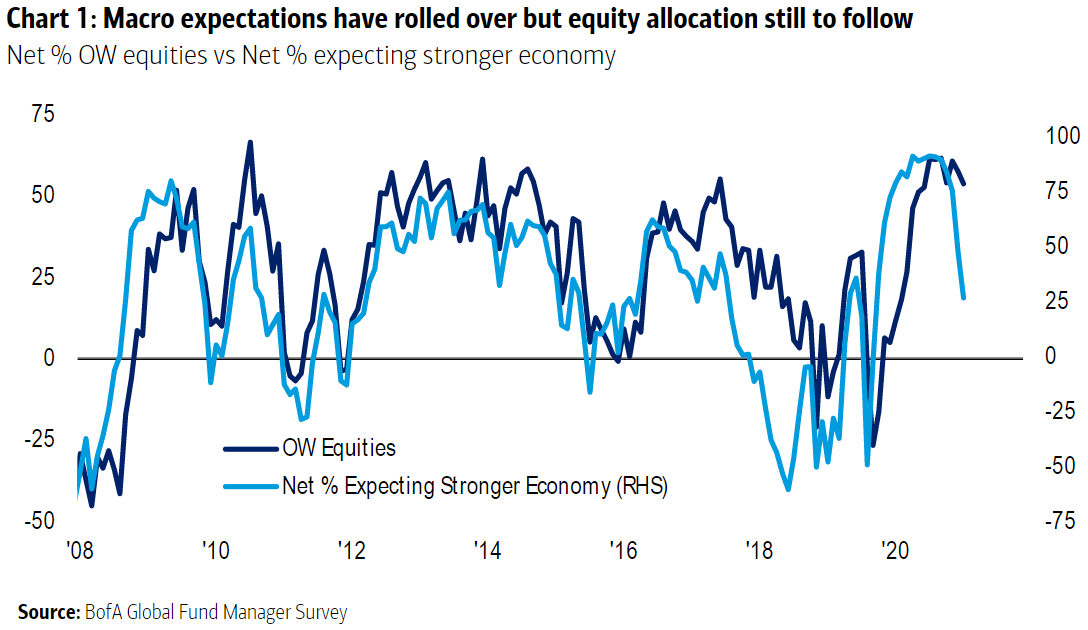
The implications of these themes on price are contradictory; to elaborate, as measures of macro expectations rolled over, in line with companies’ profit expectations, Treasury yields declined, triggering a rotation back into high growth equities.

Graphic: As created by Bank of America Corporation (NYSE: BAC) and shared by Bloomberg, the proportion of fund managers expecting a stronger economy tumbles while the number who are overweight in equities has barely moved.

This comes at the same time a strong July jobs report helped the Federal Reserve (Fed) move toward a consensus on tapering. Given the Fed’s enormous share of the Treasury market, fear of downside equity volatility is apparent; a shift higher in the VIX futures terms structure denotes demand for protection into and through the Jackson Hole Economic Policy Symposium August 26-28, 2021.

“The Fed has fostered a broad range of bubbles because their massive liquidity injections have been trapped in the financial economy,” Rich Bernstein of Richard Bernstein Associates said in a summary quoted by Bloomberg. “As with any cornered market, there are limited buyers and prices fall as the “cornerer” sells. Accordingly, bond prices seem likely to fall (interest rates rise) [as the] Fed reduces its cornered positions. Rising interest rates could be the kryptonite to the bubble in long-duration assets (long-term bonds, technology, innovation, disruption, bitcoin, etc.).”

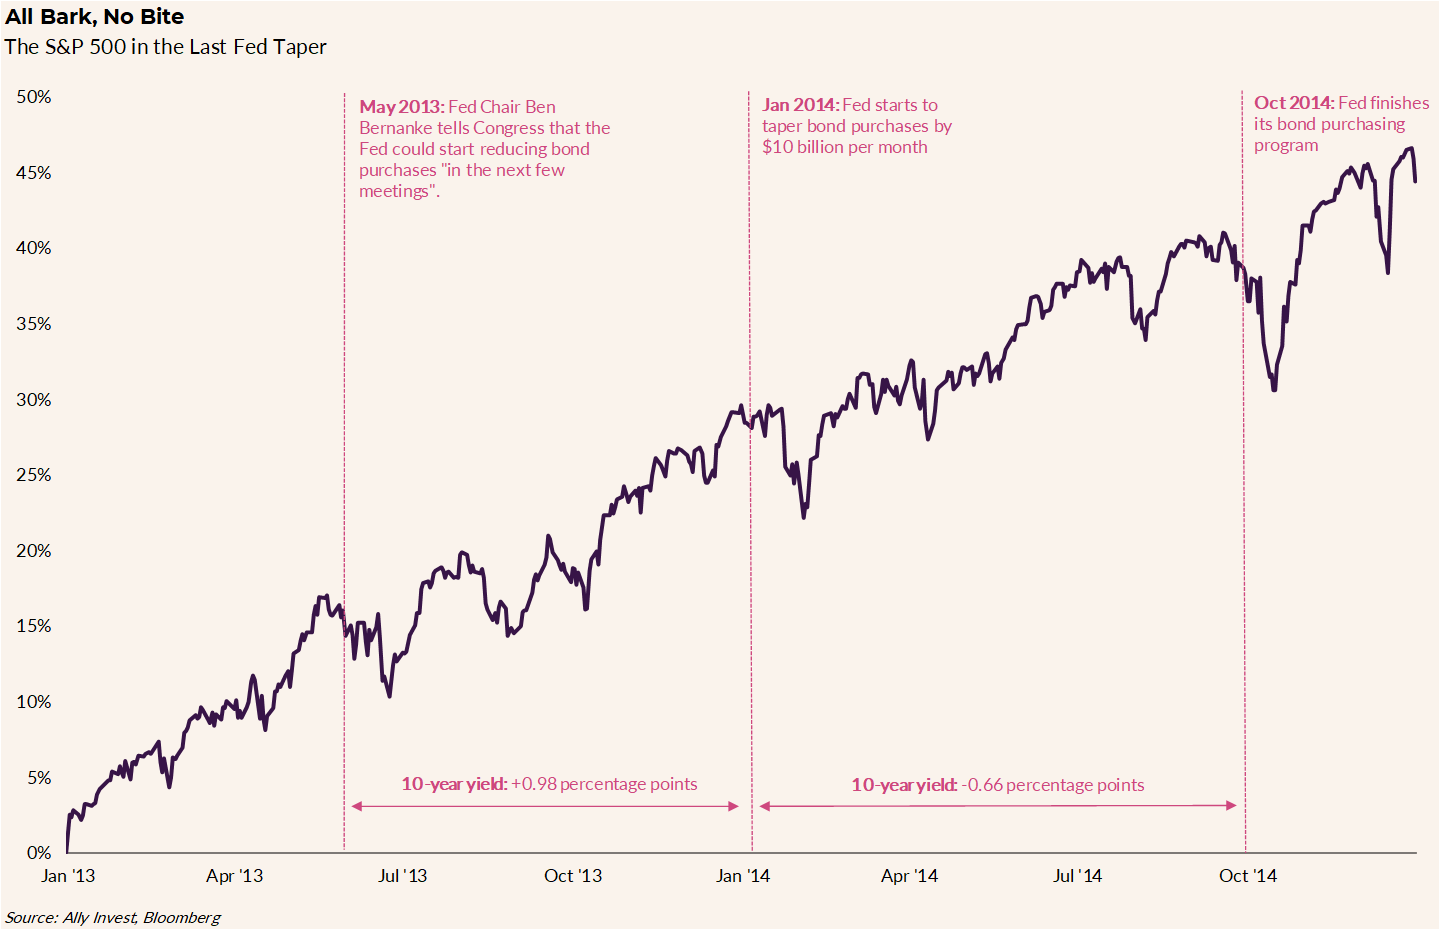
Obviously, tapering may have major repercussions. However, to balance our expectations, looking back to 2014, when the Fed was scaling back bond purchases, the S&P 500 rose over 10% and rates fell after spiking initially. 

Graphic: Ally Financial Inc-owned (NYSE: ALLY) Ally Invest unpacks 2014 taper of Federal Reserve bond buying.

Ally Invest’s chief investment strategist Lindsey Bell concludes: “Conditions may not be perfect, but they could be strong enough to move from a wheelchair to some heavy-duty crutches, especially if it means keeping overheating symptoms like inflation at bay.”

Regardless, major risks remain given the growth of derivatives and the potential for offsides positioning. Even the slightest reduction in the Federal Reserve’s balance sheet – the removal of liquidity – may prompt a cascading reaction that exacerbates underlying price movements.

As Kai Volatility’s Cem Karsan once told me for a Benzinga article: “It’s not a coincidence that the mid-February to mid-March 2020 downturn literally started the day after February expiration and ended the day of March quarterly expiration. These derivatives are incredibly embedded in how the tail reacts and there’s not enough liquidity, given the leverage, if the Fed were to taper.”

Moreover, for next week, given expectations of heightened volatility, participants may make use of the following frameworks.

In the best case, the S&P 500 trades sideways or higher; activity above the $4,437.75 high volume area (HVNode) pivot puts in play the $4,463.75 low volume area (LVNode). Initiative trade beyond the LVNode could reach as high as the $4,476.50 overnight high (ONH) and $4,511.50 Fibonacci extension, or higher.

In the worst case, the S&P 500 trades lower; activity below the $4,437.75 HVNode puts in play the $4,415.75 LVNode. Initiative trade beyond the LVNode could reach as low as $4,393.75 micro composite point of control (MCPOC) and $4,365.25 LVNode, or lower. 

Overnight Rally Highs (Lows): Typically, there is a low historical probability associated with overnight rally-highs (lows) ending the upside (downside) discovery process.

Volume Areas: A structurally sound market will build on past areas of high volume. Should the market trend for long periods of time, it will lack sound structure (identified as a low volume area which denotes directional conviction and ought to offer support on any test). 

If participants were to auction and find acceptance into areas of prior low volume, then future discovery ought to be volatile and quick as participants look to areas of high volume for favorable entry or exit.
Graphic: 65-minute profile chart of the Micro E-mini S&P 500 Futures updated 12:30 PM ET Sunday.

News And Analysis

Moody’s discusses taper – maybe this year, maybe not.

Single-family home construction the highest since 2007.

Fannie Mae says COVID-19 surge won’t impact growth. 

Goldman Sachs cut its U.S. growth forecast on the virus.

APAC corporate rating recovery may stall as cases rise.

Wall Street is just as baffled about markets as last year.

Canadian inflation has risen to 3.7%, troubling Trudeau. 

Powell second term approval boosted by Yellen backing.

A gaping 10-year bond call reveals growth uncertainties.

Michael Burry of ‘Big Short’ bet against ARK Invest ETF.

Outcry rises after White House looks to quell gas prices.

Big risks and trends facing banks globally and regionally.

Could a Western U.S. drought threaten municipal credit.

What People Are Saying

About

After years of self-education, strategy development, and trial-and-error, Renato Leonard Capelj began trading full-time and founded Physik Invest to detail his methods, research, and performance in the markets. 

Additionally, Capelj is a finance and technology reporter. Some of his biggest works include interviews with leaders such as John Chambers, founder and CEO, JC2 Ventures, Kevin O’Leary, businessman and Shark Tank host, Catherine Wood, CEO and CIO, ARK Invest, among others.

Disclaimer

At this time, Physik Invest does not manage outside capital and is not licensed. In no way should the materials herein be construed as advice. Derivatives carry a substantial risk of loss. All content is for informational purposes only.

Categories
Commentary

Daily Brief For August 18, 2021

Market Commentary

Equity index futures recover from a violent liquidation.

  • Push-pull on contradicting narratives.
  • Ahead: Housing data, FOMC minutes.
  • Volatility rises ahead of a large OPEX.

What Happened: U.S. stock index futures auctioned sideways to higher, overnight, ahead of key releases including the latest Federal Reserve minutes.

“Unless Fed minutes ‘reveal something substantively different from recent source stories, the market is unlikely to react significantly, and choppy trading may continue,’” Mizuho International Plc strategists including Peter Chatwell said in a note featured by Bloomberg.

Ahead is data on building permits and housing starts (8:30 AM ET), Fed speak by James Bullard (12:00 PM ET), and FOMC minutes (2:00 PM ET).

Graphic updated 6:45 AM ET. Sentiment Neutral if expected /ES open is inside of the prior day’s range. See here for more on the Dark Pool Index (DPI) and Gamma (GEX). A higher DPI approximation is bullish. At the same time, the lower the GEX approximation, the more volatility. SHIFT data used for options activity approximation. Note that options flow is sorted by the call premium spent; if green and more positive then more was spent on call options. Breadth reflects a reading of the prior day’s Advance/Decline indicator. VIX reflects a current reading of the CBOE Volatility Index from 0-100.

What To Expect: As of 6:45 AM ET, Wednesday’s regular session (9:30 AM – 4:00 PM EST) in the S&P 500 will likely open inside of prior-range and -value, suggesting a limited potential for immediate directional opportunity.

Adding, during the prior day’s regular trade, on weak intraday breadth and market liquidity metrics, the worst-case outcome occurred, evidenced by trade below the $4,456.75 low volume area (LVNode) pivot.

This is significant because the initiative trade resulted in a test of the $4,422.75 balance area high (BAH) – a go/no-go level on a prior breakout – as well as the 20-day simple moving average, a metric that ought to solicit a response by short-term (i.e., technically driven) participants who may be unable to defend retests.

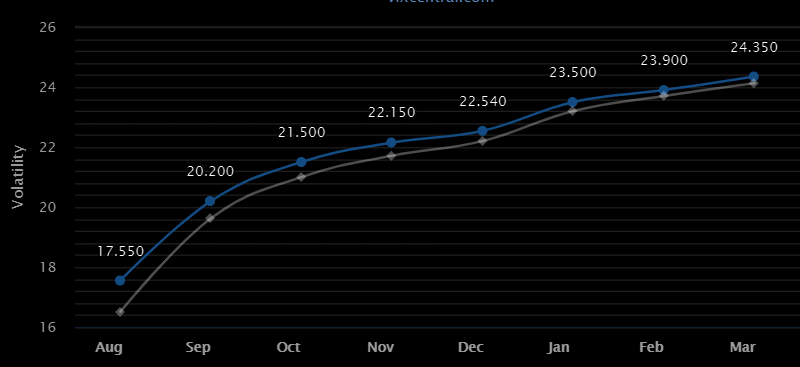
Further, the aforementioned trade is happening in the context of a rollover in macro expectations, peak long equity positioning, breadth divergences, a monthly options expiry (OPEX), as well as a shift higher in the VIX futures term structure

The implications of these themes on price are contradictory; to elaborate, extended positioning – which alone suggests risks are asymmetric – coupled with a large OPEX and pronounced shift in shorter-dated VIX expiries, warns of elevated near-term risks for equity market stability.

Graphic: VIX term structure shifts higher with the biggest move happening at the short end of the curve, via VIX Central, from The Market Ear.

Moreover, for today, given expectations of middling volatility and responsive trade, participants may make use of the following frameworks.

In the best case, the S&P 500 trades sideways or higher; activity above the $4,447.25 high volume area (HVNode) pivot puts in play the $4,456.75 low volume area (LVNode). Initiative trade beyond the $4,456.75 LVNode could reach as high as the $4,463.75 LVNode and $4,476.50 overnight high (ONH).

In the worst case, the S&P 500 trades lower; activity below the $4,447.25 HVNode puts in play the $4,434.25 LVNode. Initiative trade beyond the $4,434.25 LVNode could reach as low as the aforementioned $4,422.75 BAH and $4,411.00 VPOC, which is a tick or so below the minimal excess low Tuesday’s liquidation produced.

Volume Areas: A structurally sound market will build on past areas of high volume. Should the market trend for long periods of time, it will lack sound structure (identified as a low volume area which denotes directional conviction and ought to offer support on any test). 

If participants were to auction and find acceptance into areas of prior low volume, then future discovery ought to be volatile and quick as participants look to areas of high volume for favorable entry or exit.

Overnight Rally Highs (Lows): Typically, there is a low historical probability associated with overnight rally-highs (lows) ending the upside (downside) discovery process.

Excess: A proper end to price discovery; the market travels too far while advertising prices. Responsive, other-timeframe (OTF) participants aggressively enter the market, leaving tails or gaps which denote unfair prices.

POCs: POCs are valuable as they denote areas where two-sided trade was most prevalent. Participants will respond to future tests of value as they offer favorable entry and exit.
Graphic: 65-minute profile chart of the Micro E-mini S&P 500 Futures updated 6:45 AM ET.

News And Analysis

Mixed messages in new home purchase applications.

China quietly defuses hidden government debt bomb.

Consumers are wary of COVID return amid recovery.

ARK Invest’s Cathie Wood hits back at Michael Burry.

President Biden plans to urge COVID-19 booster shot.

U.S. freezes nearly $9.5B in Afghanistan bank assets.

The stage is set for the next leg up in cyclicals, value.

JPMorgan and Lloyds look to spur more fintech deals.

Developments in Afghanistan may threaten neighbors.

What People Are Saying

About

After years of self-education, strategy development, and trial-and-error, Renato Leonard Capelj began trading full-time and founded Physik Invest to detail his methods, research, and performance in the markets. 

Additionally, Capelj is a finance and technology reporter. Some of his biggest works include interviews with leaders such as John Chambers, founder and CEO, JC2 Ventures, Kevin O’Leary, businessman and Shark Tank host, Catherine Wood, CEO and CIO, ARK Invest, among others.

Disclaimer

At this time, Physik Invest does not manage outside capital and is not licensed. In no way should the materials herein be construed as advice. Derivatives carry a substantial risk of loss. All content is for informational purposes only.
Categories
Commentary

Daily Brief For August 17, 2021

Market Commentary

Equity index futures traded lower overnight.

  • COVID-19, SEC, and political tension.
  • Ahead: Retail sales, NAHB, and more.
  • Indexes positioned for sideways trade.

What Happened: U.S. stock index futures auctioned lower overnight alongside news of COVID-19 lockdowns, an SEC warning on Chinese company risks, and tensions in Afghanistan.

Ahead is data on retail sales (8:30 AM ET), industrial production (9:15 AM ET), capacity utilization (9:15 AM ET), business inventories (10:00 AM ET), and the NAHB home builders’ index (10:00 AM ET). Jerome Powell speaks at (1:00 PM ET) while Neel Kashkari is scheduled to speak at (3:45 PM ET).

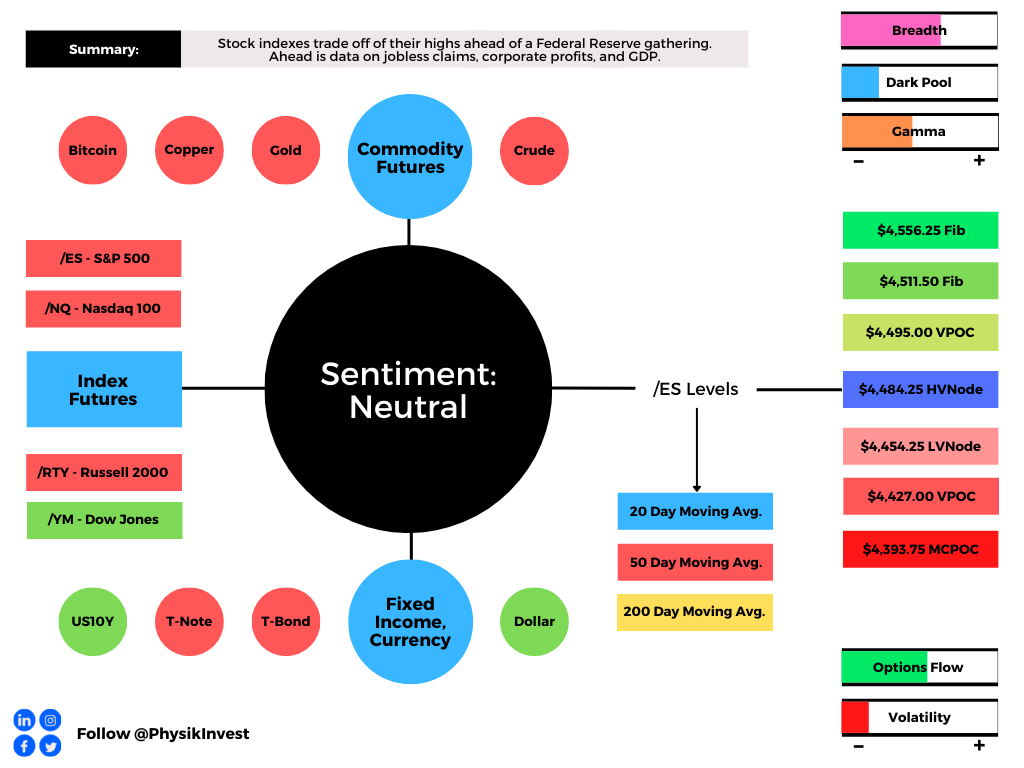
Graphic updated 6:30 AM ET. Sentiment Neutral if expected /ES open is inside of the prior day’s range. See here for more on the Dark Pool Index (DPI) and Gamma (GEX). A higher DPI approximation is bullish. At the same time, the lower the GEX approximation, the more volatility. SHIFT data used for options activity approximation. Note that options flow is sorted by the call premium spent; if green and more positive then more was spent on call options. Breadth reflects a reading of the prior day’s Advance/Decline indicator. VIX reflects a current reading of the CBOE Volatility Index from 0-100.

What To Expect: As of 6:30 AM ET, Tuesday’s regular session (9:30 AM – 4:00 PM EST) in the S&P 500 will likely open inside of prior-range and -value, suggesting a limited potential for immediate directional opportunity.

Adding, during the prior day’s regular trade, on weak intraday breadth and market liquidity metrics, the best case outcome occurred, evidenced by trade above the $4,447.75 high volume area (HVNode). This is significant because this initiative trade resulted in a new overnight all-time high (ONH) at $4,476.50. Typically, there is a low historical probability associated with overnight rally-highs ending the upside discovery process.

Gap Scenarios In Play: Gaps ought to fill quickly. Should they not, that’s a signal of strength; do not fade. Leaving value behind on a gap-fill or failing to fill a gap (i.e., remaining outside of the prior session’s range) is a go-with indicator.
Auctioning and spending at least 1-hour of trade back in the prior range suggests a lack of conviction; in such a case, do not follow the direction of the most recent initiative activity.
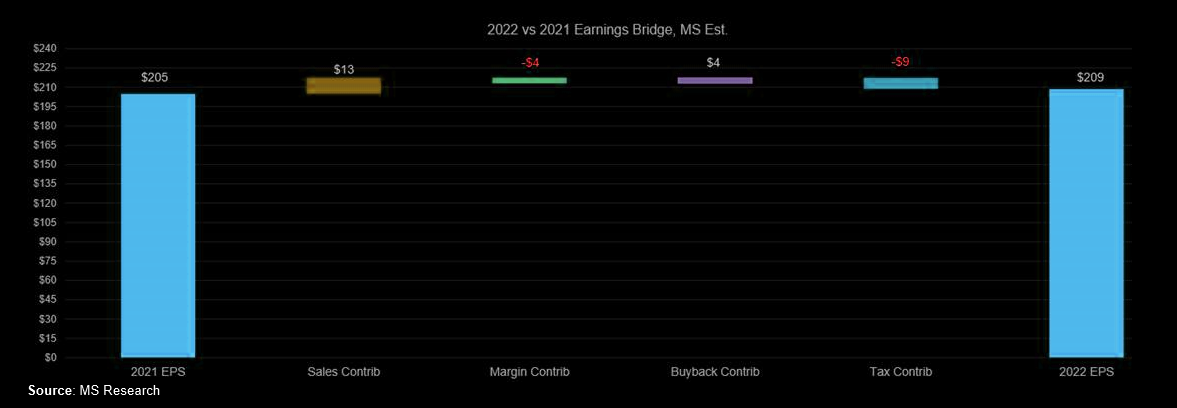
Further, the aforementioned trade is happening in the context of great earnings, pandemic-induced clampdowns on mobility, monetary and fiscal policy evolution, SEC comments against Chinese risks, as well as tension in Afghanistan.

Graphic: Morgan Stanley boosts earnings forecast due to exceptional results. 

With equities more so priced to perfection, the implications of the aforementioned themes on price would be thought of as contradictory; to elaborate, coming into potentially big fundamental catalysts like the Economic Policy Symposium in Jackson Hole, Wyoming, August 26-28, 2021, participants are positioned in such a manner that ought to dampen volatility.

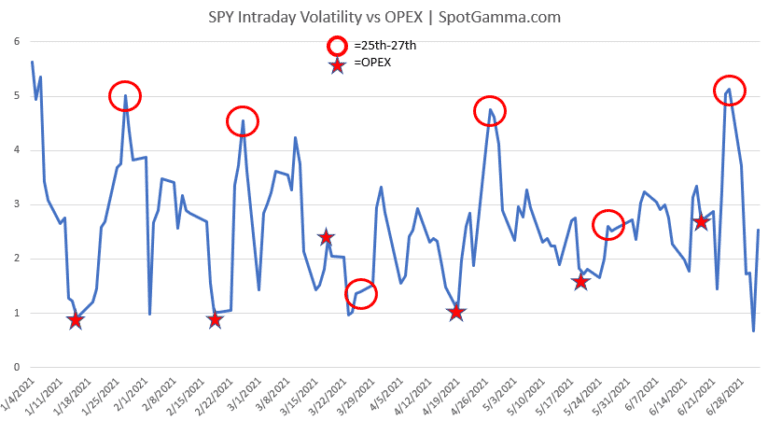
In light of the upcoming August options expiration (OPEX), we point to SpotGamma findings that suggest after OPEX, “the market tends to experience its largest intraday volatility which corresponds to the reduction in large options positions, and the hedging associated with them.”

Graphic: SpotGamma data suggests an increase in volatility after the removal of large options positions. 

Moreover, for today, given expectations of middling volatility and responsive trade, participants may make use of the following frameworks.

In the best case, the S&P 500 trades sideways or higher; activity above the $4,456.75 low volume area (LVNode) puts in play the $4,463.75 LVNode. Initiative trade beyond the $4,463.75 LVNode could reach as high as the $4,476.50 overnight high (ONH) and $4,482.25 Fibonacci extension.

In the worst case, the S&P 500 trades lower; activity below the $4,456.75 LVNode likely puts in play the $4,447.25 HVNode. Initiative trade beyond the $4,447.25 HVNode could reach as low as the $4,437.00 untested point of control (VPOC) and $4,422.75 balance area high (BAH).

Volume Areas: A structurally sound market will build on past areas of high volume. Should the market trend for long periods of time, it will lack sound structure (identified as a low volume area which denotes directional conviction and ought to offer support on any test). 

If participants were to auction and find acceptance into areas of prior low volume, then future discovery ought to be volatile and quick as participants look to areas of high volume for favorable entry or exit.

POCs: POCs are valuable as they denote areas where two-sided trade was most prevalent. Participants will respond to future tests of value as they offer favorable entry and exit.

Balance (Two-Timeframe Or Bracket): Rotational trade that denotes current prices offer favorable entry and exit. Balance-areas make it easy to spot a change in the market (i.e., the transition from two-time frame trade, or balance, to one-time frame trade, or trend). 
Graphic: 65-minute profile chart of the Micro E-mini S&P 500 Futures updated 6:30 AM ET.

News And Analysis

Soros joined by D1, Soroban in the exit of Chinese stakes. 

The White House attempts to balance climate, oil policies.

SPAC boom creates fresh target for short-sellers, activists.

Inflation cherry-pickers have trouble drowning out the noise.

The U.S. declared its first Western reservoir water shortage.

Michael Burry of ‘Big Short’ bet against Ark Invest’s ARKK.

President Joe Biden defended U.S. exits from Afghanistan. 

Why Wood changed her ARKK ETF’s China exposure to 0.

What People Are Saying

About

After years of self-education, strategy development, and trial-and-error, Renato Leonard Capelj began trading full-time and founded Physik Invest to detail his methods, research, and performance in the markets. 

Additionally, Capelj is a finance and technology reporter. Some of his biggest works include interviews with leaders such as John Chambers, founder and CEO, JC2 Ventures, Kevin O’Leary, businessman and Shark Tank host, Catherine Wood, CEO and CIO, ARK Invest, among others.

Disclaimer

At this time, Physik Invest does not manage outside capital and is not licensed. In no way should the materials herein be construed as advice. Derivatives carry a substantial risk of loss. All content is for informational purposes only.