Categories
Commentary

Daily Brief For August 13, 2021

Editor’s Note: Happy Friday! If you found today’s note helpful, consider sharing!

Market Commentary

Equity index futures are sideways to higher on light volume and poor structure.

  • Themes of inflation, jobs, and liquidity.
  • Ahead: Import Price Index, Sentiment.
  • Yields drop; Nasdaq 100 strengthens.

What Happened: U.S. stock index futures auctioned sideways to higher alongside a dip in yields after data revealed persistence in business-related inflationary pressures and a drop in jobless claims.

“While inflation has been the overarching theme this week, U.S. jobless data from yesterday highlighted the improving employment backdrop as well,” said Jim Reid, a strategist at Deutsche Bank AG (NYSE: DB) in London. “Yesterday’s U.S. producer prices surprised to the upside, highlighting the ongoing inflationary pressures from ever-rising commodity costs and supply chain bottlenecks.”

Ahead is data on the import price index (8:30 AM ET) and University of Michigan sentiment (10:00 AM ET).
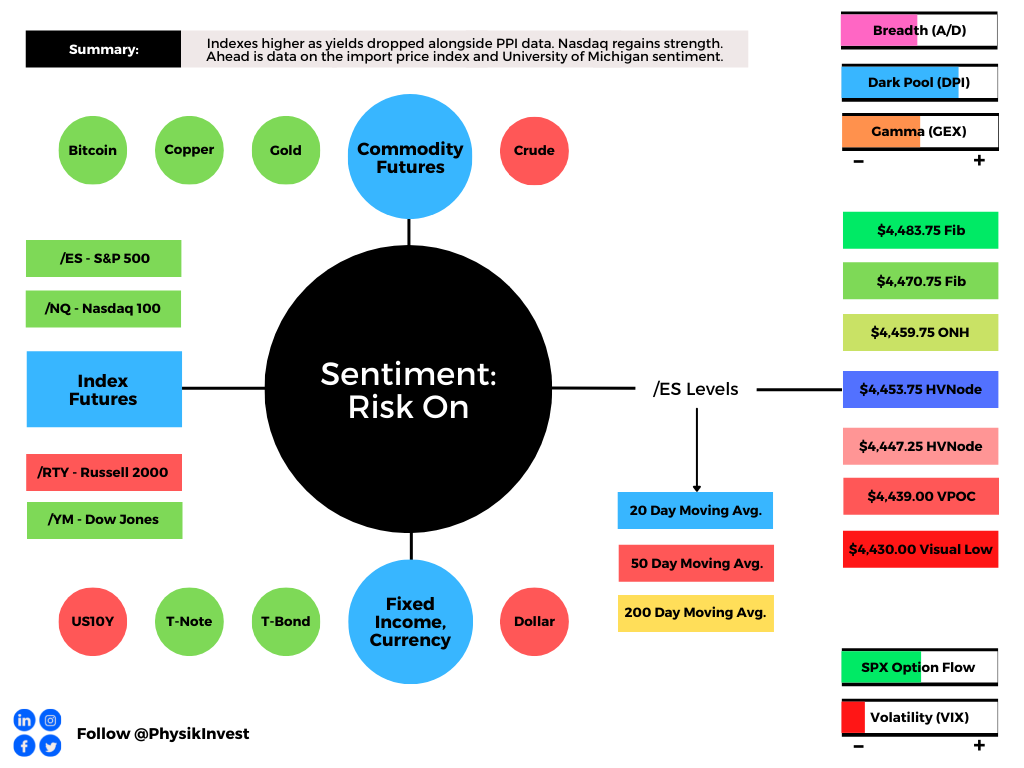
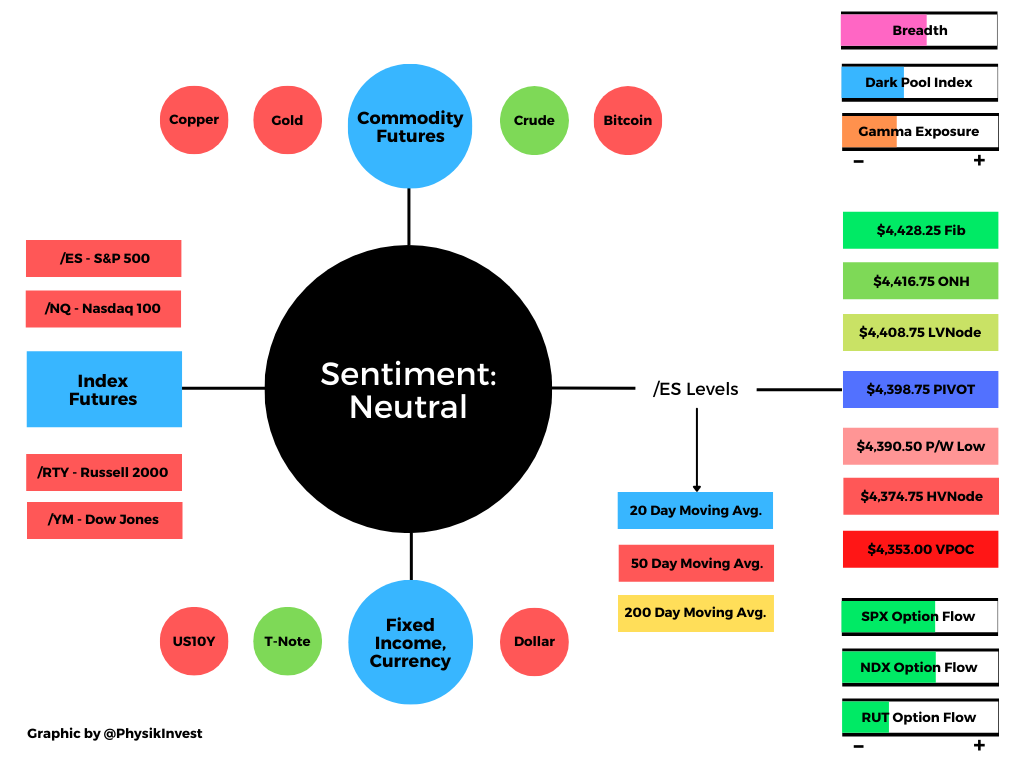
Graphic updated 6:45 AM ET. Sentiment Risk-On if expected /ES open is above the prior day’s range. See here for more on the Dark Pool Index (DPI) and Gamma (GEX). A higher DPI approximation is bullish. At the same time, the lower the GEX approximation, the more volatility. SHIFT data used for options activity approximation. Note that options flow is sorted by the call premium spent; if green and more positive then more was spent on call options. Breadth reflects a reading of the prior day’s Advance/Decline indicator. VIX reflects a current reading of the CBOE Volatility Index from 0-100.

What To Expect: As of 6:45 AM ET, Friday’s regular session (9:30 AM – 4:00 PM EST) in the S&P 500 will likely open outside of prior-range and -value, suggesting a higher potential for immediate directional opportunity.

Adding, during the prior day’s regular trade, on weak intraday breadth and market liquidity metrics, the best case outcome occurred, evidenced by trade above the $4,434.75 low volume area (LVNode). This is significant because the aforementioned advance and overnight gap occurred in the face of light volume, poor structure, and unsupportive breadth.

Gap Scenarios In Play: Gaps ought to fill quickly. Should they not, that’s a signal of strength; do not fade. Leaving value behind on a gap-fill or failing to fill a gap (i.e., remaining outside of the prior session’s range) is a go-with indicator.

Auctioning and spending at least 1-hour of trade back in the prior range suggests a lack of conviction; in such a case, do not follow the direction of the most recent initiative activity.
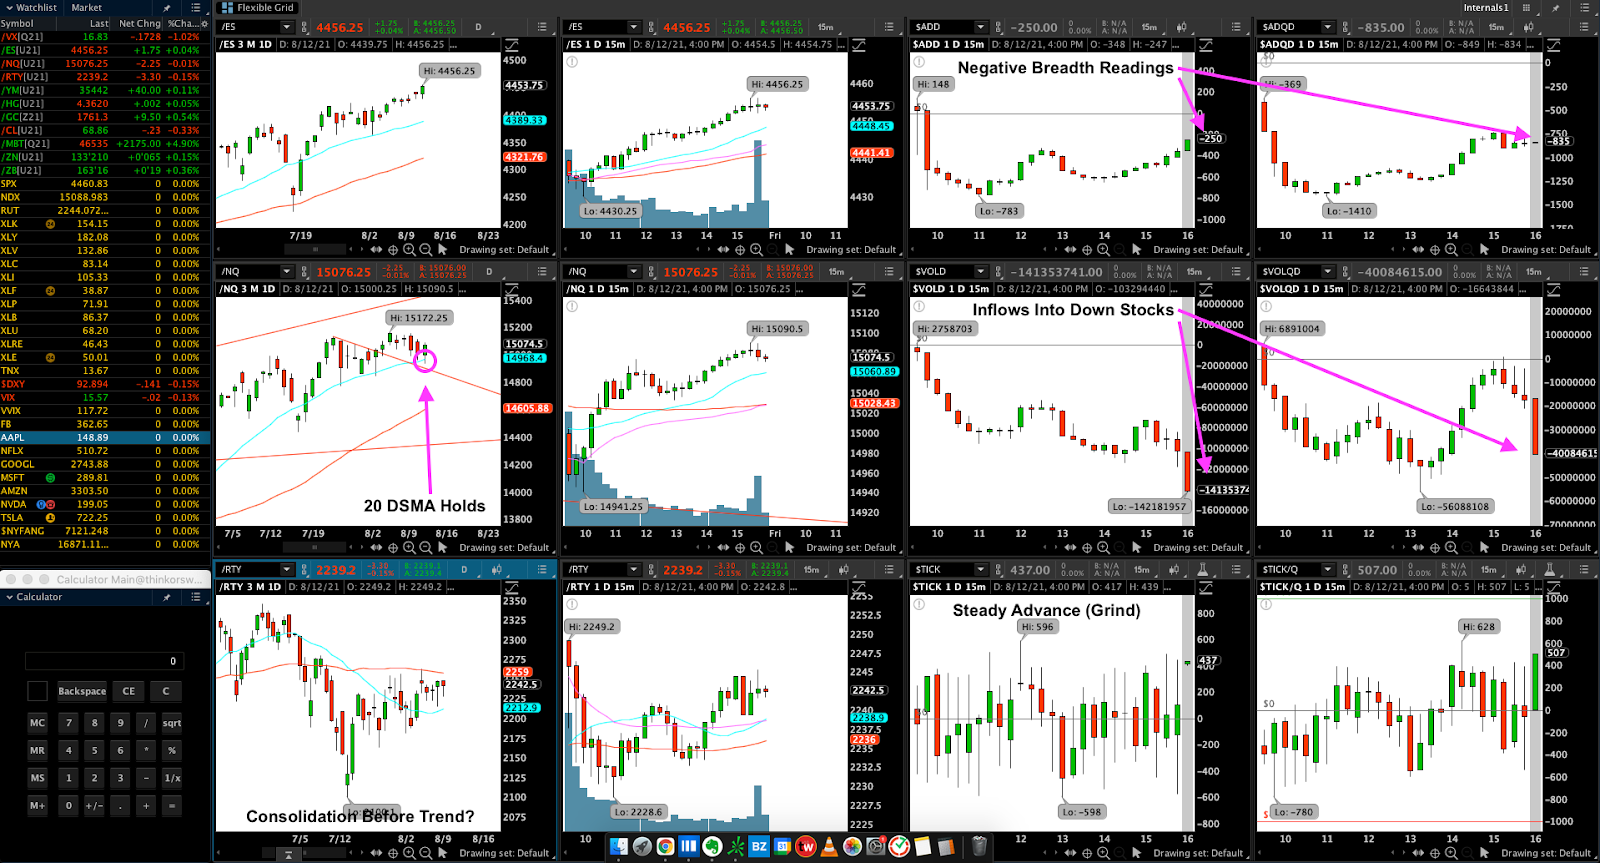
Graphic: Multi-timeframe analysis of the S&P 500, Nasdaq 100, and Russell 2000, as well as breadth metrics on the NYSE and Nasdaq exchanges.
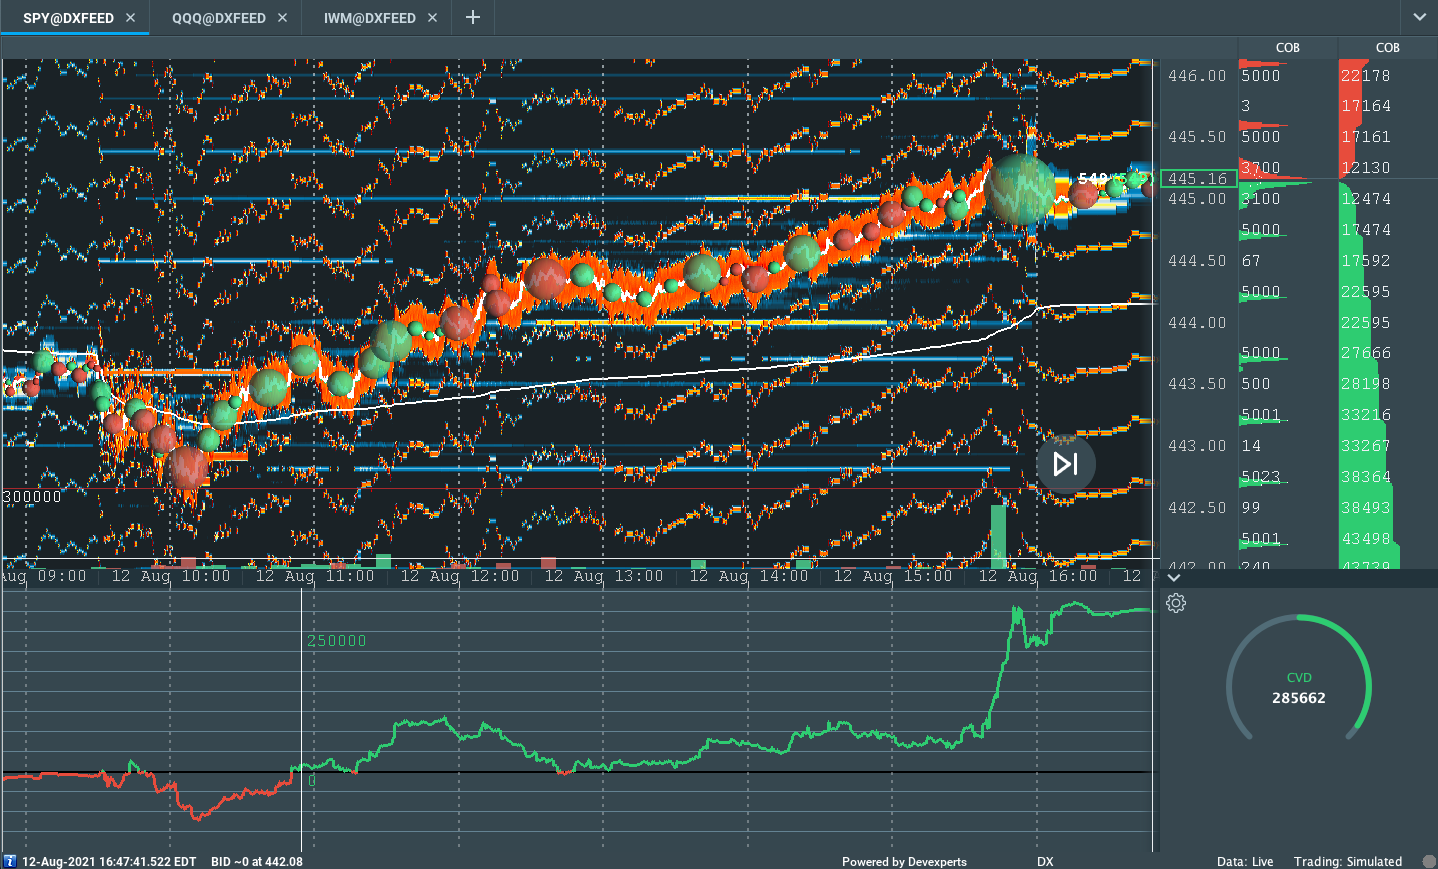
Graphic: SPDR S&P 500 ETF Trust (NYSE: SPY) market liquidity via Bookmap.

Further, the aforementioned trade is happening in the context of liquidity concerns. This theme’s implications on price are contradictory; to elaborate, the gap between the rates of growth in the supply of money and the gross domestic product turned negative for the first time since 2018. 

“Put another way, the recovering economy is now drinking from a punch bowl that the stock market once had all to itself,” said Doug Ramsey, Leuthold Group’s chief investment officer.
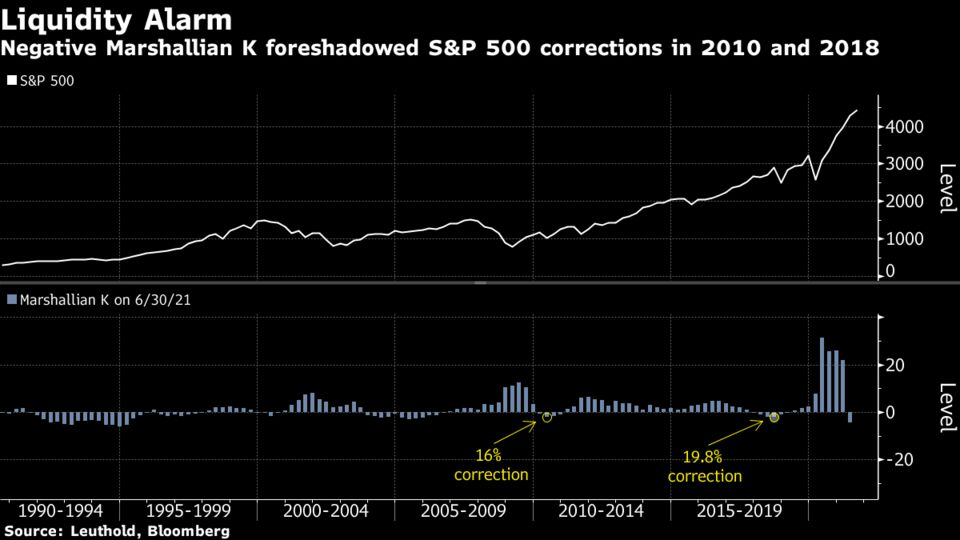
Graphic: According to Bloomberg, “While stocks kept rising during frequent negative Marshallian K readings in the 1990s, the pattern since the 2008 global financial crisis — a period when the central bank was in what Ramsey calls a “perpetual crisis mode” — begs for caution.”

Moreover, for today, given expectations of middling volatility and responsive trade, amid Friday’s options expiration (OPEX), participants may make use of the following frameworks.

Options Expiration (OPEX): Option expiries mark an end to pinning (i.e, the theory that market makers and institutions short options move stocks to the point where the greatest dollar value of contracts will expire worthless) and the reduction dealer gamma exposure.

Responsive Buying (Selling): Buying (selling) in response to prices below (above) an area of recent price acceptance.

In the best case, the S&P 500 trades sideways or higher; activity above the $4,453.75 high volume area (HVNode) pivot puts in play the $4,459.75 overnight high (ONH). Initiative trade beyond the ONH could reach as high as the $4,470.75 and $4,483.75 Fibonacci extensions.

In the worst case, the S&P 500 trades lower; activity below the $4,453.75 HVNode pivot puts in play the $4,447.25 HVNode. Initiative trade beyond the HVNode could reach as low as the $4,439.00 untested point of control (VPOC) and $4,430.00, a visual low likely generated by short-term (i.e., technically driven) participants who may be unable to defend retests.

Overnight Rally Highs (Lows): Typically, there is a low historical probability associated with overnight rally-highs (lows) ending the upside (downside) discovery process.

Volume Areas: A structurally sound market will build on past areas of high volume. Should the market trend for long periods of time, it will lack sound structure (identified as a low volume area which denotes directional conviction and ought to offer support on any test). 

If participants were to auction and find acceptance into areas of prior low volume, then future discovery ought to be volatile and quick as participants look to areas of high volume for favorable entry or exit.

POCs: POCs are valuable as they denote areas where two-sided trade was most prevalent. Participants will respond to future tests of value as they offer favorable entry and exit.

Initiative Buying (Selling): Buying (selling) within or above (below) the previous day’s value area.
Graphic: 65-minute profile chart of the Micro E-mini S&P 500 Futures updated 6:45 AM ET.

News And Analysis

Traders pile into tail-risk bets that Fed will not hike.

U.S. high yield default rate lowest start in 14 years.

The Treasury market keeps on humbling investors.

COVID downside risks are less than in prior waves.

What People Are Saying

About

After years of self-education, strategy development, and trial-and-error, Renato Leonard Capelj began trading full-time and founded Physik Invest to detail his methods, research, and performance in the markets. 

Additionally, Capelj is a finance and technology reporter. Some of his biggest works include interviews with leaders such as John Chambers, founder and CEO, JC2 Ventures, Kevin O’Leary, businessman and Shark Tank host, Catherine Wood, CEO and CIO, ARK Invest, among others.

Disclaimer

At this time, Physik Invest does not manage outside capital and is not licensed. In no way should the materials herein be construed as advice. Derivatives carry a substantial risk of loss. All content is for informational purposes only.

Categories
Commentary

Daily Brief For August 12, 2021

Market Commentary

Equity index futures sideways overnight.

  • Bond and equity volatility diverge.
  • Ahead: Claims, PPI, and WASDE.

What Happened: U.S. stock index futures auctioned sideways to higher after the release of Consumer Price Index (CPI) data and progress on stimulus. 

Ahead is data on jobless claims, as well as the PPI and latest WASDE report. 

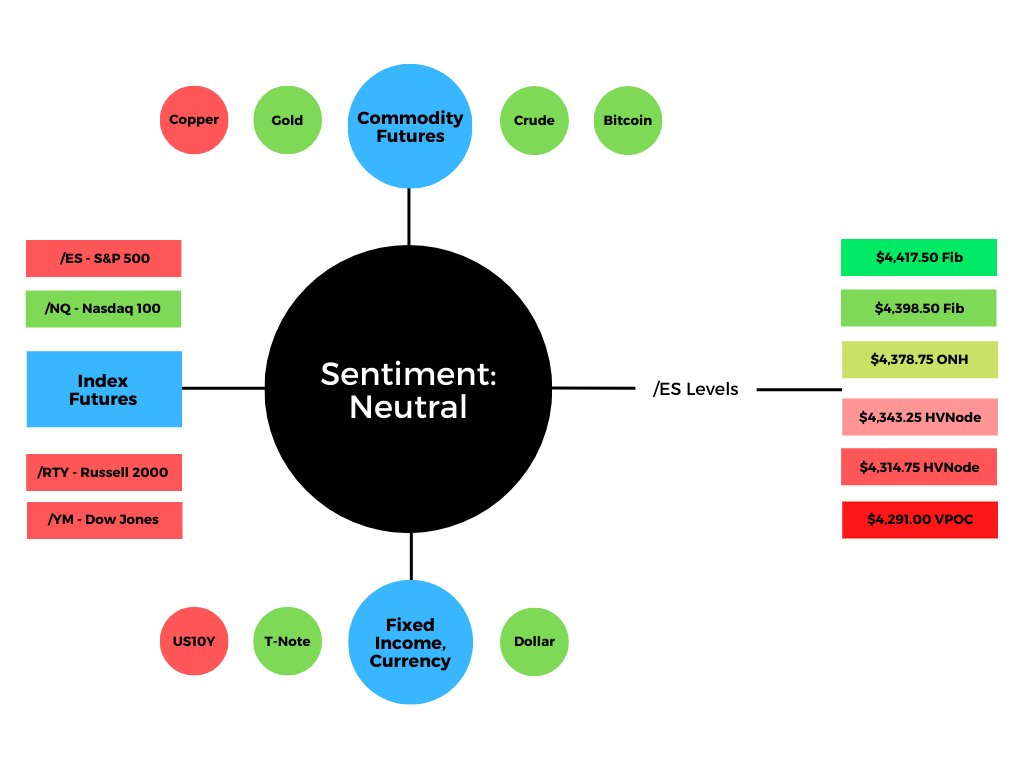
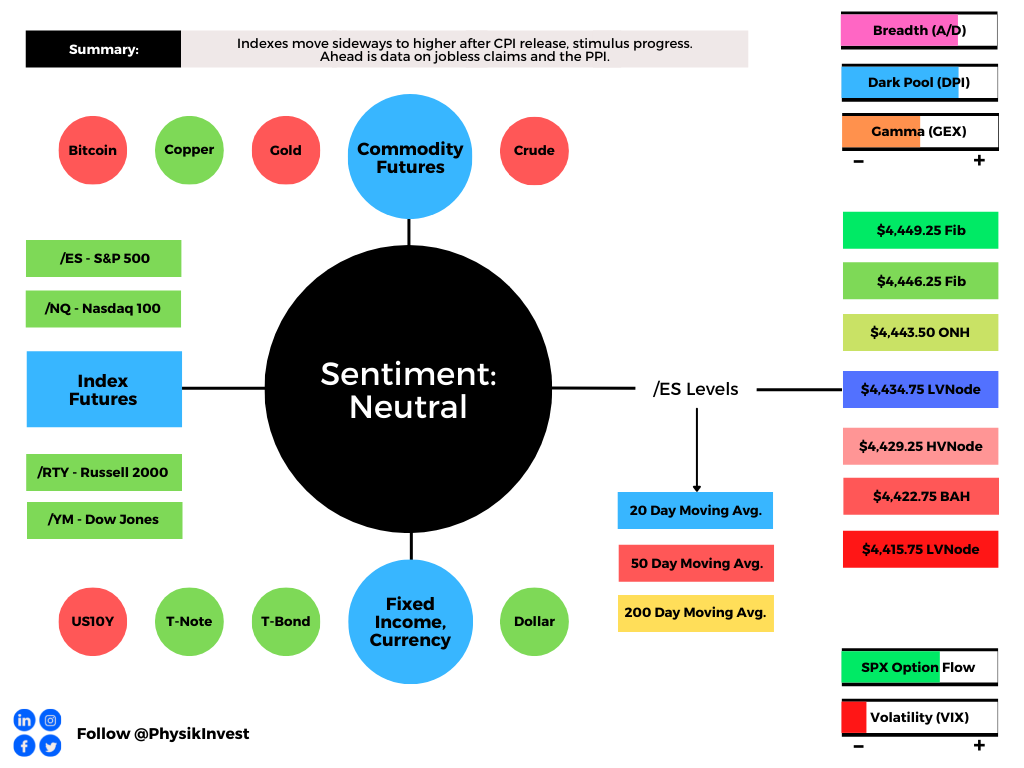
Graphic updated 6:45 AM ET. Sentiment Neutral if expected /ES open is inside of the prior day’s range. See here for more on the Dark Pool Index and Gamma. A positive Dark Pool Index reading is bullish. At the same time, the higher (lower) the gamma, the less (more) volatility. SHIFT Search data used for options activity. Note that options flow is sorted by the call premium spent; if green and more (less) positive then more (less) was spent on call options. Breadth reflects a reading of the prior day’s Advance/Decline indicator. VIX reflects a reading of the CBOE Volatility Index from 0-100.

What To Expect: As of 6:45 AM ET, Thursday’s regular session (9:30 AM – 4:00 PM EST) in the S&P 500 will likely open inside of prior-range and -value, suggesting a limited potential for immediate directional opportunity.

Adding, during the prior day’s regular trade, the best case outcome occurred, evidenced by initiative trade above the $4,422.75 balance area high (BAH), to the $4,443.50 overnight high (ONH). Thereafter, the S&P 500, in particular, traded sideways on strong intraday breadth, evidenced by an inflow into stocks that were up versus down.

Overnight Rally Highs (Lows): Typically, there is a low historical probability associated with overnight rally-highs (lows) ending the upside (downside) discovery process.

In comparison to the stronger S&P 500, Russell 2000, and Dow Jones Industrial Average, the Nasdaq 100 traded to a new two-day low, this week, amidst a divergence in equity and bond market volatility, as well as a general rise in rates.

Notwithstanding, despite the S&P 500 continuing to make higher highs in the face of strong inflows and equity buybacks, among other things, trade has been mechanical, halting short of visual references. 

Given that this trade suggests the participants involved are short-term (i.e., technically driven) in nature, caution exists on the entry of longer-term, fundamentally driven participants who deem prices to be too high and unfair.

Further, for today, participants can trade from the following frameworks. 

In the best case, the S&P 500 trades sideways or higher; activity above the $4,434.75 low volume area (LVNode) pivot puts in play the $4,443.50 overnight high (ONH). Initiative trade beyond the ONH could reach as high as the Fibonacci extensions at $4,446.25 and $4,449.25.

In the worst case, the S&P 500 trades lower; activity below the $4,434.75 LVNode puts in play the $4,429.25 high volume area (HVNode). Initiative trade beyond the HVNode could reach as low as the $4,422.75 balance area high (BAH) and $4,415.75 LVNode.

Volume Areas: A structurally sound market will build on past areas of high volume. Should the market trend for long periods of time, it will lack sound structure (identified as a low volume area which denotes directional conviction and ought to offer support on any test). 

If participants were to auction and find acceptance into areas of prior low volume, then future discovery ought to be volatile and quick as participants look to areas of high volume for favorable entry or exit.

Initiative Buying (Selling): Buying (selling) within or above (below) the previous day’s value area.
Graphic: 30-minute profile chart of the Micro E-mini S&P 500 Futures. Graphic updated 6:45 AM ET.

News And Analysis

China goes after online insurance amid wide crackdown.

U.S. infrastructure bill to provide a small boost to growth.

Traders brace for a debt ceiling ‘hot potato’ rattling rates.

China has partly shut down the world’s third-busiest port.

Delta variant is bringing a midsummer pause for airfares.

What People Are Saying

About

After years of self-education, strategy development, and trial-and-error, Renato Leonard Capelj began trading full-time and founded Physik Invest to detail his methods, research, and performance in the markets. 

Additionally, Capelj is a finance and technology reporter. Some of his biggest works include interviews with leaders such as John Chambers, founder and CEO, JC2 Ventures, Kevin O’Leary, businessman and Shark Tank host, Catherine Wood, CEO and CIO, ARK Invest, among others.

Disclaimer

At this time, Physik Invest does not manage outside capital and is not licensed. In no way should the materials herein be construed as advice. Derivatives carry a substantial risk of loss. All content is for informational purposes only.

Categories
Commentary

Daily Brief For July 29, 2021

Market Commentary

Equity index futures are sideways and divergent.

  • FOMC started the clock on tapering.
  • Ahead: Claims and U.S. GDP data.
  • NDX weak relative to RUT and SPX.

What Happened: U.S. stock index futures auctioned within prior range alongside positive earnings reports, infrastructure progress, China liquidity injections, and optimism that the Federal Reserve would not taper stimulus.

Adding, in a statement, Neil Dutta, head of U.S. economics at Renaissance Macro Research, explained: “The Fed is starting the clock on tapering. It is not happening now or even in September, but expect the pace of asset buying to slowdown late this year or early next.”

Moreover, participants should keep an eye out for data on initial and continuing jobless claims, U.S. GDP, as well as pending home sales and earnings.

Graphic updated 6:30 AM ET. Sentiment Neutral if expected /ES open is inside of the prior day’s range. See here for more on the Dark Pool Index and Gamma. A positive Dark Pool Index reading is bullish. At the same time, the higher (lower) the gamma, the less (more) volatility. SHIFT Search data used for options activity. Note that options flow is sorted by the call premium spent; if green and more (less) positive then more (less) was spent on call options. Breadth reflects a reading of the prior day’s Advance/Decline indicator.

What To Expect: As of 6:30 AM ET, Thursday’s regular session (9:30 AM – 4:00 PM EST) in the S&P 500 will likely open inside of prior-range and -value, suggesting a limited potential for immediate directional opportunity.

Adding, during the prior day’s regular trade, the best case outcome occurred, evidenced by resolve above the Volume Weighted Average Price (blue in color on the below profile graphic) anchored from the 2:00 PM ET Federal Open Market Committee (FOMC) announcement. 

This is significant because this metric paints the picture of who is winning, so to speak; simply put, since FOMC, the average buyer is in a better position.

Moreover, as evidenced by the developing 5-day balance area in the profile graphic below, participants are finding higher prices valuable as they position themselves for a directional move, given increased clarity over earnings, taper, and more. 

Balance (Two-Timeframe Or Bracket): Rotational trade that denotes current prices offer favorable entry and exit. Balance-areas make it easy to spot a change in the market (i.e., the transition from two-time frame trade, or balance, to one-time frame trade, or trend).

The modus operandi, in light of the above, is responsive trade. Auctioning beyond the $4,416.75 overnight high (ONH) or $4,364.50 opens the window for follow-through. In such a case, participants ought to abandon their focus on responsive trade. 

Overnight Rally Highs (Lows): Typically, there is a low historical probability associated with overnight rally-highs (lows) ending the upside (downside) discovery process.

Initiative Buying (Selling): Buying (selling) within or above (below) the previous day’s value area.

Responsive Buying (Selling): Buying (selling) in response to prices below (above) an area of recent price acceptance.

Internally speaking, after the Russell 2000 and Nasdaq 100 weakness in days prior, conditions improved markedly. Breadth, at the exchange level, was positive with a steady inflow into the stocks that were up, versus those that were down. However, though, weakness in the Nasdaq 100 returned this morning, a potential drag on any initiative activity in the coming session(s). 

To note, quickly, we remember that as time passes, alongside the ebbing of post-FOMC volatility, there will be positive flows with respect to the unwind of options hedges.

Further, for today, participants can trade from the following frameworks. 

In the best case, the S&P 500 trades sideways or higher; activity above the $4,393.75 high volume area (HVNode) pivot puts in play the $4,406.25 low volume area (LVNode). Initiative trade beyond the $4,406.25 LVNode puts in play the $4,416.75 ONH and $4,428.25 Fibonacci extension.

In the worst case, the S&P 500 trades lower; activity below the $4,393.75 HVNode puts in play the $4,381.75 LVNode. Initiative trade beyond the $4,381.75 LVNode could reach as low as the $4,364.50 LVNode and $4,341.75 micro-composite point of control (MCPOC).

Volume Areas: A structurally sound market will build on past areas of high volume. Should the market trend for long periods of time, it will lack sound structure (identified as a low volume area which denotes directional conviction and ought to offer support on any test). 

If participants were to auction and find acceptance into areas of prior low volume, then future discovery ought to be volatile and quick as participants look to areas of high volume for favorable entry or exit.

POCs: POCs are valuable as they denote areas where two-sided trade was most prevalent. Participants will respond to future tests of value as they offer favorable entry and exit.
Graphic: 65-minute profile chart of the Micro E-mini S&P 500 Futures. Graphic updated 6:30 AM ET.

News And Analysis

Gold demand has yet to recover fully from COVID-19, says WGC. 

MBS Recap: Fed hinted at a tapering, but bonds don’t really care.

The four biggest ways that the Robinhood app changed investing.

Biden’s two-front economic agenda made headway in the Senate.

China stocks rally as Beijing intensifies efforts to calm the market.

S&P Data: Growth is still on track despite rising COVID-19 cases.

U.S. corporate bond market near record pace as Fed taper looms.

Oversight of China payment companies likely boosts compliance.

What People Are Saying

About

After years of self-education, strategy development, and trial-and-error, Renato Leonard Capelj began trading full-time and founded Physik Invest to detail his methods, research, and performance in the markets. Additionally, Capelj is a finance and technology reporter. Some of his biggest works include interviews with leaders such as John Chambers, founder and CEO, JC2 Ventures, Kevin O’Leary, businessman and Shark Tank host, Catherine Wood, CEO and CIO, ARK Invest, among others.

Disclaimer

At this time, Physik Invest does not manage outside capital and is not licensed. In no way should the materials herein be construed as advice. Derivatives carry a substantial risk of loss. All content is for informational purposes only.

Categories
Commentary

Daily Brief For July 28, 2021

Market Commentary

Equity index futures trade higher ahead of key fundamental events.

  • ECB comments, COVID, geopolitics.
  • Ahead: Trade data, FOMC, earnings.
  • Mixed bag. No follow-through lower.

What Happened: U.S. stock index futures auctioned sideways to higher ahead of some key fundamental developments.

In addition to the 8:30 AM release on advance trade in goods, as well as key earnings from heavily-weighted index constituents like Facebook Inc (NASDAQ: FB), participants will look to also price in the 2:00 PM ET Federal Open Market Committee (FOMC) announcement and Fed Chair Jerome Powell’s press conference.

As stated in the Weekly Brief, the U.S. is in a different place from the rest of the world and is likely to eliminate its output gap this year which would call for a tightening in policy and dollar strengthening, helping douse inflation.

Moody’s strategists note: “The impressive growth in value across many asset classes is projected to taper off within the next couple of years as supportive policy is unwound. The 10-year Treasury yield will rise above 2% by 2022 and the fiscal tailwinds will also have faded by then.”

Graphic updated 7:00 AM ET. Sentiment Neutral if expected /ES open is inside of the prior day’s range. See here for more on the Dark Pool Index and Gamma. A positive Dark Pool Index reading is bullish. At the same time, the higher (lower) the gamma, the less (more) volatility. SHIFT Search data used for options activity. Note that options flow is sorted by the call premium spent; if green and more (less) positive then more (less) was spent on call options. Breadth reflects a reading of the prior day’s Advance/Decline indicator.

What To Expect: As of 7:00 AM ET, Wednesday’s regular session (9:30 AM – 4:00 PM EST) in the S&P 500 will likely open inside of prior-range and -value, suggesting a limited potential for immediate directional opportunity.

Adding, during Tuesday’s volatile trade, the best case outcome occurred, evidenced by the S&P 500’s trade above a developing Volume Weighted Average Price (VWAP) pinch. This suggests the average buyer since the overnight high – $4,416.76 ONH – is in a winning position.

Overnight Rally Highs (Lows): Typically, there is a low historical probability associated with overnight rally-highs (lows) ending the upside (downside) discovery process.

Moving on, it’s important to take note of some topline and internal divergences. 

After establishing the new ONH, weakness in China spilled over; U.S. equity index futures, led by the Russell 2000 and Nasdaq 100 sold fast and heavy up until the Nasdaq 100 found responsive buyers at a key technical level – the 20-day simple moving average – that corresponded with a thick base of resting liquidity. After, the entire market reversed and closed in range.

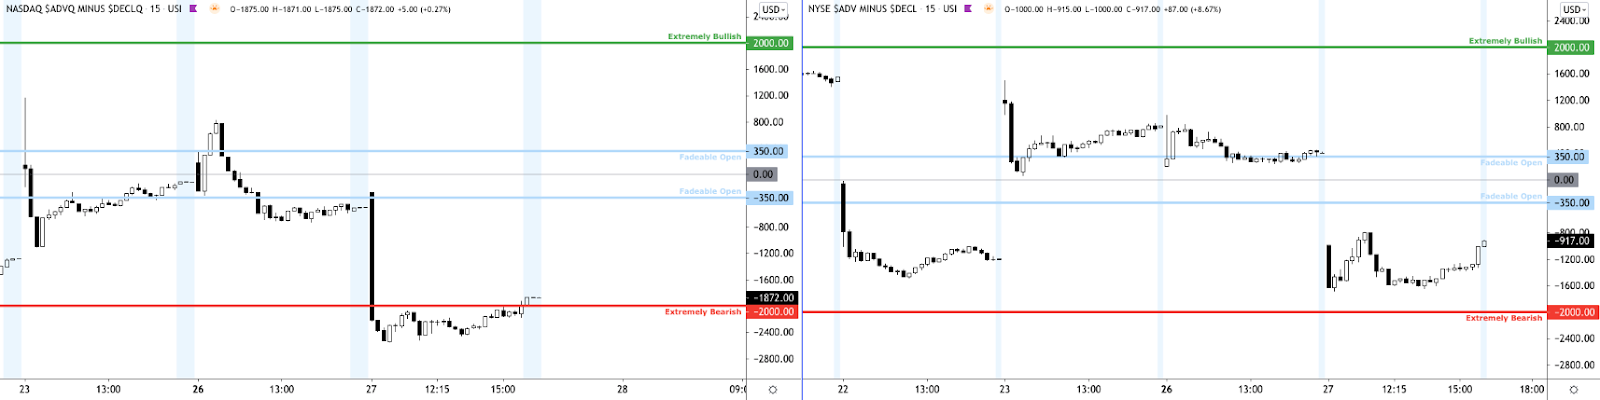
In terms of internal divergences, breadth was significantly weaker on the Nasdaq side.

Graphic: Equity indexes traded lower as internal metrics – like the ratio of advancers to decliners – weakened.

Given the technical context, for today, participants can trade from the following frameworks. 

In the best case, the S&P 500 trades sideways or higher; activity above the $4,392.25 high volume area (HVNode) pivot likely puts in play the $4,406.25 low volume area (LVNode). Trade beyond the LVNode could reach as high as the $4,416.75 ONH and $4,428.25 Fibonacci extension.

In the worst case, the S&P 500 trades lower; activity below the $4,392.25 HVNode pivot likely puts in play the $4,381.75 LVNode. Trade beyond the $4,381.75 figure could reach as low as the $4,364.50 LVNode and $4,353.00 untested Point of Control (VPOC).

Volume Areas: A structurally sound market will build on past areas of high volume. Should the market trend for long periods of time, it will lack sound structure (identified as a low volume area which denotes directional conviction and ought to offer support on any test). 

If participants were to auction and find acceptance into areas of prior low volume, then future discovery ought to be volatile and quick as participants look to areas of high volume for favorable entry or exit.

POCs: POCs are valuable as they denote areas where two-sided trade was most prevalent. Participants will respond to future tests of value as they offer favorable entry and exit.
Graphic: 65-minute profile chart of the Micro E-mini S&P 500 Futures. Graphic updated 6:55 AM ET.

News And Analysis

The COVID trauma has changed economics forever. 

Credit Suisse probe is showing due diligence failings.

Spiraling debt crisis confronts Evergrande billionaire.

American job market optimism reached 21-year high.

What People Are Saying

About

After years of self-education, strategy development, and trial-and-error, Renato Leonard Capelj began trading full-time and founded Physik Invest to detail his methods, research, and performance in the markets. Additionally, Capelj is a finance and technology reporter. Some of his biggest works include interviews with leaders such as John Chambers, founder and CEO, JC2 Ventures, Kevin O’Leary, businessman and Shark Tank host, Catherine Wood, CEO and CIO, ARK Invest, among others.

Disclaimer

At this time, Physik Invest does not manage outside capital and is not licensed. In no way should the materials herein be construed as advice. Derivatives carry a substantial risk of loss. All content is for informational purposes only.
Categories
Commentary

Daily Brief For July 27, 2021

Market Commentary

Led by the Russell 2000, U.S. equity index futures explored lower overnight.

  • Risk-off everything China-related.
  • Ahead: Data dump and earnings.
  • S&P stuck in range, VWAP pinch.

What Happened: U.S. stock index futures auctioned sideways to lower as equity weakness in China deepened. Chinese government bonds and the yuan fell also, alongside fears that U.S. funds are selling Hong Kong and China assets aggressively.

In light of the volatility, Crescat Capital portfolio manager Otavio Costa tweeted: “A yuan devaluation is one of the main deflationary risks today. I know you heard this over and over again… but something is indeed unraveling. Chinese banks and ADRs are in big trouble. PBOC will be forced to act.”

A devaluation is indeed something to fear. The People’s Bank of China (PBOC) roiled global equity markets after its 2015 yuan devaluation.

In addition to this context, ahead, participants will receive data on durable and nondefense capital good orders, the S&P Case-Shiller home price index, consumer confidence, housing vacancies, as well as Apple Inc (NASDAQ: AAPL), Microsoft Corporation (NASDAQ: MSFT), and Alphabet Inc (NASDAQ: GOOGL) earnings.

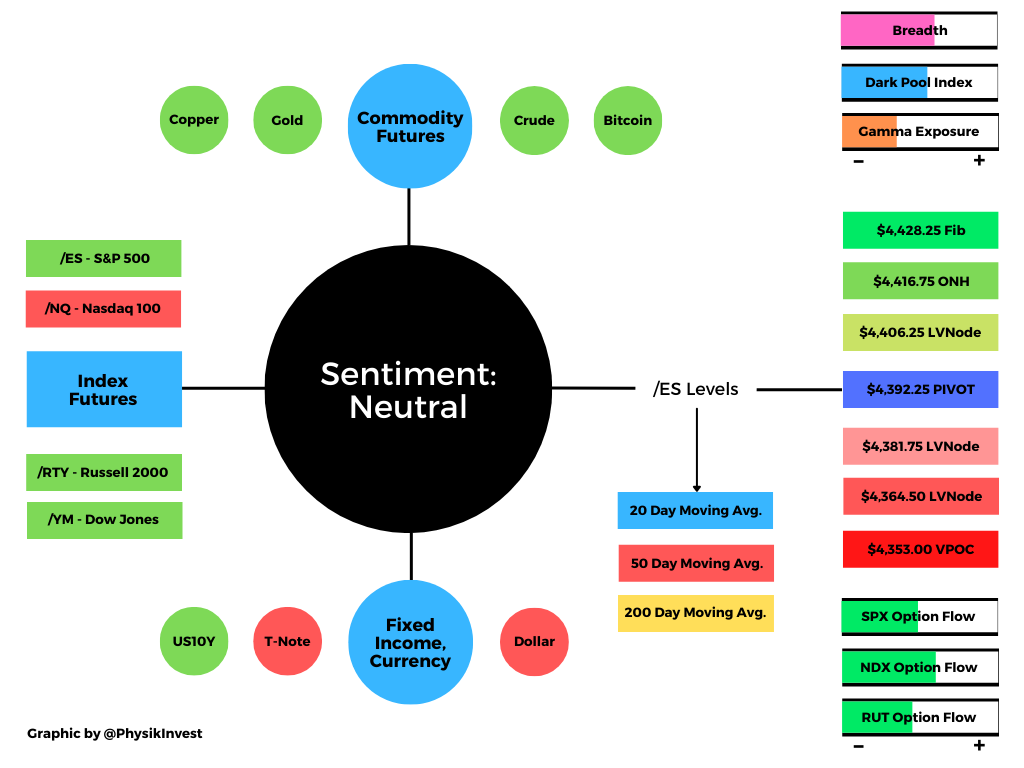
Graphic updated 6:40 AM ET. Sentiment Neutral if expected /ES open is inside of the prior day’s range. See here for more on the Dark Pool Index and Gamma. A positive Dark Pool Index reading is bullish. At the same time, the higher (lower) the gamma, the less (more) volatility. SHIFT Search data used for options activity. Note that options flow is sorted by the call premium spent; if green and more (less) positive then more (less) was spent on call options. Breadth reflects a reading of the prior day’s Advance/Decline indicator.

What To Expect: As of 6:40 AM ET, Tuesday’s regular session (9:30 AM – 4:00 PM EST) in the S&P 500 will likely open inside of prior-range and -value, suggesting a limited potential for immediate directional opportunity.

After establishing a new high – $4,416.75 – overnight, weakness in China spilled over; U.S. equity index futures, led by the Russell 2000, traded lower in conjunction with yields, a boost to the tech- and growth-heavy Nasdaq 100.

Rates: Low rates have to potential to increase the present value of future earnings making stocks, especially those that are high growth, more attractive. To note, inflation and rates move inversely to each other. Low rates stimulate demand for loans (i.e., borrowing money is more attractive). In conjunction with the rapid recovery, lower rates may solicit hawkish commentary as policymakers look to inhibit inflation.

To note, Monday’s trade happened on positive, albeit weak breadth, similar to Friday’s session. At the same time, a Volume Weighted Average Price pinch developed.

Volume Weighted Average Price (VWAP): A metric highly regarded by chief investment officers, among other participants, for quality of trade. Additionally, liquidity algorithms are benchmarked and programmed to buy and sell around VWAPs. ​​

Look to buy above a flat/rising VWAP pinch. Sell below a flat/declining VWAP pinch.

All that said, similar to Monday, a key thing to watch for is an auction failure and subsequent liquidation break, confirmed by trade below the $4,372.50 regular trade low (RTH Low).

Liquidation Breaks: The profile shape suggests participants were “too” long and had poor location.

Moreover, for today, participants can trade from the following frameworks. 

In the best case, the S&P 500 trades sideways or higher; activity above the $4,398.75 high volume area (HVNode) pivot puts in play the $4,408.75 low volume area (LVNode). Initiative trade beyond the LVNode could reach as high as the $4,416.75 overnight high (ONH) and $4,428.25 Fibonacci extension.

In the worst case, the S&P 500 trades lower; activity below the $4,398.75 HVNode pivot puts in play the $4,390.50 minimal excess low. Initiative trade beyond the $4,390.50 low could reach as low as the $4,374.25 HVNode and $4,353.00 untested Point of Control (VPOC).

Volume Areas: A structurally sound market will build on past areas of high volume. Should the market trend for long periods of time, it will lack sound structure (identified as a low volume area which denotes directional conviction and ought to offer support on any test). 

If participants were to auction and find acceptance into areas of prior low volume, then future discovery ought to be volatile and quick as participants look to areas of high volume for favorable entry or exit.

Overnight Rally Highs (Lows): Typically, there is a low historical probability associated with overnight rally-highs (lows) ending the upside (downside) discovery process.

Excess: A proper end to price discovery; the market travels too far while advertising prices. Responsive, other-timeframe (OTF) participants aggressively enter the market, leaving tails or gaps which denote unfair prices.

POCs: POCs are valuable as they denote areas where two-sided trade was most prevalent. Participants will respond to future tests of value as they offer favorable entry and exit.
Graphic: 65-minute profile chart of the Micro E-mini S&P 500 Futures. Graphic updated 6:40 AM ET.

News And Analysis

China’s yuan, bonds tank amid fears of foreign selling.

U.S. infrastructure talks are encountering some snags.

Bitcoin steady below $40,000 on Amazon speculation.

Hypothetical look at 35 years of SPX option strategies.

The Federal Reserve meeting starts today. Watch this.

What People Are Saying

About

After years of self-education, strategy development, and trial-and-error, Renato Leonard Capelj began trading full-time and founded Physik Invest to detail his methods, research, and performance in the markets. Additionally, Capelj is a finance and technology reporter. Some of his biggest works include interviews with leaders such as John Chambers, founder and CEO, JC2 Ventures, Kevin O’Leary, businessman and Shark Tank host, Catherine Wood, CEO and CIO, ARK Invest, among others.

Disclaimer

At this time, Physik Invest does not manage outside capital and is not licensed. In no way should the materials herein be construed as advice. Derivatives carry a substantial risk of loss. All content is for informational purposes only.

Categories
Commentary

Daily Brief For July 13, 2021

Market Commentary

U.S. equity index futures diverge overnight.

  • Ahead: Inflation, earnings, Fed speak.
  • SPX, RUT, DJI lower. NDX firming up.

What Happened: U.S. stock index futures traded in different directions.

The S&P 500, Russell 2000, and Dow Jones Industrial Average traded relatively weak, in comparison to the technology and growth-focused Nasdaq 100. 

This rotation is likely attributable to technical factors – issuance, short coverings, a fading reflation trade, and peak growth pushing lower Treasury yields – as well as the upcoming monthly options expiration and pre-earnings positioning.

Ahead is data on inflation and earnings with some Fed speak around noon Eastern time. 

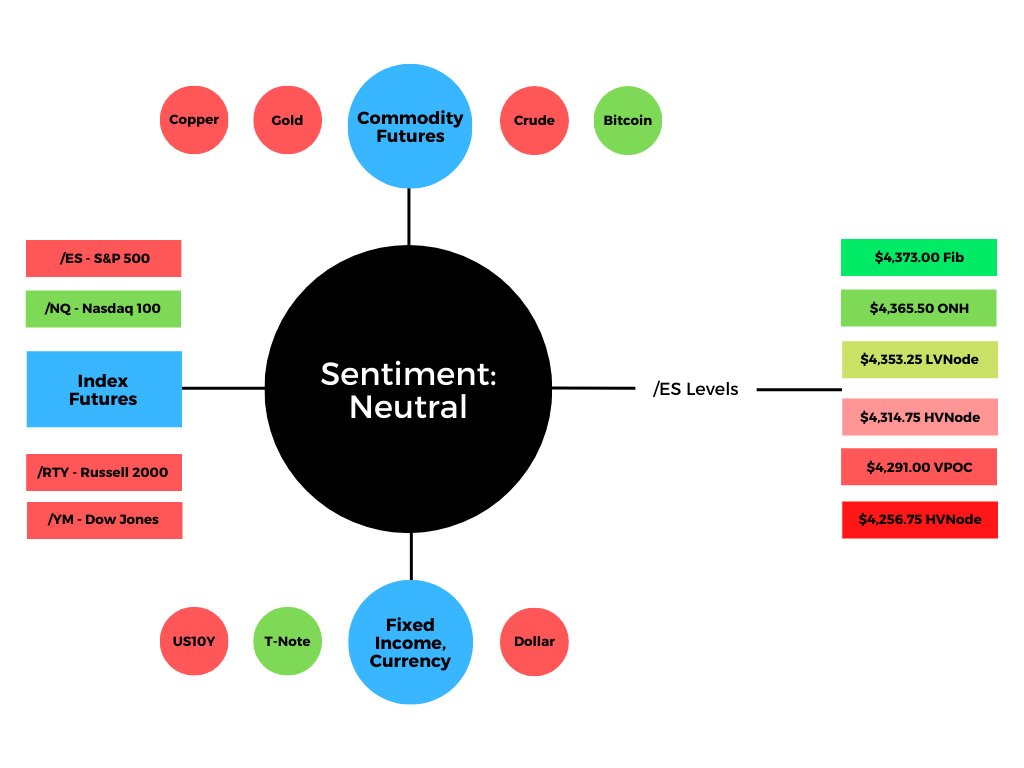
Graphic updated 7:20 AM ET.

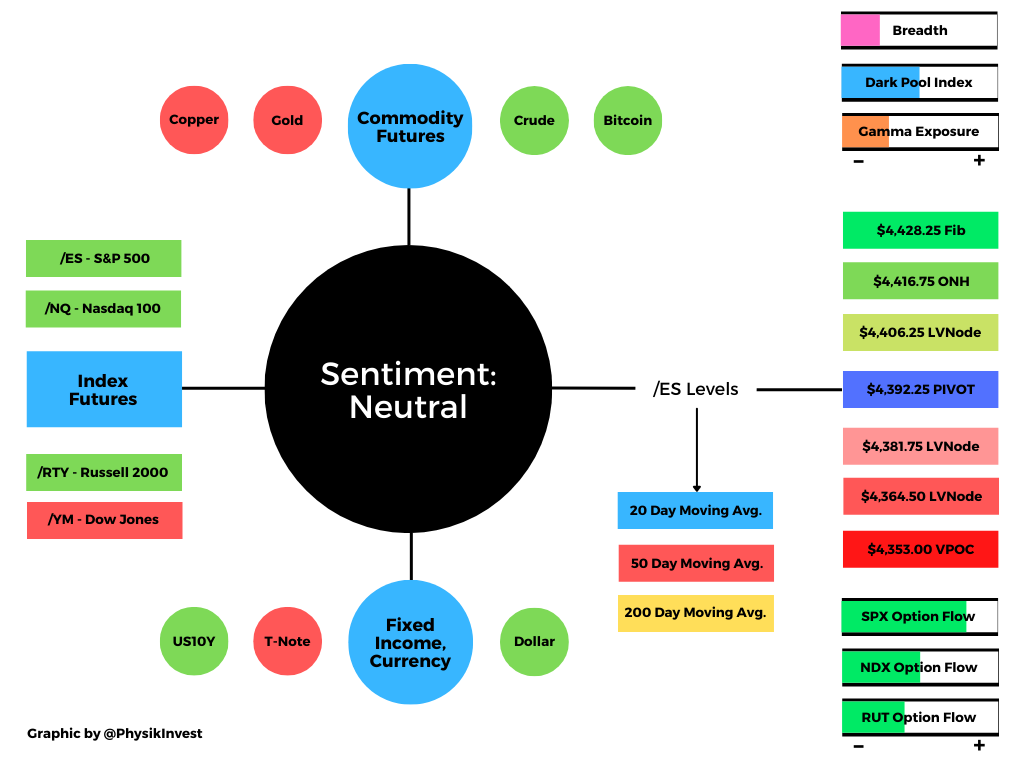
What To Expect: Tuesday’s regular session (9:30 AM – 4:00 PM EST) in the S&P 500 will likely open inside of prior-range and -value, suggesting a limited potential for immediate directional opportunity.

Adding, during the prior day’s regular trade, the best case outcome occurred, evidenced by initiative trade up to the $4,373.00 Fibonacci-derived price target. 

This price exploration comes amidst a divergence. As noted, the Nasdaq 100 is trading relatively strong in comparison to the S&P, Russell, and Dow. The holding pattern is not only attributable to positioning ahead of the monthly options expiration (OPEX), but second-quarter earnings, inflation expectations, and the like. 

Options Expiration (OPEX): Option expiries mark an end to pinning (i.e, the theory that market makers and institutions short options move stocks to the point where the greatest dollar value of contracts will expire worthless) and the reduction dealer gamma exposure.

“The broad markets are settling back and awaiting U.S. inflation,” said Sebastien Galy, a senior macro strategist at Nordea Investment Funds SA. “We view the environment as one of gestation as earnings come in, before the risk-taking trend starts again, though a higher U.S. inflation print could create a temporary setback.”

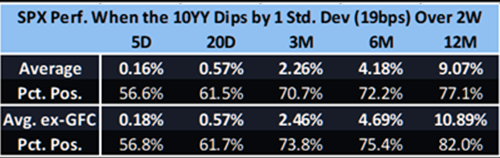
That said, the dip in the 10-year Treasury yield is not all too concerning. 

Graphic: S&P 500 performance when 10-year Treasury yield slides via The Market Ear.

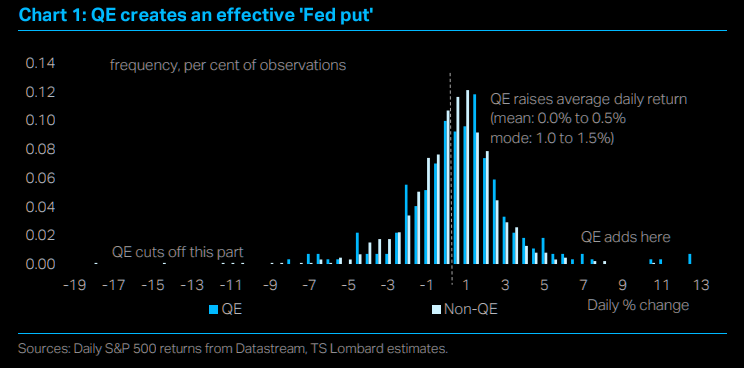
Obviously, that’s just one data point. Another consideration is the unwind of certain stimulus measures, like quantitative easing (QE) which shifts the returns distribution right.

Graphic: Impact of QE on S&P 500 returns via The Market Ear

Knowing the above, for today, participants can trade from the following frameworks. 

In the best case, the S&P 500 trades sideways or higher; activity above the $4,365.75 low volume area (LVNode) pivot puts in play the $4,378.75 minimal excess overnight high (ONH). Thereafter, if higher, the $4,398.50 and $4,417.50 Fibonacci price extensions come into play.

In the worst case, the S&P 500 trades lower; activity below $4,365.75 puts in play the $4,343.25 high volume area (HVNode). Initiative trade beyond the HVNode could reach as low as the $4,314.75 HVNode and $4,291.00 untested Point of Control (POC).

Volume Areas: A structurally sound market will build on past areas of high volume. Should the market trend for long periods of time, it will lack sound structure (identified as a low volume area which denotes directional conviction and ought to offer support on any test). 

If participants were to auction and find acceptance into areas of prior low volume, then future discovery ought to be volatile and quick as participants look to areas of high volume for favorable entry or exit.

Excess: A proper end to price discovery; the market travels too far while advertising prices. Responsive, other-timeframe (OTF) participants aggressively enter the market, leaving tails or gaps which denote unfair prices.

Overnight Rally Highs (Lows): Typically, there is a low historical probability associated with overnight rally-highs (lows) ending the upside (downside) discovery process.

POCs: POCs are valuable as they denote areas where two-sided trade was most prevalent. Participants will respond to future tests of value as they offer favorable entry and exit.
Graphic: 65-minute profile chart of the Micro E-mini S&P 500 Futures.
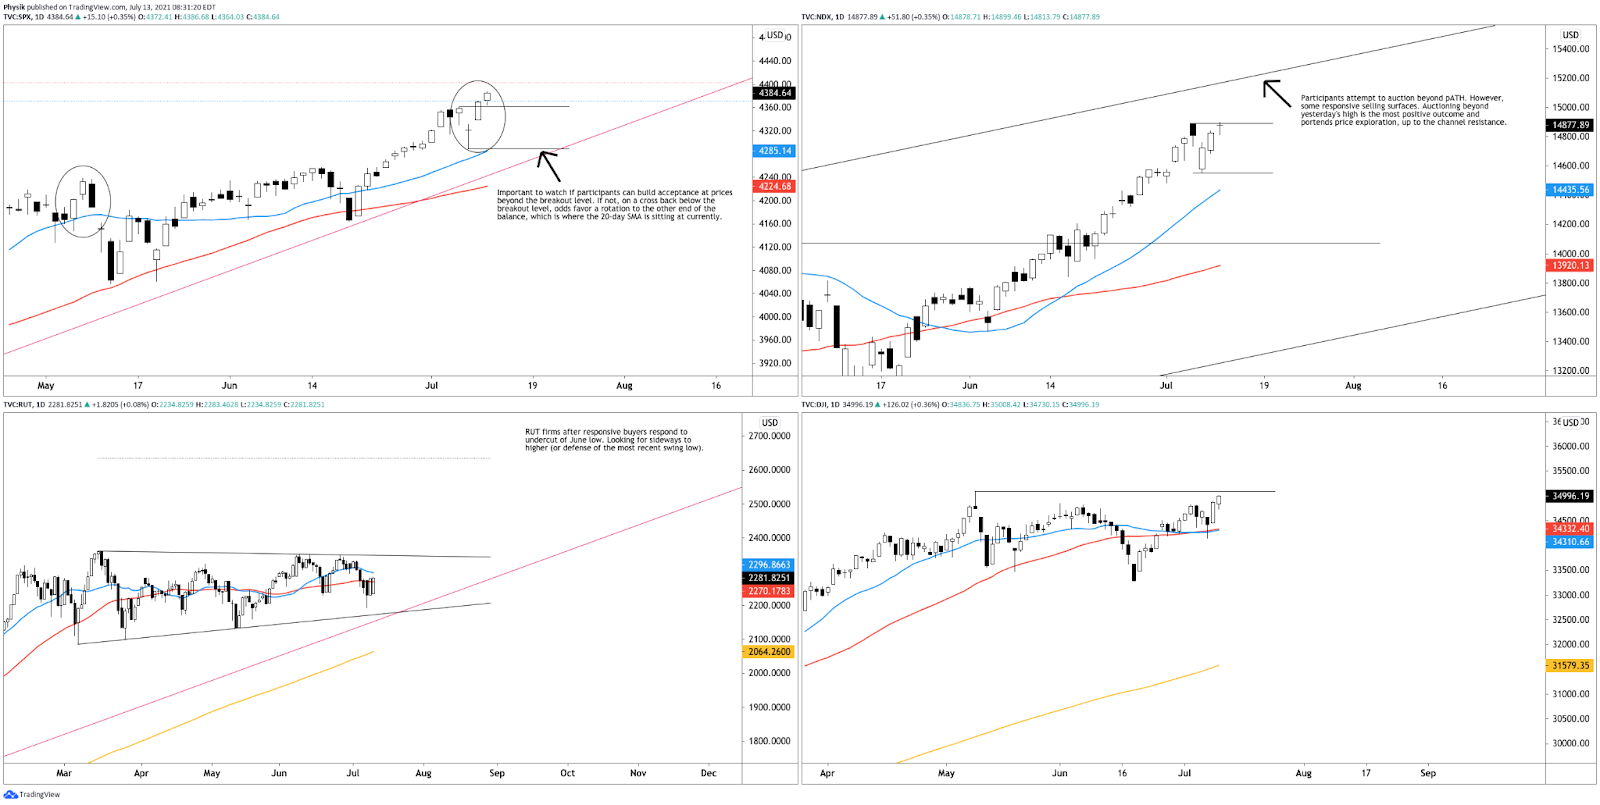
Graphic: Daily candlestick charts of the S&P 500 (top left), Nasdaq 100 (top right), Russell 2000 (bottom left), and Dow Jones Industrial Average (bottom right).
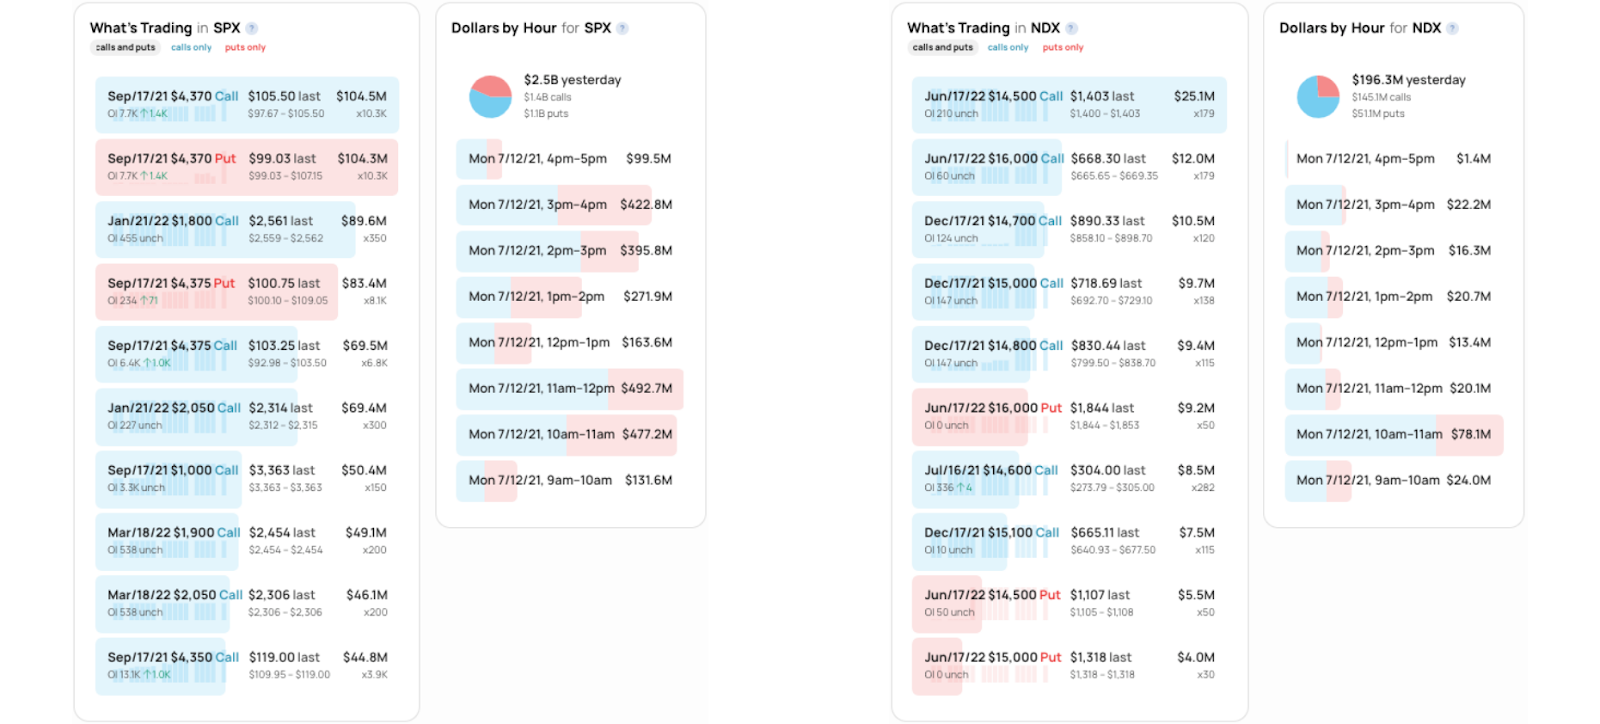
Graphic: SHIFT search suggests participants were most interested in call strikes at and below the price in the cash-settled S&P 500 (INDEX: SPX) and Nasdaq 100 (INDEX: NDX), yesterday. Noting, yesterday and over the past few weeks, there’s been increased activity in long-dated put options. 

News And Analysis

Economy | Yellen sees U.S. companies pushing back global tax deal. (BBG)

Energy | OPEC+ impasse risks price war as demand keeps surging. (REU)

Politics | Biden team mulls digital trade deal to counter China in Asia. (BBG)

Politics | Biden to warn companies of risks of operating in Hong Kong. (FT)

Markets | Boeing cutting 787 production on new structural problems. (REU)

Markets | Goldman dealmakers’ bumper quarter counters trade slump. (BBG)

Markets | JPM fell amid climbing expenses, loan growth expectations. (BBG)

Economy | PBOC said monetary policy unchanged despite RRR cut. (BBG)

FinTech | FTX deal provides institutions new access to crypto market. (BBG)

What People Are Saying

About

Renato founded Physik Invest after going through years of self-education, strategy development, and trial-and-error. His work reporting in the finance and technology space, interviewing leaders such as John Chambers, founder, and CEO, JC2 Ventures, Kevin O’Leary, businessman and Shark Tank host, Catherine Wood, CEO and CIO, ARK Invest, among others, afforded him the perspective and know-how very few come by.

Having worked in engineering and majored in economics, Renato is very detailed and analytical. His approach to the markets isn’t built on hope or guessing. Instead, he leverages the unique dynamics of time and volatility to efficiently act on opportunity.

Disclaimer

At this time, Physik Invest does not manage outside capital and is not licensed. In no way should the materials herein be construed as advice. Derivatives carry a substantial risk of loss. All content is for informational purposes only.

Categories
Commentary

Daily Brief For July 12, 2021

Market Commentary

U.S. equity index futures sideways overnight.

  • PBOC cut RRR, tax talk, and virus.
  • Ahead: WASDE, Fed speak, G20.
  • SPX, RUT, DJI weak. NDX firmed.

What Happened: U.S. stock index futures auctioned within prior range alongside news the ECB would revise forward guidance and maintain asset purchases until “at least” March of 2022. 

Additionally, the People’s Bank of China made a 50 basis-point cut to the reserve ratio at most banks given a weakened economic outlook. At the same time, G20 finance ministers are meeting over a global tax agreement and some concerns were raised over the spread of COVID-19 variants.

Ahead is the WASDE crop report for July and Fed speak by Neel Kashkari. Later, Janet Yellen will meet with finance ministers in Brussels. 

Graphic updated 6:55 AM ET.

What To Expect: Monday’s regular session (9:30 AM – 4:00 PM EST) in the S&P 500 will likely open inside of prior-range and -value, suggesting a limited potential for immediate directional opportunity.

Adding, last week, U.S. stock index futures auctioned sideways to higher, only after enduring a brief liquidation alongside anxieties surrounding the spread of COVID-19 variants, as well as an evolution in monetary policy. 

Expectations into the middle of July call for a supported S&P 500; thereafter, the window for fundamental dynamics to take over is opened

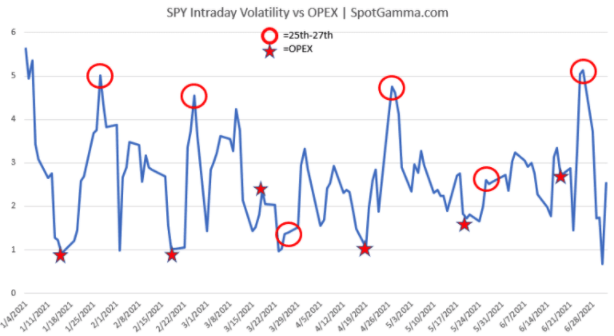
According to SpotGamma, “[t]he week after [options] expiration the market tends to experience its largest intraday volatility which corresponds to the reduction in large options positions, and the hedging associated with them.”

Graphic: Volatility before and after OPEX, via SpotGamma.

These expectations of increased volatility line up with the busy earnings season, kicked off by banks reporting second-quarter results this week. Additionally, a focus for participants in the coming days are some releases on consumer, producer, and import prices, as well as industrial production, consumer sentiment, and retail sales.

For today, participants can trade from the following frameworks. 

In the best case, the S&P 500 trades sideways or higher; activity above the high volume area (HVNode) pivot at $4,341.75 puts in play the $4,353.25 low volume area (LVNode). Trade beyond that signpost could reach as high as the $4,365.50 overnight high (ONH) and $4,373.00 Fibonacci extension.

In the worst case, the S&P 500 trades lower; activity below $4,341.75 puts in play the $4,314.75 HVNode. Initiative trade beyond that signpost could reach as low as the $4,291.00 untested Point of Control (POC) and $4,256.75 HVNode.

Volume Areas: A structurally sound market will build on past areas of high volume. Should the market trend for long periods of time, it will lack sound structure (identified as a low volume area which denotes directional conviction and ought to offer support on any test). 

If participants were to auction and find acceptance into areas of prior low volume, then future discovery ought to be volatile and quick as participants look to areas of high volume for favorable entry or exit.

Overnight Rally Highs (Lows): Typically, there is a low historical probability associated with overnight rally-highs (lows) ending the upside (downside) discovery process.

POCs: POCs are valuable as they denote areas where two-sided trade was most prevalent. Participants will respond to future tests of value as they offer favorable entry and exit.
Graphic: 65-minute profile chart of the Micro E-mini S&P 500 Futures.
Graphic: Weekly candlestick charts of the S&P 500 (top left), Nasdaq 100 (top right), Russell 2000 (bottom left), and Dow Jones Industrial Average (bottom right).
Graphic: SHIFT search suggests participants were most interested in call strikes at and below the price in the cash-settled S&P 500 (INDEX: SPX) and Nasdaq 100 (INDEX: NDX), last week. Noting, over the past few weeks, there’s been increased activity in long-dated put options.

News And Analysis

Economy | Global tax overhaul gains steam as G20 backs new levies. (NYT)

FinTech | Once Robinhood ‘house money’ gone, trading to lose allure. (NI)

FinTech | On crypto exchanges, the trades do not always add up right. (BBG)

Markets | Dealmakers see M&A rush, then chills, on antitrust progress. (REU)

Economy | China’s rate cut points to weaker than expected economy. (BBG)

FinTech | Square CEO doubles down on crypto, adds hardware wallet. (FL)

Economy | Recovery diminishes risks for reducing pandemic support. (Moody’s)

Energy | Oil prices loom over Biden’s bid to throttle drilling right sales. (BBG)

Economy | ECB’s Lagarde foresees a July policy shift, 2022 transition. (BBG)

What People Are Saying

About

Renato founded Physik Invest after going through years of self-education, strategy development, and trial-and-error. His work reporting in the finance and technology space, interviewing leaders such as John Chambers, founder, and CEO, JC2 Ventures, Kevin O’Leary, businessman and Shark Tank host, Catherine Wood, CEO and CIO, ARK Invest, among others, afforded him the perspective and know-how very few come by.

Having worked in engineering and majored in economics, Renato is very detailed and analytical. His approach to the markets isn’t built on hope or guessing. Instead, he leverages the unique dynamics of time and volatility to efficiently act on opportunity.

 Disclaimer

At this time, Physik Invest does not manage outside capital and is not licensed. In no way should the materials herein be construed as advice. Derivatives carry a substantial risk of loss. All content is for informational purposes only.
Categories
Commentary

Daily Brief For July 9, 2021

Market Commentary

U.S. equity index futures diverge in their attempt to discover fair prices for two-sided trade.

  • Volatility on COVID, growth concerns.
  • Today: ECB minutes, May inventories.
  • SPX, RUT, DJI firm. NDX tad weaker.

What Happened: U.S. stock index futures explored above and below yesterday’s cash-session close.

That said, a meaningful divergence can be observed with the Nasdaq 100 trading relatively weak, in comparison to its peers. This comes as rates on the 10 Year T-Note rebounded after testing trend support the session prior.

Ahead is the publication of ECB minutes. Prior to the open, participants will also be provided data on U.S. May wholesale inventories. Additionally, there is a G-20 meeting between finance ministers and central bankers.

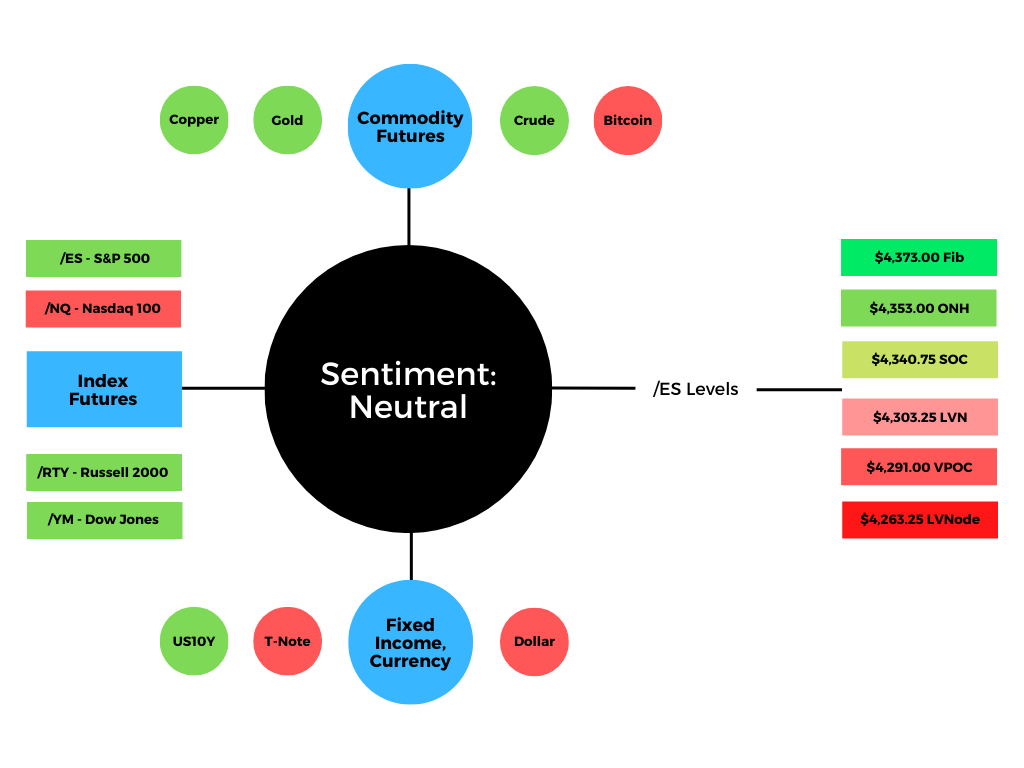
Graphic updated 7:00 AM ET.

What To Expect: Friday’s regular session (9:30 AM – 4:00 PM EST) in the S&P 500 will likely open outside of prior-range and -value, suggesting a higher potential for directional opportunity.

Adding, during the prior day’s regular trade, the best case outcome occurred, evidenced by responsive buying above the $4,285.00 micro-composite high volume area (HVNode). Thursday’s intraday recovery, followed by the overnight session, found participants recovering over 50% of the liquidation. 

Volume Areas: A structurally sound market will build on past areas of high volume. Should the market trend for long periods of time, it will lack sound structure (identified as a low volume area which denotes directional conviction and ought to offer support on any test). 

If participants were to auction and find acceptance into areas of prior low volume, then future discovery ought to be volatile and quick as participants look to areas of high volume for favorable entry or exit.

Further, conditions aren’t as dire, today. Ahead, trade ought to be volatile but not that substantive as participants position themselves with respect to the weekly options expiration (OPEX) and weekend. 

Options Expiration (OPEX): Option expiries mark an end to pinning (i.e, the theory that market makers and institutions short options move stocks to the point where the greatest dollar value of contracts will expire worthless) and the reduction dealer gamma exposure.

Further, for today, participants can trade from the following frameworks. 

In the best case, the S&P 500 trades sideways or higher; activity above the $4,319.00 low volume area (LVNode) pivot puts in play the $4,340.75 HVNode, a 100% retracement of yesterday’s liquidation. Initiative trade beyond $4,340.75 could reach as high as the minimal excess overnight high (ONH) at $4,353.00.

Excess: A proper end to price discovery; the market travels too far while advertising prices. Responsive, other-timeframe (OTF) participants aggressively enter the market, leaving tails or gaps which denote unfair prices.

Overnight Rally Highs (Lows): Typically, there is a low historical probability associated with overnight rally-highs (lows) ending the upside (downside) discovery process.

In the worst case, the S&P 500 trades lower; activity below $4,319.00 puts in play the $4,303.25 LVNode. Trade beyond $4,303.25 could reach as low as the $4,291.00 untested Point of Control (POC) and $4,263.25 LVNode.

POCs: POCs are valuable as they denote areas where two-sided trade was most prevalent. Participants will respond to future tests of value as they offer favorable entry and exit.
Graphic: 65-minute profile chart of the Micro E-mini S&P 500 Futures.
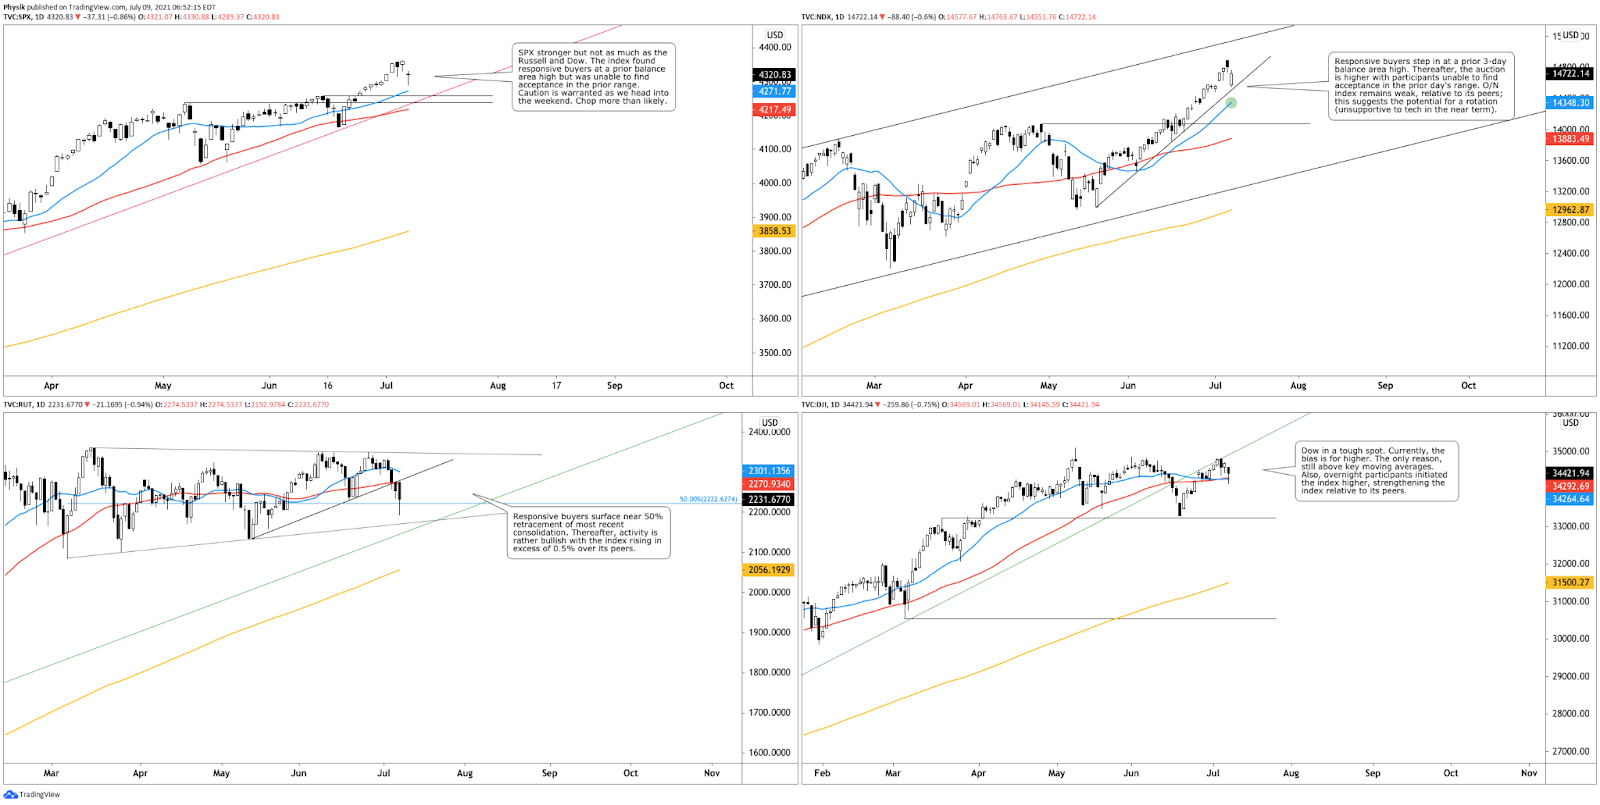
Graphic: Daily candlestick charts of the S&P 500 (top left), Nasdaq 100 (top right), Russell 2000 (bottom left), and Dow Jones Industrial Average (bottom right).
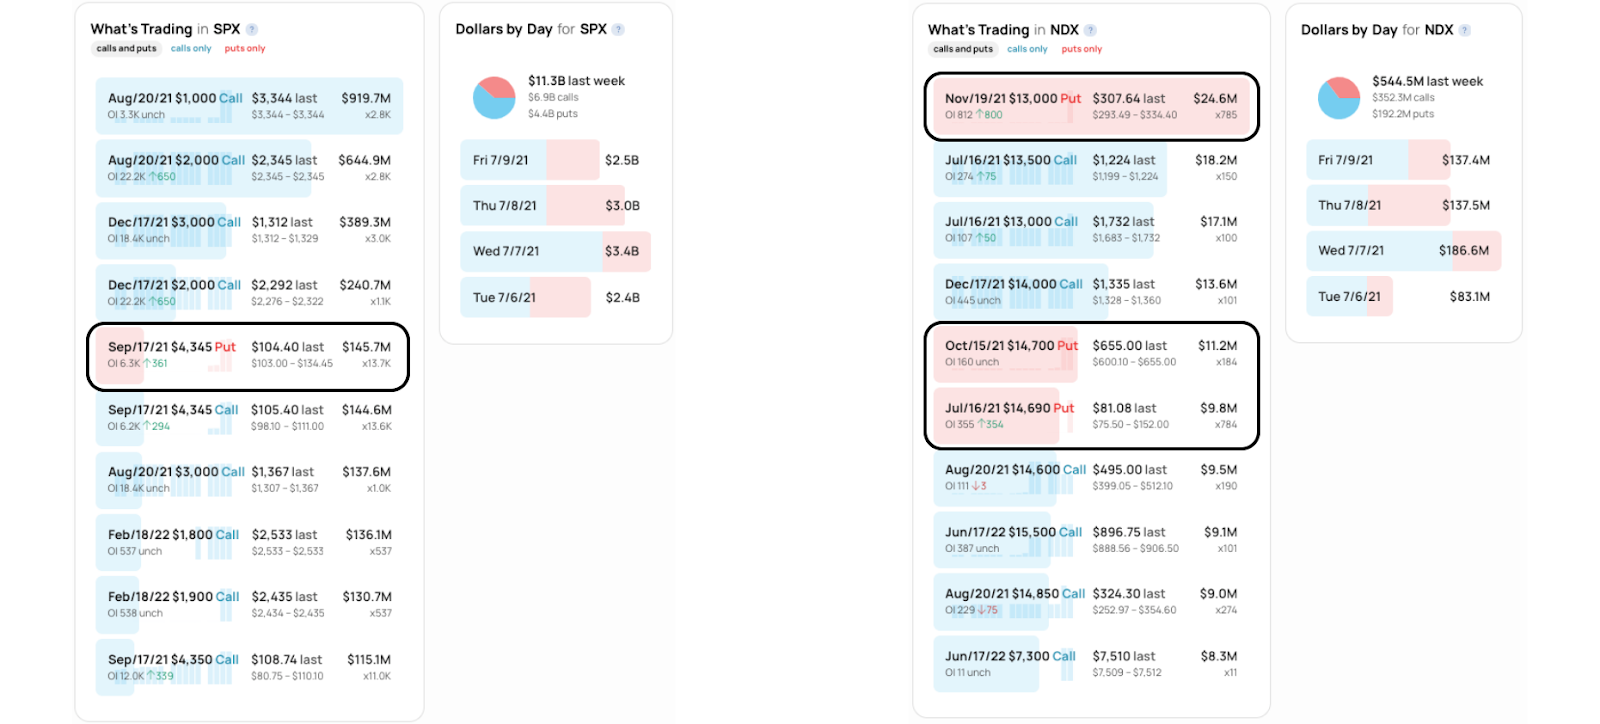
Graphic: SHIFT search suggests participants were most interested in call strikes at and below the price in the cash-settled S&P 500 (INDEX: SPX), yesterday. On the Nasdaq 100 (INDEX: NDX), on the other hand, there was a meaningful shift in sentiment evidenced by increased activity in long-dated put options.

News And Analysis

Politics | U.S. set to add more Chinese companies to blacklist. (REU)

Economy | China’s central bank pivots to easing as risks build. (BBG)

COVID | Americans to need masks indoors amid COVID surge. (CNBC)

Economy | Attitudes about buying and selling homes diverging. (MND)

Politics | Biden issuing executive order on shipping consolidation. (Hill)

Markets | Technical factors pull the 10-YR Treasury yield lower. (Moody’s)

Politics | Biden will encourage the FCC to reinstate net neutrality. (Axios)

Economy | The explosion in used car prices is finally stalling out. (Axios)

What People Are Saying

Innovation And Emerging Trends

FinTech | London fintech funding soars in first half of the year. (REU)

FinTech | Robinhood compliance issues show fintech hazards. (Axios)

 About

Renato founded Physik Invest after going through years of self-education, strategy development, and trial-and-error. His work reporting in the finance and technology space, interviewing leaders such as John Chambers, founder, and CEO, JC2 Ventures, Kevin O’Leary, businessman and Shark Tank host, Catherine Wood, CEO and CIO, ARK Invest, among others, afforded him the perspective and know-how very few come by.

Having worked in engineering and majored in economics, Renato is very detailed and analytical. His approach to the markets isn’t built on hope or guessing. Instead, he leverages the unique dynamics of time and volatility to efficiently act on opportunity.

Disclaimer

At this time, Physik Invest does not manage outside capital and is not licensed. In no way should the materials herein be construed as advice. Derivatives carry a substantial risk of loss. All content is for informational purposes only.
Categories
Commentary

Daily Brief For July 7, 2021

Market Commentary

Equity index futures rotate after participants initiated the bracketing process.

  • Bad news for China tech & vaccine hesitancy.
  • Ahead: Fed minutes, Mortgage Apps, JOLTS.
  • Equity index futures see volatility before open.

What Happened: U.S. stock index futures auctioned higher ahead of June’s Federal Reserve meeting minutes release at 2:00 PM ET.

The release should provide participants clarity over the Fed’s intent to taper asset purchases and the expected path for inflation.

In other areas, so-called vaccine hesitancy is a concern as President Joe Biden’s target to get up to 70% of Americans vaccinated, by July 4, was missed. 

Also, participants get data on U.S. mortgage applications, JOLTS, and the EIA energy outlook, as well as Fed-speak by President Raphael Bostic.

Graphic updated 9:09 AM ET.

What To Expect: Wednesday’s regular session (9:30 AM – 4:00 PM EST) in the S&P 500 will likely open outside of prior value but inside of range. Such dynamic increases the potential for directional opportunity.

Adding, during the prior day’s regular trade, the best case outcome occurred, evidenced by a liquidation break that found responsive buyers at a key anchored Volume Weighted Average Price (VWAP). Thereafter, on lighter volume, the S&P 500 established value (i.e., evidenced by more than 30-minutes of trade) above the VWAP anchored from the $4,348.25 overnight high (ONH). This suggests the average buyer, since the peak, is in a winning position.

Liquidation Breaks: The profile shape suggests participants were “too” long and had poor location. Such dynamic offers responsive buyers (initiative sellers) favorable entry (exit).

More On Volume-Weighted Average Prices (VWAPs): A metric highly regarded by chief investment officers, among other participants, for quality of trade. Additionally, liquidity algorithms are benchmarked and programmed to buy and sell around VWAPs.

Overnight Rally Highs (Lows): Typically, there is a low historical probability associated with overnight rally-highs (lows) ending the upside (downside) discovery process.

Adding, Tuesday’s liquidation break marked the start of balance as participants look to establish value at higher prices. This, in conjunction with a severe breakdown in yields, was a boon for the tech-heavy Nasdaq 100 which, unlike the S&P 500, closed higher.

Balance (Two-Timeframe Or Bracket): Rotational trade that denotes current prices offer favorable entry and exit. Balance-areas make it easy to spot a change in the market (i.e., the transition from two-time frame trade, or balance, to one-time frame trade, or trend).

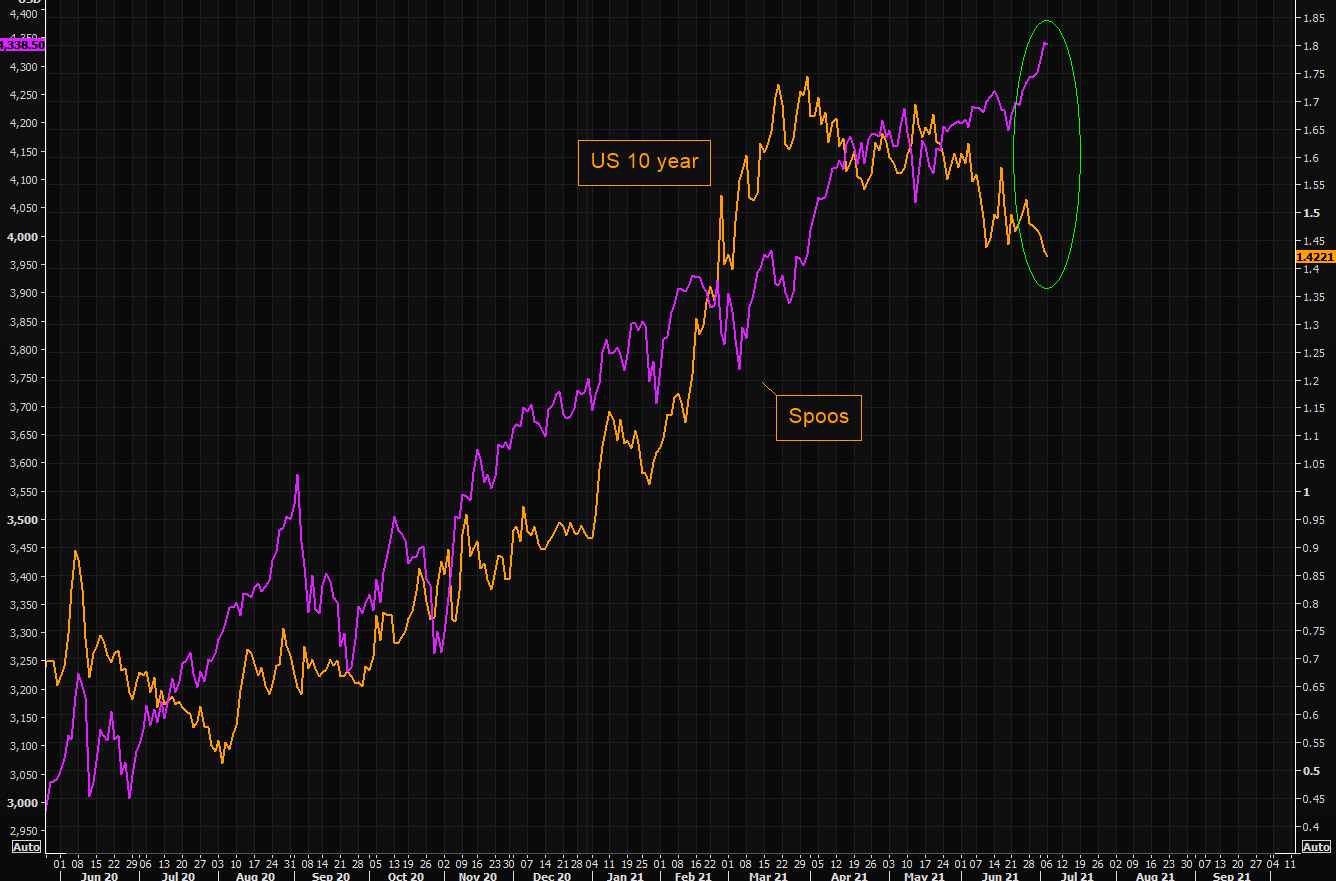
Low rates have to potential to increase the present value of future earnings making stocks, especially those that are high growth, more attractive. To note, inflation and rates move inversely to each other. Low rates stimulate demand for loans (i.e., borrowing money is more attractive). In conjunction with the rapid recovery, lower rates may solicit hawkish commentary as policymakers look to inhibit inflation.

Graphic: Rates (yellow color) on the 10 Year T-Note move lower, via The Market Ear. 

Important to note, also, as stated in the weekly commentary, the CBOE Volatility Index (INDEX: VIX), a measure of the stock market’s expectation of volatility, recently traded to its lowest level since February 2020. This dynamic has the potential to solicit the involvement of certain systematic strategies which can not only add fuel to the price rise but, potentially, exacerbate any future liquidation. 

Putting it all together, for today, participants can trade from the following frameworks. 

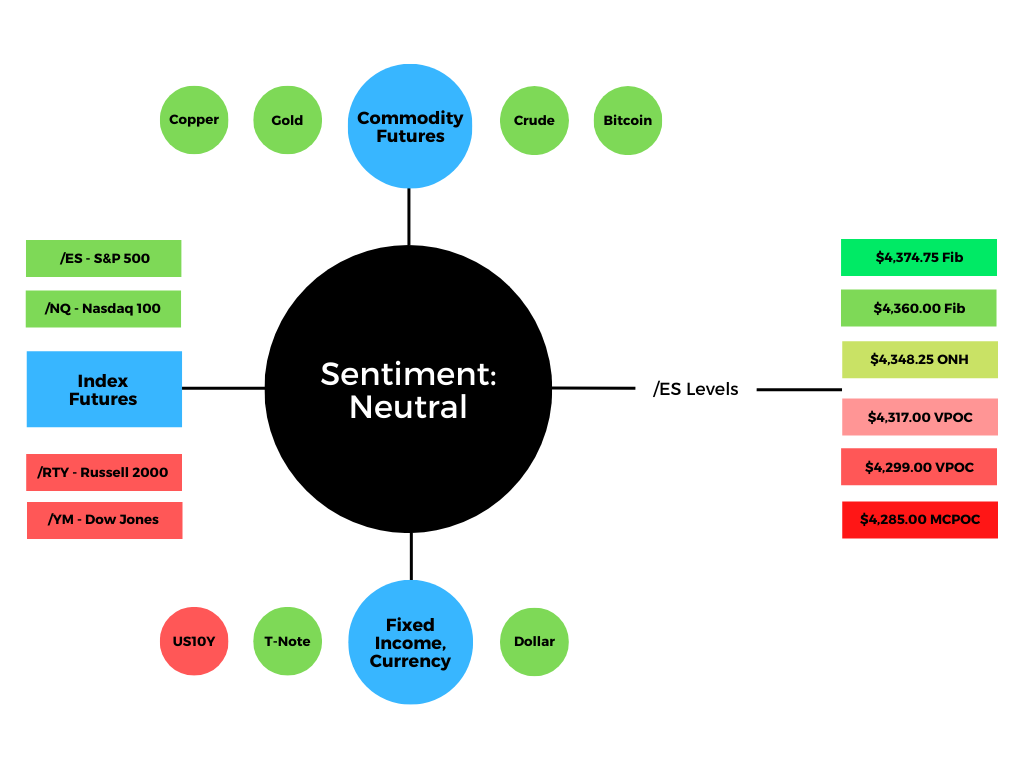
In the best case, the S&P 500 trades sideways or higher; activity above the yellow AVWAP (near $4,325.00) puts in play the $4,348.25 ONH. Thereafter, if higher, participants can look for responses at the $4,360.00 and $4,374.75 Fibonacci-derived price extensions. 

In the worst case, the S&P 500 trades lower; activity below the yellow AVWAP (near $4,325.00) puts in play the $4,317.00 untested Point of Control (POC). Initiative trade beyond the POC could reach as low as the $4,299.00 POC and $4,285.00 micro-composite high volume area (HVNode). 

POCs: POCs are valuable as they denote areas where two-sided trade was most prevalent. Participants will respond to future tests of value as they offer favorable entry and exit.

Volume Areas: A structurally sound market will build on past areas of high volume. Should the market trend for long periods of time, it will lack sound structure (identified as a low volume area which denotes directional conviction and ought to offer support on any test). 

If participants were to auction and find acceptance into areas of prior low volume, then future discovery ought to be volatile and quick as participants look to areas of high volume for favorable entry or exit.
Graphic: 65-minute profile chart of the Micro E-mini S&P 500 Futures.
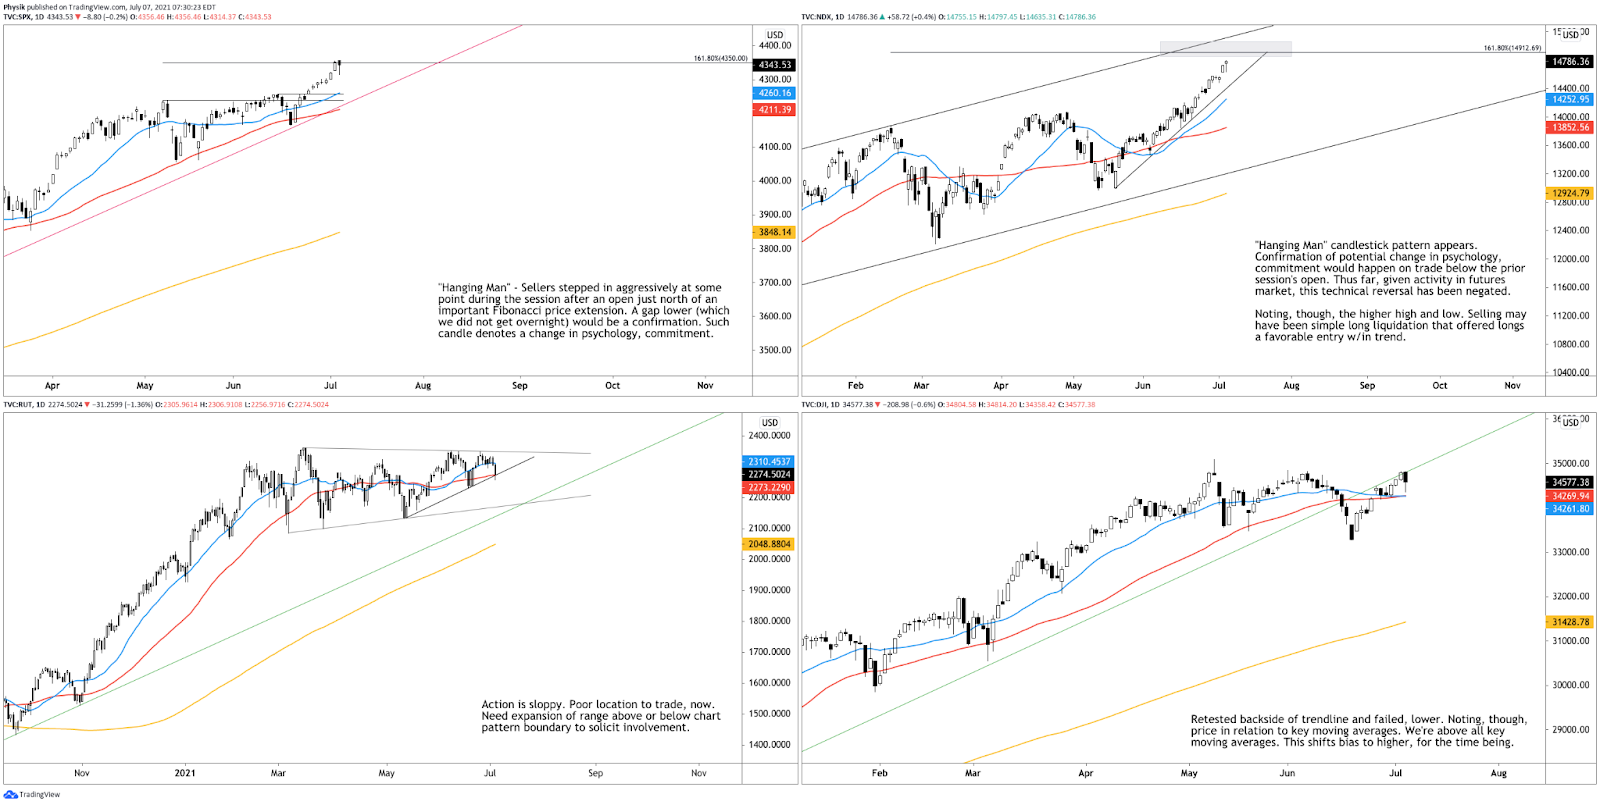
Graphic: Daily candlestick charts of the S&P 500 (top left), Nasdaq 100 (top right), Russell 2000 (bottom left), and Dow Jones Industrial Average (bottom right).
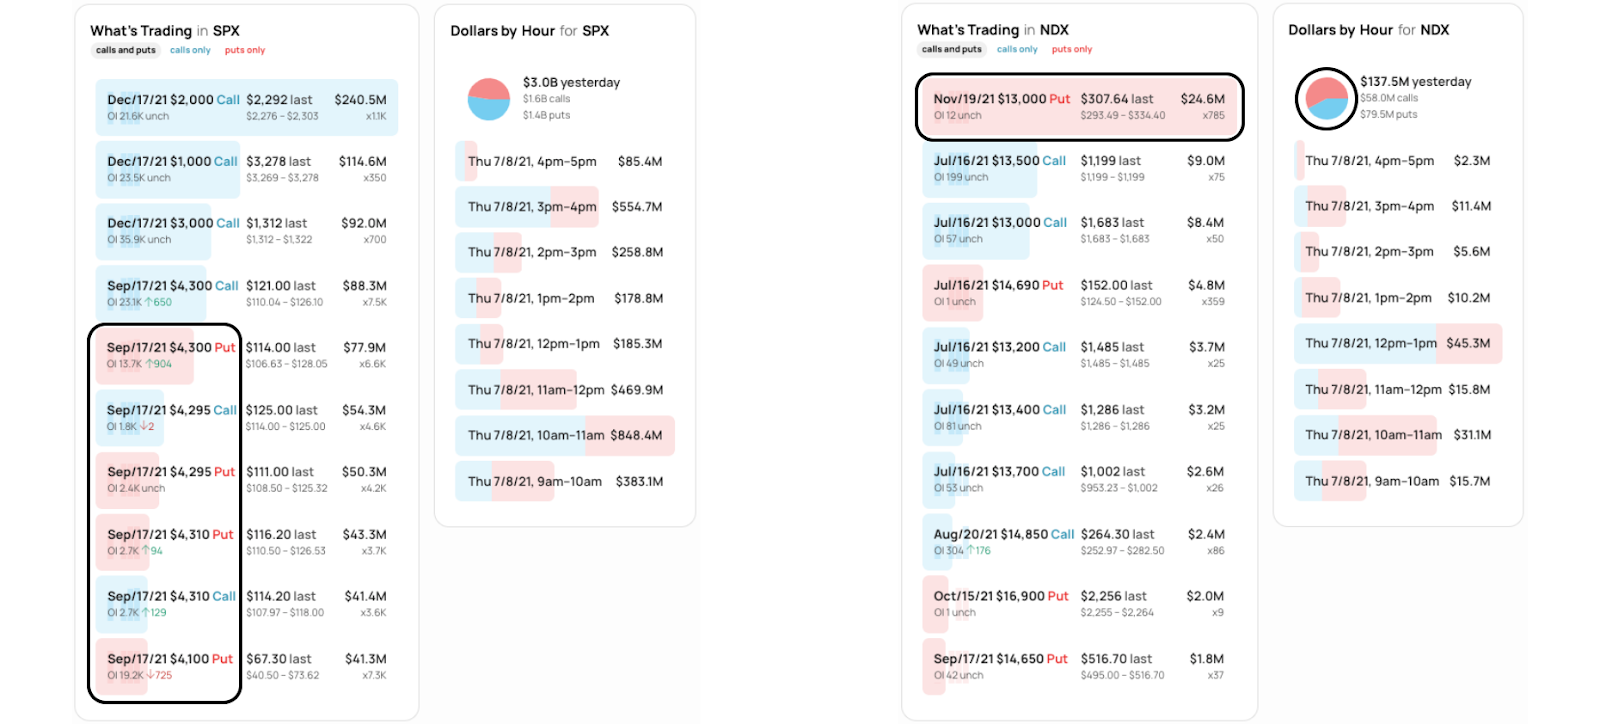
Graphic: SHIFT search suggests participants were committing the most capital to call strikes at and below current prices in the cash-settled S&P 500 Index (INDEX: SPX) and Nasdaq 100 (INDEX: NDX), yesterday. This dynamic suggests participants, despite their commitment to higher prices, are hedging against near-term risks, like the Jackson Hole Economic Symposium.

News And Analysis

Economy | America is hitting its vaccination ceiling. (Axios)

Economy | Mortgage applications sinking to lowest. (CNBC)

Markets | Nomura’s prime brokerage is pulling back. (BBG)

Economy | EU forecasts higher growth in eurozone. (REU)

Trade | Cargo glut at key shipping port has loosened. (Axios)

What People Are Saying

About

Renato founded Physik Invest after going through years of self-education, strategy development, and trial-and-error. His work reporting in the finance and technology space, interviewing leaders such as John Chambers, founder, and CEO, JC2 Ventures, Kevin O’Leary, businessman and Shark Tank host, Catherine Wood, CEO and CIO, ARK Invest, among others, afforded him the perspective and know-how very few come by.

Having worked in engineering and majored in economics, Renato is very detailed and analytical. His approach to the markets isn’t built on hope or guessing. Instead, he leverages the unique dynamics of time and volatility to efficiently act on opportunity.

Disclaimer

At this time, Physik Invest does not manage outside capital and is not licensed. In no way should the materials herein be construed as advice. Derivatives carry a substantial risk of loss. All content is for informational purposes only.

Categories
Commentary

Daily Brief For July 6, 2021

Market Commentary

Equity index futures sideways in overnight trade.

  • Commodities firm up. Oil is stretched.
  • Ahead: PMI, ISM, employment trends.
  • NDX firmed relative to SPX, RUT, DJI.

What Happened: U.S. stock index futures diverged overnight. 

Participants explored higher prices in both the S&P 500 and Nasdaq 100. The Dow Jones Industrial Average and Russell 2000 traded weak, within prior range. 

Today, participants will receive PMI, employment trend, and ISM non-manufacturing data. 

Graphic updated 7:05 AM ET.

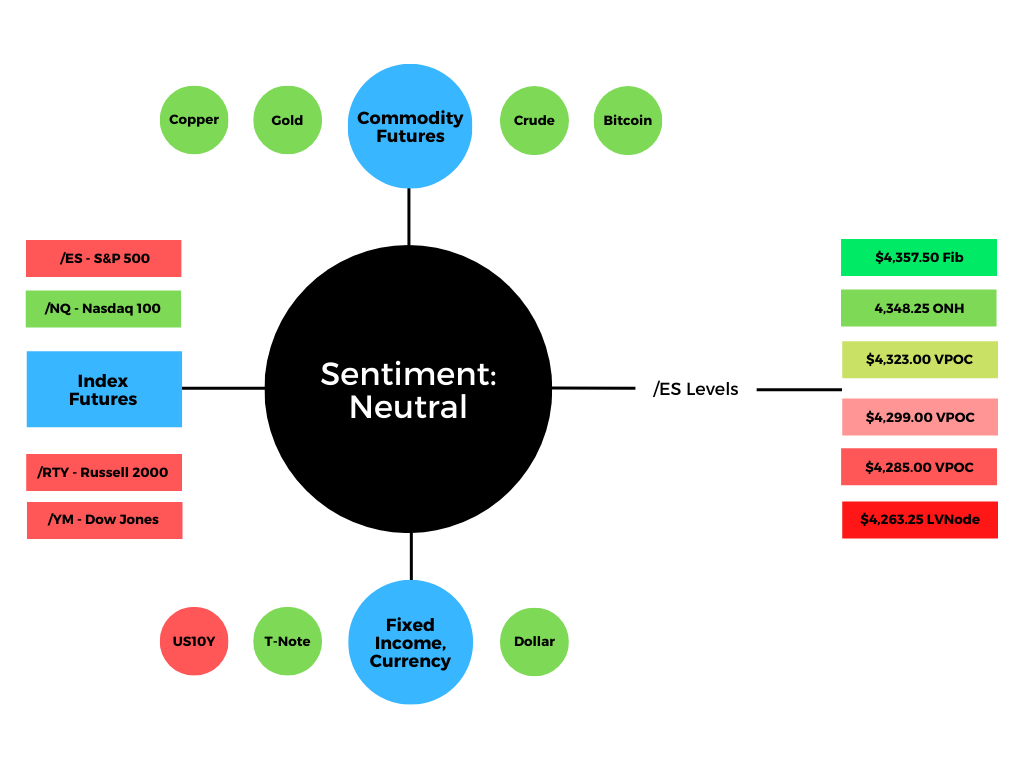
What To Expect: Tuesday’s regular session (9:30 AM – 4:00 PM EST) in the S&P 500 will likely open just inside of prior-range and -value, suggesting a limited potential for immediate directional opportunity.

Adding, during the prior day’s regular trade, the best case outcome occurred, evidenced by initiative activity above the $4,311.50 high volume area (HVNode), up to $4,337.75, a Fibonacci-derived price target. 
Initiative Buying: Buying within or above the previous day’s value area.

Volume Areas: A structurally sound market will build on past areas of high volume. Should the market trend for long periods of time, it will lack sound structure (identified as a low volume area which denotes directional conviction and ought to offer support on any test). 

If participants were to auction and find acceptance into areas of prior low volume, then future discovery ought to be volatile and quick as participants look to areas of high volume for favorable entry or exit.

Sideways trade overnight comes after a rapid move higher on narrowing breadth and tapering volumes. 

Graphic: Breadth metrics from JPMorgan Chase & Co (NYSE: JPM), via The Market Ear.

With that, strategists at JPMorgan Chase & Co (NYSE: JPM) suggest stretched sentiment, positioning, and technical conditions have normalized with economic activity projected to stay significantly above trend. Goldman Sachs Group Inc (NYSE: GS) takes a bit of a less optimistic view; “Expectations of higher interest rates and higher corporate tax rates by year-end are the primary reasons we forecast that the S&P 500 will trade sideways during the next six months,” said David Kostin, chief US equity strategist for Goldman Sachs.

Goldman’s year-end price target for the S&P 500 sits at $4,300.00, a tad lower than where the index is today. To note, however, earnings estimates, the inventory positioning of participants, as well as early July seasonality metrics support the strong near-term performance.

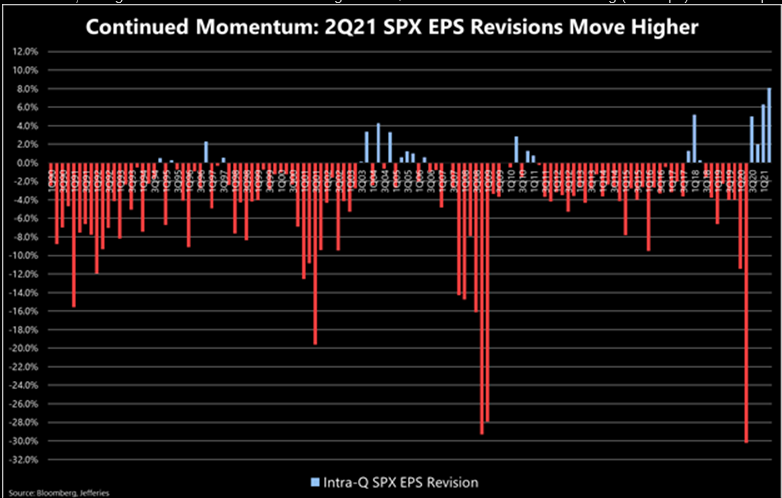
Graphic: Earnings estimates from Jefferies, via The Market Ear

Given that big picture context, for today, participants can trade from the following frameworks. 

In the best case, the S&P 500 trades sideways or higher; activity above the $4,323.00 Point of Control (POC) puts in play the developing ledge at $4,348.25, an overnight high (ONH). Initiative trade beyond the ONH could reach as high as the $4,357.50 Fibonacci-derived price target.

POCs: POCs are valuable as they denote areas where two-sided trade was most prevalent. Participants will respond to future tests of value as they offer favorable entry and exit.

Overnight Rally Highs (Lows): Typically, there is a low historical probability associated with overnight rally-highs (lows) ending the upside (downside) discovery process.

Ledges: Flattened area on the profile which suggests responsive participants are in control, or initiative participants lack the confidence to continue the discovery process. The ledge will either hold and force participants to liquidate (cover) their positions, or crack and offer support (resistance).

In the worst case, the S&P 500 trades lower; activity below $4,323.00 puts in play the $4,299.00 POC. Initiative trade beyond the POC could reach as low as the $4,285.00 micro-composite POC and $4,263.25 low volume area (LVNode). 

Graphic: 65-minute profile chart of the Micro E-mini S&P 500 Futures.
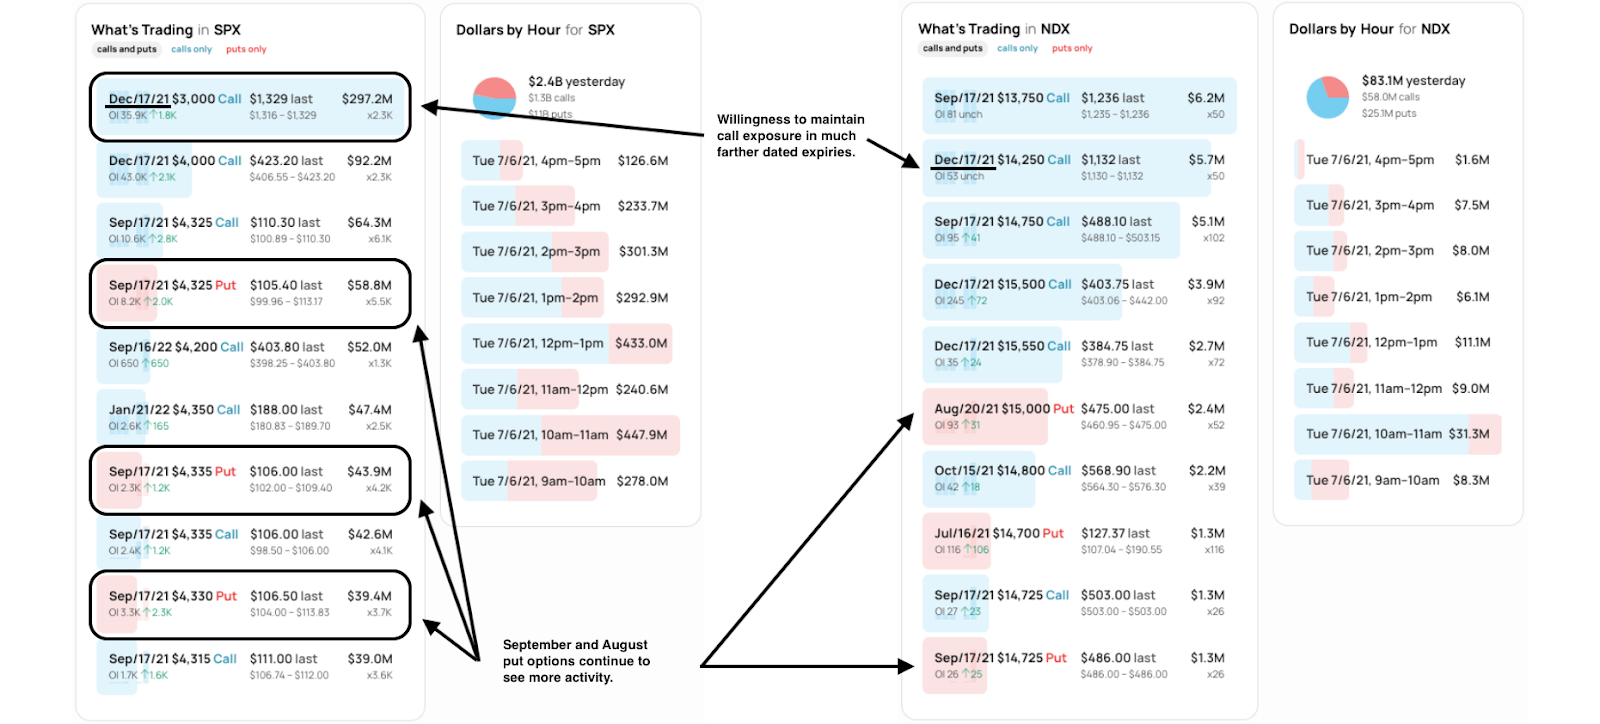
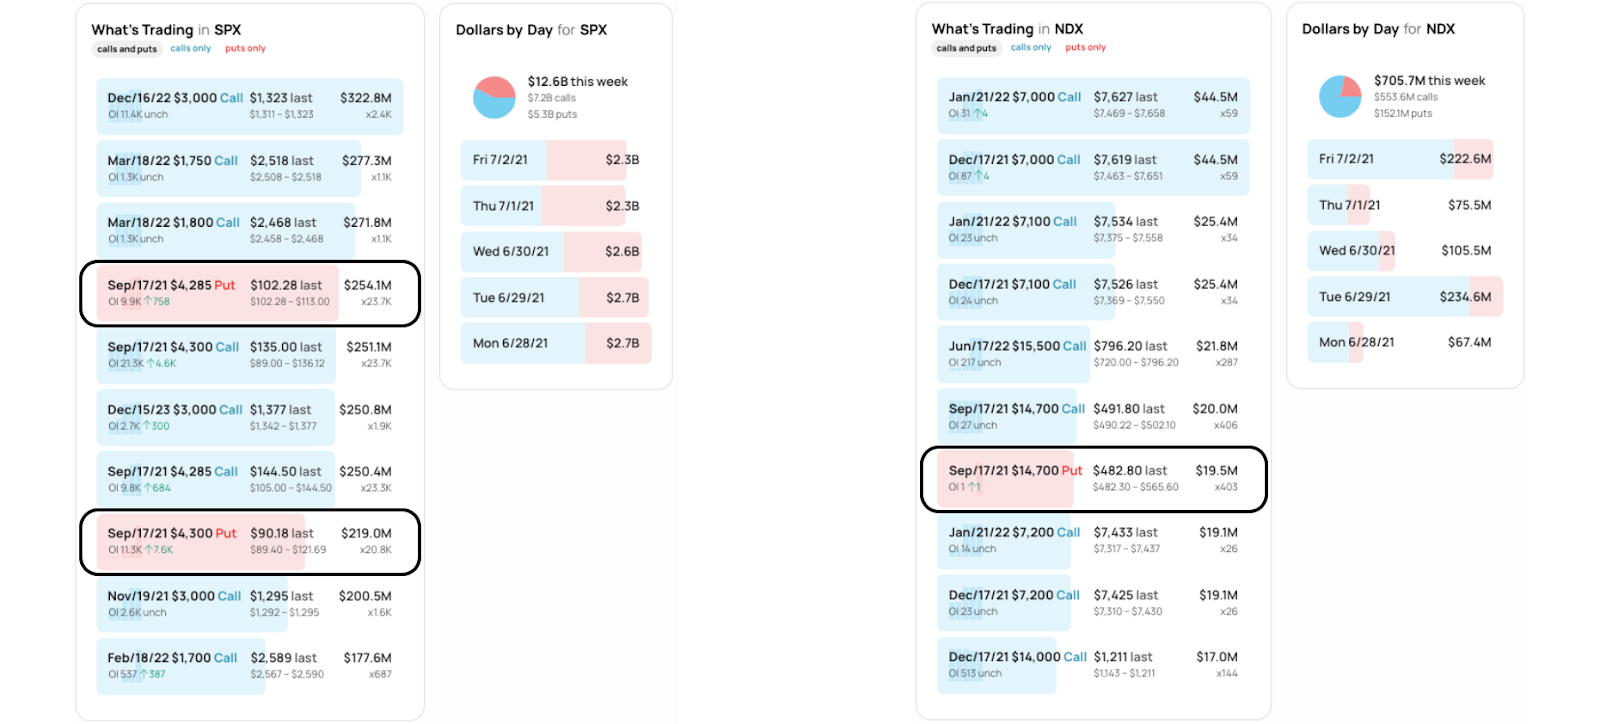
Graphic: SHIFT search suggests participants were committing the most capital to call strikes at and below current prices in the cash-settled S&P 500 Index (INDEX: SPX) and Nasdaq 100 (INDEX: NDX), last week. This activity may denote (1) stock replacement, (2) hedges for underlying short positions, or (3) speculation on the upside. Also, there was a meaningful bid in longer-dated puts on the S&P 500 and Nasdaq 100. This dynamic suggests participants, despite their commitment to higher prices, are hedging against near-term risks, like the Jackson Hole Economic Symposium.

News And Analysis

Economy | Credit Conditions Q3 2021 – Reopening, Reflation, Reset. (S&P)

Markets | Stocks surge, comfort grows as the market fear gauge falls. (S&P)

Energy | Three scenarios for OPEC+, and the likely ones are bearish. (REU)

Markets | Chinese ride-hailing app Didi forced off of app stores in China. (REU)

COVID | Pfizer vaccine less effective against Delta variant, study finds. (FT)

Politics | Biden declares success in beating pandemic in July 4 speech. (BBG)

Politics | Global corporate tax overhaul faces rocky road to completion. (REU)

Markets | June jobs report was exactly what the markets wanted to get. (Axios)

What People Are Saying

Innovation And Emerging Trends

FinTech | Mortgage-focused startup Blend seeks $4B valuation in IPO. (REU)

FinTech | Turkish broker takes shot at financial titans with product focus. (BZ)

Economy | MMT economist on why China should boost fiscal spending. (BBG)

FinTech | Booking.com announces creation of new internal fintech unit. (Finextra)

M&A | JPMorgan’s big buying spree is Jamie Dimon’s busiest in years. (FT)

FinTech | Fidelity and BlackRock lead fintech startup’s $600M funding. (BBG)

Crypto | BIS finds that crypto investment doesn’t require special policy. (Block)

About

Renato founded Physik Invest after going through years of self-education, strategy development, and trial-and-error. His work reporting in the finance and technology space, interviewing leaders such as John Chambers, founder, and CEO, JC2 Ventures, Kevin O’Leary, businessman and Shark Tank host, Catherine Wood, CEO and CIO, ARK Invest, among others, afforded him the perspective and know-how very few come by.

Having worked in engineering and majored in economics, Renato is very detailed and analytical. His approach to the markets isn’t built on hope or guessing. Instead, he leverages the unique dynamics of time and volatility to efficiently act on opportunity.

Disclaimer

At this time, Physik Invest does not manage outside capital and is not licensed. In no way should the materials herein be construed as advice. Derivatives carry a substantial risk of loss. All content is for informational purposes only.