Categories
Commentary

Daily Brief For May 20, 2021

Market Commentary

Index futures in balance.

  • Federal Reserve considers taper.
  • Ahead: Business outlook, claims.
  • Indexes in prior-range, sideways.

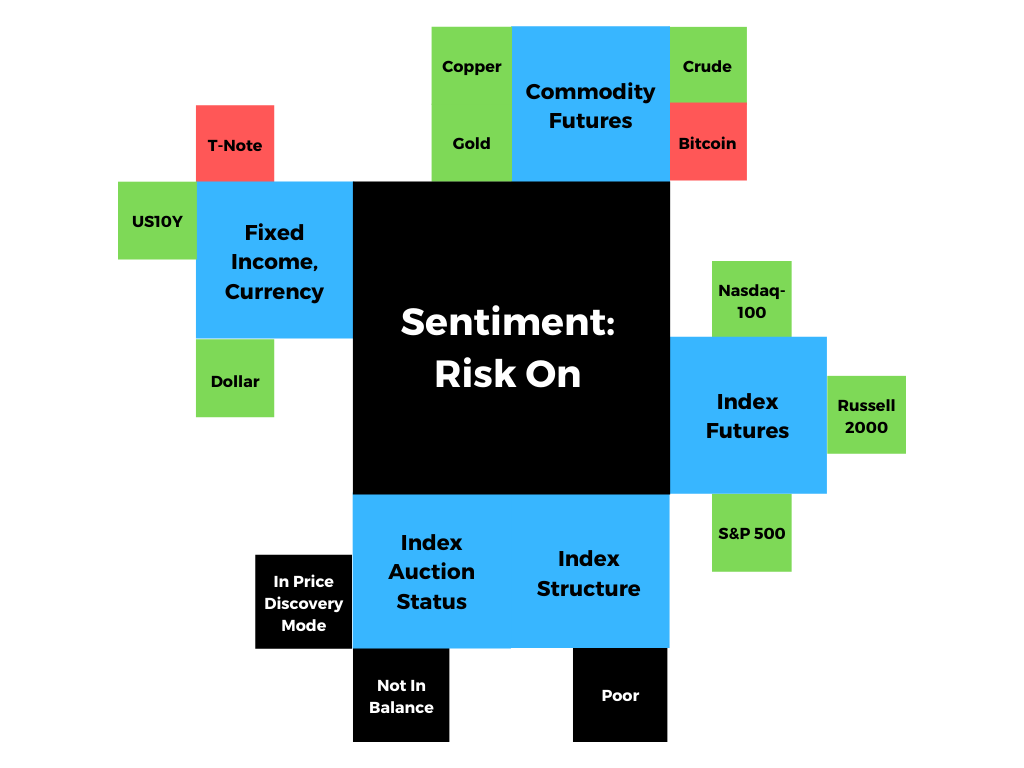
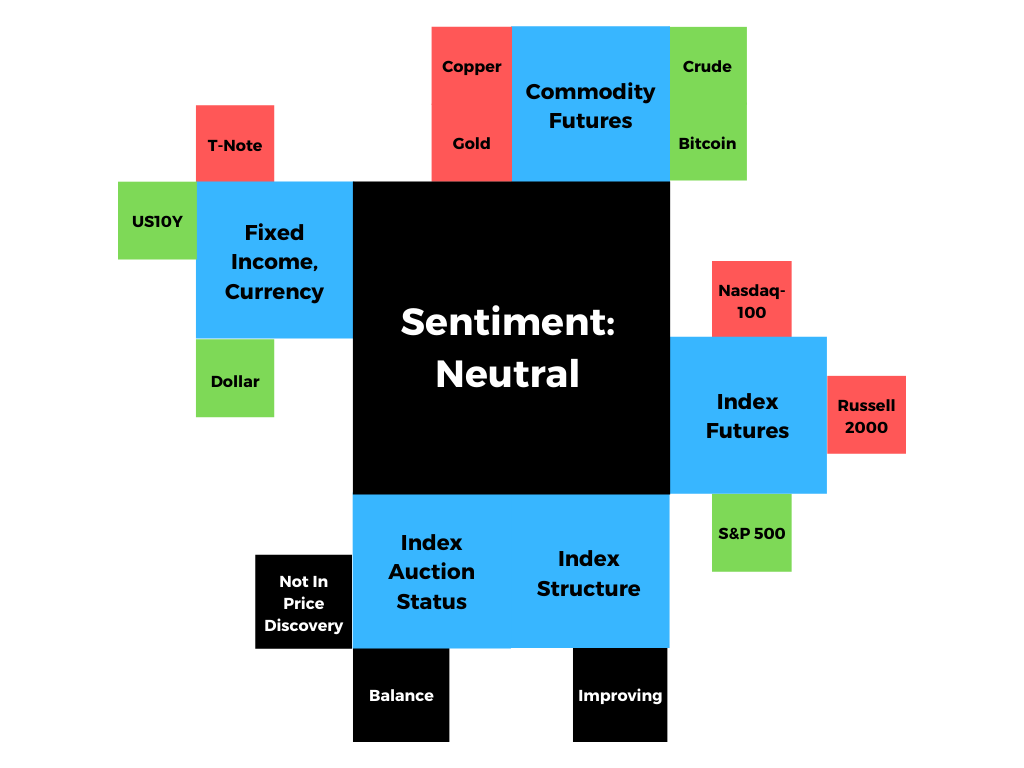
What Happened: U.S. stock index futures auctioned within prior-range, overnight, ahead of fundamental releases such as the Philadelphia Fed Business Outlook and claims data.
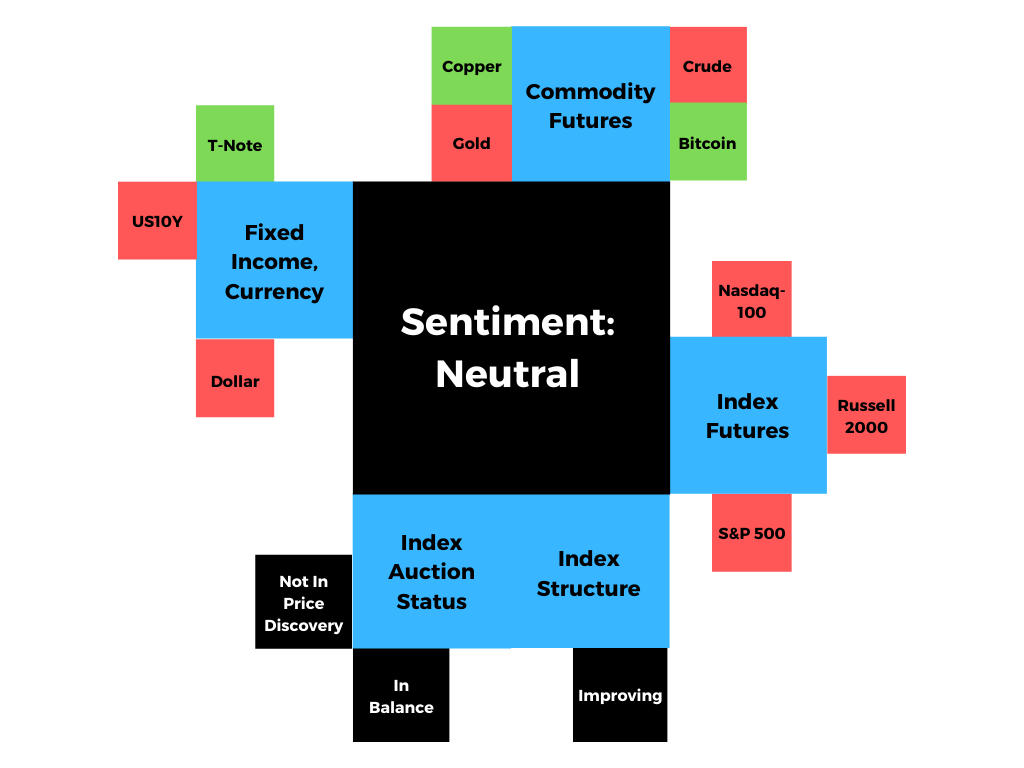
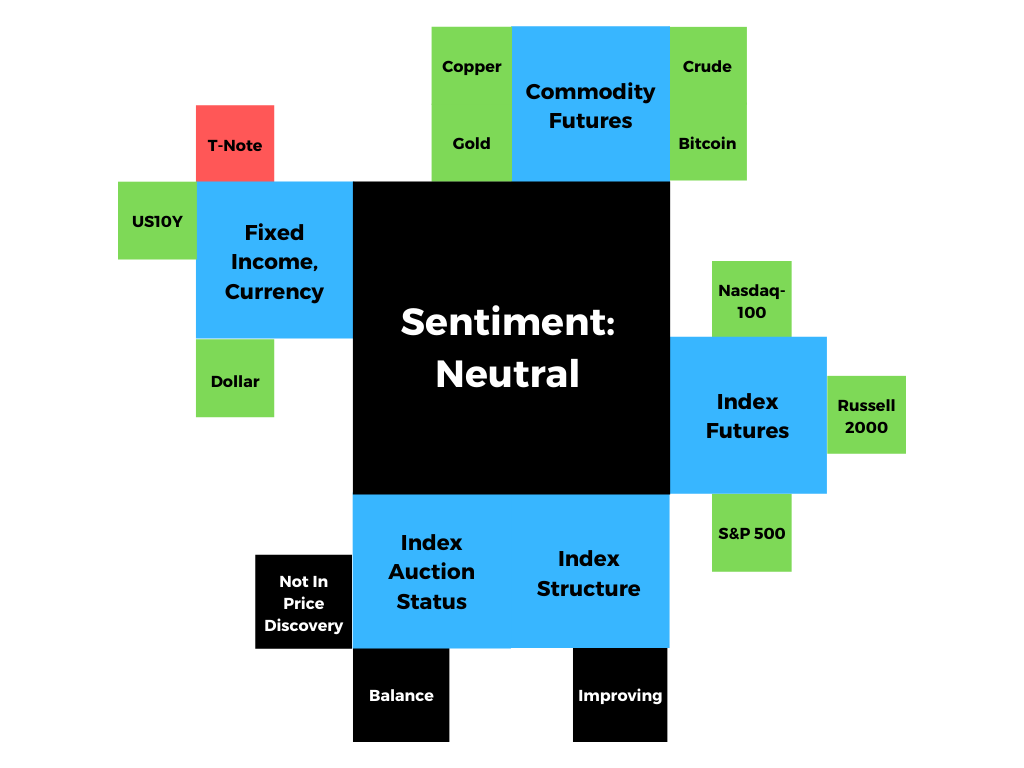
Graphic updated at 7:30 AM EST.

What To Expect: Thursday’s regular session (9:30 AM – 4:00 PM EST) in the S&P 500 will likely open inside of prior-range and -value, suggesting a limited potential for immediate directional opportunity. 

Adding, during the prior day’s regular trade, the best case outcome occurred, evidenced by responsive trade above the $4,069.25 high volume area (HVNode), which is significant because that value marked the other end of a micro-composite low volume area.

Volume Areas: A structurally sound market will build on past areas of high volume. Should the market trend for long periods of time, it will lack sound structure (identified as a low volume area which denotes directional conviction and ought to offer support on any test). 

If participants were to auction and find acceptance into areas of prior low volume, then future discovery ought to be volatile and quick as participants look to areas of high volume for favorable entry or exit.

Responsive Buying (Selling): Buying (selling) in response to prices below (above) area of recent price acceptance.

Further, this activity is happening in the context of concerns over rising inflation, which may prompt monetary authorities to ease back on stimulus. Yesterday, the Federal Reserve’s minutes showed that some on the committee were interested in tapering discussions. 

“It was a surprise to hear the talk about Fed tapering,” Joyce Chang, JPMorgan’s chair of global research, said. “The market had been thinking there might be a couple of months before you really saw this particular issue come into focus.”

Why is this – inflation – a concern? Generally speaking, inflation and rates move inverse to each other. Low rates stimulate demand for loans (i.e., borrowing money more attractive). With the rapid recovery, though, market participants fear that rates will rise to protect the economy from overheating.

Higher rates have the potential to reduce the present value of future earnings, making stocks, especially those that are high growth, less attractive. To note, however, rates are still rangebound; rates on the 10 Year T-Note sit below their March high and are likely to continue higher, which the market will likely absorb.

For today, beyond fundamental context, participants can trade from the following frameworks. 

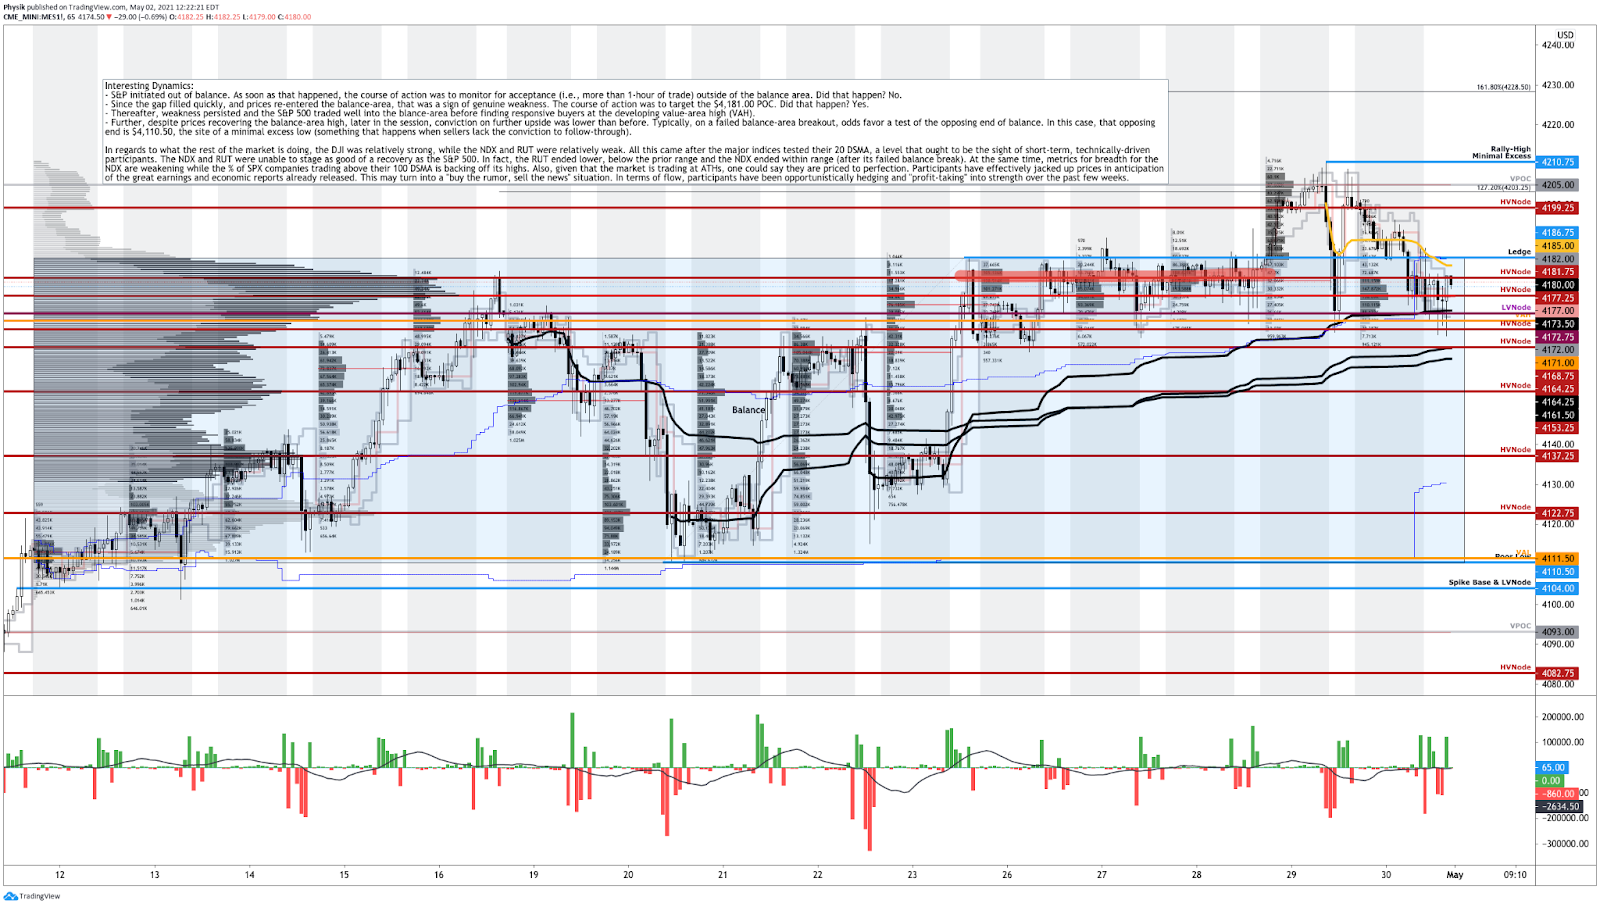
In the best case, the S&P 500 trades sideways or higher; activity above the $4,104.75 low volume area (LVNode) has the potential to reach up to the $4,122.25 HVNode. Initiative trade beyond the $4,122.25 HVNode could reach as high as the $4,134.00 spike base (a pivot on the composite profile; above = bullish, below = neutral-to-bearish). 

Spikes: Spike’s mark the beginning of a break from value. Spikes higher (lower) are validated by trade at or above (below) the spike base (i.e., the origin of the spike).

In the worst case, the S&P 500 trades lower; activity below the $4,069.25 HVNode targets a repair of the minimal excess low at $4,055.75. Thereafter, on a failed response, prices may continue lower, below the $4,050.75 LVNode boundary. In such a situation, caution longs. The potential exists to trade to the POCs at $4,015.00 and $4,001.00, if not even lower.

POCs: POCs (like HVNodes described above) are valuable as they denote areas where two-sided trade was most prevalent. Participants will respond to future tests of value as they offer favorable entry and exit.

Excess: A proper end to price discovery; the market travels too far while advertising prices. Responsive, other-timeframe (OTF) participants aggressively enter the market, leaving tails or gaps which denote unfair prices.
Graphic: 4-hour profile chart of the Micro E-mini S&P 500 Futures.
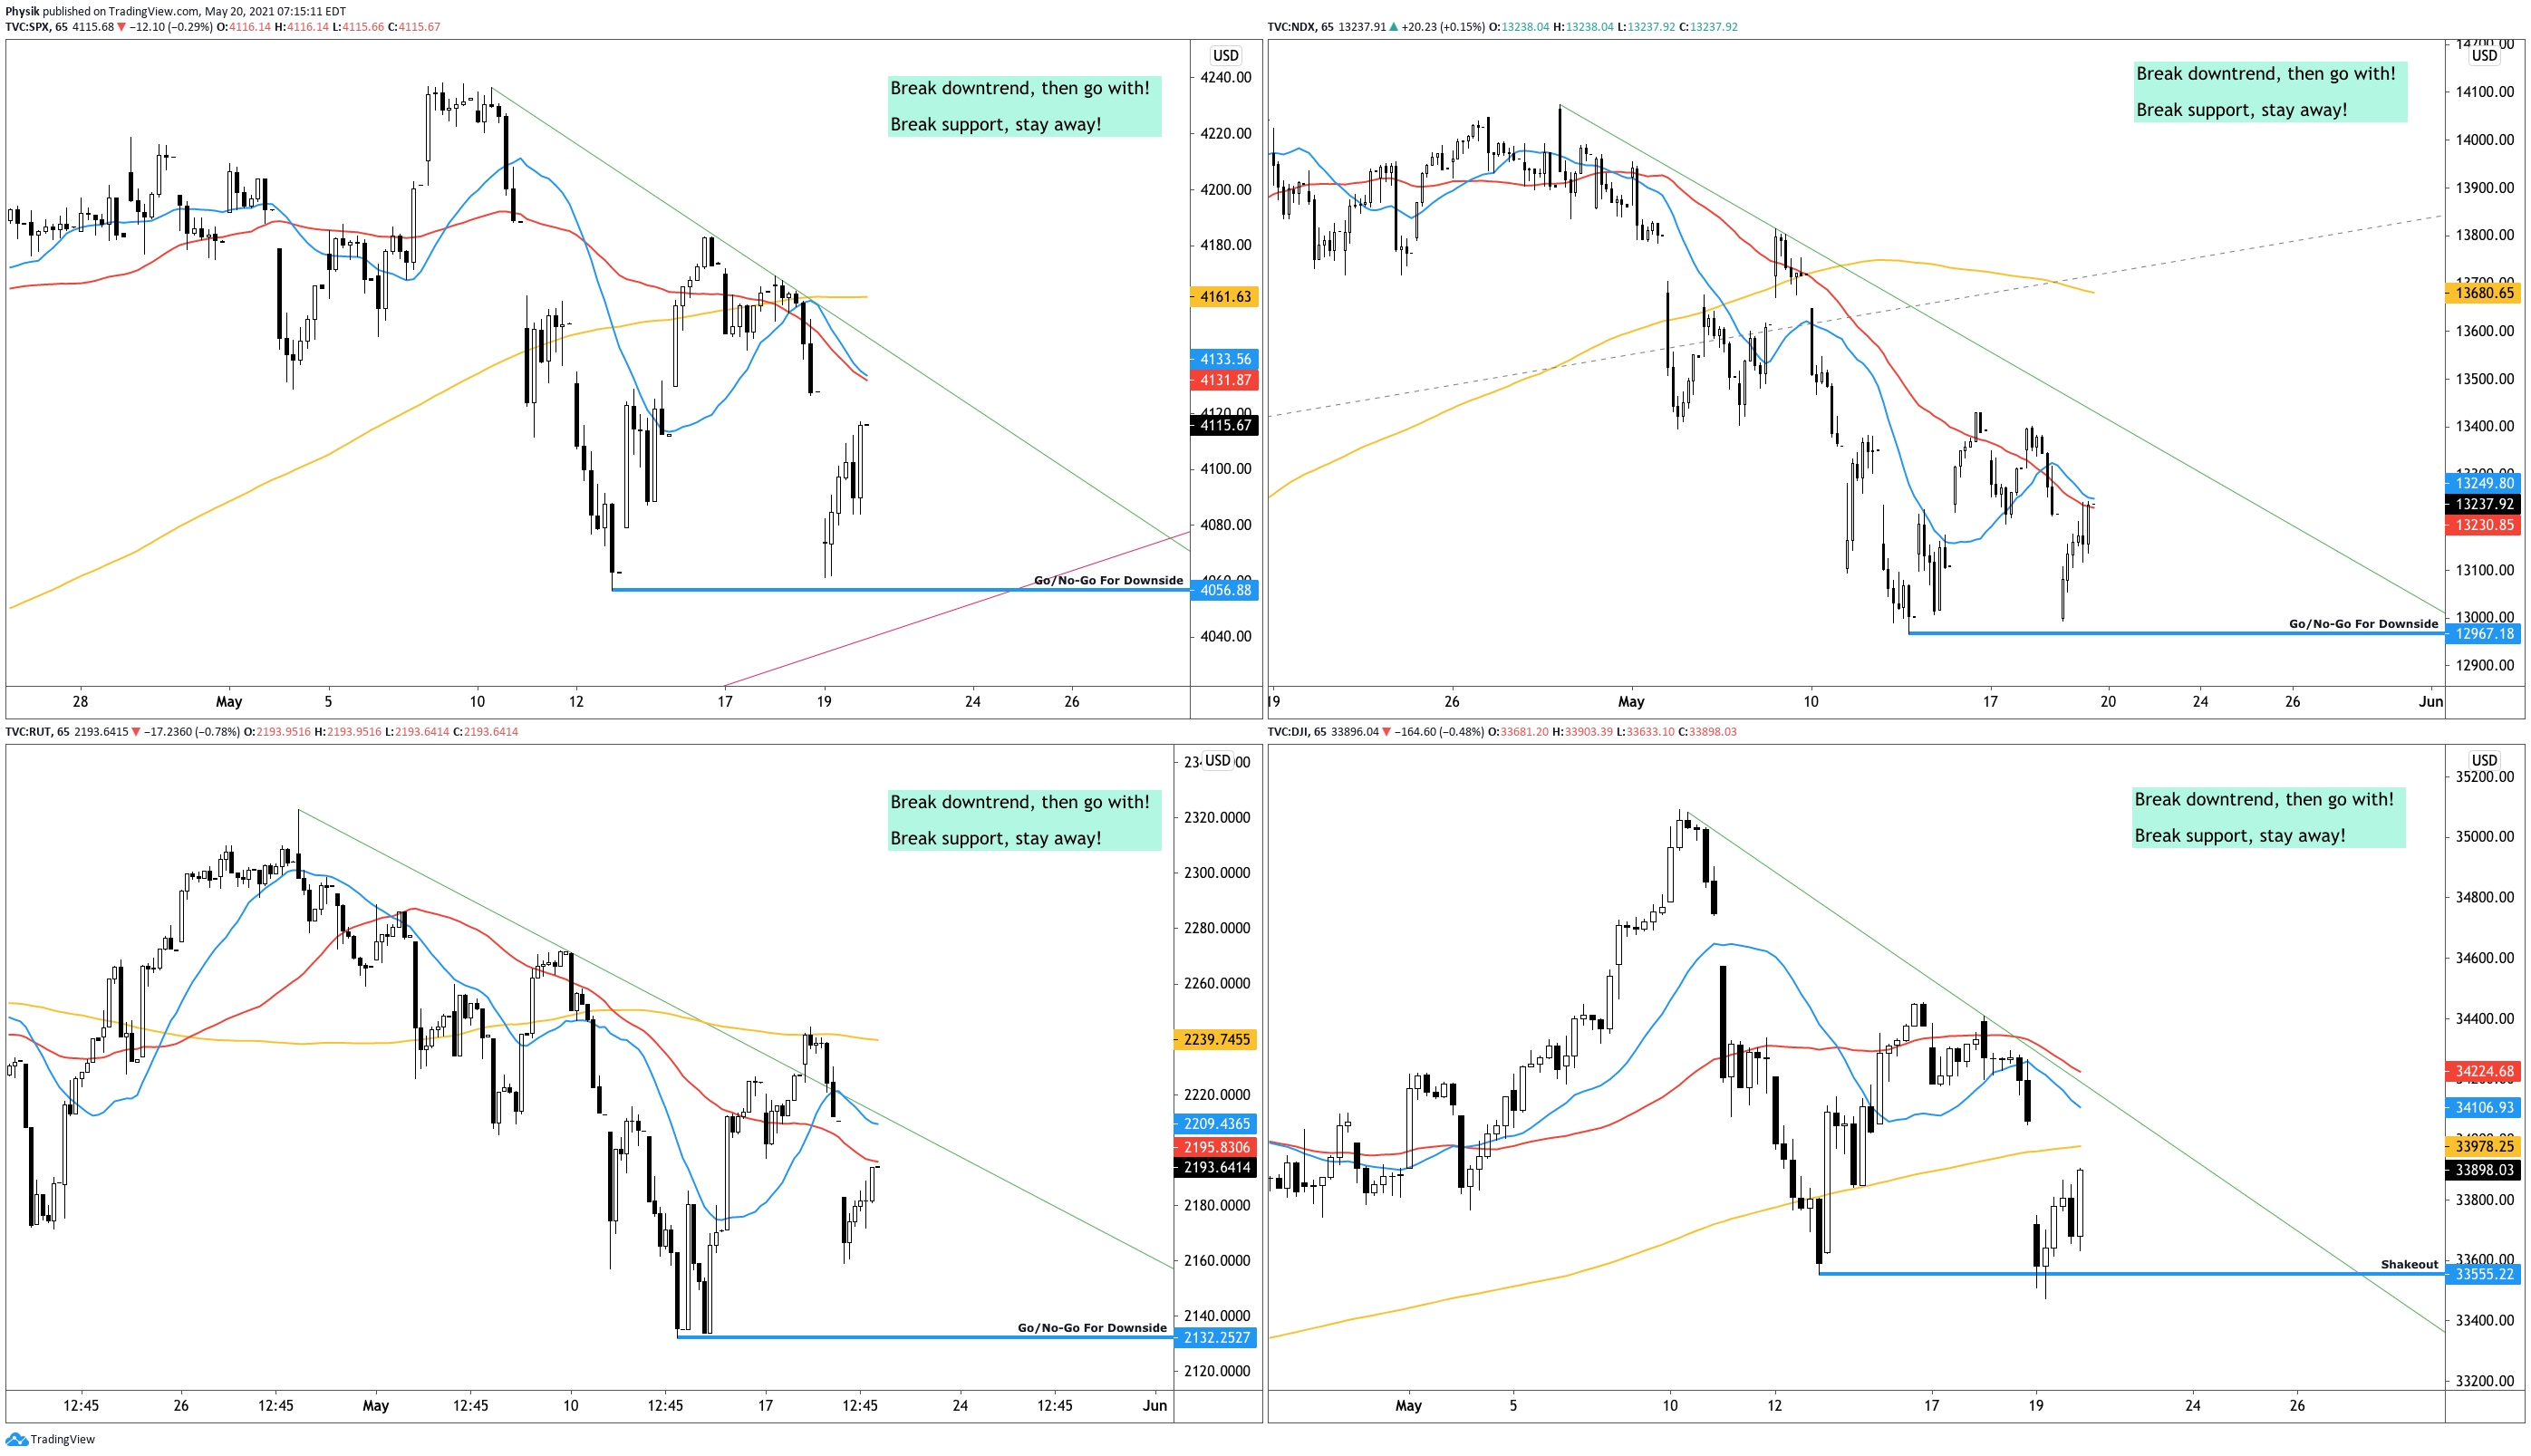
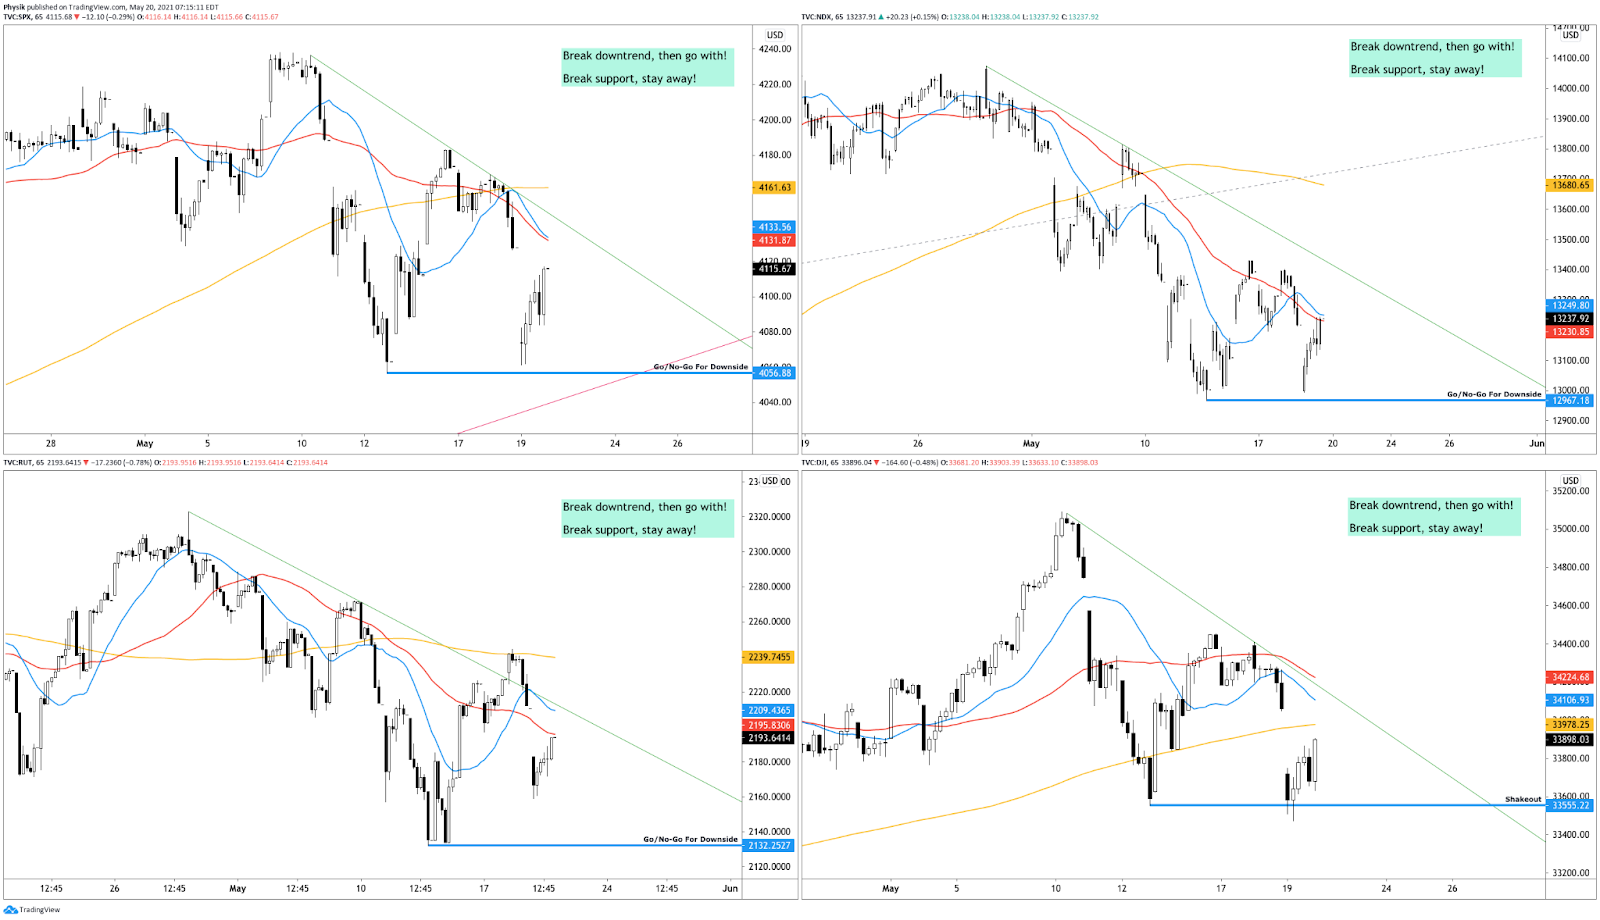
Graphic: 65-minute candlestick charts of the S&P 500 (top left), Nasdaq 100 (top right), Russell 2000 (bottom left), and Dow Jones Industrial Average (bottom right).
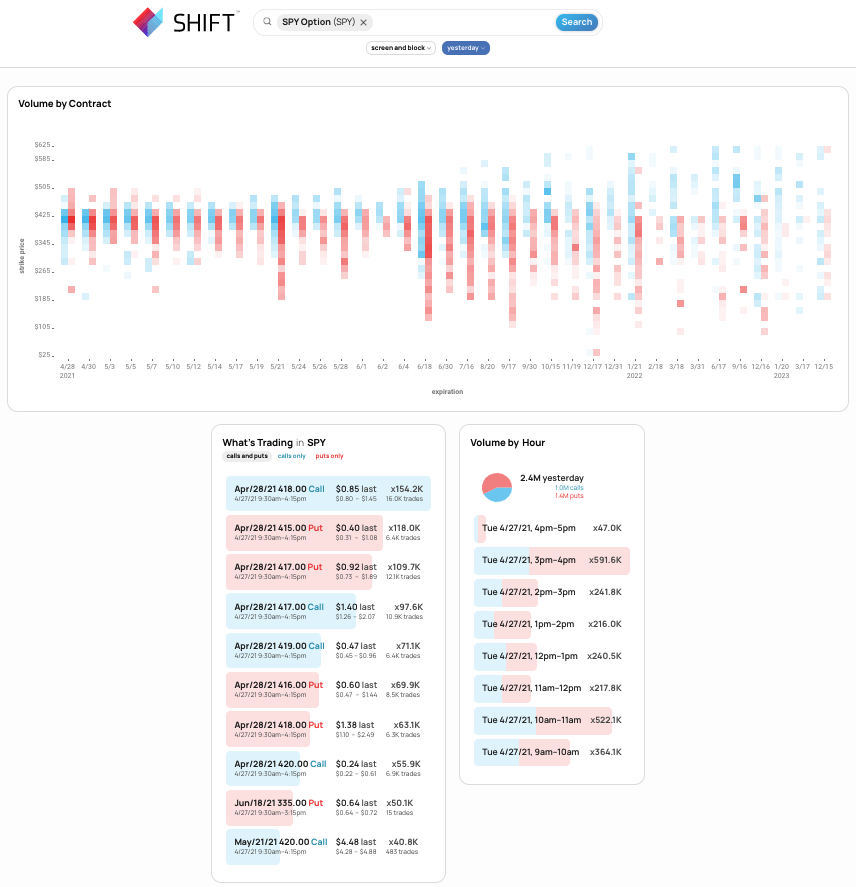
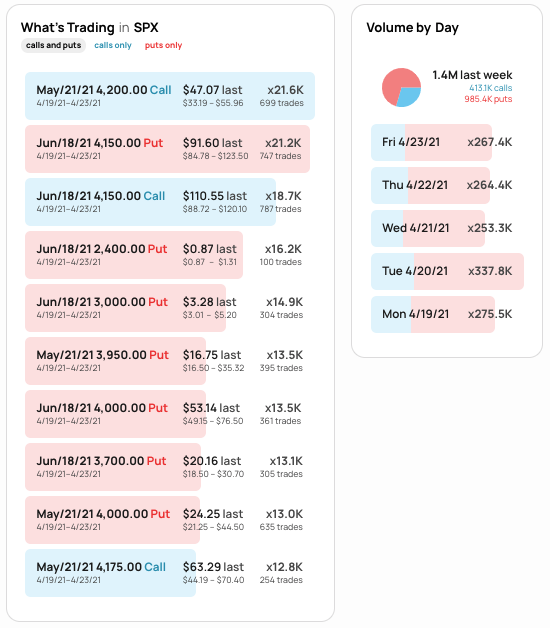
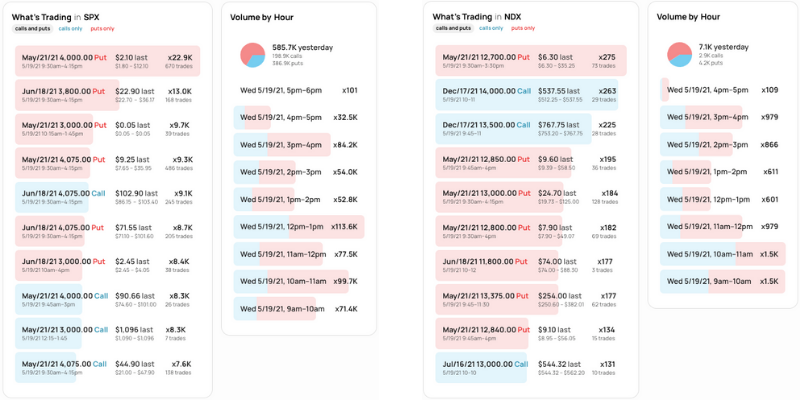
Graphic: SHIFT search suggests participants were most interested in put strikes at and below current prices in the cash-settled S&P 500 Index (INDEX: SPX) and Nasdaq 100 Index (INDEX: NDX), May 19. To note, however, participants were paying up for longer-dated upside exposure (evidenced by call activity). Note the December calls trading in the NDX and June calls in SPX.

News And Analysis

Recovery | New COVID-19 coronavirus cases fell by 20% in the last week. (Axios)

Economy | Central bank taper timelines are now starting to come into focus. (Axios)

Recovery | Vaccine boosters could be necessary as soon as September. (Axios)

Technology | Cisco says shortages will disrupt supply chains for rest of year. (FT)

Economy | Recovery funds increase investment but long-term gains uncertain. (Moody’s)

Energy | China’s industrial commodities slide after warning of crackdowns. (REU)

Travel | The U.S. is weighing changes to pandemic air travel restrictions. (REU)

Economy | Refinance volumes increase for the second week despite rate bump. (MND)

Economy | Inflation surveys, market pricing consistent with what Fed wants. (Barrons)

What People Are Saying

Innovation And Emerging Trends

FinTech | New digitial exchange offers gold exposure and funding for miners. (REU)

Crypto | Sh*t coin billionaire: tales from the fringe of the cryptocurrency craze. (BBG)

Crypto | China deepens its fintech dominance with new digital currency. (Diplomat)

Crypto | Central bank digital currencies could disrupt financial systems. (Fitch)

FinTech | OCC chief signals new direction on bank supervision and fintech. (AB)

FinTech | Stripe betting on creator economy powered by likes of Clubhouse. (BI)

About

Renato founded Physik Invest after going through years of self-education, strategy development, and trial-and-error. His work reporting in the finance and technology space, interviewing leaders such as John Chambers, founder, and CEO, JC2 Ventures, Kevin O’Leary, businessman and Shark Tank host, Catherine Wood, CEO and CIO, ARK Invest, among others, afforded him the perspective and know-how very few come by.

Having worked in engineering and majored in economics, Renato is very detailed and analytical. His approach to the markets isn’t built on hope or guessing. Instead, he leverages the unique dynamics of time and volatility to efficiently act on opportunity.

Disclaimer

At this time, Physik Invest does not manage outside capital and is not licensed. In no way should the materials herein be construed as advice. Derivatives carry a substantial risk of loss. All content is for informational purposes only.

Categories
Commentary

Weekly Brief For May 2, 2021

Happy Sunday! Markets were choppy, ending the week flat-to-down. This came after President Joe Biden’s joint session of Congress, Fed Chair Jerome Powell’s assessment of the economy, and blowout earnings by heavily weighted index constituents.

The following commentary on U.S. broad market equity indices will discuss what happened, why it matters, what to expect, and how participants can position themselves for the coming week.

Market Commentary

What Happened: U.S. broad market indices closed the week out flat-to-down after a failed attempt to break higher on Thursday, April 29. Last week’s action suggests participants are looking for information to initiate a directional move.

  • Policy leaders, creators: Inflation pockets transitory.
  • Ahead: Data on labor, manufacturing, and earnings.
  • Markets balancing, positions for directional resolve.
Updated: 10:00 AM EST Sunday.

Why It Matters: The sideways action during last week’s trade came after a lengthy run, higher. 

The S&P 500, in particular, from its March 2020 low, is up over 90%.

That said, as investors enter into a new month, popular news outlets are beating the drum of an old adage: “Sell in May and go away.”

Is there any truth to this statement? It depends on perspective.

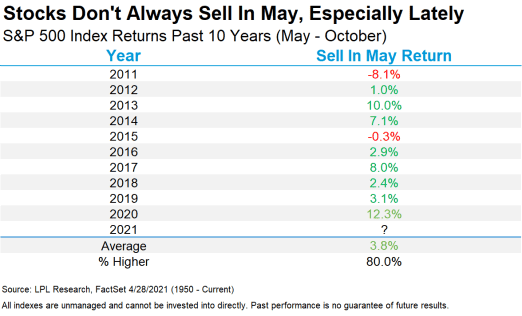
Historically speaking, the period spanning May to October is generally weak. On average, the S&P 500 is up as high as +2% during this six-month period.

“Stocks are up more than 87% from the March lows, suggesting a well-deserved pullback during these troublesome months is quite possible,” LPL Financial Chief Market Strategist Ryan Detrick said in a recent blog post. “But with an accommodative Fed, fiscal and monetary policy, along with an economy that is opening faster than nearly anyone expected, we’d use any weakness as an opportunity to add to positions.”

Adding, trends are changing, though; stocks have been higher during these so-called weak months 8 out of the past 10 years, according to LPL Research. 

Graphic by LPL Research. Data from FactSet. 

So, with that, in maintaining objectivity, we zoom out and ask a few questions.

  1. Where are we in relation to the prior week’s range? Overlapping.
  2. Is the market’s attempt to go in a certain direction supported? No. After a failed balance-area breakout, participants rotated and accepted prices back in the prior range, as evidenced by unchanged value-area placement, the area where 70% of prior trade (i.e., 1 standard deviation) is conducted.
  3. Is the technical and fundamental narrative supportive of current prices? Technically, the market is in an extended uptrend. However, despite value-area placement suggesting a validation of higher prices, market liquidity metrics point to distribution, the opposite of accumulation.

Now, we analyze other factors in play.

  • Real Yields: Alongside April’s FOMC — at which the Federal Reserve left rates unchanged and asset purchases steady — 10-year real yields are on track for their biggest drop since last summer. Low real rates may catalyze risk assets as the present value of their future earnings become more attractive
  • Capital Gains Tax (CGT): The White House expressed its desire to raise the federal CGT rate to 43.4% for wealthy individuals. However, as Goldman Sachs Group (NYSE: GS) sees it, Congress is likely to settle on a more modest increase. Adding, weak S&P 500 returns, historically, going into CGT hikes are short-lived.
  • Low Rates, Debt Expansion: Such dynamics incent market participants to take risks, causing destabilizing factors to brew. As Ambrus Group’s Kris Sidial says, “The growth of structured products, passive investing, the regulatory standpoint that’s been implemented with Dodd-Frank and dealers needing to hedge off their risk more frequently than not” are all part of a regime change that’s affected the stability of markets.
  • Positioning: According to Nomura data presented by The Market Ear, CTAs have taken their positions too far on the long side, reaching levels last seen prior to the 2018 Volmageddon. Additionally, the (1) SPDR S&P 500 ETF Trust (NYSE: SPY) and the (2) Invesco QQQ Trust Series 1 (NASDAQ: QQQ) funds saw some of their biggest outflows. At the same time, certain breadth metrics are diverging from current prices while the SPDR S&P 500 ETF, cash-settled S&P 500 Index, and Invesco QQQ saw sizable call-side bets trade, Friday. 
  • Earnings Reaction: Last week, heavily weighted index constituents reported blowout earnings. The reaction was muted, leaving broad market indices flat-to-down. One explanation is that the expectations, going into the events, were too high. Another is that the equity market is priced to perfection, at this stage of the recovery, and further advances will be supported by the rotation into cyclical parts of the market — financials, energy, and value. 
  • Option Expiration (OPEX): Option expiries mark an end to pinning (i.e, the theory that market makers and institutions short options move stocks to the point where the greatest dollar value of contracts will expire worthless) and the reduction dealer gamma exposure. According to SpotGamma, a provider of actionable options insights, on Friday, up to 30% of the S&P 500 and Nasdaq 100’s gamma rolled off which may allow the indices an opportunity to directionally resolve.

So, in summarizing this section, technically, the market is bullish, supported by the prospects of a healthy rotation. In the coming week, given increased clarity on policy and a sizable derivatives expiry, participants may see directional resolve.

What To Expect: An increased potential to resolve directionally.

In addition, metrics, like price movement, market liquidity, and speculative derivatives activity, confirm participants’ bullishness and opportunistic hedging in light of an acceleration in the global restart and a turn in flows, the result of an apparent shift in consumer preferences, from saving and investing to spending.

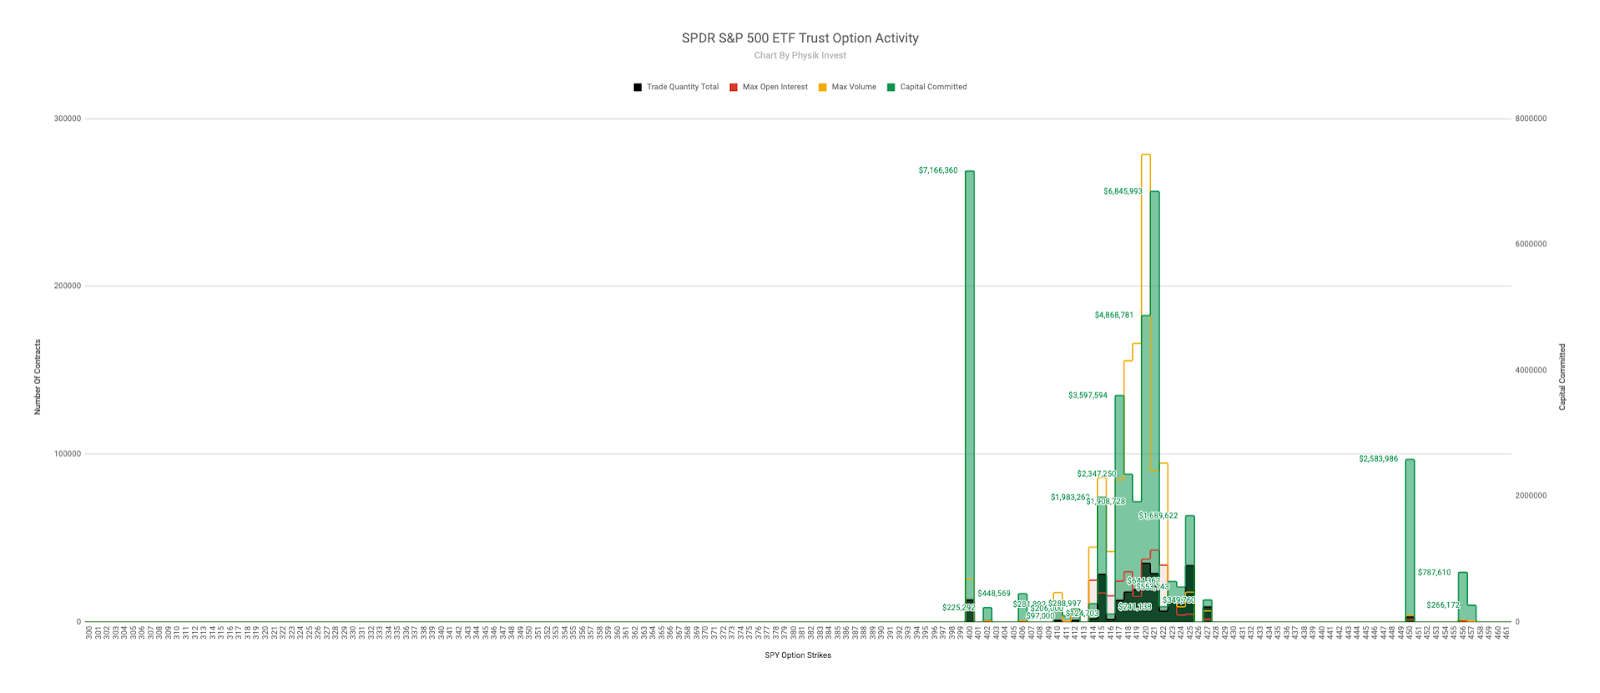
Graphic: Physik Invest maps out the purchase of call and put options in the SPDR S&P 500 ETF Trust (NYSE: SPY), for the week ending April 30. Activity in the options market was primarily concentrated in short-dated tenors, in strikes as low as $400.000, which corresponds with $4,000.00 in the cash-settled S&P 500 Index (INDEX: SPX).

What To Do: In the coming sessions, participants will want to pay attention to where the S&P 500 trades in relation to its $4,186.75-$4,110.50 balance area. 

Balance (Two-Timeframe Or Bracket): Rotational trade that denotes current prices offer favorable entry and exit. Balance-areas make it easy to spot change in the market (i.e., the transition from two-time frame trade, or balance, to one-time frame trade, or trend).

Any activity above (below) the balance-area high suggests participants are interested in discovering higher (lower) prices. Any activity within the balance area suggests participants are looking for more information to base their next move; in such case, responsive buying and selling is the course of action. 

Responsive Buying (Selling): Buying (selling) in response to prices below (above) area of recent price acceptance.

Initiative trade below the balance-area low suggests an inclination by participants to revert to the mean and repair some of the poor structure left behind prior discovery. Initiative trade above the balance area puts in play the $4,210.75 minimal excess rally-high, and the cluster of price extensions at and above $4,200.00, typical price targets based on Fibonacci principles.

Initiative Buying (Selling): Buying (selling) within or above (below) previous price acceptance.

Excess: A proper end to price discovery; the market travels too far while advertising prices. Responsive, other-timeframe (OTF) participants aggressively enter the market, leaving tails or gaps which denote unfair prices.

So, in the best case, the S&P 500 makes an attempt to balance or discover prices as high as $4,300.00. In the worst case, participants look to auction the S&P 500 into prior poor structures and low-volume areas (LVNodes) that ought to offer little-to-no support.

More On Volume Areas: A structurally sound market will build on past areas of high-volume (HVNode). Should the market trend for long periods of time, it will lack sound structure (identified as a low-volume area (LVNode) which denotes directional conviction and ought to offer support on any test). 

If participants were to auction and find acceptance into areas of prior low-volume, then future discovery ought to be volatile and quick as participants look to areas of high volume for favorable entry or exit.
Graphic: 65-minute profile chart of the Micro E-mini S&P 500 Futures.

News And Analysis

Markets | U.S. builders produced record share of homes with hot market. (BBG)

Economy | Consumer spending, labor cost data suggests inflation warming up. (REU

Trade | Baltic Dry Index breaks 3,000 points in more than a decade on prices. (TW)

Wealth | Rich Americans fleeing tax hikes may turbocharge the shift to ETFs. (BBG)

Markets | Fed’s Robert Kaplan warns on ‘imbalances,’ wants to talk taper. (REU)

Markets | A volatility quant nets $540 million as momentum trades boom. (BBG)

Lending | States are investigating predatory subprime auto lenders. (Jalopnik)

Markets | Record metals prices catapulted mining profits beyond big oil. (BBG)

Medicine | Biden’s ARPA-H agency to ‘end cancer’ modeled after Darpa. (TC)

Markets | Bond market’s inflation bulls get Powell’s go-ahead to double down. (BBG)

Markets | Bridgewater Co-CIO sees ‘fair amount’ of stock market in bubble. (BBG)

Markets | Retail investors could counter the much-anticipated correction. (SA)

Economy | Warren Buffett denounces SPACs and Robinhood at meeting. (Axios)

Markets | Crypto’s shadow currency surges past deposits of most U.S. banks. (BBG)

Technology | Roku says it may lose YouTube app after Google’s demands. (Axios)

Economy | Ex-Treasury Secretary Summers on scarcity of workers, inflation. (BBG)

Markets | Parametric fund earns ‘Gamma Hammer’ moniker with its bets. (FT)

What People Are Saying

Innovation And Emerging Trends

FinTech | Apex Fintech has blow-out earnings ahead of NYSE listing. (BZ)

FinTech | How to attract large investors to your direct investing platform? (TC)

FinTech | New fintech groups form as industry scrutiny is ramping up. (S&P)

FinTech | Cryptocurrency bank wins OCC approval to form de novo. (S&P)

Markets | CME eyes wider customer base with micro bitcoin futures. (TB)

FinTech | Coinbase plans to acquire data and analytics platform Skew. (TB)

FinTech | How U.K.-based Lendable is powering fintechs across EMs. (TC)

FinTech | Amid the IPO gold rush, how should we value fintech startups? (TC)

FinTech | 10 fintech headhunters you need to know for recruiting to talent. (BI)

FinTech | U.K. banks speed up plans to ax branches, switch to digital focus. (S&P)

Medicine | Kevin O’Leary-backed MindMed has uplisted on the Nasdaq. (BZ)

Media | Creators are making lots of money selling Google spreadsheets. (Mashable)

Media | As newsletter advertising grows, advertisers opting for quality. (ADWK)

About

Renato founded Physik Invest after going through years of self-education, strategy development, and trial-and-error. His work reporting in the finance and technology space, interviewing leaders such as John Chambers, founder, and CEO, JC2 Ventures, Kevin O’Leary, Canadian businessman and Shark Tank host, Catherine Wood, CEO and CIO, ARK Invest, among others, afforded him the perspective and know-how very few come by.

Having worked in engineering and majored in economics, Renato is very detailed and analytical. His approach to the markets isn’t built on hope or guessing. Instead, he leverages the unique dynamics of time and volatility to efficiently act on opportunity.

Disclaimer

At this time, Physik Invest does not manage outside capital and is not licensed. In no way should the materials herein be construed as advice. Derivatives carry a substantial risk of loss. All content is for informational purposes only.

Categories
Commentary

Daily Brief For April 29, 2021

Market Commentary

Index futures in price discovery mode.

  • Market up on earnings, Fed support.
  • Ahead: Earnings and GDP forecasts.
  • Futures out of balance, off new highs.

What Happened: U.S. stock index futures auctioned higher overnight after President Joe Biden’s joint session of Congress, Fed Chair Jerome Powell’s assessment of the economy, and blowout earnings by heavily weighted index constituents. 

Graphic updated at 8:20 AM ET.

What To Expect: Thursday’s regular session (9:30 AM – 4:00 PM EST) will likely open on a gap, outside of prior-range and -value, suggesting the potential for directional opportunity.

Balance-Break + Gap Scenarios: Monitor for acceptance (i.e., more than 1-hour of trade) outside of the balance area. 

Gaps ought to fill quickly. Should they not, that’s a signal of strength; do not fade. Leaving value behind on a gap-fill or failing to fill a gap (i.e., remaining outside of the prior session’s range) is a go-with indicator. 

Auctioning and spending at least 1-hour of trade back in the prior range suggests a lack of conviction; in such a case, do not follow the direction of the most recent initiative activity.

Adding, overnight, Wednesday’s best-case outcome occurred, evidence by initiative trade beyond the S&P 500’s $4,186.75 ledge. Thus far, the index has taken out all major upside references.

Initiative Buying: Buying within or above the previous day’s value area.

Ledges: Flattened area on the profile which suggests responsive participants are in control, or initiative participants lack the confidence to continue the discovery process. The ledge will either hold and force participants to liquidate (cover) their positions, or crack and offer support (resistance).

Initiative Buying: Buying within or above the previous day’s value area.

To note, the Fed strengthened its assessment of the economy and reaffirmed the need for aggressive support. 

Charlie Ripley, Senior Investment Strategist for Allianz Investment Management states: “With no meaningful change to monetary policy or communication, this meeting was simply a message to market participants to sit back and observe as the economic recovery continues to unfold.”

“For now, the Fed is maintaining a tight grip on the bond market, but it appears like a discussion on tapering bond purchases is right around the corner.”

Moving on, for today, participants can trade from the following frameworks. 

In the best case, the S&P 500 trades sideways or higher; activity between the $4,203.25 Fibonacci-derived price extension and $4,186.75 ledge calls for balance or responsive trade. Initiative trade beyond the $4,203.25 price extension could reach as high as $4,228.00 and $4,263.00. 

Responsive Buying (Selling): Buying (selling) in response to prices below (above) area of recent price acceptance.

Balance (Two-Timeframe Or Bracket): Rotational trade that denotes current prices offer favorable entry and exit. Balance-areas make it easy to spot change in the market (i.e., the transition from two-time frame trade, or balance, to one-time frame trade, or trend).

In the worst case, the S&P 500 trades lower; activity below the $4,186.75 ledge targets the $4,181.00 POC. 

POCs: POCs (like HVNodes described above) are valuable as they denote areas where two-sided trade was most prevalent. Participants will respond to future tests of value as they offer favorable entry and exit.

Thereafter, if lower, participants should look for a rotation to the other balance, or $4,110.50. 

Graphic: 65-minute profile chart of the Micro E-mini S&P 500 Futures.
Graphic: Physik Invest maps out the purchase of call and put options in the SPDR S&P 500 ETF Trust (NYSE: SPY), for April 28. Impactful activity in the options market was primarily concentrated on the call side, in short-dated tenors, in strikes as high as $425.00, which corresponds with $4,250.00 in the cash-settled S&P 500 Index (INDEX: SPX).

News And Analysis

Economy | Mortgage application volume falls despite lower rates. (MND)

Recovery | De Blasio says New York City plans full reopen in July. (Axios)

Economy | EU industry calls for a carbon border tax as prices soar. (FT)

Technology | Chip drought hits Apple, BMW, Ford as crisis worsens. (BBG)

M&A | LSEG, and Euronext completed the Borsa Italiana transaction. (TTN)

Economy | German joblessness unexpectedly rises on virus curb. (BBG)

Markets | Getting harder to argue that price increases are temporary. (BBG)

Commodities | Goldman sees commodities rallying on strong demand. (REU)

Economy | Roads across the world busier than at the start of the year. (BBG)

What People Are Saying

Innovation And Emerging Trends

FinTech | State Of Fintech Q1 2021 Report: Investment, Sector Trends. (CBI)

MiamiTech | ‘Miami Tech Week’ wasn’t planned. But the hype is infectious. (Wired)

FinTech | Ethereum jumps to high on a report of EIB digital bond issuance. (REU)

 About

Renato founded Physik Invest after going through years of self-education, strategy development, and trial-and-error. His work reporting in the finance and technology space, interviewing leaders such as John Chambers, founder, and CEO, JC2 Ventures, Kevin O’Leary, Canadian businessman and Shark Tank host, Catherine Wood, CEO and CIO, ARK Invest, among others, afforded him the perspective and know-how very few come by.

Having worked in engineering and majored in economics, Renato is very detailed and analytical. His approach to the markets isn’t built on hope or guessing. Instead, he leverages the unique dynamics of time and volatility to efficiently act on opportunity.

 Disclaimer

At this time, Physik Invest does not manage outside capital and is not licensed. In no way should the materials herein be construed as advice. Derivatives carry a substantial risk of loss. All content is for informational purposes only.

Categories
Commentary

Daily Brief For April 28, 2021

Market Commentary

Index futures balance, trade sideways.

  • Traders honed in on a Fed taper.
  • A heavy day of earnings, FOMC.
  • Expect chop or responsive trade. 

What Happened: Ahead of key economic developments, U.S. stock index futures auctioned sideways-to-lower overnight. Yields and the dollar rose.

This activity comes alongside reports of strong earnings from heavily weighted index constituents. Alphabet Inc (NASDAQ: GOOGL), Microsoft Corporation (NASDAQ: MSFT), and Pinterest (NYSE: PINS) were some of the most anticipated reports.

Today, Joe Biden will unveil his “American Families Plan” in an address to Congress, the Federal Reserve will provide clarity on its monetary easing plan, and Apple Inc (NASDAQ: AAPL), among others, will report their earnings.

Graphic updated at 8:20 AM EST.

What To Expect: Wednesday’s regular session (9:30 AM – 4:00 PM EST) will likely open inside of prior-range and -value, suggesting a limited potential for immediate directional opportunity. 

Adding, over the past few sessions, volumes have dwindled and responsive trade has been the course of action. This is in anticipation of impactful fundamental developments, like the FOMC meeting, today.

Responsive Buying (Selling): Buying (selling) in response to prices below (above) area of recent price acceptance.

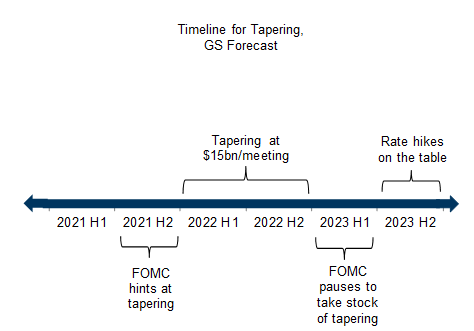
Goldman Sachs Group Inc (NYSE: GS) expects the Fed to keep rate hikes off the table until mid-2023. Given that labor slack remains high, the odds of tapering are rather slim.
Graphic: Goldman Sachs’ timeline for Federal Reserve tapering, via ForexLive.

That said, today’s trade will likely be volatile and participants can trade from the following frameworks. 

In the best case, the S&P 500 trades sideways or higher; activity above the $4,186.75 ledge targets the $4,191.75 overnight high (ONH). Initiative trade beyond the ONH may introduce excess and could reach as high as the Fibonacci-derived price targets, $4,197.25-$4,263.00. 

Ledges: Flattened area on the profile which suggests responsive participants are in control, or initiative participants lack the confidence to continue the discovery process. The ledge will either hold and force participants to liquidate (cover) their positions, or crack and offer support (resistance).

Overnight Rally Highs (Lows): Typically, there is a low historical probability associated with overnight rally-highs (lows) ending the upside (downside) discovery process.

Excess: A proper end to price discovery; the market travels too far while advertising prices. Responsive, other-timeframe (OTF) participants aggressively enter the market, leaving tails or gaps which denote unfair prices.
In the worst case, the S&P 500 trades lower; activity below $4,166.75 regular-trade low (RTH Low) targets the $4,164.25 high-volume area (HVNode). Thereafter, if lower, participants can look for responses at the $4,163.25, $4,137.25, and $4,122.75 HVNodes.

Volume Areas: A structurally sound market will build on past areas of high volume. Should the market trend for long periods of time, it will lack sound structure (identified as a low-volume area which denotes directional conviction and ought to offer support on any test). 

If participants were to auction and find acceptance into areas of prior low-volume, then future discovery ought to be volatile and quick as participants look to areas of high volume for favorable entry or exit.

As long as prices remain within the prior day’s range, responsive trade is the course of action. Participants should approach today’s session with extra caution, given the potential for headline-driven initiative activity. Big picture, though, the bullish narrative remains intact unless the S&P 500 is able to auction and spend time below the $4,110.50 minimal excess low (also the balance-area low). 

Initiative Buying (Selling): Buying (selling) within or above (below) the previous day’s value area.

Balance (Two-Timeframe Or Bracket): Rotational trade that denotes current prices offer favorable entry and exit. Balance-areas make it easy to spot change in the market (i.e., the transition from two-time frame trade, or balance, to one-time frame trade, or trend).
Graphic: 4-hour profile chart of the Micro E-mini S&P 500 Futures.
Graphic: SHIFT search maps out the trade of call and put options in the SPDR S&P 500 ETF Trust (NYSE: SPY), for April 27. Activity in the options market was primarily concentrated in short-dated tenors, in strikes near current prices. Data suggests participants, in insignificant amounts, added call-side exposure into the beginning of May. Sentiment flips into the end of May, beginning of June. 

News And Analysis

Economy | Biden unveils a massive family aid plan funded by taxing the rich. (BBG)

Economy | Fed to stay patient as U.S. outlook improves: decision-day guide. (BBG)

Commodities | Goldman sees commodities rallying over the next six months. (FP)

Markets | Tesla accused by EPA of auto-coating emissions reporting failure. (BBG)

Markets | Airbus unit has pleaded guilty to corruption over Saudi contracts. (BBG)

Commodities | OPEC+ is sticking to plan to ease oil output cuts from May 1. (REU)

Markets | Local banks, like their giant rivals, are finding loan growth elusive. (BBG)

Markets | Turning tide signals ebbing of liquidity ocean, analysis suggests. (REU)

What People Are Saying

Innovation And Emerging Trends

Markets | Chatting with Cathie Wood, the CEO, and CIO at ARK Invest. (MM)

FinTech | Trader-inspired brokerage Edge Clear launches new platform. (BZ)

FinTech | Barclays taps amount over end-to-end digital banking solutions. (BZ)

Financing | IRR in emerging tech hubs starting to overtake Silicon Valley. (TC)

FinTech | ICE introduces ultra-low-latency wireless services in Europe. (MM)

About

Renato founded Physik Invest after going through years of self-education, strategy development, and trial-and-error. His work reporting in the finance and technology space, interviewing leaders such as John Chambers, founder, and CEO, JC2 Ventures, Kevin O’Leary, Canadian businessman and Shark Tank host, Catherine Wood, CEO and CIO, ARK Invest, among others, afforded him the perspective and know-how very few come by.

Having worked in engineering and majored in economics, Renato is very detailed and analytical. His approach to the markets isn’t built on hope or guessing. Instead, he leverages the unique dynamics of time and volatility to efficiently act on opportunity.

Disclaimer

At this time, Physik Invest does not manage outside capital and is not licensed. In no way should the materials herein be construed as advice. Derivatives carry a substantial risk of loss. All content is for informational purposes only.

Categories
Commentary

Daily Brief For April 27, 2021

Market Commentary

Index futures auction sideways, validating higher prices.

  • 80% of companies beat expectations.
  • Ahead: FOMC, Biden Address, GDP.
  • Indices balance and correct with time.

What Happened: U.S. stock index futures auctioned sideways, overnight, while Treasury yields and commodities posted substantive gains.

This price action comes as nearly 80% of companies that reported their earnings have either met or beaten expectations. The muted response suggests much the optimism has already been priced in. Now, participants are looking for more information to base their next move. 

See here for information on how to read an earnings report.

Ahead, is data on home prices, consumer confidence, and manufacturing. On Wednesday, Federal Reserve Chair Jerome Powell will hold a conference on central bank policy. On the same day, Joe Biden will address Congress. Thursday, U.S. GDP will likely show improvement in the first quarter, 2021.

Graphic updated 8:30 AM EST.

What To Expect: Tuesday’s regular session (9:30 AM – 4:00 PM EST) will likely open inside of prior-range and -value, suggesting a limited potential for immediate directional opportunity. 

Adding, during the prior day’s regular trade, the best case outcome occurred, evidenced by sideways trade just shy of the $4,186.75 balance-area high. 

Balance (Two-Timeframe Or Bracket): Rotational trade that denotes current prices offer favorable entry and exit. Balance-areas make it easy to spot change in the market (i.e., the transition from two-time frame trade, or balance, to one-time frame trade, or trend).

All this comes after a substantial advance. The S&P 500 is up nearly 13% since the start of March and it could be said that the product has been marked up, enough. Given the busy calendar, the odds favor sideways trade. The reason being: a market in balance tends to stay in balance unless some exogenous factor provides participants more information to base their next move.

Adding, Jeff Buchbinder, Equity Strategist for LPL Financial says: “[W]hile sentiment may be overly optimistic and a pickup in volatility would be totally normal, strong breadth measures suggest stocks still may have more upside. This week we tackle that same topic of peak optimism, but by looking at some valuation metrics. While valuations are elevated, they still appear reasonable when factoring in interest rates and inflation.”

Moving on, for today, participants can trade from the following frameworks. 

In the best case, the S&P 500 trades sideways or higher; activity above the $4,186.75 ledge targets the $4,191.75 overnight high (ONH). Initiative trade beyond the ONH may introduce excess and could reach as high as the Fibonacci-derived price targets, $4,197.25-$4,263.00. 

In the worst case, the S&P 500 trades lower; activity below $4,173.25 regular-trade low (RTH Low) targets the $4,164.25 high-volume area (HVNode). Thereafter, if lower, participants can look for responses at the $4,163.25, $4,137.25, and $4,122.75 HVNodes.

Ledges: Flattened area on the profile which suggests responsive participants are in control, or initiative participants lack the confidence to continue the discovery process. The ledge will either hold and force participants to liquidate (cover) their positions, or crack and offer support (resistance).

Overnight Rally Highs (Lows): Typically, there is a low historical probability associated with overnight rally-highs (lows) ending the upside (downside) discovery process.

Initiative Trade: Buying (selling) within or above (below the previous day’s value area.

Excess: A proper end to price discovery; the market travels too far while advertising prices. Responsive, other-timeframe (OTF) participants aggressively enter the market, leaving tails or gaps which denote unfair prices.

Volume Areas: A structurally sound market will build on past areas of high volume. Should the market trend for long periods of time, it will lack sound structure (identified as a low-volume area which denotes directional conviction and ought to offer support on any test). 

If participants were to auction and find acceptance into areas of prior low-volume, then future discovery ought to be volatile and quick as participants look to areas of high volume for favorable entry or exit.

As long as the S&P 500 remains in the $4,186.75-$4,110.50 balance area, the course of action is responsive trade.

Graphic: 65-minute profile chart of the Micro E-mini S&P 500 Futures.
Graphic: SHIFT search maps out the trade of call and put options in the SPDR S&P 500 ETF Trust (NYSE: SPY), for April 26. Activity in the options market was primarily concentrated in short-dated tenors, in strikes near current prices. To put it simply, not much is going on, yet.

News And Analysis

Banking | Nomura, UBS take global banks’ Archegos hit to $10B. (BBG)

Economy | U.S. auto dealers are winners as chip shortage lifts profit. (REU)

Markets | Goldman Sachs watching total margin loans after blow-ups. (REU)

M&A | New York Community Bancorp will buy Flagstar Bancorp. (REU)

Economy | France, and Germany support U.S. 21% corporate tax plan. (BBG)

Travel | The E.U. set to let vaccinated U.S. tourists visit this summer. (NYT)

What People Are Saying

Innovation And Emerging Trends

FinTech | Citi eyes mortgage tech in push to close the wealth gap. (BBG)

Innovation | Germany to spend recovery money on green, digital goals. (REU)

FinTech | Mobile bank Current raises $220M Series D, tripling value. (TC)

FinTech | S!NG wants creators to lean on NFTs to protect their IP. (TC

About

Renato founded Physik Invest after going through years of self-education, strategy development, and trial-and-error. His work reporting in the finance and technology space, interviewing leaders such as John Chambers, founder, and CEO, JC2 Ventures, Kevin O’Leary, Canadian businessman and Shark Tank host, Catherine Wood, CEO and CIO, ARK Invest, among others, afforded him the perspective and know-how very few come by.

Having worked in engineering and majored in economics, Renato is very detailed and analytical. His approach to the markets isn’t built on hope or guessing. Instead, he leverages the unique dynamics of time and volatility to efficiently act on opportunity. 

Disclaimer

At this time, Physik Invest does not manage outside capital and is not licensed. In no way should the materials herein be construed as advice. Derivatives carry a substantial risk of loss. All content is for informational purposes only.
Categories
Commentary

Daily Brief For April 26, 2021

Market Commentary

Index futures base. Position for directional resolve. 

  • Earnings, FOMC, and more.
  • Indices base, correct by time.

What Happened: U.S. stock index futures traded sideways overnight ahead of impactful developments such as the corporate earnings, FOMC meeting, and economic data.

Key takeaway: ”We had argued for a likely breakout in bond yields, and continue to believe that equities will be able to tolerate this repricing, as growth-policy trade-off remains supportive,” JPMorgan Chase & Co. (NYSE: JPM) strategists Mislav Matejka, Prabhav Bhadani, and Nitya Saldanha said. “The phase of activity pick-up is ahead of us. At the same time, excess liquidity is likely to stay ample, as policymakers err on the side of caution.”

Graphic updated 7:50 AM EST.

What To Expect: Monday’s regular session in the S&P 500 (9:30 AM – 4:00 PM EST) will likely open inside of prior-range and -value, suggesting a limited potential for immediate directional opportunity. 

Adding, during the prior day’s regular trade, the best case outcome occurred, evidenced by initiative trade that recovered Thursday’s news-driven liquidation. Adding, the liquidation failed to take out the $4,110.50 minimal excess low. Given those nuances, odds favor (1) a correction through time (i.e., balance), rather than price, or (2) higher prices. 

Liquidation Breaks: The profile shape suggests participants were “too” long and had poor location.

Excess: A proper end to price discovery; the market travels too far while advertising prices. Responsive, other-timeframe (OTF) participants aggressively enter the market, leaving tails or gaps which denote unfair prices.

Balance (Two-Timeframe Or Bracket): Rotational trade that denotes current prices offer favorable entry and exit. Balance-areas make it easy to spot change in the market (i.e., the transition from two-time frame trade, or balance, to one-time frame trade, or trend).

For today, participants can trade from the following frameworks. 

In the best case, the S&P 500 trades sideways or higher; activity above the $4,186.75 balance-area high targets the remaining Fibonacci price targets at and above $4,200.00. 

In the worst case, the S&P 500 trades lower; activity below the $4,164.50 high-volume area (HVNode) targets the $4,153.25 HVNode. Thereafter, if lower, participants can look for responses at the $4,137.00 and $4,123.00 HVNodes. 

A break of the $4,110.50 minimal excess low suggests an inclination by participants to revert to the mean and repair some of the poor structure left behind prior discovery.

Volume Areas: A structurally sound market will build on past areas of high-volume. Should the market trend for long periods of time, it will lack sound structure (identified as a low-volume area which denotes directional conviction and ought to offer support on any test). 

If participants were to auction and find acceptance into areas of prior low-volume, then future discovery ought to be volatile and quick as participants look to areas of high-volume for favorable entry or exit.
Graphic: 4-hour profile chart of the Micro E-mini S&P 500 Futures.
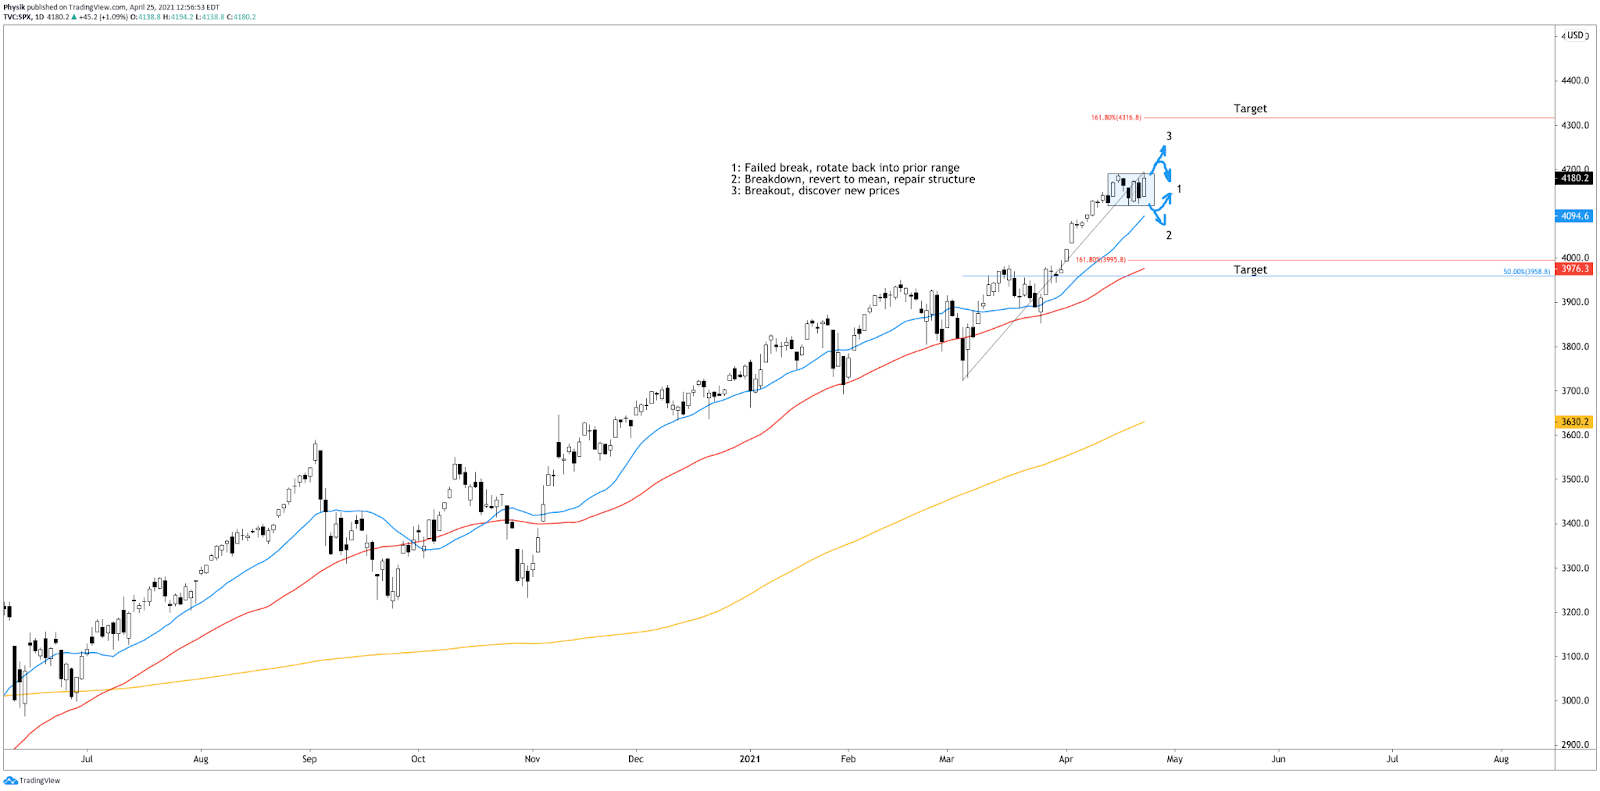
Graphic: 1-day candlestick chart of the cash-settled S&P 500 Index (INDEX: SPX).
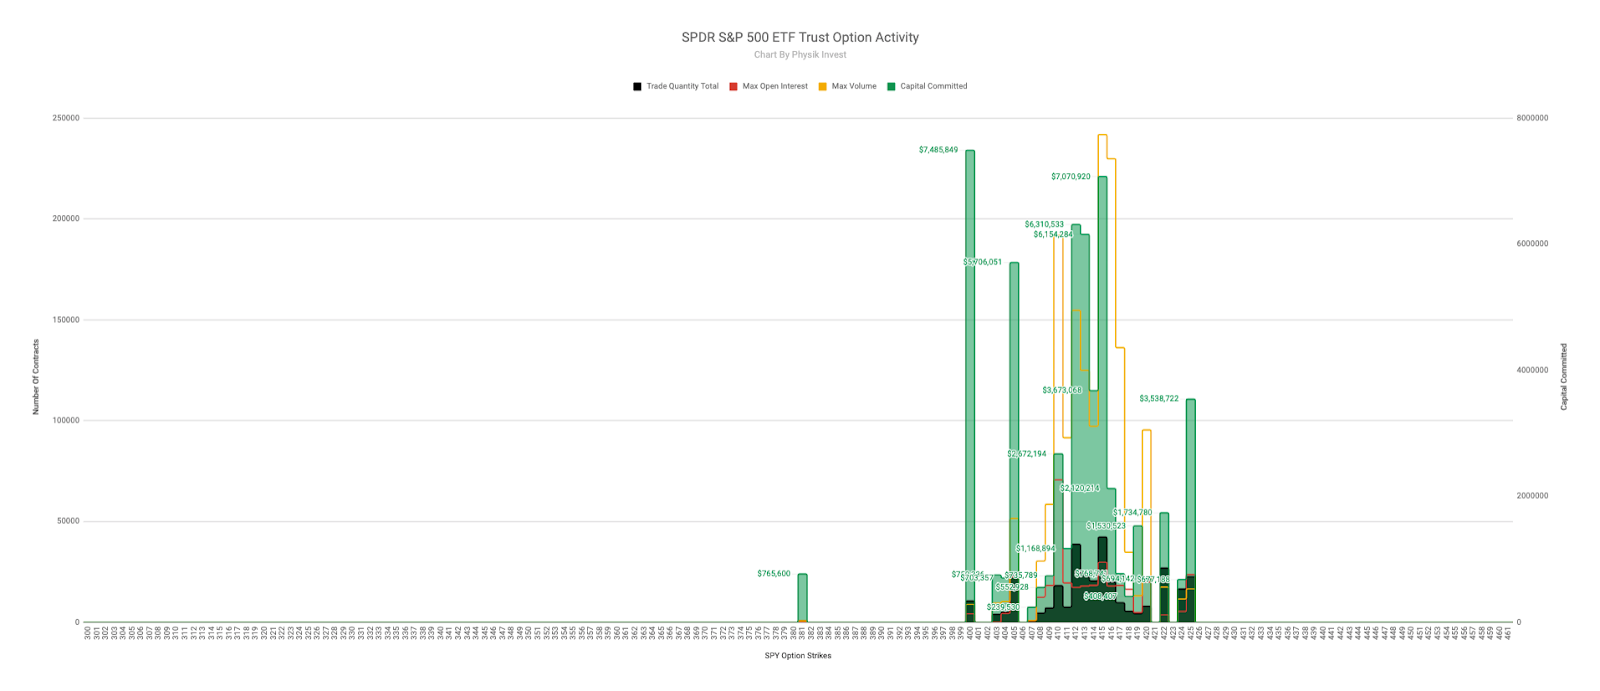
Graphic: Physik Invest maps out the purchase of call and put options in the SPDR S&P 500 ETF Trust (NYSE: SPY), for the week ending April 23. Activity in the options market was primarily concentrated in short-dated tenors, in strikes as low as $381.00, which corresponds with $3,810.00 in the cash-settled S&P 500 Index (INDEX: SPX).
Graphic: SHIFT search suggests participants are still not as inclined to add call-side exposure, through the month of May, in the cash-settled S&P 500 Index (INDEX: SPX).
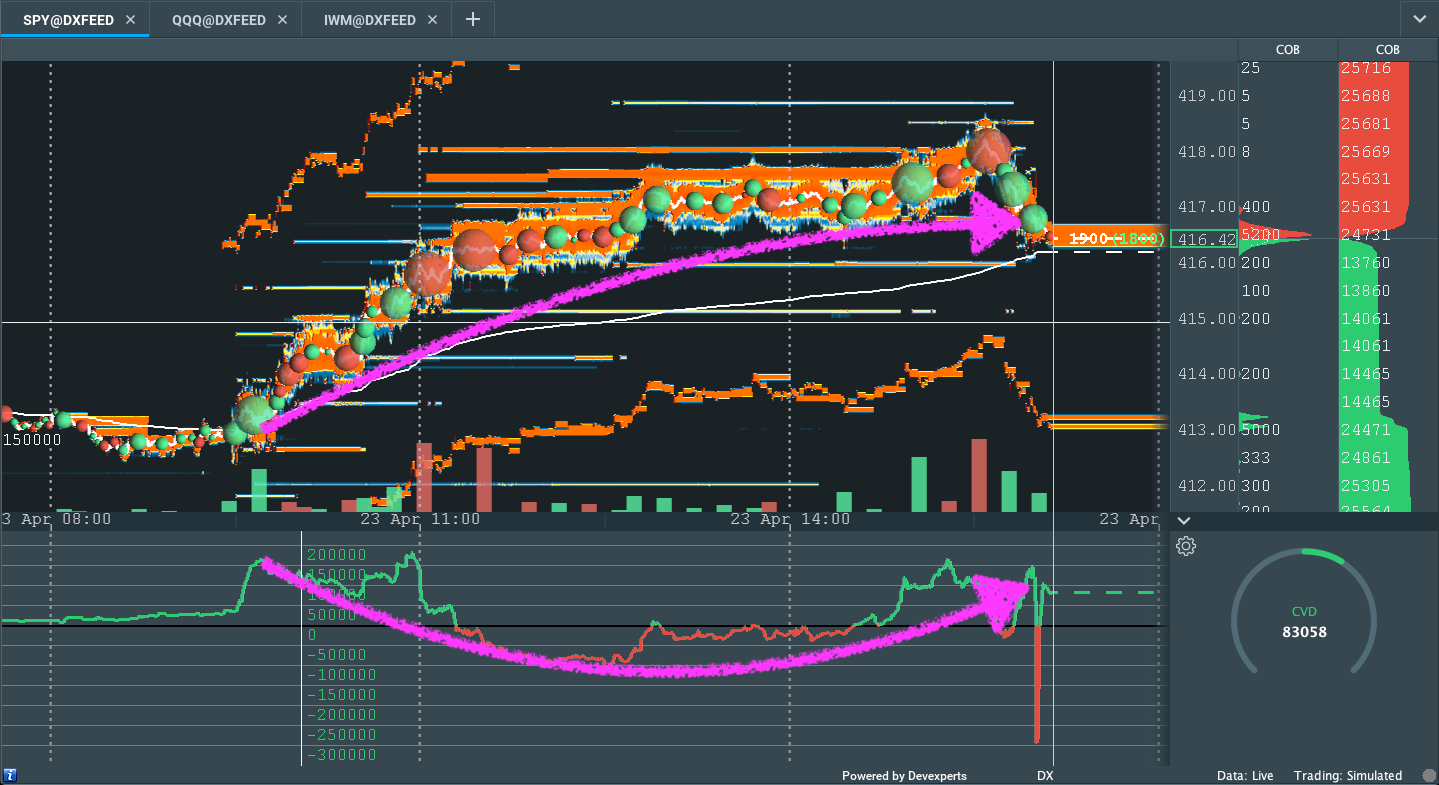
Graphic: SPDR S&P 500 ETF Trust (NYSE: SPY) market liquidity, via Bookmap. Note the divergent volume delta, a measure of buying and selling power as calculated by the difference in volume traded at the bid and offer. Such conditions favor balance (two-timeframe, rotational, or bracket trade).

News And Analysis

Economy | The Fed’s next test is breaking the ice over policy shift. (WSJ)

Politics | U.K. denies Boris Johnson said “let the bodies pile high.” (REU)

Economy | A disconnect between home sales, prices, and rates. (MND)

Economy | German government has raised 2021 growth forecast. (REU)

Economy | The grocery price shock is coming to a store near you. (BBG)

Economy | APAC growth outlooks diverge amid COVID recovery. (Fitch)

What People Are Saying

Innovation And Emerging Trends

Markets | Beijing to crack down on home buying in a famous district. (BBG)

FinTech | Ant Group reveals crypto partnership history with the PBOC. (SCMP)

FinTech | It is a dangerous time to get caught up in the fintech frenzy. (FT)

Recovery | ‘We are drowning in insecurity’: young people after COVID. (FT

About

Renato founded Physik Invest after going through years of self-education, strategy development, and trial-and-error. His work reporting in the finance and technology space, interviewing leaders such as John Chambers, founder, and CEO, JC2 Ventures, Kevin O’Leary, Canadian businessman and Shark Tank host, Catherine Wood, CEO and CIO, ARK Invest, among others, afforded him the perspective and know-how very few come by.

Having worked in engineering and majored in economics, Renato is very detailed and analytical. His approach to the markets isn’t built on hope or guessing. Instead, he leverages the unique dynamics of time and volatility to efficiently act on opportunity.

 Disclaimer

At this time, Physik Invest does not manage outside capital and is not licensed. In no way should the materials herein be construed as advice. Derivatives carry a substantial risk of loss. All content is for informational purposes only.
Categories
Commentary

Market Commentary For The Week Ahead: ‘Green Shoots’

Notice: Physik Invest’s daily market commentaries will be suspended until further notice.

Please accept our apologies for the inconvenience, thank you for the support, and see you next week!

Key Takeaways:

What Happened: U.S. stock index futures closed lower, last week.

What Does It Mean: Heading into last week’s Federal Reserve policy update, stock index futures were in balanced, two-sided trade as participants looked for more information to base their next move. 

Then, Federal Reserve Chairman Jerome Powell discussed his organization’s commitment to an inclusive recovery. At the same time, the central bank announced it expects real GDP to grow 6.5% and inflation to rise as high as 2.4% this year.

The comments were immediately followed by a vertical price rise.

Thereafter, participants that caused the vertical price rise traded out, evidenced by the index trading lower into Friday’s derivative expiry.

Important to note is that despite the attempted pricing in of rising debt levels and inflation, a divergence in bond and equity market volatility persists. Historically, fear across markets tends to move in tandem. That hasn’t been the case for a number of weeks, now (e.g., Graphic 1).

Graphic 1: Divergence in volatility across the bond and equity market. 

What To Expect: Directional resolve.

Why? The passage of a large derivative expiry, the resolve of the vertical price range that occurred in the face of Federal Reserve policy updates, as well as market liquidity metrics suggesting opportunistic buying or short covering into weakness, and increased buying pressure (as witnessed through measures like DIX and options activity).

More On DIX: For every buyer is a seller (usually a market maker). Using DIX — which is derived from short sales (i.e., liquidity provision on the market making side) — we can measure buying pressure.

More On Option Expiration (OPEX): Option expiries mark an end to pinning (i.e, the theory that market makers and institutions short options move stocks to the point where the greatest dollar value of contracts will expire worthless) and the reduction dealer gamma exposure.
Graphic 2: Physik Invest maps out the purchase of call and put options in the SPDR S&P 500 ETF Trust (NYSE: SPY), for the week ending March 19, 2021. Activity in the options market was primarily concentrated in short- and long-dated tenors, in strikes as high as $435, which corresponds with $4,350.00 in the cash-settled S&P 500 Index (INDEX: SPX).
Graphic 3: Index option traders add to call buying and put selling, a bullish dynamic. 

What To Do: In the coming sessions, participants will want to pay attention to the VWAP anchored from the $3,978.50 overnight rally-high, as well as the high-volume area (HVNode) near $3,900.00.

Volume-Weighted Average Prices (VWAPs): Metrics highly regarded by chief investment officers, among other participants, for quality of trade. Additionally, liquidity algorithms are benchmarked and programmed to buy and sell around VWAPs.

More On Volume Areas: A structurally sound market will build on past areas of high-volume (HVNode). Should the market trend for long periods of time, it will lack sound structure (identified as a low-volume area (LVNode) which denotes directional conviction and ought to offer support on any test). 

If participants were to auction and find acceptance into areas of prior low-volume, then future discovery ought to be volatile and quick as participants look to areas of high-volume for favorable entry or exit.

More On Overnight Rally Highs (Lows): Typically, there is a low historical probability associated with overnight rally-highs (lows) ending the upside (downside) discovery process.

In the best case, the S&P 500 remains above the $3,900.00 volume area, and VWAP anchored from the $3,978.50 peak, taking out Friday’s minimal excess high. This would suggest buyers, on average, are in control and winning since the March 17 rally-high.

More On Excess: A proper end to price discovery; the market travels too far while advertising prices. Responsive, other-timeframe (OTF) participants aggressively enter the market, leaving tails or gaps which denote unfair prices.

Any activity below the VWAP anchored from the $3,978.50 peak may (1) leave the $3,900.00 HVNode as an area of supply, offering initiative sellers favorable entry and responsive buyers favorable exit.

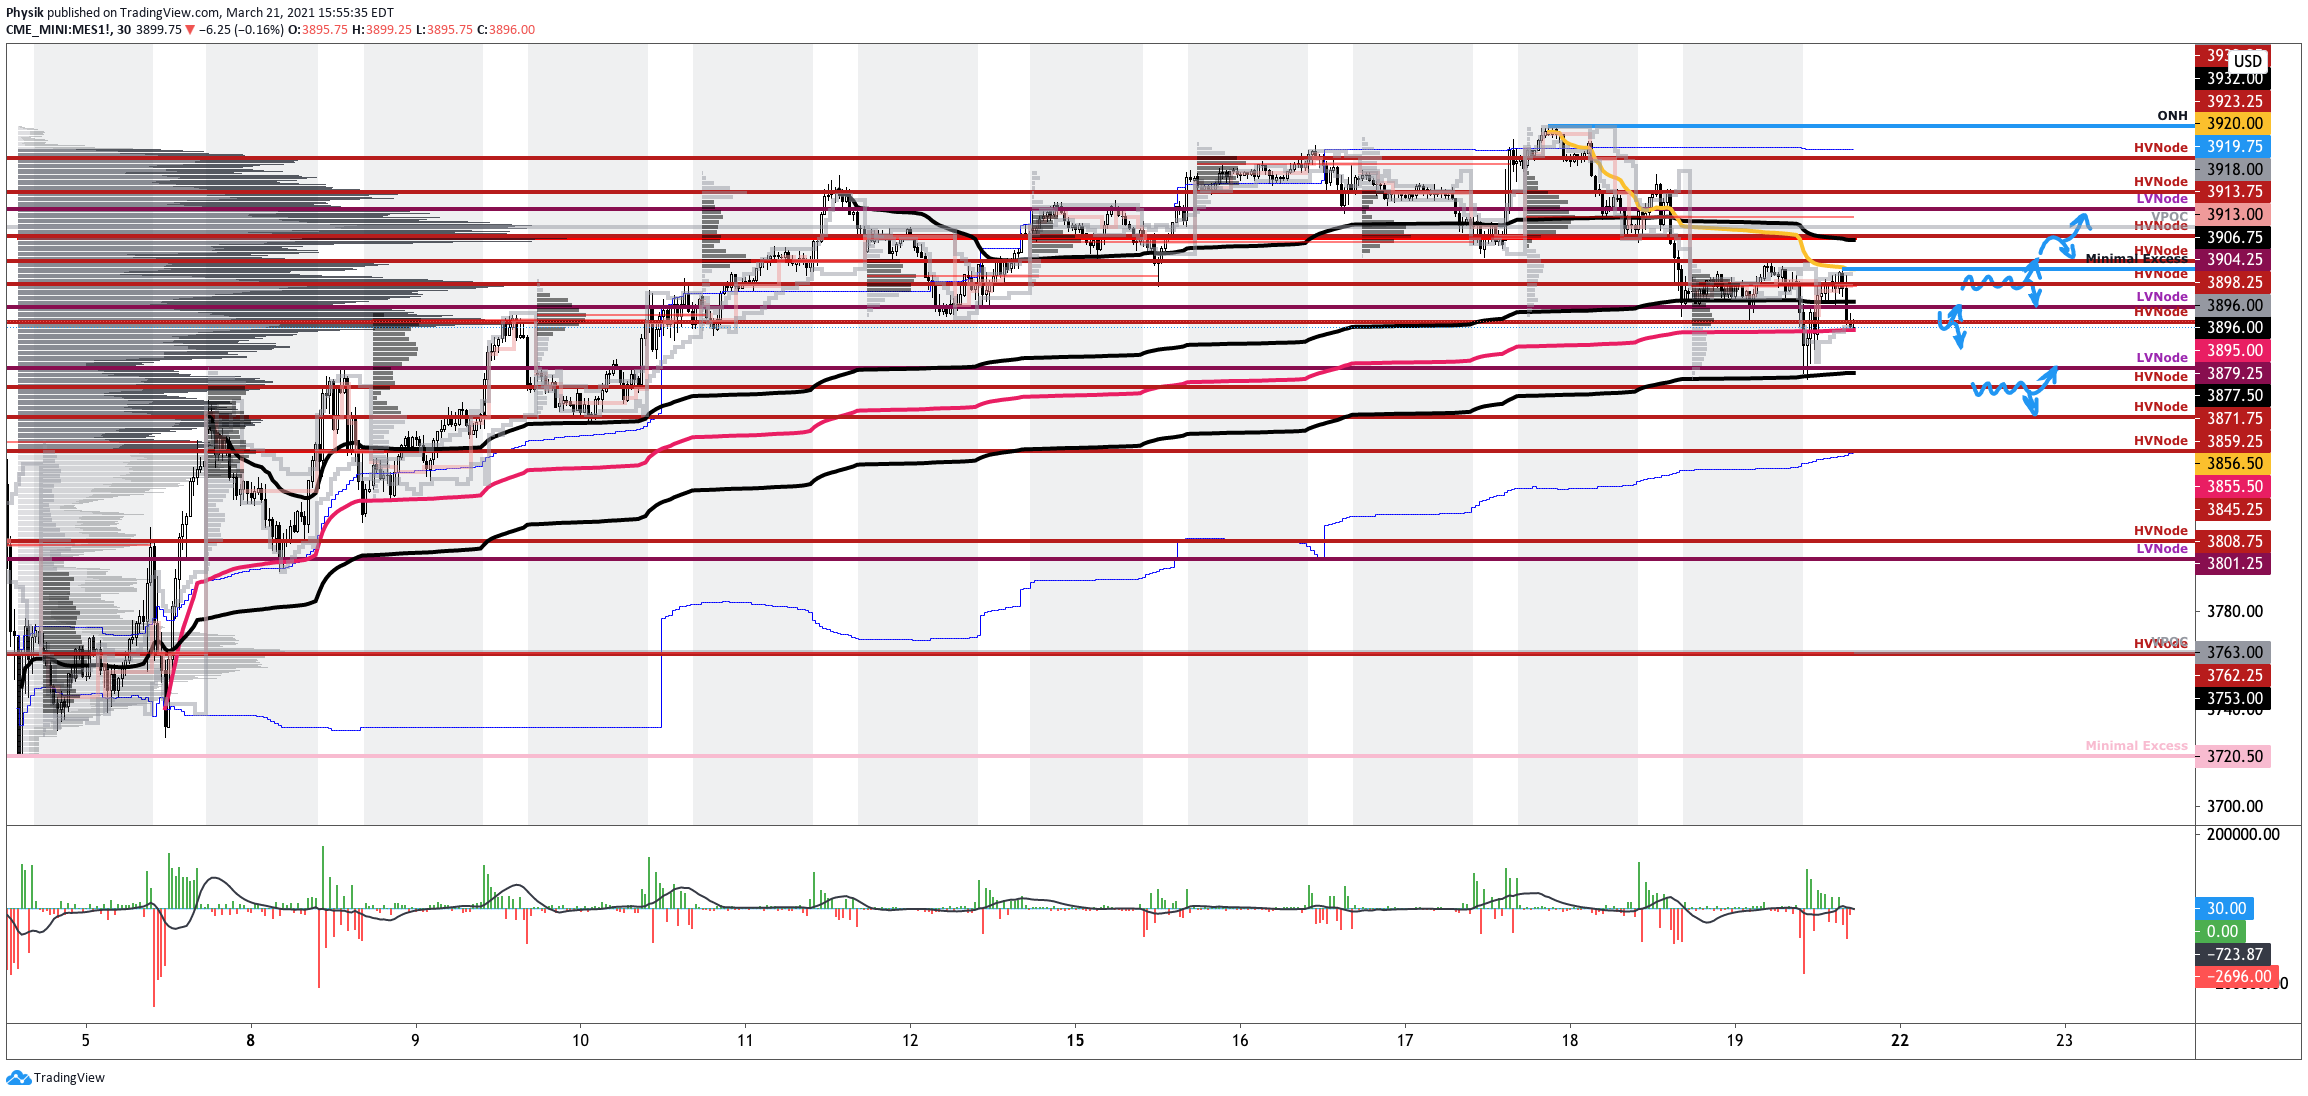
Graphic 4: Profile overlays on a 30-minute candlestick chart of the Micro E-mini S&P 500 Futures.
Graphic 5: 4-hour profile chart of the Micro E-mini S&P 500 Futures.

Conclusions: The go/no-go level for next week’s trade is $3,900.00.

Any activity at this level suggests market participants are looking for more information to base their next move. Anything above (below) this level increases the potential for higher (lower).

Levels Of Interest: $3,900.00 HVNode.

Photo by Ylanite Koppens from Pexels.

Categories
Commentary

Market Commentary For 3/17/2021

Notice: To view this week’s big picture outlook, click here.

What Happened: U.S. stock index futures liquidated as investors weighed the implications of rising yields ahead of outcomes on a U.S. Federal Reserve policy meeting.

What Does It Mean: Heading into Wednesday’s session, which ought to be volatile as participants position themselves in response to new economic projections, responsive trade is the course of action.

This notion is supported by market liquidity metrics, which suggest buying pressure is leveling out, and options activity, which points to a build in interest at the $4,000 S&P 500 level, ahead of Friday’s monthly option expiration (OPEX).

More On Option Expiration (OPEX): Option expiries mark an end to pinning (i.e, the theory that market makers and institutions short options move stocks to the point where the greatest dollar value of contracts will expire worthless) and the reduction dealer gamma exposure.

What To Expect: Wednesday’s regular session (9:30 AM – 4:00 PM ET) will likely open just outside of prior-range and -value, suggesting a limited potential for immediate directional opportunity.

During Tuesday’s trade, participants established minimal excess at a new all-time rally-high before auctioning the S&P 500 below its $3,947.75 spike base, negating the bullishness of Monday’s end-of-day trade.

More On Spikes: Spike’s mark the beginning of a break from value. Spikes higher (lower) are validated by trade at or above (below) the spike base (i.e., the origin of the spike).

Excess: A proper end to price discovery; the market travels too far while advertising prices. Responsive, other-timeframe (OTF) participants aggressively enter the market, leaving tails or gaps which denote unfair prices.

For today, participants can trade from the following frameworks.

In the best case, the S&P 500 finds acceptance (i.e., resolves higher or sideways), above the $3,931.00 Virgin Point of Control (VPOC). In the worst case, the S&P 500 finds acceptance (i.e., resolves lower or sideways) below the $3,931.00 VPOC.

In case of higher prices, participants may look to auction as high as the $3,948.00 VPOC and $3,970.75 rally-high. In case of lower prices, participants can look to the $3,904.25 low-volume area (LVNode) for a response.

More On Volume Areas: A structurally sound market will build on past areas of high-volume. Should the market trend for long periods of time, it will lack sound structure (identified as a low-volume area which denotes directional conviction and ought to offer support on any test). 

If participants were to auction and find acceptance into areas of prior low-volume, then future discovery ought to be volatile and quick as participants look to areas of high-volume for favorable entry or exit.

More On POCs: POCs (like HVNodes described above) are valuable as they denote areas where two-sided trade was most prevalent. Participants will respond to future tests of value as they offer favorable entry and exit.

Levels Of Interest: $3,931.00 VPOC.

Profile overlays on a 15-minute candlestick chart of the Micro E-mini S&P 500 Futures.
Categories
Commentary

Market Commentary For The Week Ahead: ‘The Flow Won’

Key Takeaways:

What Happened: Amid a volatile, news-heavy week, after a slew of earnings reports by heavily weighted index constituents, and an FOMC meeting that made no change to existing monetary policy, financial markets experienced a rapid de-risking, similar to what transpired prior to the sell-off in February 2020.

What Does It Mean: After extending the S&P 500’s rally, as well as establishing acceptance near the $3,850.00 price extension, an upside target, and excess (i.e., a proper end to price discovery), participants auctioned back into range, repairing poor structures left in the wake of initiative buying.

The action found acceptance below the $3,824.00 – $3,763.75 balance-area, invalidating the prior week’s break-out to new highs.

Since then, market participants were witness to violent two-sided trade, a result of the market transitioning into a short-gamma environment (Graphic 1).

In such case dealers hedge derivatives exposure by buying into strength and selling into weakness. This, will exacerbate volatility.

Graphic 1: SpotGamma data suggests S&P 500 has entered short-gamma environment

In a conversation for a Benzinga article to be released this coming week, I spoke with Kris Sidial, co-chief investment officer at The Ambrus Group, a volatility arbitrage fund, regarding GameStop Corporation (NYSE: GME) share price volatility, market microstructure, and regulation.

According to Sidial, the dynamics that transpired in GameStop can be traced back to factors like Federal Reserve stabilization efforts, and low rates, which incentivize risk taking (see Graphic 2).

“The growth of structured products, passive investing, the regulatory standpoint that’s been implemented with Dodd-Frank and dealers needing to hedge off their risk more frequently, than not,” are all part of a regime change that’s affected the stability of markets, Sidial notes. 

“These dislocations happen quite frequently in small windows, and it offers the potential for large outlier events,” like the equity bust and boom during 2020. “Strength and fragility are two completely different components. The market could be strong, but fragile.”

The aforementioned regime change is one in which dealer exposure to direction and volatility promotes crash up and down dynamics. Last February, the market was heavily one-sided with participants, like target date funds (e.g., mutual funds), selling far out-of-the-money puts on the S&P 500 for passive yield, and investors buying-to-open put options in an increasing amount for downside exposure, thus exacerbating volatility. 

Graphic 2: Newfound Research unpacks market drivers, implications of liquidity.
Graphic 3: SqueezeMetrics highlights implications of volatility, direction, and moneyness.

Last week, per Graphic 4, the SPDR S&P 500 ETF Trust, the largest ETF that tracks the S&P 500, saw a rise in purchases of downside protection with time, which will likely lead to an increase in implied volatility and sensitivity of options to changes in underlying price.

These risks will be hedged off by dealers selling into weakness (see Graphic 3), thereby exacerbating downside volatility.

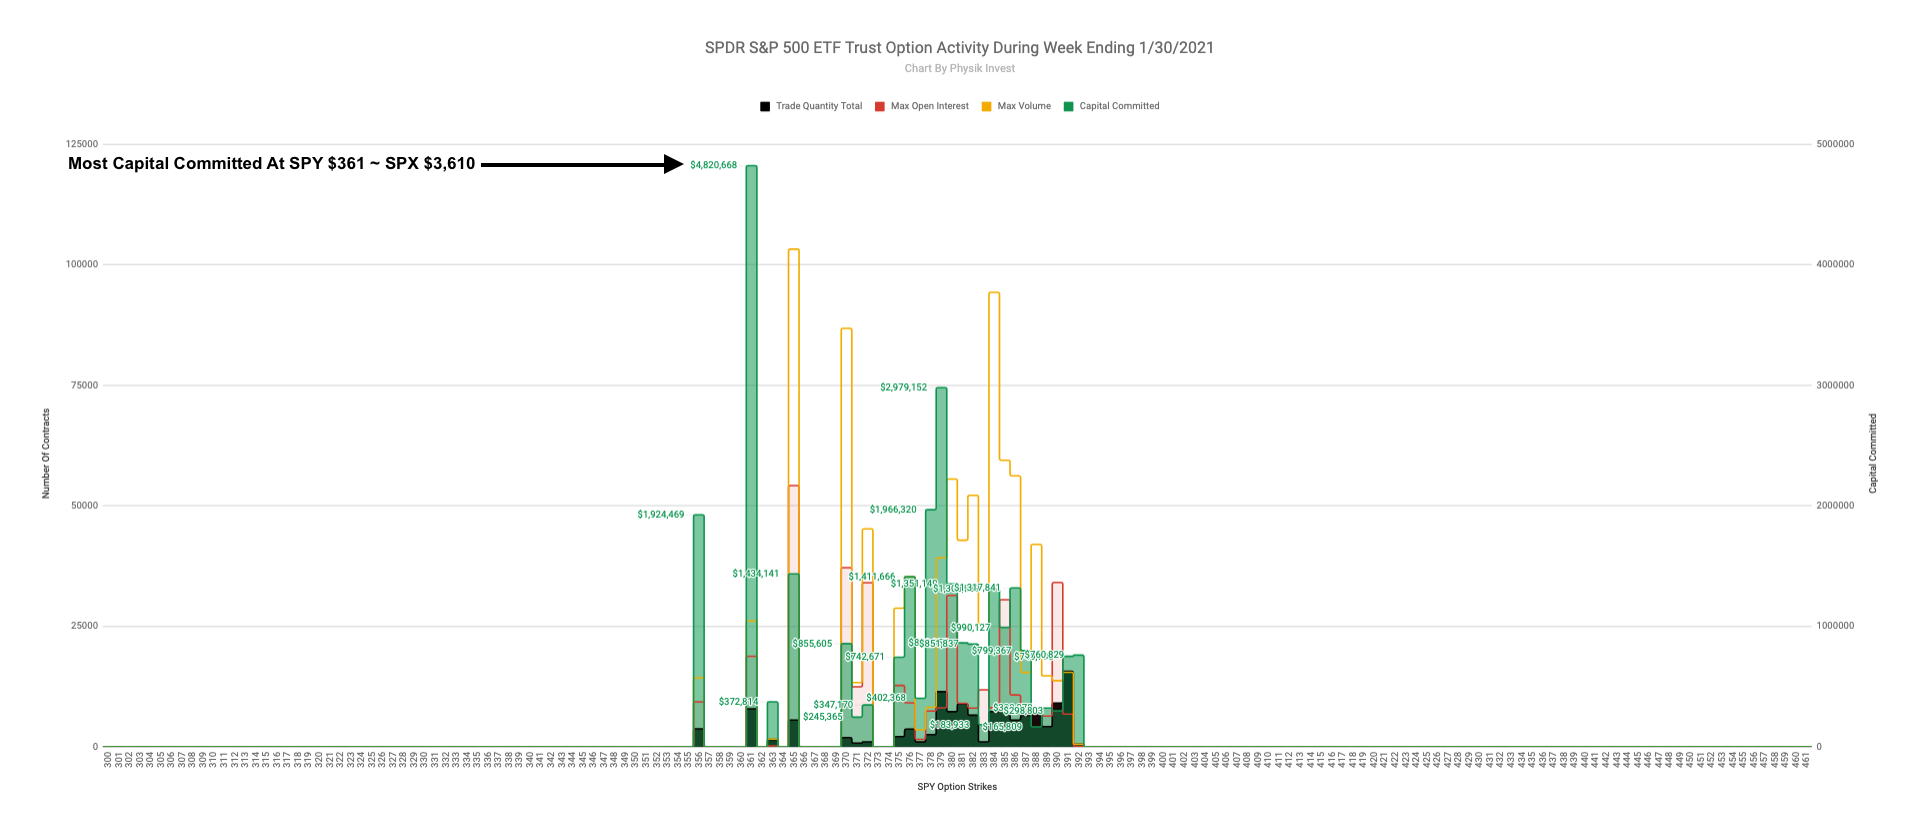
Graphic 4: Physik Invest maps out the purchase of call and put options in the SPDR S&P 500 ETF Trust, for the week ending January 30, 2021.

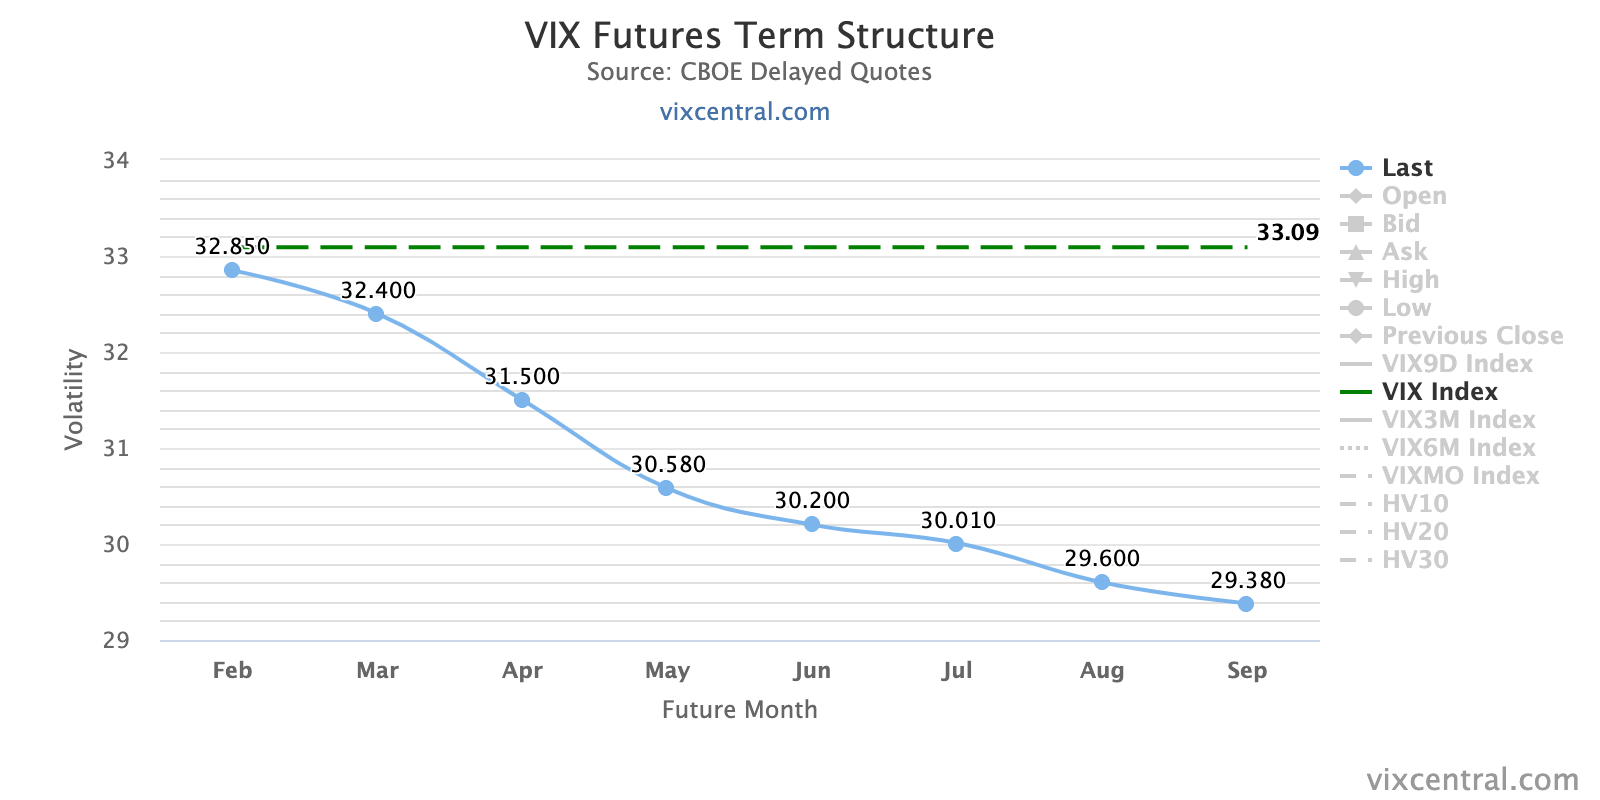
The activity was most concentrated in put options with a strike price of $361, corresponding with $3,610 in the cash-settled S&P 500 Index (INDEX: SPX). This, alongside the market’s entry into short gamma, and an inversion of the VIX futures term structure (see Graphic 5), in which longer-dated VIX expiries are less expensive, is a warning of elevated near-term risks for equity market stability.

Graphic 5: VIX Futures Term Structure per vixcentral.com.

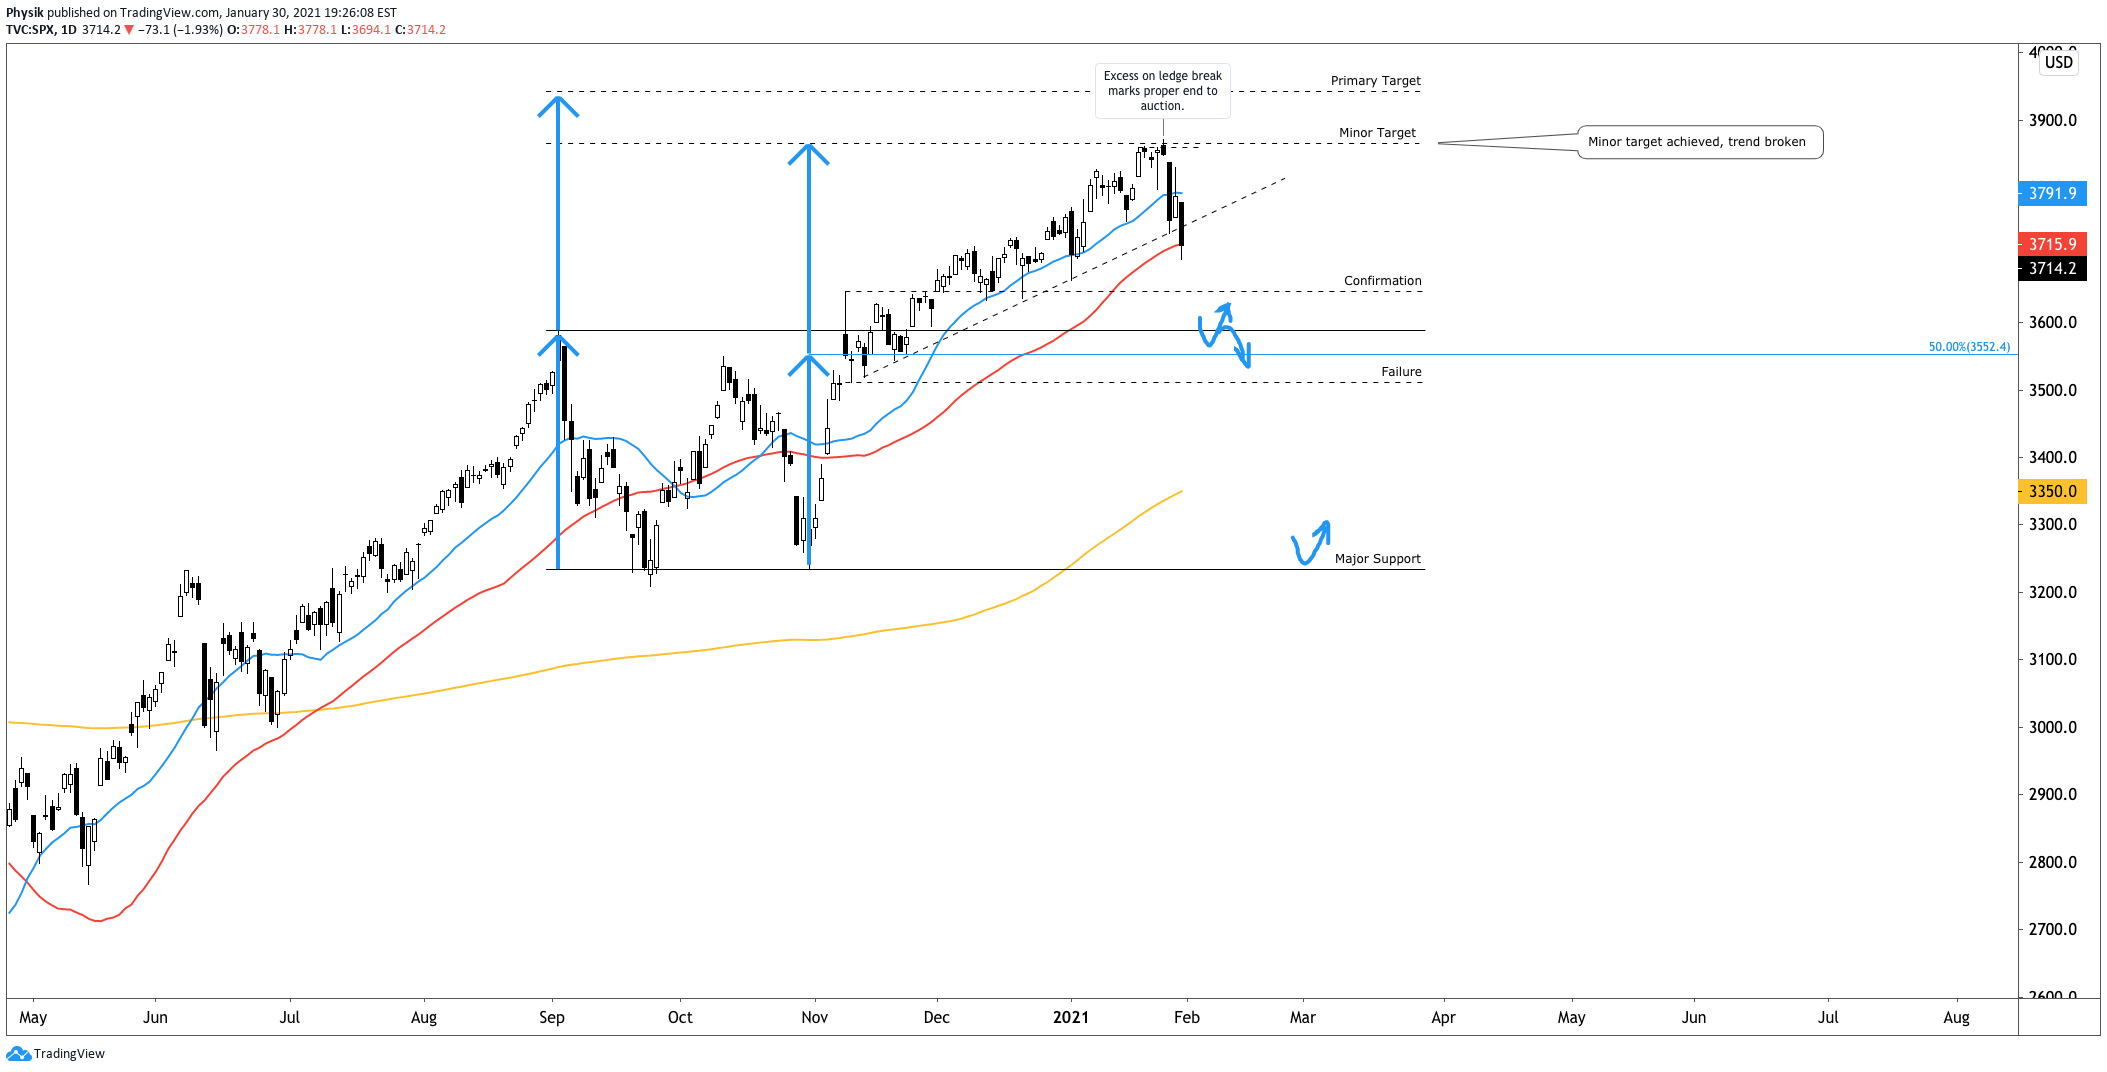
What’s more? Aside from breaking technical trend (Graphic 6) is DIX, a proxy for buying derived from short sales (i.e., liquidity provision on the market making side) declining, and the presence of divergent speculative flows and delta (e.g., non-committed buying as measured by volume delta).

Graphic 6: Cash-settled S&P 500 Index experiences technical breakdown.
Graphic 7: DIX by SqueezeMetrics suggests large divergence between price and buying on January 27.
Graphic 8: Divergent Delta in the SPDR S&P 500 ETF (NYSE: SPY), the largest ETF that tracks the S&P 500.

What To Expect: In light of the technical breakdown U.S. stock indexes are best positioned for downside discovery.

As a result, participants ought to zoom out, and look for valuable areas to transact.

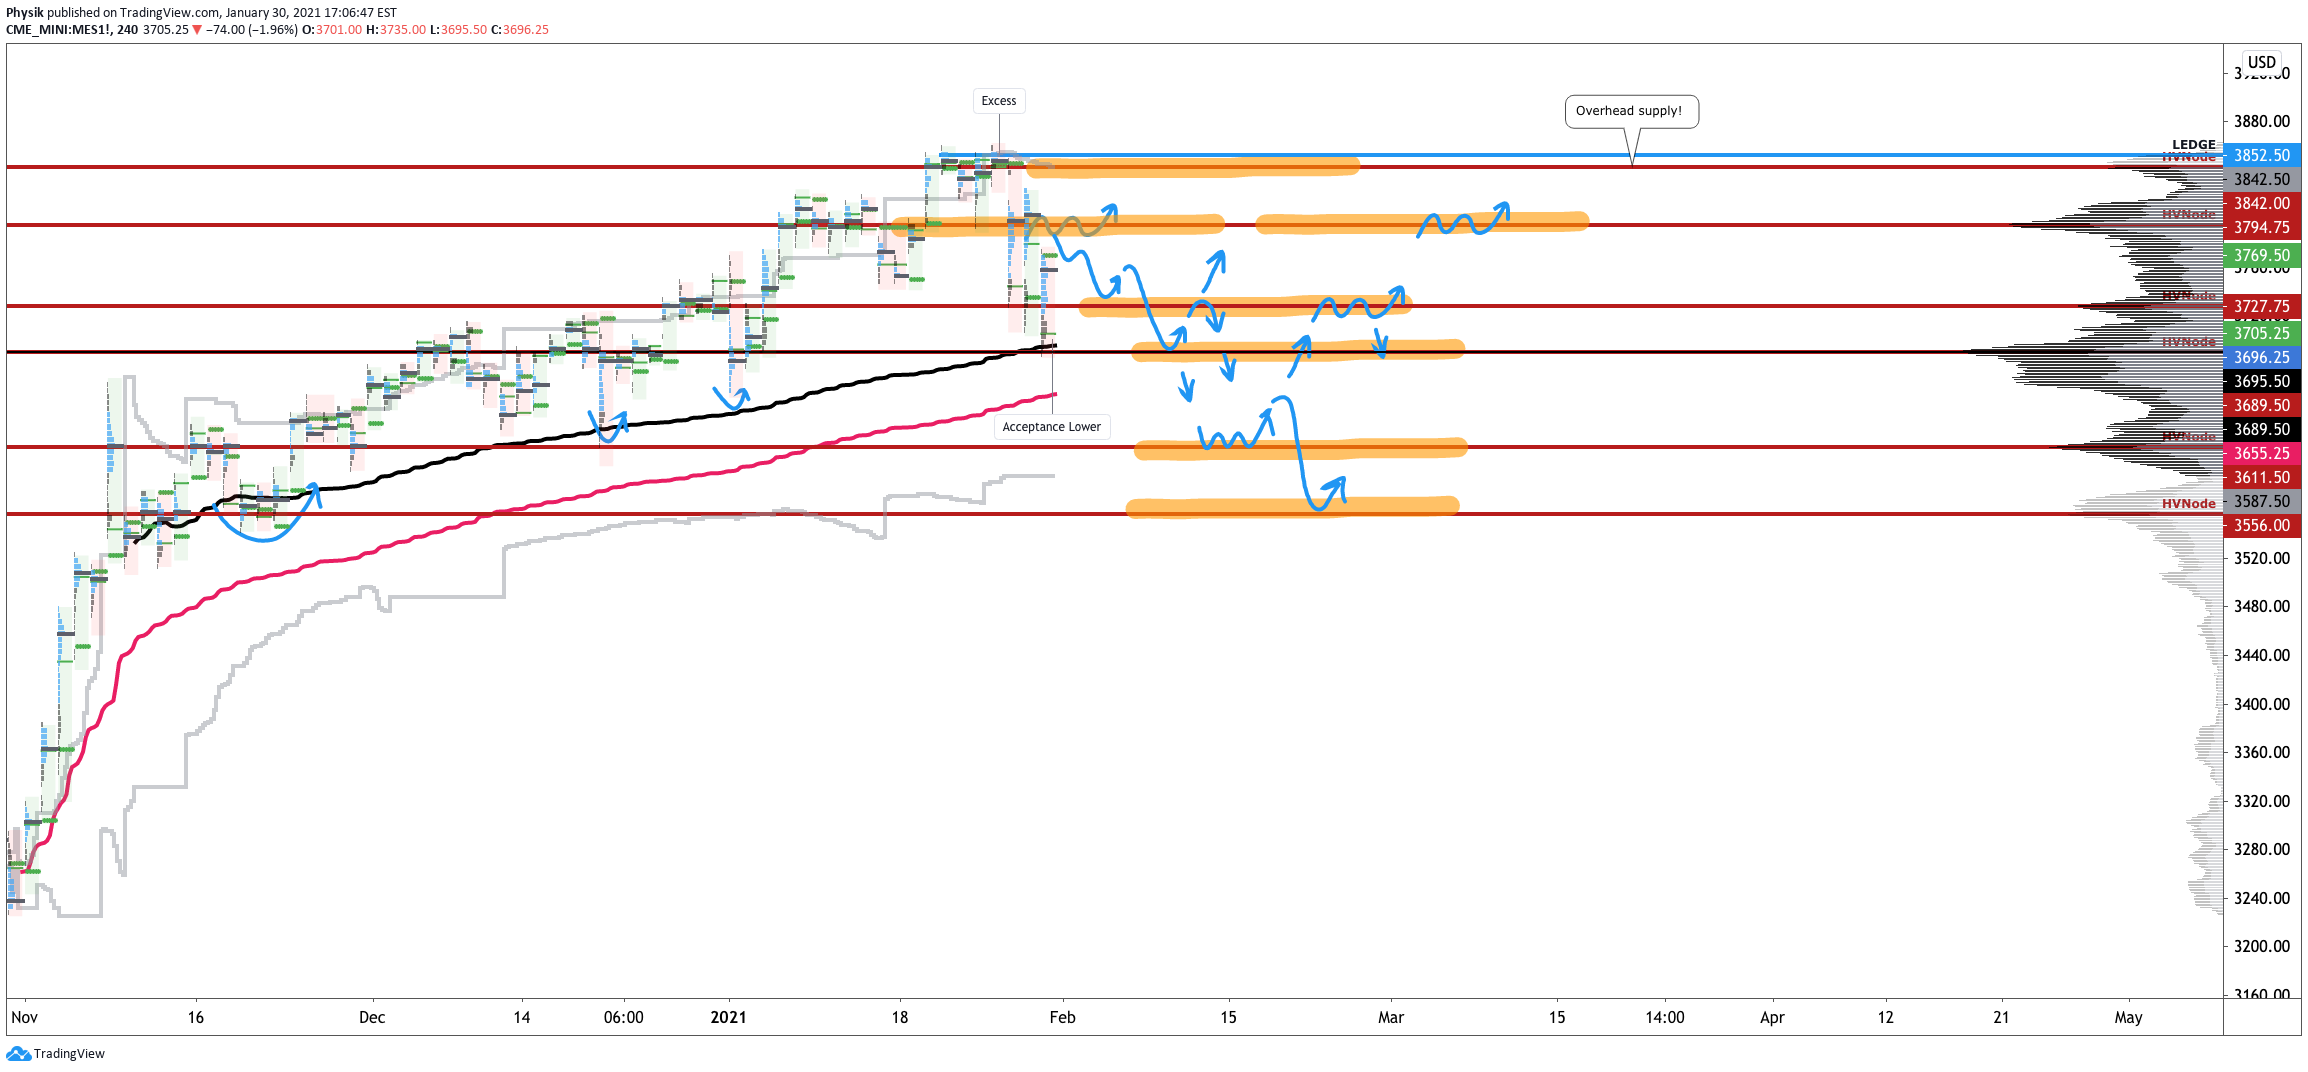
Graphic 9: 4-hour profile chart of the Micro E-mini S&P 500 Futures.

In Graphic 9, the highlighted zones denote high-volume areas (HVNodes), which can be thought of as building blocks.

A structurally sound market will build on past areas of high-volume. Should the market trend for long periods of time, it will lack sound structure (identified as a low-volume area which denotes directional conviction and ought to offer support on any test). 

If participants were to auction and find acceptance into areas of prior low-volume, as they have in the week prior, then future discovery ought to be volatile and quick as participants look to areas of value for favorable entry or exit.

Additionally, it’s important to remember what the market’s long-term trajectory is: up.

Late last year, JPMorgan Chase & Co. (NYSE: JPM) strategist Marko Kolanovic suggested equities would rally short-term with the S&P 500 auctioning as high as $4,000 on the basis of low rates, improved fundamentals, buybacks, as well as systematic and hedge fund strategies. Since then, Kolanovic has downgraded growth and suggested the limited potential for further upside despite odds of a sustained economic recovery.

Note, Kolanovic has not called for an implosion in equity markets. Instead, the market is due for some downside discovery given a moderation in the recovery.

Given the above dynamics, the following frameworks apply for next week’s trade.

In the best case, the S&P 500 takes back Friday’s liquidation and auctions above the $3,727.75 HVNode. Expectations thereafter include continued balance.

In the worst case, any break that finds increased involvement (i.e., supportive flows and delta) below the $3,689.50 HVNode, would favor continuation as low as the $3,611.50 and $3,556.00 HVNodes. Note that the second to last HVNode corresponds with the $361 SPY put concentration, which may serve as a near-term target, or bottom, for this sell-off, given last week’s activity at that strike.

Graphic 10: Profile overlays on a 15-minute candlestick chart of the Micro E-mini S&P 500 Futures.

Conclusions: Participants ought to look for favorable areas to transact, such as those highlighted areas in the S&P 500, featured in Graphic 9.

Big picture, the sell-off ought to be bought, just not yet. Per Graphic 11, euphoria is still too high.

Graphic 11: Bank of America Corporation (NYSE: BAC) sentiment indicators.

Levels Of Interest: $3,727.75, $3,689.50, $3,611.50 and $3,556.00 HVNodes.

Cover photo by Pixabay from Pexels.

Categories
Commentary

Market Commentary For 1/27/2021

Notice: To view this week’s big picture outlook, click here.

What Happened: After a failure to resolve higher, ahead of the Federal Reserve’s policy decision and earning reports by mega-cap stocks, U.S. index futures sold heavy overnight.

What Does It Mean: During Tuesday’s regular trade in the S&P 500, market participants were unable to maintain prices above the $3,852.50 ledge, increasing confidence among responsive sellers.

Graphic 1: Internally, it appears that the market is running out of steam.

What To Expect: Wednesday’s regular session (9:30 AM – 4:00 PM ET) will likely open on a gap, outside of prior-balance and -range, suggesting the potential for immediate directional opportunity.

Given that the market failed to drum up initiative buying after an upside break of the $3,852.50 ledge, in addition to profile structures denoting the presence of excess (which forms after an auction has traveled too far in a particular direction and portends sustained reversal) participants can expect increased confidence among responsive sellers.

Therefore, attention moves to the $3,824.00 – $3,763.75 balance-area.

Balance-areas denote range-bound trade. The longer participants spend time transacting within a narrow range of prices, the more valuable those prices become. Should the market initiate out of balance and return, participants left out in the move will respond as the area offers favorable entry.

Re-entry into the balance-area may portend further downside participation, as low as the $3,763.75 boundary. Participants should keep in mind that the area is valuable and will be the site of responsive buying. The near-term bullish narrative remains intact, as long as participants maintain prices above the $3,763.75 boundary. Trade beneath $3,763.75 would be the most negative outcome and may portend further downside discovery, as low as the $3,727.75 high-volume node (HVNode), a favorable area to transact in the past.

The go/no-go for upside is the $3,824.00 balance-area boundary. The go/no-go for downside is $3,763.75 balance-area boundary.

Above $3,824.00 puts in play the $3,852.50 ledge. Below $3,763.75, participants ought to look to the $3,727.75 HVNode.

Levels Of Interest: $3,852.50 ledge, $3,824.00 balance-area high, $3,763.75 balance-area low, $3,727.75 HVNode.