Equity index futures trade higher ahead of key fundamental events.
ECB comments, COVID, geopolitics.
Ahead: Trade data, FOMC, earnings.
Mixed bag. No follow-through lower.
What Happened: U.S. stock index futures auctioned sideways to higher ahead of some key fundamental developments.
In addition to the 8:30 AM release on advance trade in goods, as well as key earnings from heavily-weighted index constituents like Facebook Inc (NASDAQ: FB), participants will look to also price in the 2:00 PM ET Federal Open Market Committee (FOMC) announcement and Fed Chair Jerome Powell’s press conference.
As stated in the Weekly Brief, the U.S. is in a different place from the rest of the world and is likely to eliminate its output gap this year which would call for a tightening in policy and dollar strengthening, helping douse inflation.
Moody’s strategists note: “The impressive growth in value across many asset classes is projected to taper off within the next couple of years as supportive policy is unwound. The 10-year Treasury yield will rise above 2% by 2022 and the fiscal tailwinds will also have faded by then.”
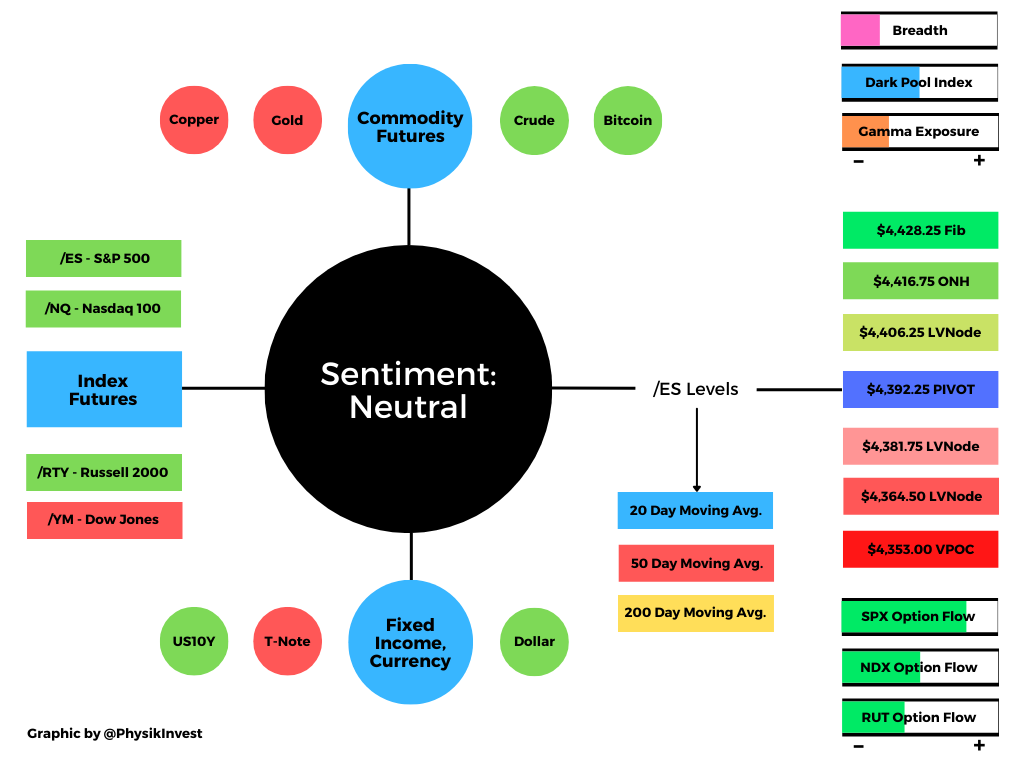
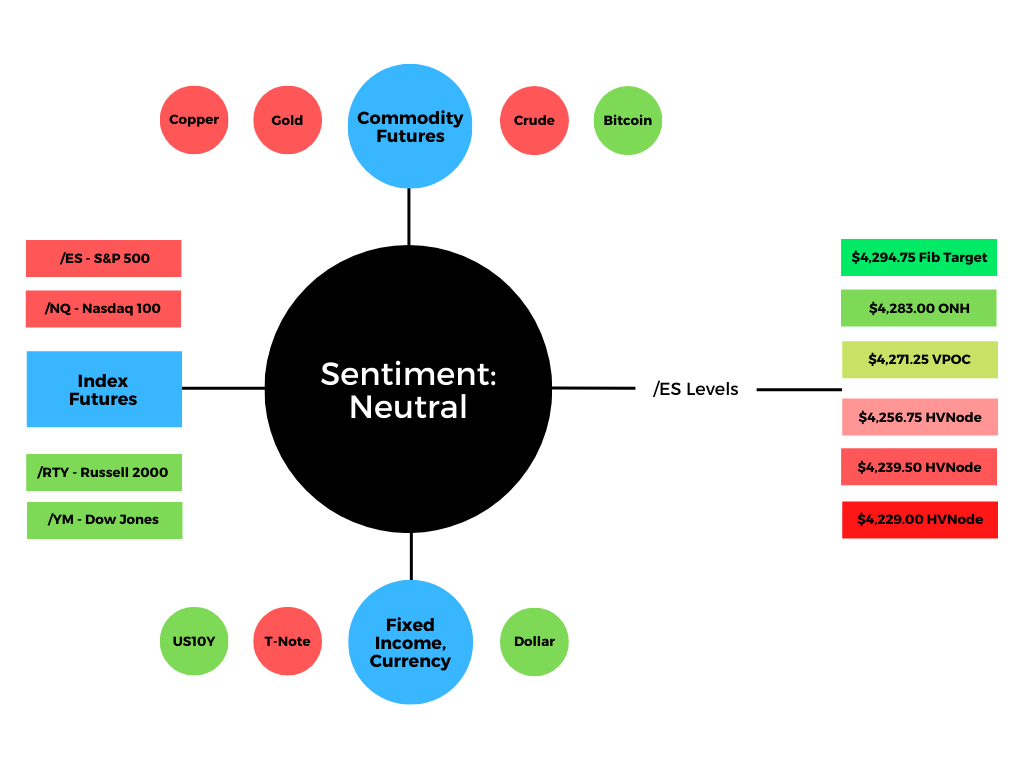
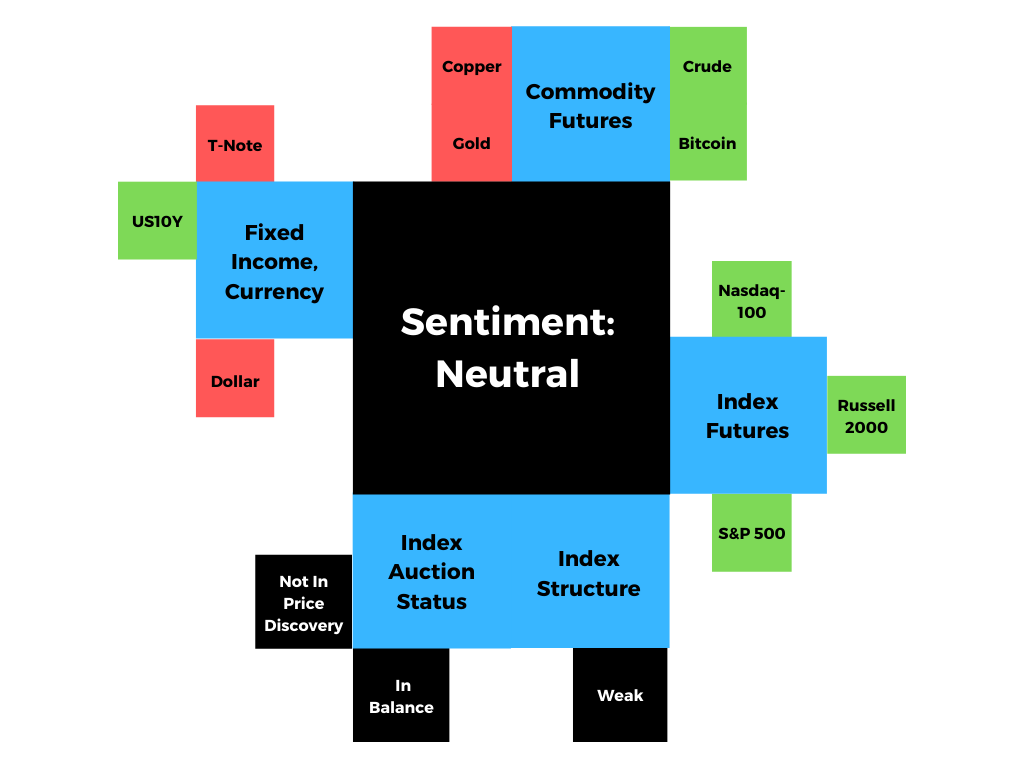
Graphic updated 7:00 AM ET. Sentiment Neutral if expected /ES open is inside of the prior day’s range. See here for more on the Dark Pool Index and Gamma. A positive Dark Pool Index reading is bullish. At the same time, the higher (lower) the gamma, the less (more) volatility. SHIFT Search data used for options activity. Note that options flow is sorted by the call premium spent; if green and more (less) positive then more (less) was spent on call options. Breadth reflects a reading of the prior day’s Advance/Decline indicator.
What To Expect: As of 7:00 AM ET, Wednesday’s regular session (9:30 AM – 4:00 PM EST) in the S&P 500 will likely open inside of prior-range and -value, suggesting a limited potential for immediate directional opportunity.
Adding, during Tuesday’s volatile trade, the best case outcome occurred, evidenced by the S&P 500’s trade above a developing Volume Weighted Average Price (VWAP) pinch. This suggests the average buyer since the overnight high – $4,416.76 ONH – is in a winning position.
Overnight Rally Highs (Lows): Typically, there is a low historical probability associated with overnight rally-highs (lows) ending the upside (downside) discovery process.
Moving on, it’s important to take note of some topline and internal divergences.
After establishing the new ONH, weakness in China spilled over; U.S. equity index futures, led by the Russell 2000 and Nasdaq 100 sold fast and heavy up until the Nasdaq 100 found responsive buyers at a key technical level – the 20-day simple moving average – that corresponded with a thick base of resting liquidity. After, the entire market reversed and closed in range.
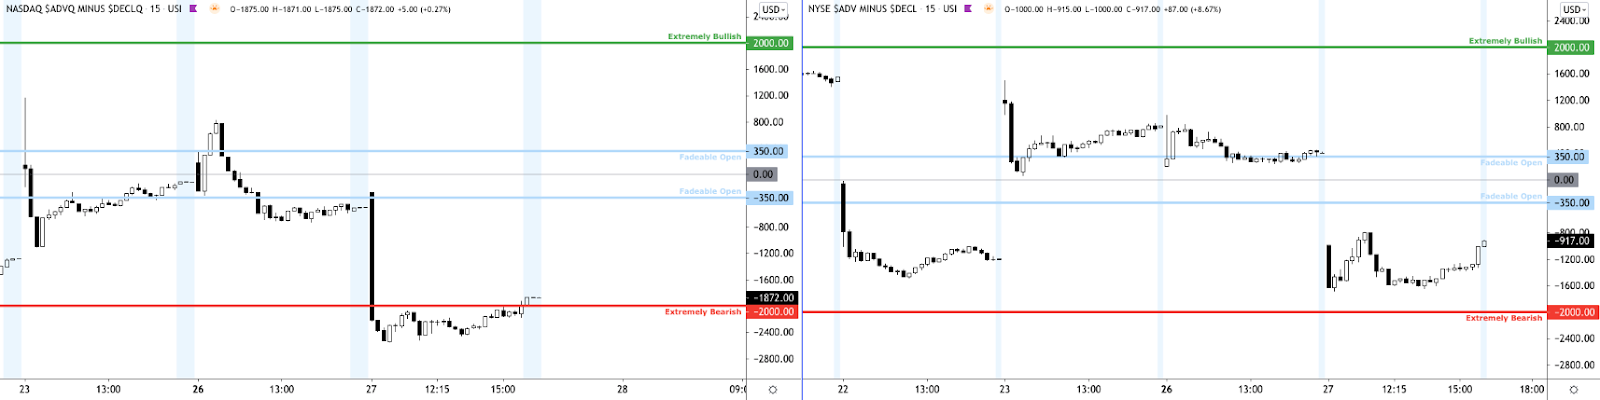
In terms of internal divergences, breadth was significantly weaker on the Nasdaq side.
Graphic: Equity indexes traded lower as internal metrics – like the ratio of advancers to decliners – weakened.
Given the technical context, for today, participants can trade from the following frameworks.
In the best case, the S&P 500 trades sideways or higher; activity above the $4,392.25 high volume area (HVNode) pivot likely puts in play the $4,406.25 low volume area (LVNode). Trade beyond the LVNode could reach as high as the $4,416.75 ONH and $4,428.25 Fibonacci extension.
In the worst case, the S&P 500 trades lower; activity below the $4,392.25 HVNode pivot likely puts in play the $4,381.75 LVNode. Trade beyond the $4,381.75 figure could reach as low as the $4,364.50 LVNode and $4,353.00 untested Point of Control (VPOC).
Volume Areas: A structurally sound market will build on past areas of high volume. Should the market trend for long periods of time, it will lack sound structure (identified as a low volume area which denotes directional conviction and ought to offer support on any test).

If participants were to auction and find acceptance into areas of prior low volume, then future discovery ought to be volatile and quick as participants look to areas of high volume for favorable entry or exit.

POCs: POCs are valuable as they denote areas where two-sided trade was most prevalent. Participants will respond to future tests of value as they offer favorable entry and exit.
Graphic: 65-minute profile chart of the Micro E-mini S&P 500 Futures. Graphic updated 6:55 AM ET.
American job market optimism reached 21-year high.
What People Are Saying
Equity vol MMs Inventorying small amounts of short dated Chinese right tail gamma to sell out when the inevitable bullish headlines come out and the shorts that piled on look to exit at the exact same time pic.twitter.com/3ag1FGg5hg
725 now pretty important to me in #NQ_F this week. We are in “ping pong” land between 5 & 20D value (great place to sell ICs or Strangles) and heading toward last week’s VPOC at 725..expecting a bounce. Qs are further defining a broader balancing range. pic.twitter.com/CnfPq8AWlE
When talking about capital efficiency, I often get asked, “why not just hold a smaller position in longer duration bonds?”
The answer, as I see it, is that it’s a sub-optimal risk/reward trade-off (in this environment) versus levered shorter-duration exposure. pic.twitter.com/GMycglG9N8
After years of self-education, strategy development, and trial-and-error, Renato Leonard Capelj began trading full-time and founded Physik Invest to detail his methods, research, and performance in the markets. Additionally, Capelj is a finance and technology reporter. Some of his biggest works include interviews with leaders such as John Chambers, founder and CEO, JC2 Ventures, Kevin O’Leary, businessman and Shark Tank host, Catherine Wood, CEO and CIO, ARK Invest, among others.
Disclaimer
At this time, Physik Invest does not manage outside capital and is not licensed. In no way should the materials herein be construed as advice. Derivatives carry a substantial risk of loss. All content is for informational purposes only.
Equity index futures explore lower prices, widening a developing balance area.
Traders edgy over virus variant, Fed action.
Ahead is data on jobs and consumer credit.
Internal divergence resolved in lower prices.
What Happened: U.S. stock index futures liquidated as participants sought to price in anxieties surrounding the spread of COVID-19 variants as well as an evolution in monetary policy.
“Worries about variant strains have hurt investor confidence that the pandemic’s effects on the global economy are truly past us,” Nicholas Colas and Jessica Rabe of DataTrek Research wrote in a note cited by Bloomberg. “Our working theory is that we’re in the middle of a modest global growth scare.”
Today, also, participants get data on initial and continued jobless claims, as well as consumer credit.
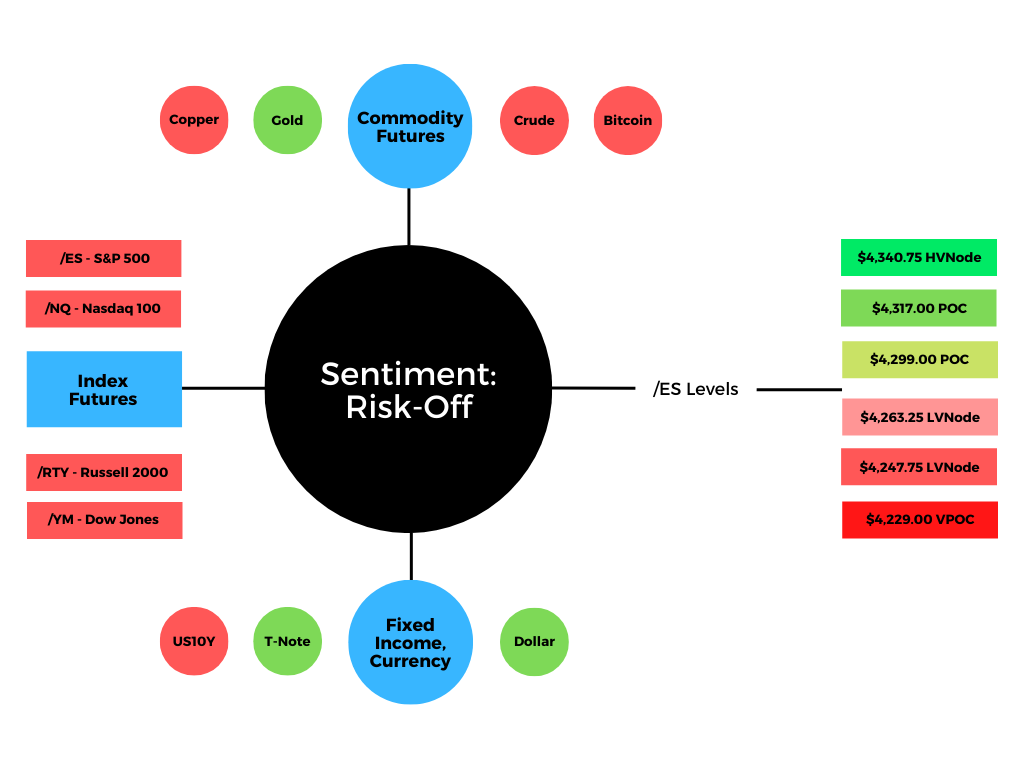
Graphic updated 6:58 AM ET.
What To Expect: Thursday’s regular session (9:30 AM – 4:00 PM EST) in the S&P 500 will likely open outside of prior-range and -value, suggesting a potential for immediate directional opportunity. Balance-break and gap scenarios are in play.
Balance-Break and/or Gap Scenarios: Monitor for acceptance (i.e., more than 1-hour of trade) outside of the balance area.

Gaps ought to fill quickly. Should they not, that’s a signal of strength; do not fade. Leaving value behind on a gap-fill or failing to fill a gap (i.e., remaining outside of the prior session’s range) is a go-with indicator.

Auctioning and spending at least 1-hour of trade back in the prior range suggests a lack of conviction; in such a case, do not follow the direction of the most recent initiative activity.
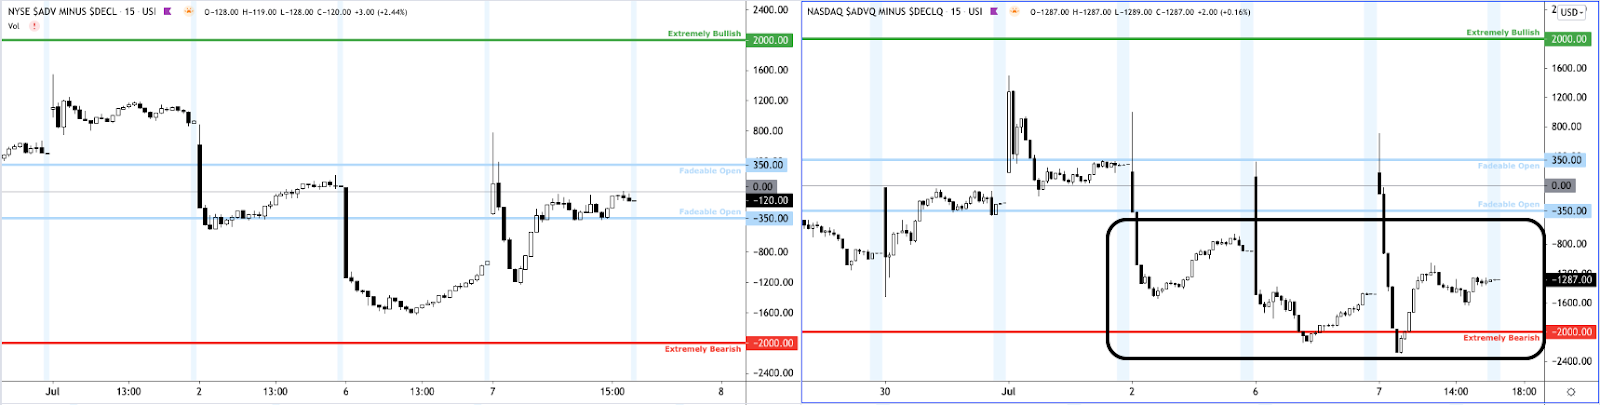
Further, the overnight liquidation comes after participants had a tough time establishing value at higher prices. Despite steady exploration in days prior, internal divergences via breadth metrics, became more pronounced, while profile dynamics revealed weak commitment at higher prices and an abundance of poor structures (e.g., low-volume areas).
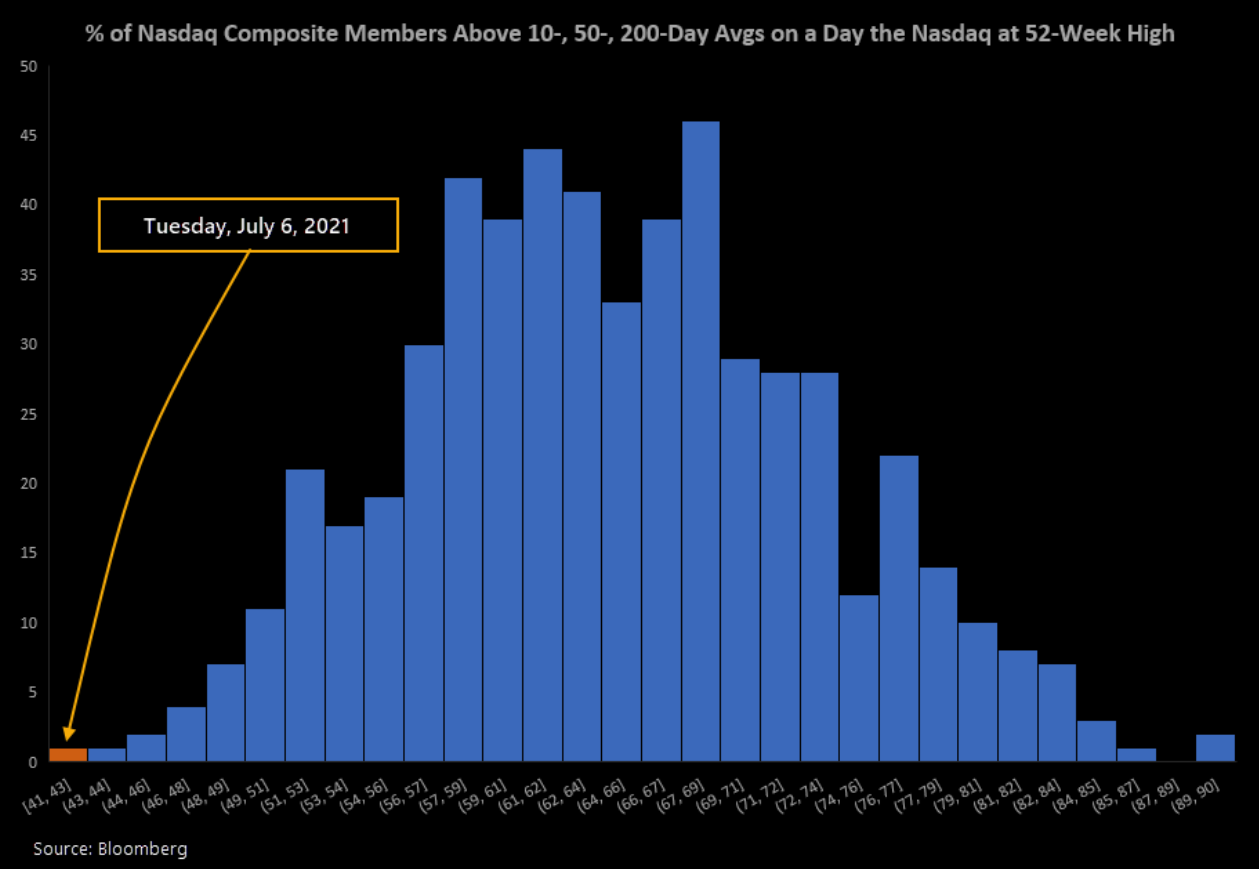
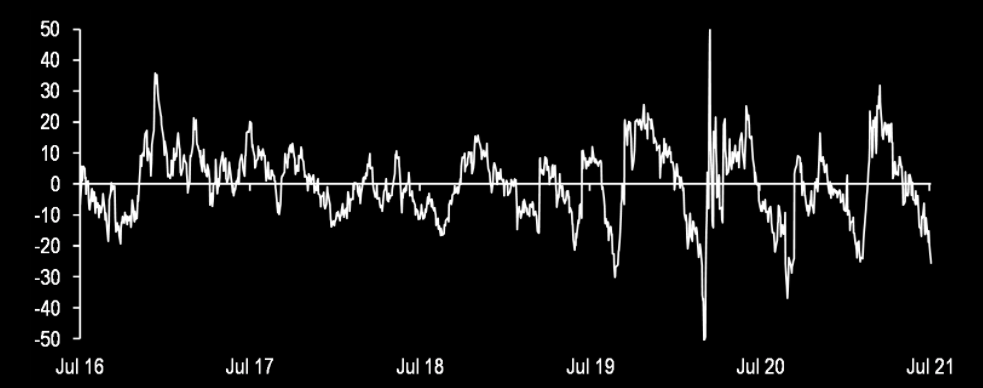
Graphic: Equity index leaders rose in price as internal divergences – like the ratio of advancers to decliners – grew. Noting a bigger divergence in internals tracking Nasdaq issues. Graphic: Nasdaq-100 constituents fail to participate in price rise, via The Market Ear.
Also, yesterday, Federal Reserve officials, as evidenced by meeting minutes, were not yet ready to communicate their timeline for scaling back asset purchases.
“The committee’s standard of ‘substantial further progress’ was generally seen as not having yet been met, though participants expected progress to continue,” according to minutes from the June 15-16 Federal Open Market Committee meeting published Wednesday. “Various participants mentioned that they expected the conditions for beginning to reduce the pace of asset purchases to be met somewhat earlier than they had anticipated at previous meetings.”
Following closely after, rates on the 10 Year T-Note moved into trend support. Though usually perceived as a boon for stocks – especially growth names – as low rates have to potential to increase the present value of future earnings, all major equity indexes are off their highs.
Graphic: Treasury yields nearly three standard deviations below their mode-implied fair value, via The Market Ear.
Regardless of the cause – comments by the Fed, in addition to the spread of COVID-19 variants, geopolitical tensions, among other things – for today, participants can trade from the following frameworks.
In the best case, the S&P 500 trades sideways or higher; activity above the $4,285.00 micro-composite high volume area (HVNode), a pivot, participants may look for responses at the $4,299.00 Point of Control (POC), first. Thereafter, if higher, the $4,317.00 POC, which corresponds with the half-point of the overnight range comes next. If above $4,317.00, lookout. The S&P 500 may auction as high as the $4,340.75 HVNode.
Volume Areas: A structurally sound market will build on past areas of high volume. Should the market trend for long periods of time, it will lack sound structure (identified as a low volume area which denotes directional conviction and ought to offer support on any test).

If participants were to auction and find acceptance into areas of prior low volume, then future discovery ought to be volatile and quick as participants look to areas of high volume for favorable entry or exit.

POCs: POCs are valuable as they denote areas where two-sided trade was most prevalent. Participants will respond to future tests of value as they offer favorable entry and exit.
In the worst case, the S&P 500 trades lower; activity below $4,285.00 puts in play the $4,263.25 low volume area (LVNode). Trade beyond that signpost may reach as low as the $4,247.75 LVNode and $4,229.00 VPOC.
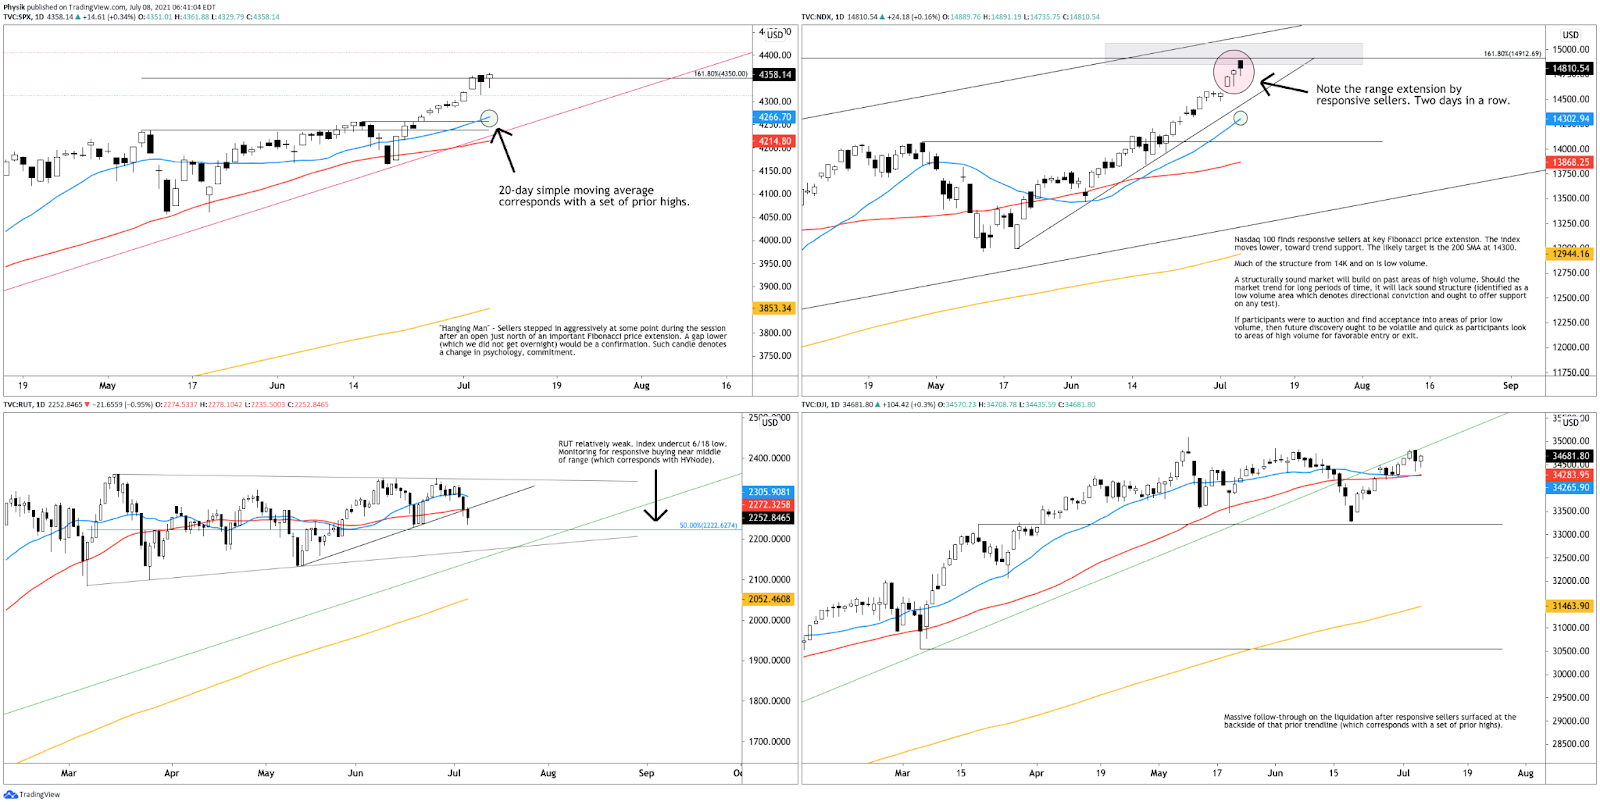
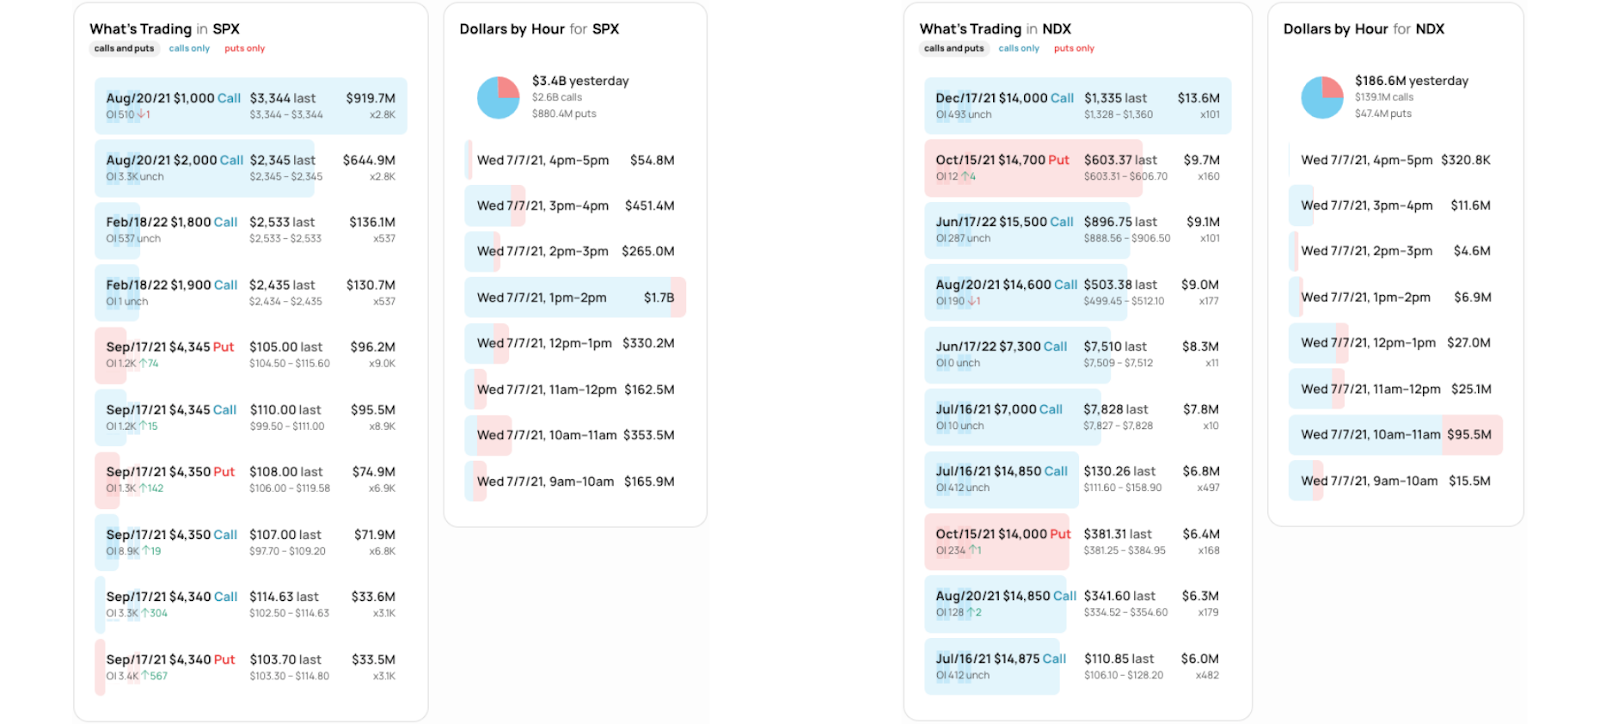
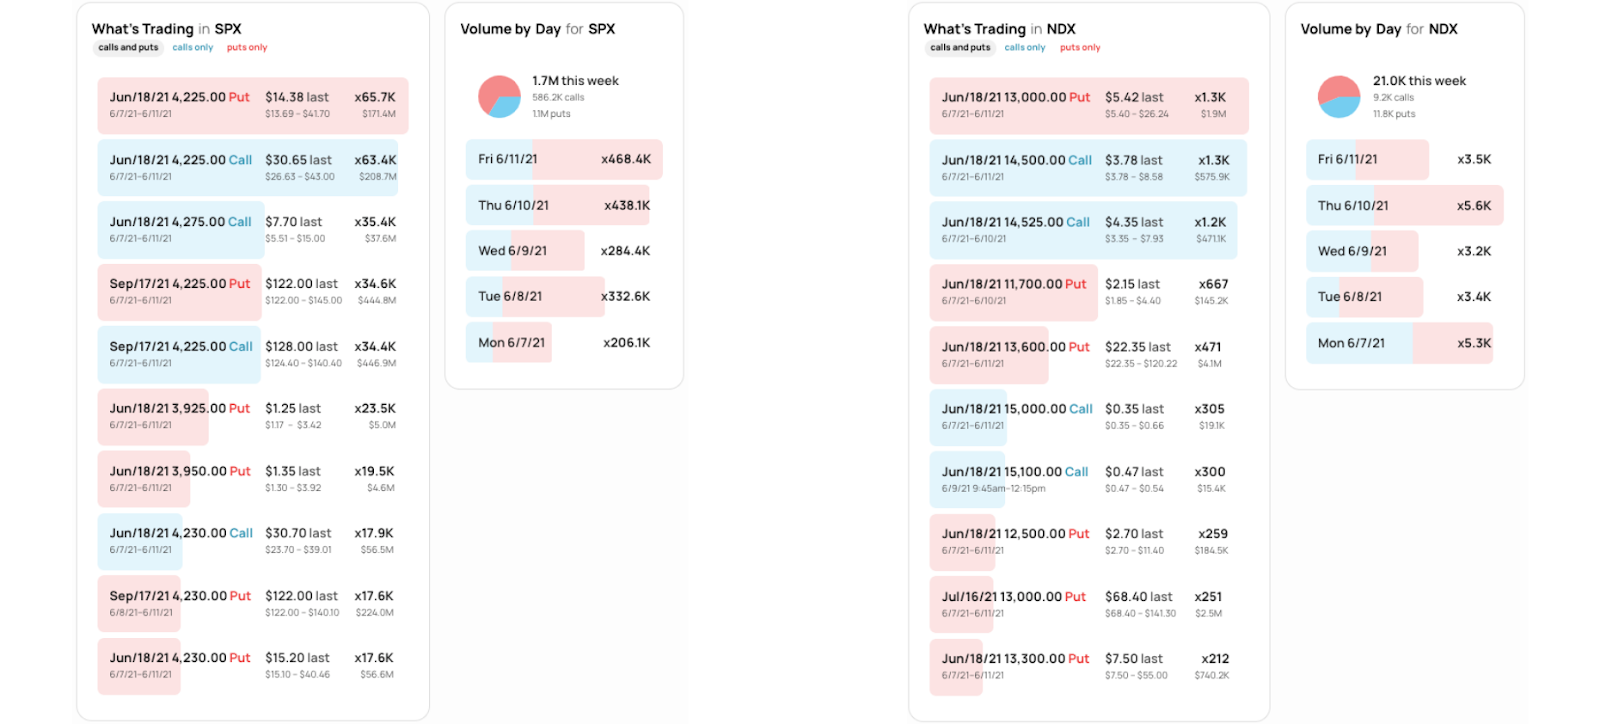
Graphic: 65-minute profile chart of the Micro E-mini S&P 500 Futures.Graphic: Daily candlestick charts of the S&P 500 (top left), Nasdaq 100 (top right), Russell 2000 (bottom left), and Dow Jones Industrial Average (bottom right).Graphic: SHIFT search suggests participants were committing the most capital to call strikes at and below current prices in the cash-settled S&P 500 Index (INDEX: SPX) and Nasdaq 100 (INDEX: NDX), yesterday. This activity may denote (1) stock replacement, (2) hedges for underlying short positions, or (3) speculation on the upside. Also, there was a meaningful bid in longer-dated puts on the S&P 500 and Nasdaq 100. This dynamic suggests participants, despite their commitment to higher prices, are hedging against near-term risks, like the Jackson Hole Economic Symposium.
News And Analysis
Economy | ECB unveils higher inflation goal that tolerates an overshoot. (BBG)
Politics | President Biden to speak on Afghanistan amid swift U.S. pullout. (REU)
Economy | Fed officials are split on easing quantitative easing program. (Axios)
Economy | Rates are down, jobs are up, but mortgage apps still decline. (MND)
Economy | External liquidity strains easing in some APAC economies. (Fitch)
Energy | OPEC gets ‘pass to lift oil prices’ as hedging losses hobble U.S. (FT)
COVID | Europe’s summer in peril as France warns on Spain, Portugal. (BBG)
Economy | Quest to define post-crisis global economic order is gaining. (BBG)
COVID | Tokyo games to go without fans as Japan declares emergency. (BBG)
What People Are Saying
Don't let them fool you guys…
there have been divergences now for 3 wks & if you went to cash 3 weeks ago, you would have missed the SPX +2.4% and QQQ +5% since then
U.S. TREASURY YIELD CURVE is flattening as traders anticipate the Federal Reserve will curb its bond buying programme and raise interest earlier than before as a result of the stronger-than-expected recovery in the economy and concerns about inflationary pressure: pic.twitter.com/ltFrN73IMU
Markets | The LSE had its first direct listing of a technology company. (MM)
About
Renato founded Physik Invest after going through years of self-education, strategy development, and trial-and-error. His work reporting in the finance and technology space, interviewing leaders such as John Chambers, founder, and CEO, JC2 Ventures, Kevin O’Leary, businessman and Shark Tank host, Catherine Wood, CEO and CIO, ARK Invest, among others, afforded him the perspective and know-how very few come by.
Having worked in engineering and majored in economics, Renato is very detailed and analytical. His approach to the markets isn’t built on hope or guessing. Instead, he leverages the unique dynamics of time and volatility to efficiently act on opportunity.
Disclaimer
At this time, Physik Invest does not manage outside capital and is not licensed. In no way should the materials herein be construed as advice. Derivatives carry a substantial risk of loss. All content is for informational purposes only.
Summary: Last week, U.S. stock index futures auctioned sideways to higher into Friday’s employment report. The release showed an addition of 850,000 jobs in June, the strongest employment gain since last summer.
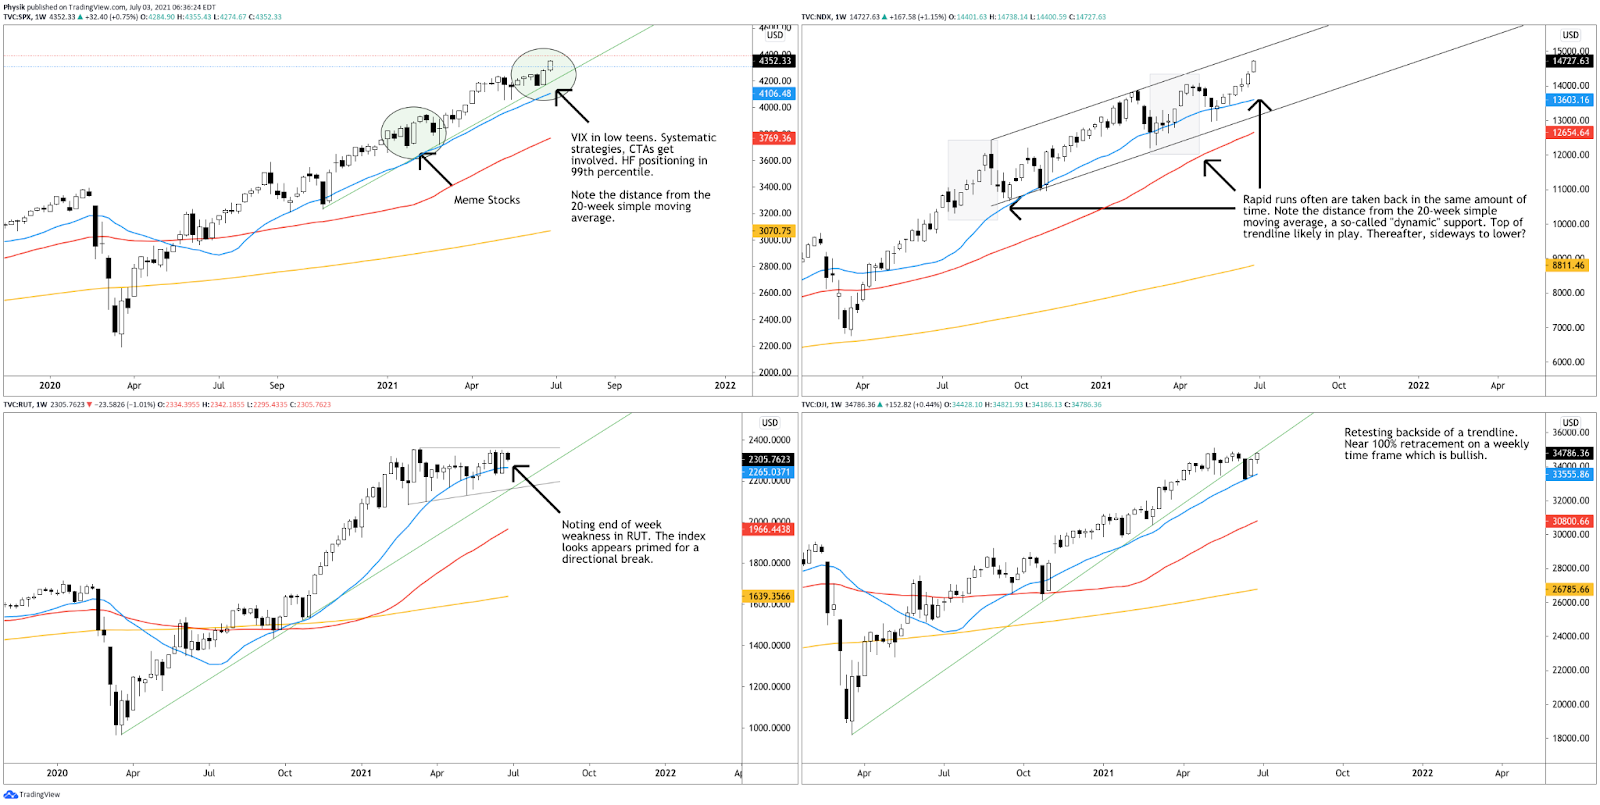
The S&P 500 and Nasdaq 100 led the week-long rally, while the Dow Jones Industrial Average followed closely behind. Though the Russell 2000 did end lower, it has been building energy for a break.
Considerations: It was the beginning of April JPMorgan Chase & Co’s (NYSE: JPM) Jamie Dimon wrote strong consumer savings, an increased pace in COVID-19 coronavirus vaccinations, and unprecedented efforts to spur economic activity could mean that a boom lasts as long as 2023.
Dimon’s comments remain valid. Months after, officials are hard at work in helping the U.S. reach herd immunity with vaccines that produce antibodies for the most well-known variants of COVID-19. Additionally, the economy is making progress toward meeting the Federal Reserve’s objectives for employment and inflation; just a couple of weeks ago the institution brought forward the time frame on when it will raise interest rates.
In a statement, BlackRock strategists noted: “We believe the Fed’s new outlook will not translate into significantly higher policy rates any time soon. This, combined with the powerful restart, underpins our pro-risk stance.”
Alongside that news, the equity market sold violently, into Quadruple Witching, or the large expiry of futures and options. Thereafter, indexes staged a massive reversal, and the CBOE Volatility Index (INDEX: VIX), a measure of the stock market’s expectation of volatility, traded to its lowest level since February 2020.
According to SpotGamma models, up to 50% of the gamma in and across the S&P 500 complex was taken off the table that expiry.
This, as SpotGamma has said in the past, “creates volatility because, as large options positions expire[], are closed and/or rolled, dealers have large hedges they need to adjust.”
Put more simply, the initial action, into the expiry, may have been attributable to the sale of long stock that hedged expiring short exposure above the market (i.e., call side).
After that exposure was cleared, the prospects for a rally improved, boosted by the buying back of short put hedges as volatility imploded.
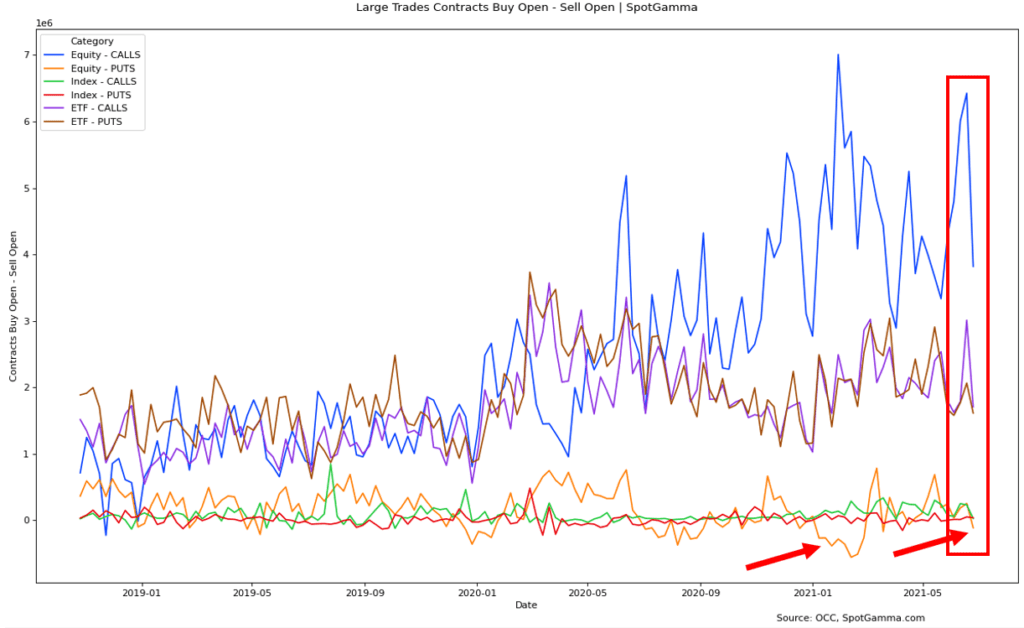
Last week, though, things became a tad frothy with the number of put options sold-to-open seeing heightened levels.
Graphic: SpotGamma’s analysis suggests equity put options were sold-to-open (red arrow).
Put sales, which can be part of sophisticated volatility-based trading strategies, often suggest increased confidence as market participants look to options for income, and not insurance.
Historically, the returns after such developments are mixed; more often the appearance of strong initiative buying surfaces (e.g., August and January 2020) before a liquidation helps correct excess inventory, and bring sense back into the market.
Kris Sidial – co-chief investment officer at The Ambrus Group, a volatility arbitrage fund – and I recently held a conversation regarding meme stock volatility, market structure, and regulation. He noted that ongoing risk-on dynamics can be traced back to factors like Federal Reserve stabilization efforts, and low rates, which incentivize risk-taking.
“The growth of structured products, passive investing, the regulatory standpoint that’s been implemented with Dodd-Frank and dealers needing to hedge off their risk more frequently, than not,” are all part of a regime change that’s affected the stability of markets, Sidial notes. “These dislocations happen quite frequently in small windows, and it offers the potential for large outlier events,” like the equity bust and boom during 2020. “Strength and fragility are two completely different components. The market could be strong, but fragile.”
That dynamic is playing out as Cem Karsan, founder at Kai Volatility, notes volatility is dramatically oversupplied. As a result, as implied volatility drops, options gamma – an option delta’s sensitivity to market price changes – rises. Associated hedging forces make it so there’s more liquidity and less movement. In other words, the market tends to pin.
As realized volatility falls from its peak around a year ago, more sold SPX options cluster at strikes nearer to spot. And as implied volatility falls with it, the gamma of those options increases.
More dealer long gamma means more liquidity. More liquidity means less movement. pic.twitter.com/712OAMq7iP
Still, in line with Sidial’s comments, Karsan believes expected distributions are fat-tailed, given “fragility.” In other words, it’s hard for the market to unpin. Should it unpin, however, there’s “not enough liquidity” to absorb leverage on the tails.
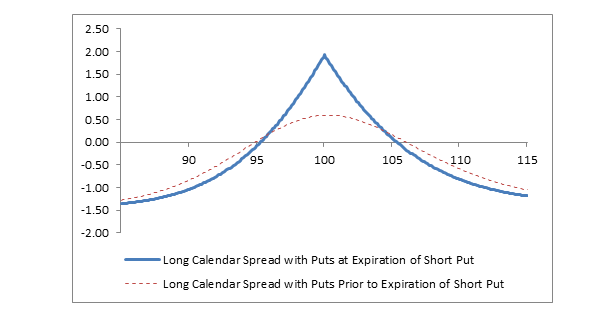
Given this, Karsan finds it interesting to sell at-the-money option structures to fund out-of-the-money structures. Alternatively, knowing what forces – e.g., charm or the rate at which the delta of an option changes with respect to time – decay poses on so-called “dealer positioning,” going into the July option expirations (OPEX), one could look into long calendar put spreads on the S&P 500.
In such a case, traders are short puts in July and long puts on forward. This way, you’re collecting decay as a result of realized pinning. Here’s Karsan’s full take, from the source.
Graphic: The risk profile of a long put calendar spread, via Fidelity.
After mid-July, though, the window for fundamental dynamics (e.g., a shift in preferences from saving and investing to spending, monetary tightening, seasonality, or a COVID-19 resurgence) to take over is opened.
In a note on COVID resurgence, to not venture too far off into the abyss, I cite strategists led by JPMorgan Chase & Co’s (NYSE: JPM) Marko Kolanovic who last year correctly suggested equities would continue rallying on the basis of low rates, improved fundamentals, buybacks, as well as systematic and hedge fund strategies.
“The delta variant should not have significant repercussions for the pandemic situation in developed markets (e.g. Europe and North America, which have [made] strong progress in vaccinations) due to the level of population immunity.”
What To Expect: In the coming sessions, participants will want to focus their attention on where the S&P 500 trades in relation to Friday’s $4,323.00 untested Point of Control (POC).
POCs: POCs are valuable as they denote areas where two-sided trade was most prevalent. Participants will respond to future tests of value as they offer favorable entry and exit.
That said, participants can trade from the following frameworks.
In the best case, the index trades sideways or higher; activity above the $4,323.00 POC puts in play the $4,347.00 excess high. Initiative trade beyond the excess high could reach as high as the $4,357.50 Fibonacci-derived price target.
Excess: A proper end to price discovery; the market travels too far while advertising prices. Responsive, other-timeframe (OTF) participants aggressively enter the market, leaving tails or gaps which denote unfair prices.
In the worst case, the index trades lower; activity below the $4,323.00 POC puts in play the untested POC at $4,299.00, as well as the POC and micro-composite HVNode at $4,285.00. Thereafter, if lower, participants may look for responses at the $4,263.25 LVNode, $4,247.75 LVNode, as well as the $4239.25 HVNode and $4,229.00 POC.
Volume Areas: A structurally sound market will build on past areas of high volume. Should the market trend for long periods of time, it will lack sound structure (identified as a low volume area which denotes directional conviction and ought to offer support on any test).

If participants were to auction and find acceptance into areas of prior low volume, then future discovery ought to be volatile and quick as participants look to areas of high volume for favorable entry or exit.
For a full list of important levels, see the 65-minute profile and candlestick chart, below.
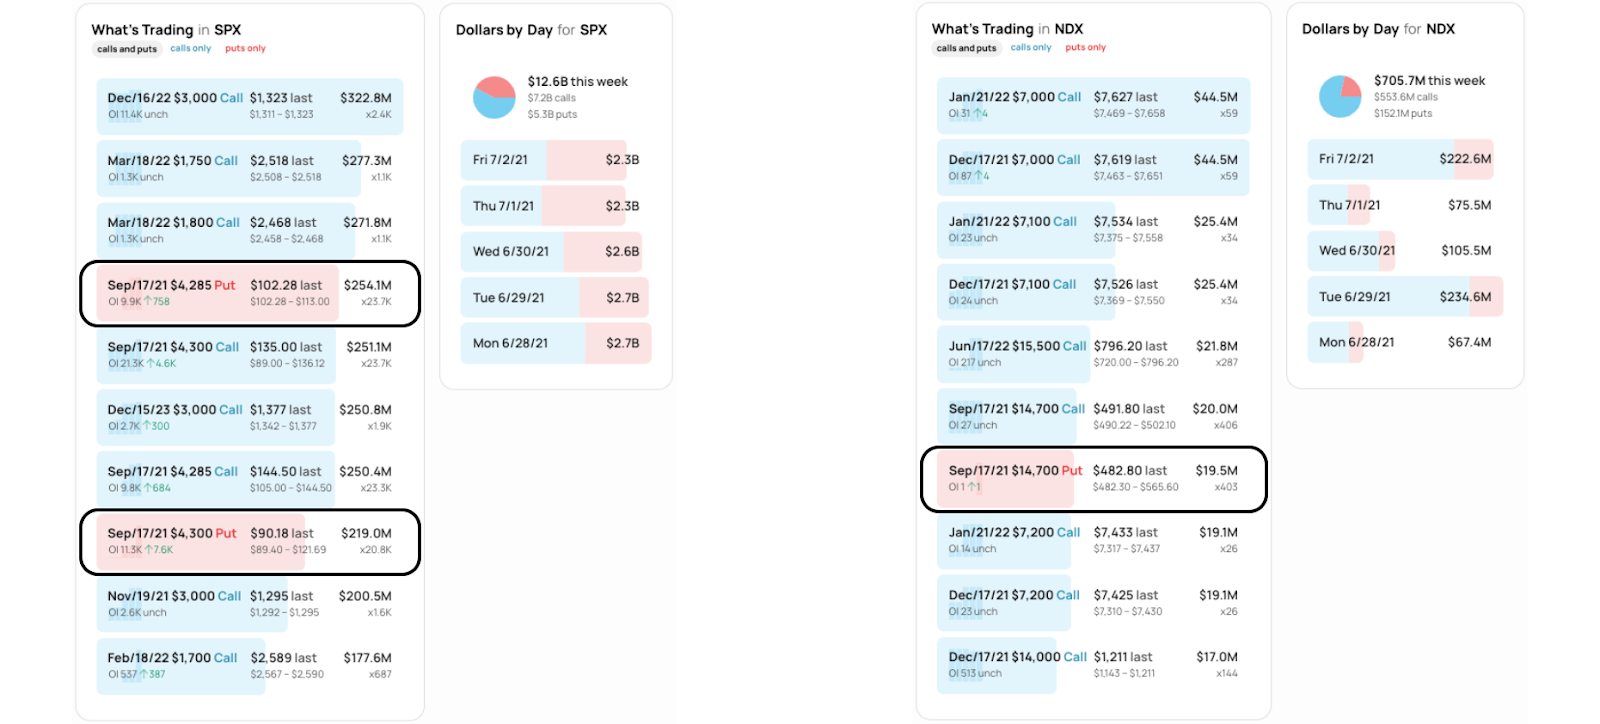
Graphic: 65-minute profile chart of the Micro E-mini S&P 500 Futures.Graphic: Weekly candlestick charts of the S&P 500 (top left), Nasdaq 100 (top right), Russell 2000 (bottom left), and Dow Jones Industrial Average (bottom right).Graphic: SHIFT search suggests participants were committing the most capital to call strikes at and below current prices in the cash-settled S&P 500 Index (INDEX: SPX) and Nasdaq 100 (INDEX: NDX), last week. This activity denotes (1) stock replacement, (2) hedges for underlying short positions, or (3) speculation on the upside. Also, there was a meaningful bid in September puts on the S&P 500 and Nasdaq 100. This dynamic suggests participants, despite their commitment to higher prices, are hedging against near-term risks, like the Jackson Hole Economic Symposium.
News And Analysis
Markets | The premium Elon Musk adds to Tesla, other ventures. (Kyla)
Markets | Forward-looking indicators point to improving credit trends. (S&P)
Travel | TSA screenings surpassed 2019 levels in a pandemic first. (CNBC)
Energy | WH is worried about high oil prices, sees enough supply. (REU)
Energy | An overview of data from IEA’s Energy prices database. (IEA)
Energy | OPEC ends Friday’s meeting without a deal for agreement. (CNBC)
Agriculture | Dry weather damage spells trouble for U.S. spring crops. (S&P)
Economy | States ending jobless benefits early hit labor milestones. (REU)
Markets | Spotlight turning to mergers, acquisition for fintech SPACs. (S&P)
Economy | Jobs gain largest in 10 months; employers up wages. (REU)
Energy | Cal-ISO, utilities ask consumers to conserve amid heatwave. (S&P)
Markets | Record S&P 500 masks fear trade gripping stock market. (BBG)
Innovation And Emerging Trends
FinTech | BTC mining now easier, more profitable after crackdowns. (CNBC)
FinTech | ‘Flight to quality’ as private insurtechs draw big investments. (S&P)
FinTech | Bank customers cement relationships with digital channels. (S&P)
Markets | Money-losing companies sell record stock, flashing signal. (CNBC)
Markets | Wall Street rebels warning of ‘disastrous’ $11T index boom. (BBG)
Mobility | When do electric vehicles become cleaner than gas cars? (REU)
About
Renato founded Physik Invest after going through years of self-education, strategy development, and trial-and-error. His work reporting in the finance and technology space, interviewing leaders such as John Chambers, founder, and CEO, JC2 Ventures, Kevin O’Leary, businessman and Shark Tank host, Catherine Wood, CEO and CIO, ARK Invest, among others, afforded him the perspective and know-how very few come by.
Having worked in engineering and majored in economics, Renato is very detailed and analytical. His approach to the markets isn’t built on hope or guessing. Instead, he leverages the unique dynamics of time and volatility to efficiently act on opportunity.
Disclaimer
At this time, Physik Invest does not manage outside capital and is not licensed. In no way should the materials herein be construed as advice. Derivatives carry a substantial risk of loss. All content is for informational purposes only.
What Happened: U.S. stock index futures auctioned sideways ahead of some key releases. The Russell 2000 and Dow Jones Industrial Average firmed up relative to their peers, the S&P 500 and Nasdaq 100, the group leader.
This activity comes as banks boosted their dividends and uncertainties surrounding the COVID-19 delta-variant. Some reports suggest nearly half of Australia’s population is in lockdown, while Asian countries are looking to reduce the spread with mobility restrictions. Still, not all news is bad; some European countries are lifting restrictions on travel and OPEC may increase the supply of oil.
Of interest today is data around home prices, consumer confidence, and Fed speak.
Graphic updated 7:20 AM ET.
What To Expect: Tuesday’s regular session (9:30 AM – 4:00 PM EST) in the S&P 500 will likely open inside of prior-range and -value, suggesting a limited potential for immediate directional opportunity.
Adding, during the prior day’s regular trade, the best case outcome occurred, evidenced by initiative trade above the $4,257.00 Point of Control (POC), up to a new overnight high (ONH) at $4,283.00.
POCs: POCs are valuable as they denote areas where two-sided trade was most prevalent. Participants will respond to future tests of value as they offer favorable entry and exit.

Overnight Rally Highs (Lows): Typically, there is a low historical probability associated with overnight rally-highs (lows) ending the upside (downside) discovery process.
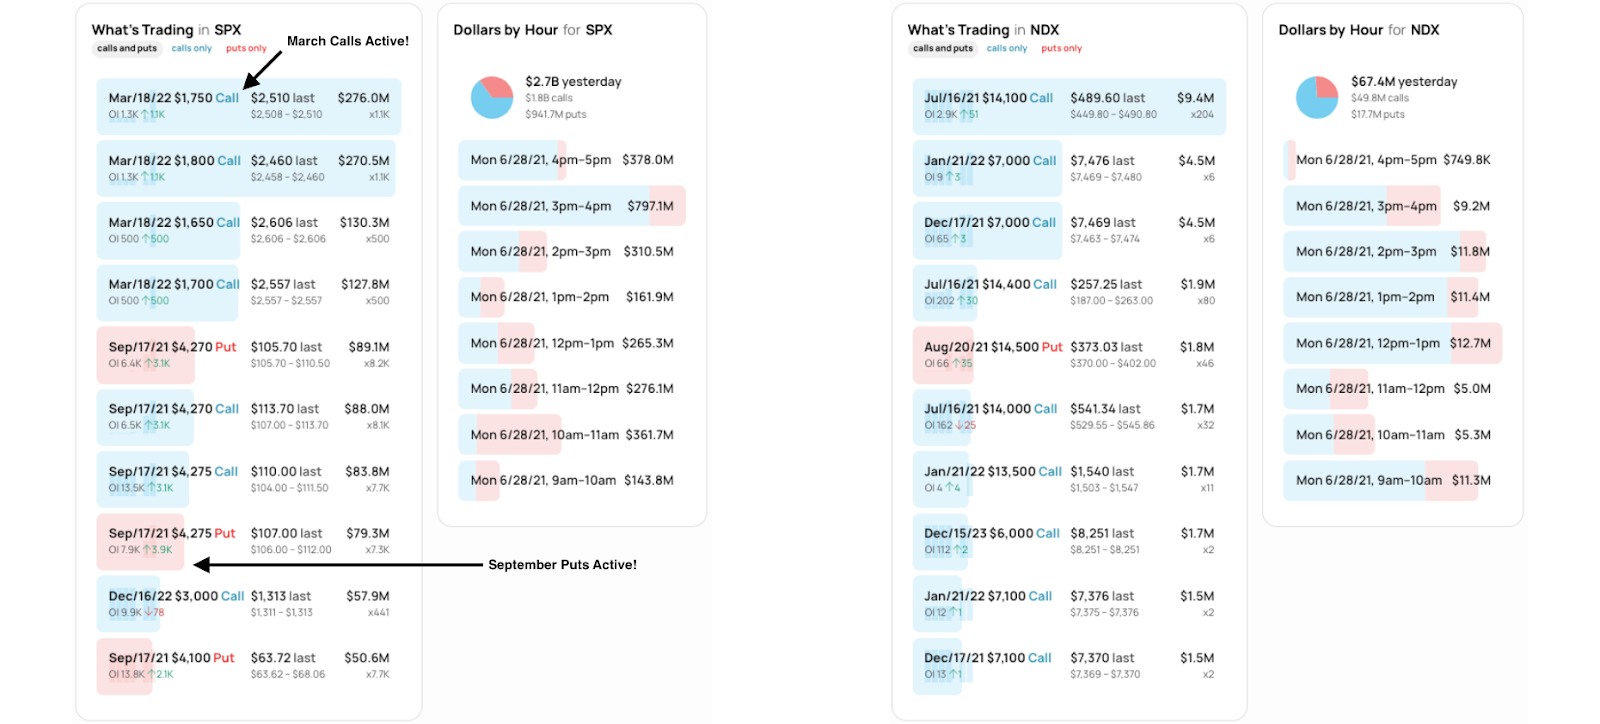
Prior to getting onto what’s expected for today’s trade, it is important to note some ongoing activity in the options market. Specifically, participants, despite their commitment to higher prices (as evidenced by longer-dated call activity), are likely hedging against near-term risks, like the Jackson Hole Economic symposium used in the past to signal monetary policy changes (see the graphic below for more detail). This hedging, in conjunction with lackluster breadth and poor expansion of range, cautions participants on increased volatility; a focus should be made on relatively strong issues.
Further, for today, participants can trade from the following frameworks.
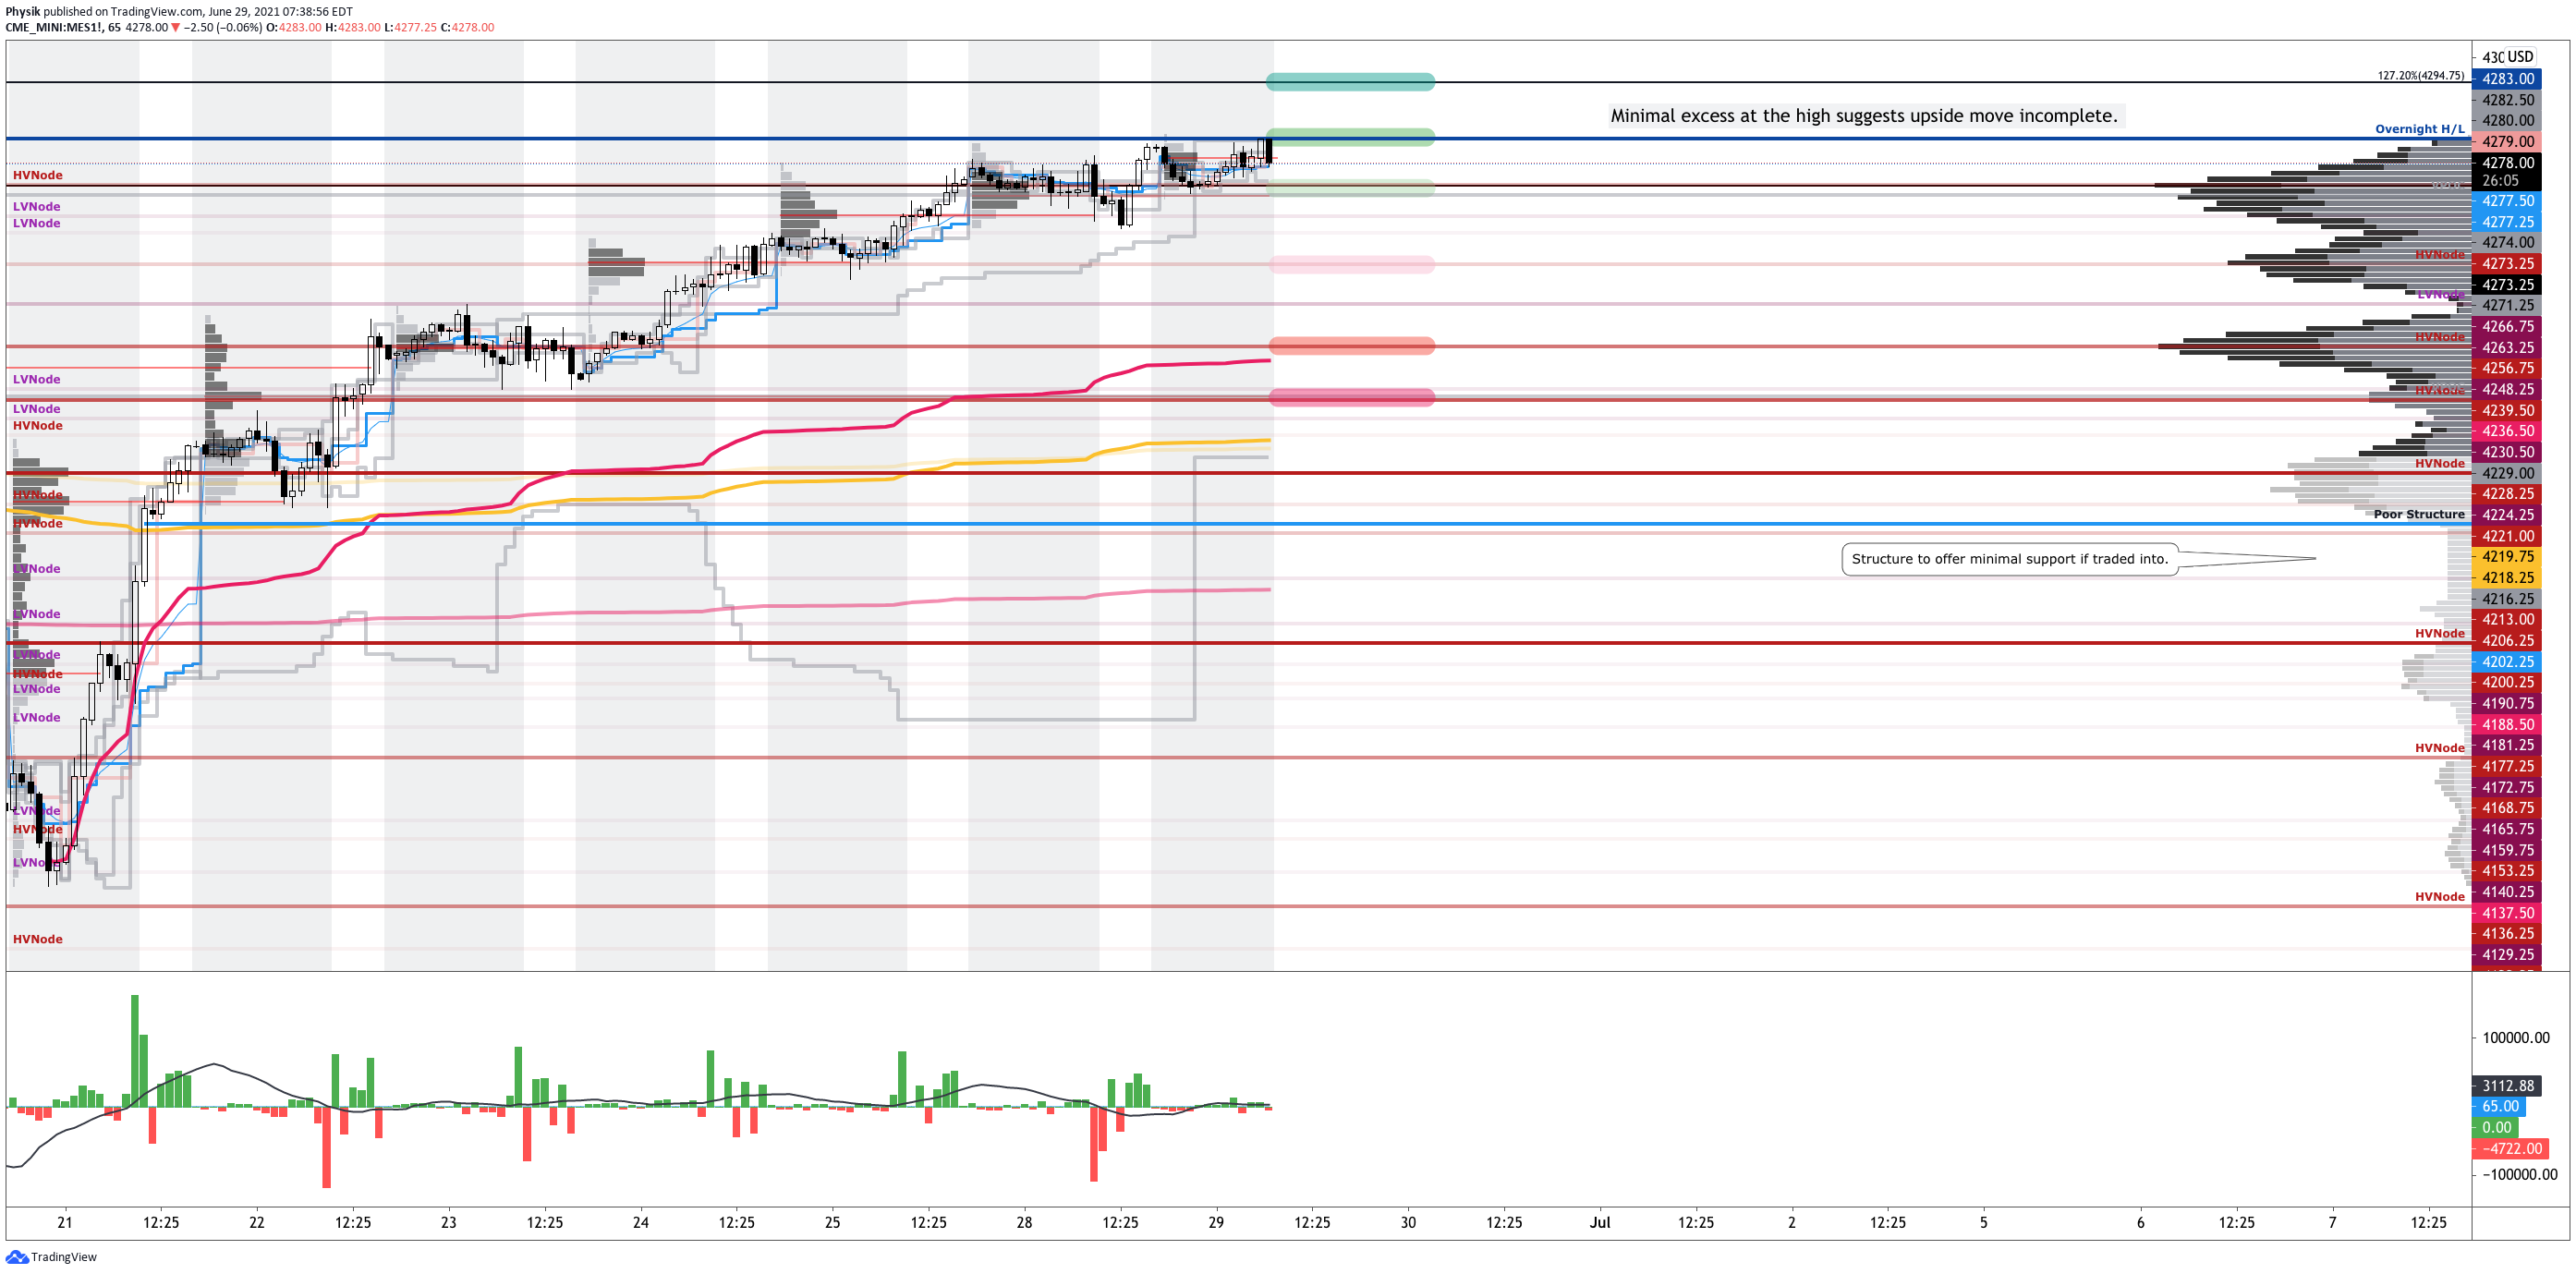
In the best case, the S&P 500 trades sideways or higher; activity above the $4,271.00 POC puts in play the $4,283.00 ONH. Initiative trade beyond the ONH could reach as high as the $4,294.75 Fibonacci-derived price target.
In the worst case, the S&P 500 trades lower; activity below $4,271.00 puts in play the HVNodes at $4,256.75, $4,239.50, and $4,229.00.
Volume Areas: A structurally sound market will build on past areas of high volume. Should the market trend for long periods of time, it will lack sound structure (identified as a low volume area which denotes directional conviction and ought to offer support on any test).

If participants were to auction and find acceptance into areas of prior low volume, then future discovery ought to be volatile and quick as participants look to areas of high volume for favorable entry or exit.
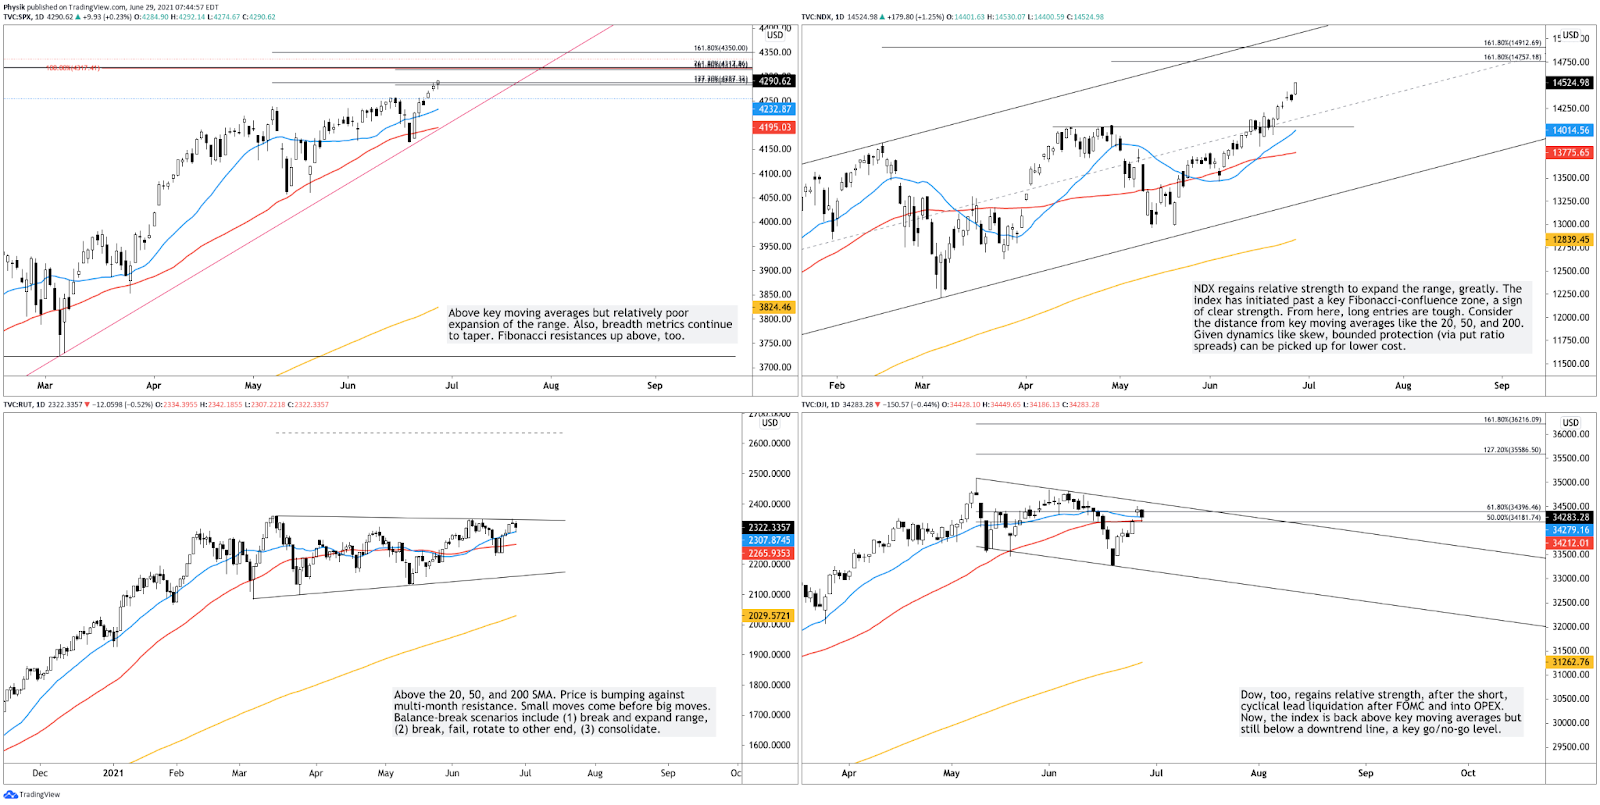
Graphic: 65-minute profile chart of the Micro E-mini S&P 500 Futures. Notice (1) increased churn at higher prices, (2) minimal excess on composite profile, (3) poor expansion of range, as well as (4) poor, and rather unsupportive, low volume structures beneath current price. Graphic: Daily candlestick charts of the S&P 500 (top left), Nasdaq 100 (top right), Russell 2000 (bottom left), and Dow Jones Industrial Average (bottom right). Graphic: SHIFT search suggests participants were committing the most capital to call strikes at and below current prices in the cash-settled S&P 500 Index (INDEX: SPX) and Nasdaq 100 (INDEX: NDX), last week. This activity may denote (1) stock replacement, (2) hedges for underlying short positions, or (3) speculation on the upside. Also, there was a meaningful bid in September puts on the S&P 500. This dynamic suggests participants, despite their commitment to higher prices, are hedging against near-term risks, like the Jackson Hole Economic Symposium.
News And Analysis
Economy | The Bank of Japan cuts some bond purchase targets. (BBG)
Markets | BlackRock warns U.S. stocks at risk from higher taxes. (BBG)
Markets | United Airlines confirmed 270 Boeing, Airbus jet order. (REU)
Markets | Wall Street funnels cash to investors post-stress-tests. (BBG)
FinTech | Deutsche Boerse is buying Swiss fintech Crypto Finance. (REU)
About
Renato founded Physik Invest after going through years of self-education, strategy development, and trial-and-error. His work reporting in the finance and technology space, interviewing leaders such as John Chambers, founder, and CEO, JC2 Ventures, Kevin O’Leary, businessman and Shark Tank host, Catherine Wood, CEO and CIO, ARK Invest, among others, afforded him the perspective and know-how very few come by.
Having worked in engineering and majored in economics, Renato is very detailed and analytical. His approach to the markets isn’t built on hope or guessing. Instead, he leverages the unique dynamics of time and volatility to efficiently act on opportunity.
Disclaimer
At this time, Physik Invest does not manage outside capital and is not licensed. In no way should the materials herein be construed as advice. Derivatives carry a substantial risk of loss. All content is for informational purposes only.
Key Takeaways: Equity index futures struggle to discover higher prices.
Biden’s infrastructure deal back on track.
Week Ahead: Many economic releases.
SPX struggles. NDX weak at a key level.
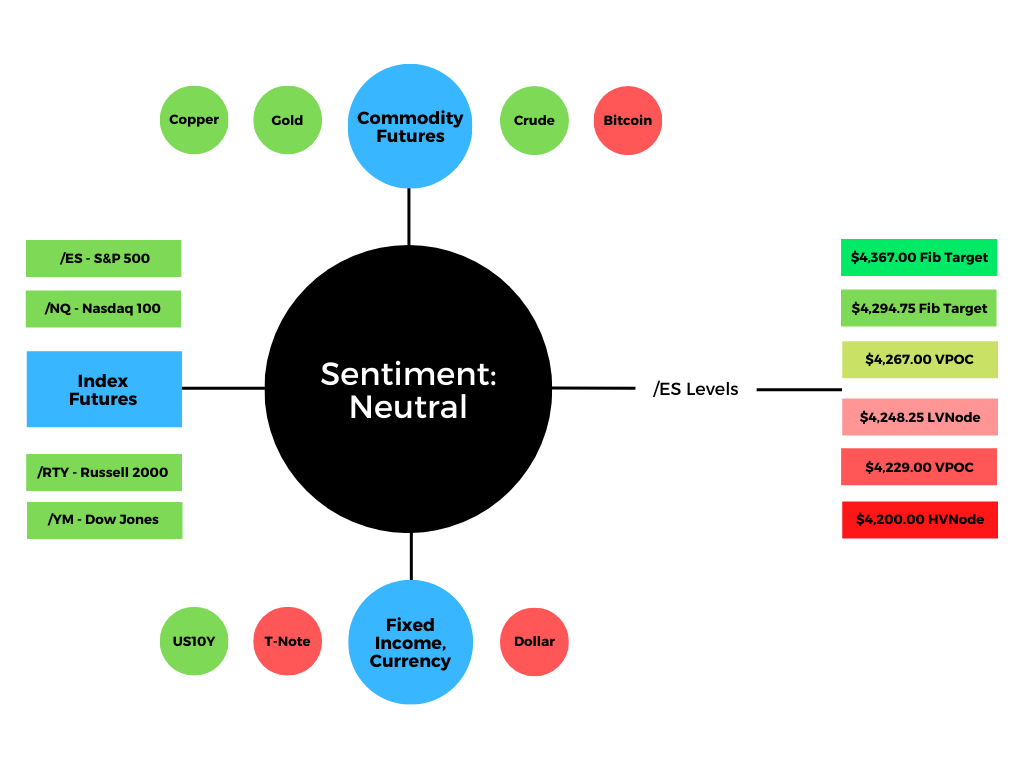
Graphic updated June 27, 2021, at 11:50 AM ET.
What Happened: Last week, U.S. equity index futures discovered higher prices alongside some positive economic and political developments.
Of interest was an agreement on infrastructure, successful Federal Reserve bank stress tests, a record for U.S. factory activity, among other things.
Prior to the price rise, markets sold heavily on a shift in the Federal Reserve’s so-called dot-plot. Bond yields on the short-end of the curve rose while long-dated yields dropped in line with projections future inflation is easing. This flatter yield curve is a negative for cyclical-type companies which can’t pass on increased costs, thereby impacting sales and margins.
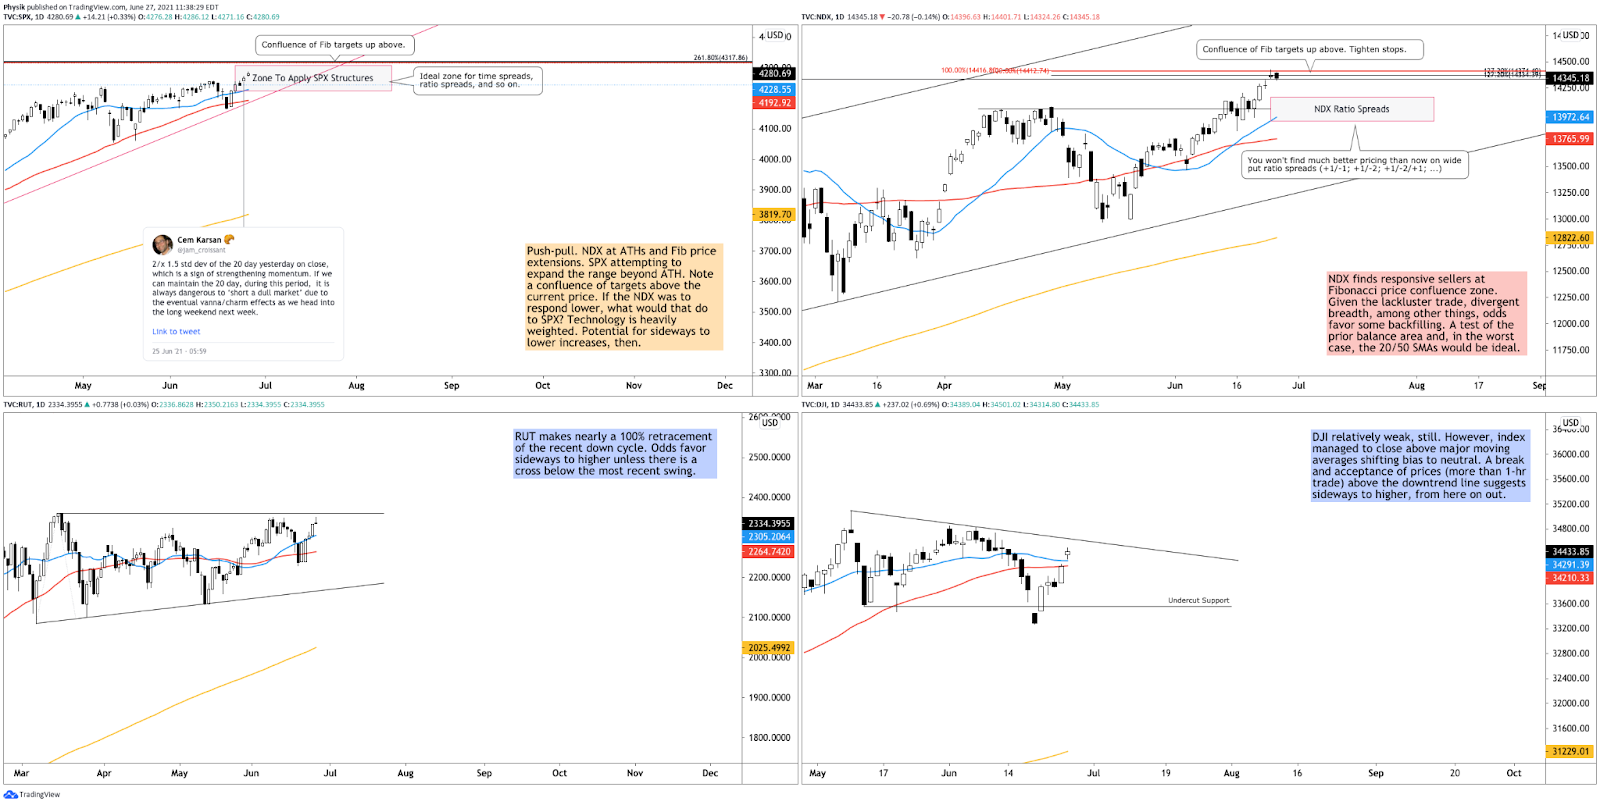
Moreover, both the S&P 500 and Nasdaq 100 established new all-time highs (ATHs). The Nasdaq 100, though, found responsive sellers at a zone of overlapping Fibonacci-derived price targets, weighing down the S&P 500, which had a difficult time expanding range, a usual sight for a healthy bull market.
Partially to blame is narrowing breadth at heightened valuations, as well as a shift in monetary and fiscal policy narratives. According to Bloomberg, while the broader market is near ATHs, the “[l]owest % of stocks [are] above 50-dma since 1999, when S&P hits record.”
This narrowing breadth, in conjunction with weak seasonality, potentially unsupportive market liquidity metrics, trade in the options market, as well as poor profile structures that offer little-to-no support on liquidations, suggests participants ought to beware of an increased potential to violently backfill.
To note, next week, participants will get more Fed speak, data on home prices, consumer confidence, employment, PMI, construction spending, home and vehicle sales, trade, and factory orders.
What To Expect: In the coming sessions, participants will want to focus their attention on where the S&P 500 trades in relation to Friday’s fairest price or Point of Control (POC).
Point of Control (POCs): POCs are valuable as they denote areas where two-sided trade was most prevalent. Participants will respond to future tests of value as they offer favorable entry and exit.
In the best case, the index trades sideways or higher; activity above the $4,267.00 POC puts in play the $4,294.75 and $4,367.00 Fibonacci-derived price targets.
In the worst case, the index trades lower; activity below the $4,267.00 POC puts in play the $4,248.25 low volume area (LVNode) and $4,229.00 POC. Thereafter, if lower, participants ought to look for responses at the poor structure just below $4,200.00.
Volume Areas: A structurally sound market will build on past areas of high volume. Should the market trend for long periods of time, it will lack sound structure (identified as a low volume area which denotes directional conviction and ought to offer support on any test).

If participants were to auction and find acceptance into areas of prior low volume, then future discovery ought to be volatile and quick as participants look to areas of high volume for favorable entry or exit.
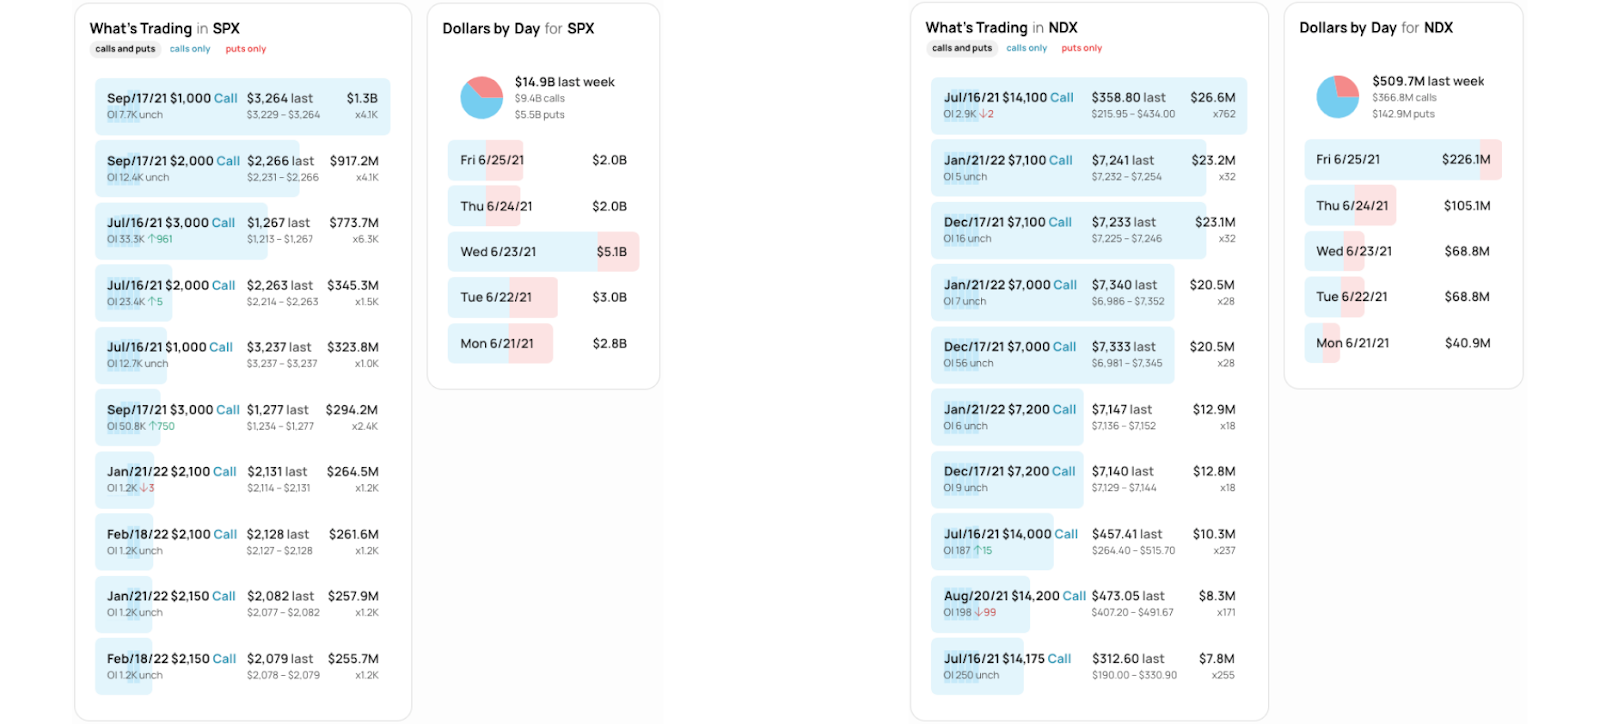
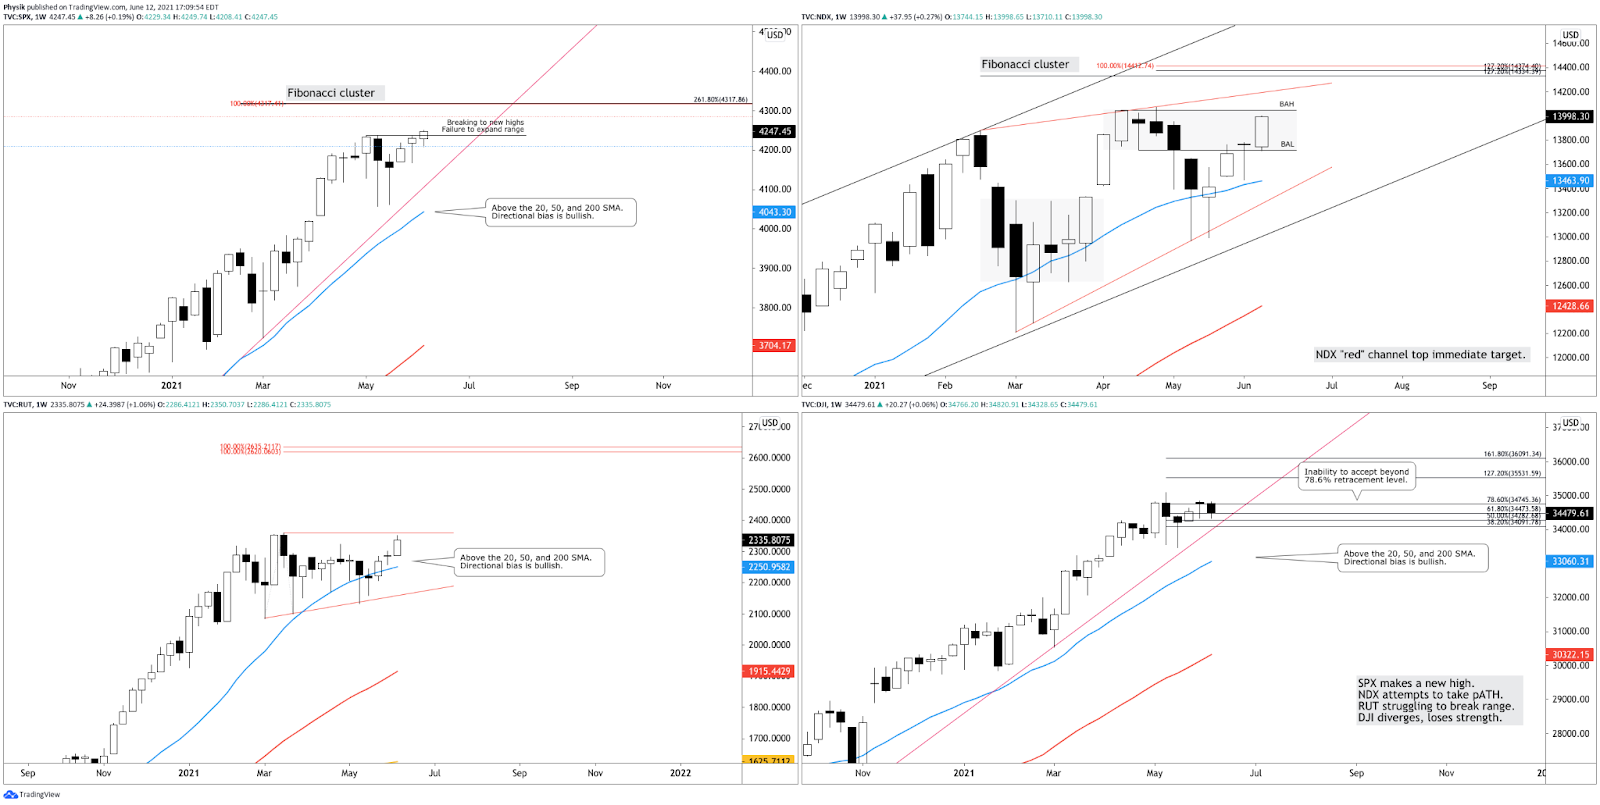
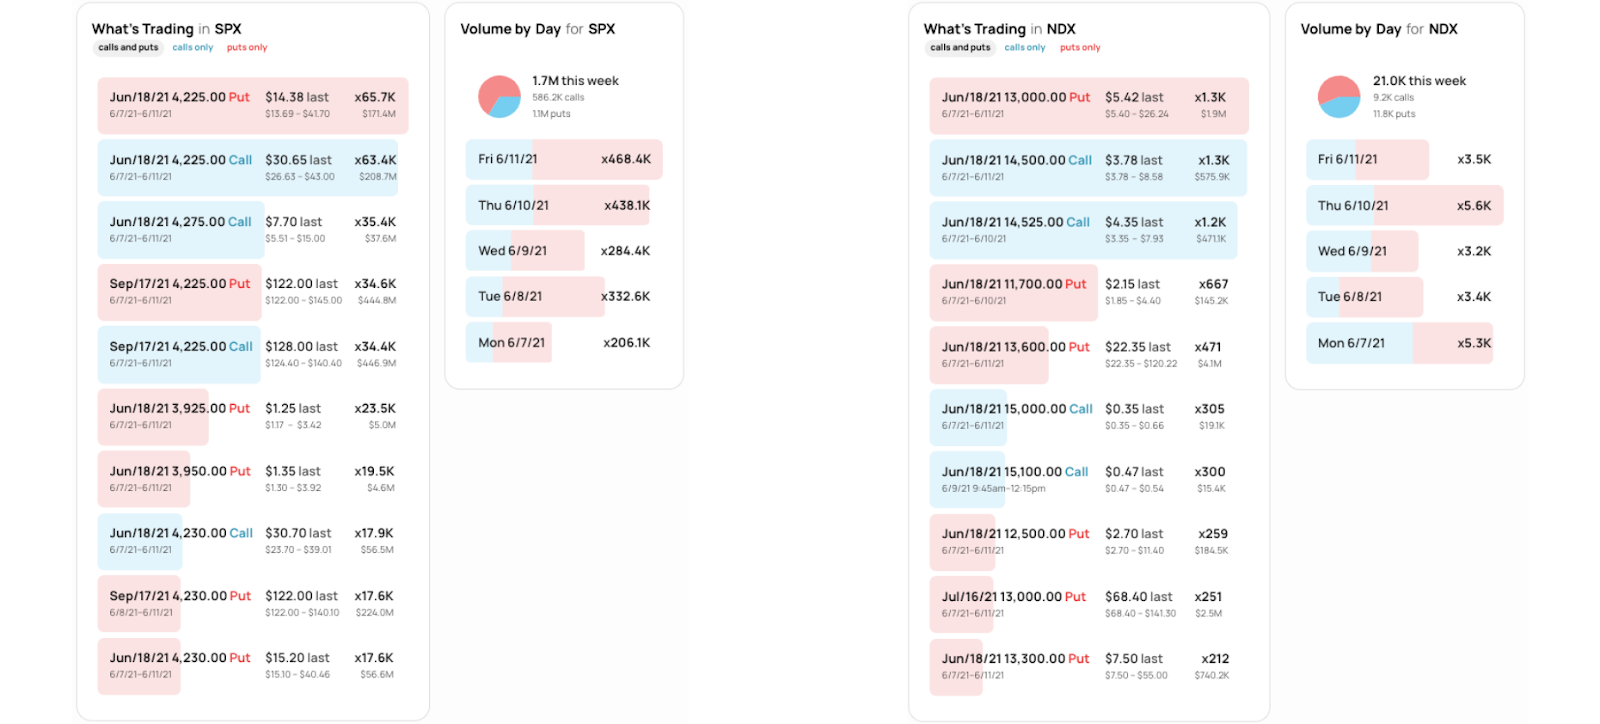
Graphic: 4-hour profile chart of the Micro E-mini S&P 500 Futures.Graphic: Daily candlestick charts of the S&P 500 (top left), Nasdaq 100 (top right), Russell 2000 (bottom left), and Dow Jones Industrial Average (bottom right).Graphic: SHIFT search suggests participants were committing the most capital to call strikes at and below current prices in the cash-settled S&P 500 Index (INDEX: SPX) and Nasdaq 100 (INDEX: NDX), last week. This activity may denote (1) stock replacement, (2) hedges for underlying short positions, or (3) speculation on the upside.
News And Analysis
Economy | Support doesn’t provide a meaningful boost until mid-decade. (Moody’s)
Economy | Inflation jumps on base effects, supply; inflation largely transitory. (S&P)
Economy | Forecasts for eurozone growth revised up on stimulus, mobility. (S&P)
Markets | Tesla recalls nearly 300K cars in China over cruise control issues. (CNN)
Markets | El Salvador looks to hand out up to $117M in bitcoin to its citizens. (Block)
Media | Fast 9 propels box office to its biggest weekend since the pandemic. (BBG)
Markets | Boeing’s updated 777 hit with new safety concerns from the FAA. (BBG)
Weather | A record heatwave is set to scorch Pacific Northwest, South CA. (NPR)
FinTech | UK regulator bans Binance from regulated activities in the country. (Block)
Economy | Spreads and cost shocks could double the rate of loss-making. (S&P)
Markets | Chances of moderately big moves back-to-back are independent. (Tasty)
Markets | Banks clear stress tests; expecting a boost to buybacks, dividends. (REU)
Suppose you're thinking about buying fire insurance on your house in Sonoma. You create an insurance fund of $100,000, and you decide that you'll spend exactly 10% of that fund every month on insurance, because you want to fix the maximum loss on your policy over the long term.
FinTech | New cryptocurrency startup funding is projected to continue rising. (CB)
FinTech | Elon Musk may debate Jack Dorsey at an upcoming bitcoin event. (Block)
FinTech | Citigroup launches digital asset units within wealth management. (Block)
FinTech | Morgan Stanley adds investment to bring blockchain to markets. (Forbes)
Work | An FBI body language expert on communicating back in the office. (BBG)
COVID | An ancient viral epidemic involving coronavirus impacted genes. (Cell)
FinTech | Xi and the CCP turn on Jack Ma, Ant, and other Chinese fintech. (BBG)
About
Renato founded Physik Invest after going through years of self-education, strategy development, and trial-and-error. His work reporting in the finance and technology space, interviewing leaders such as John Chambers, founder, and CEO, JC2 Ventures, Kevin O’Leary, businessman and Shark Tank host, Catherine Wood, CEO and CIO, ARK Invest, among others, afforded him the perspective and know-how very few come by.
Having worked in engineering and majored in economics, Renato is very detailed and analytical. His approach to the markets isn’t built on hope or guessing. Instead, he leverages the unique dynamics of time and volatility to efficiently act on opportunity.
Disclaimer
At this time, Physik Invest does not manage outside capital and is not licensed. In no way should the materials herein be construed as advice. Derivatives carry a substantial risk of loss. All content is for informational purposes only.
What Happened: U.S. stock index futures auctioned sideways ahead of an important Federal Open Market Committee (FOMC) announcement at 2:00 p.m. Eastern Time, today.
As stated in prior commentaries, the odds of substantial change to policy are low. Instead, participants will likely hear that despite Fed policy remaining unchanged, tools exist to combat inflation.
Also, before the open, China established orders limiting exposure to overseas commodities and U.K. consumer prices rose. Important releases, aside from the Fed decision, include data on housing starts and trade prices, as well as text on infrastructure.
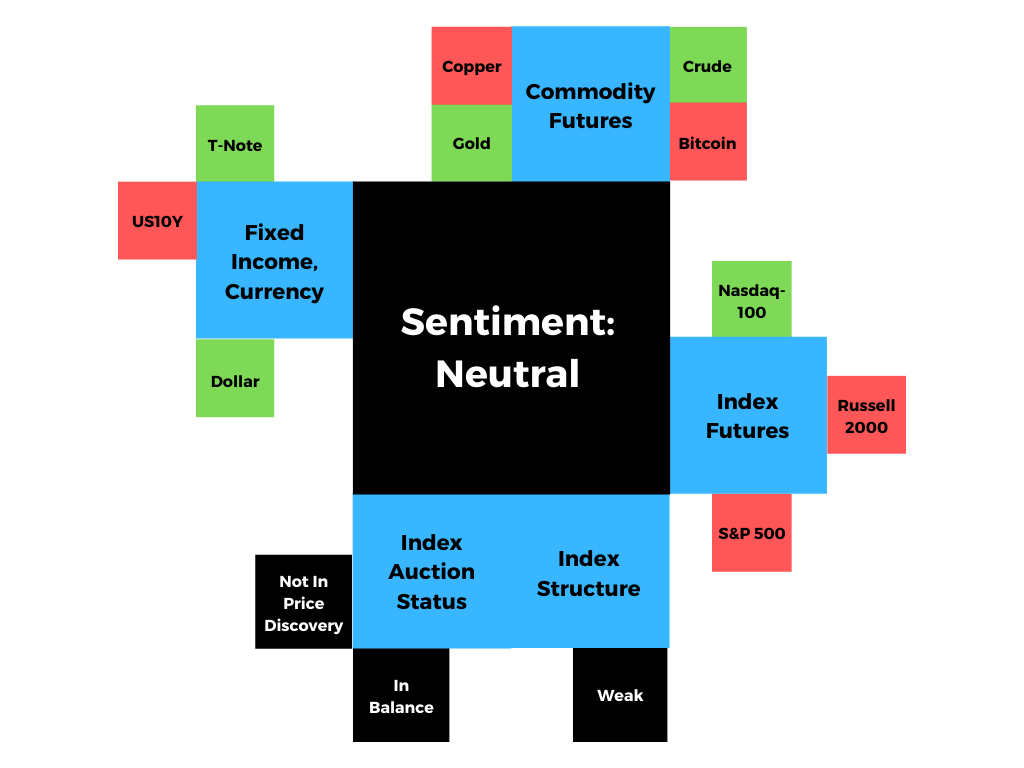
Graphic updated 7:13 AM ET.
What To Expect: Wednesday’s regular session (9:30 AM – 4:00 PM EST) in the S&P 500 will likely open inside of prior-range and -value, suggesting a limited potential for immediate directional opportunity.
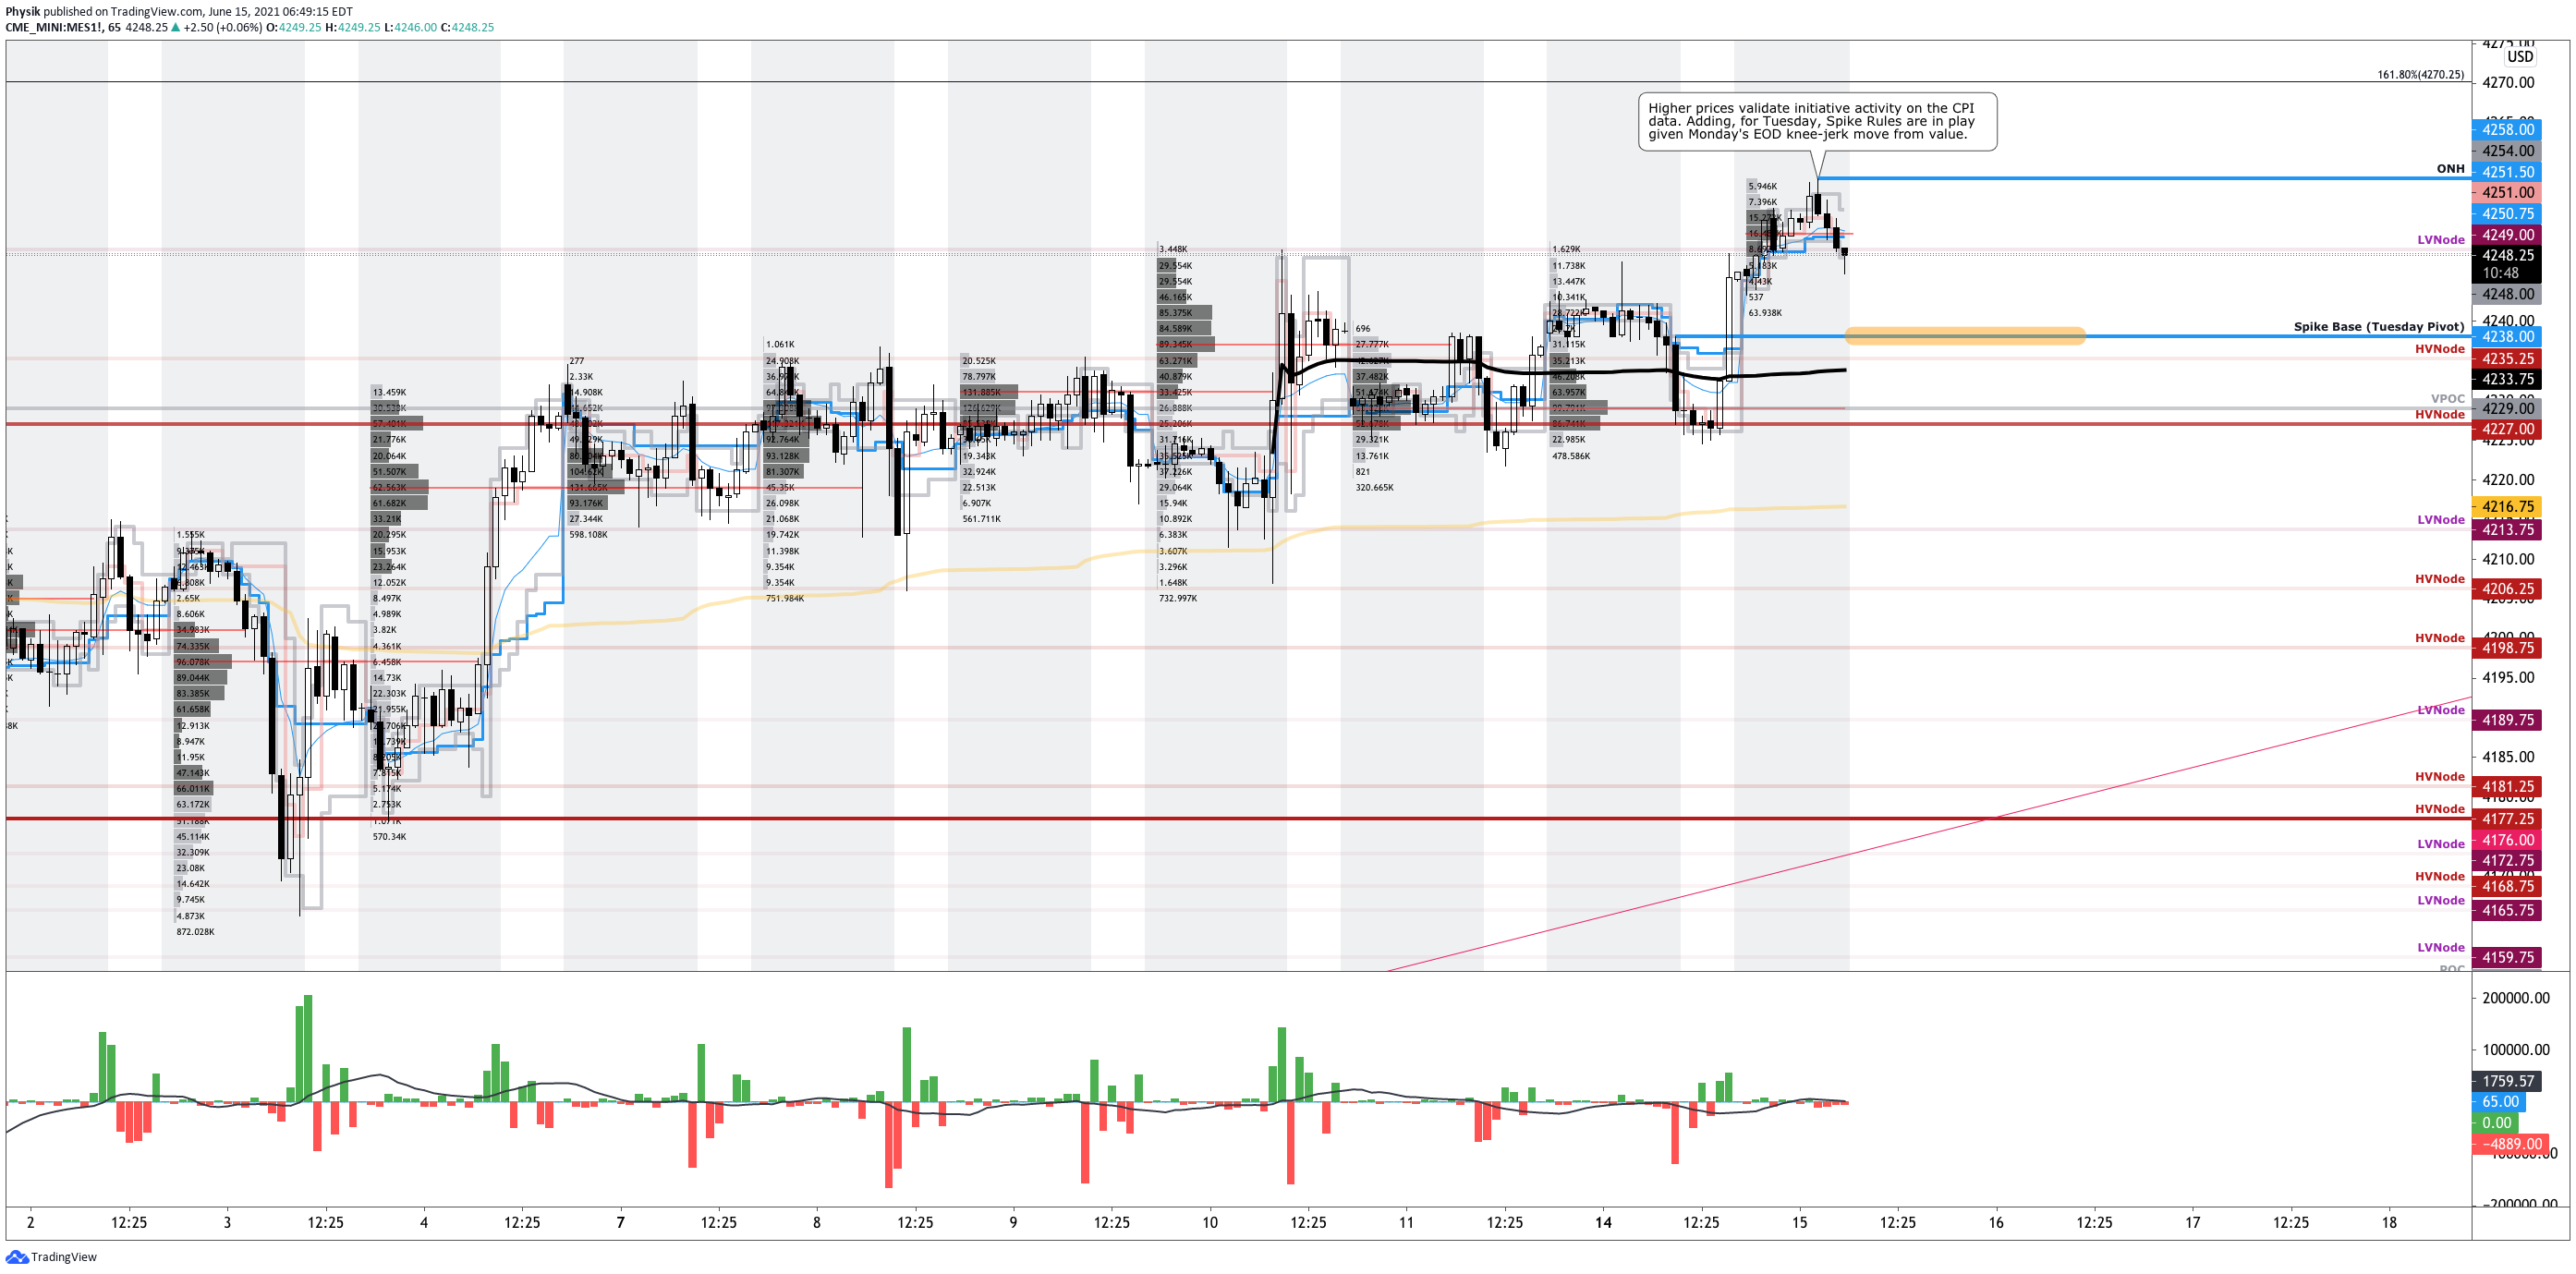
Adding, during the prior day’s regular trade, the worst-case outcome occurred, evidenced by a liquidation break that found acceptance below the $4,238.00 spike base. That is significant because it negated the knee-jerk, end-of-day bullishness of Monday’s session.
Liquidation Breaks: The profile shape suggests participants were “too” long and had poor location. This corrective activity enables favorable entry and exit.

Spikes: Spike’s mark the beginning of a break from value. Spikes higher (lower) are validated by trade at or above (below) the spike base (i.e., the origin of the spike).
Further, for today, participants can trade from the following frameworks.
In the best case, the S&P 500 trades sideways or higher; activity above the $4,234.25 high volume area (HVNode), which corresponds with the average price bought and sold (via the VWAP) since consumer price data was released last week, puts in play the $4,249.00 low volume area (LVNode). Initiative trade beyond the LVNode could reach as high as the $4,258.00 overnight high (ONH) and $4,270.25 Fibonacci price extension.
Volume Areas: A structurally sound market will build on past areas of high volume. Should the market trend for long periods of time, it will lack sound structure (identified as a low volume area which denotes directional conviction and ought to offer support on any test).

If participants were to auction and find acceptance into areas of prior low volume, then future discovery ought to be volatile and quick as participants look to areas of high volume for favorable entry or exit.

Volume Weighed Average Price (VWAP): The average price at which a stock is traded over a certain horizon.

Overnight Rally Highs (Lows): Typically, there is a low historical probability associated with overnight rally-highs (lows) ending the upside (downside) discovery process.
In the worst case, the S&P 500 trades lower; activity below the $4,234.25 HVNode suggests caution. It is likely participants will trade to the $4,227.75 HVNode. Thereafter, depending on how participants respond to a test of the HVNode, if lower, the $4,213.75 LVNode and balance area low (BAL) come into play, first. Initiating below the BAL is bearish. In that instance, if selling is aggressive, the $4,177.25 HVNode is in play.
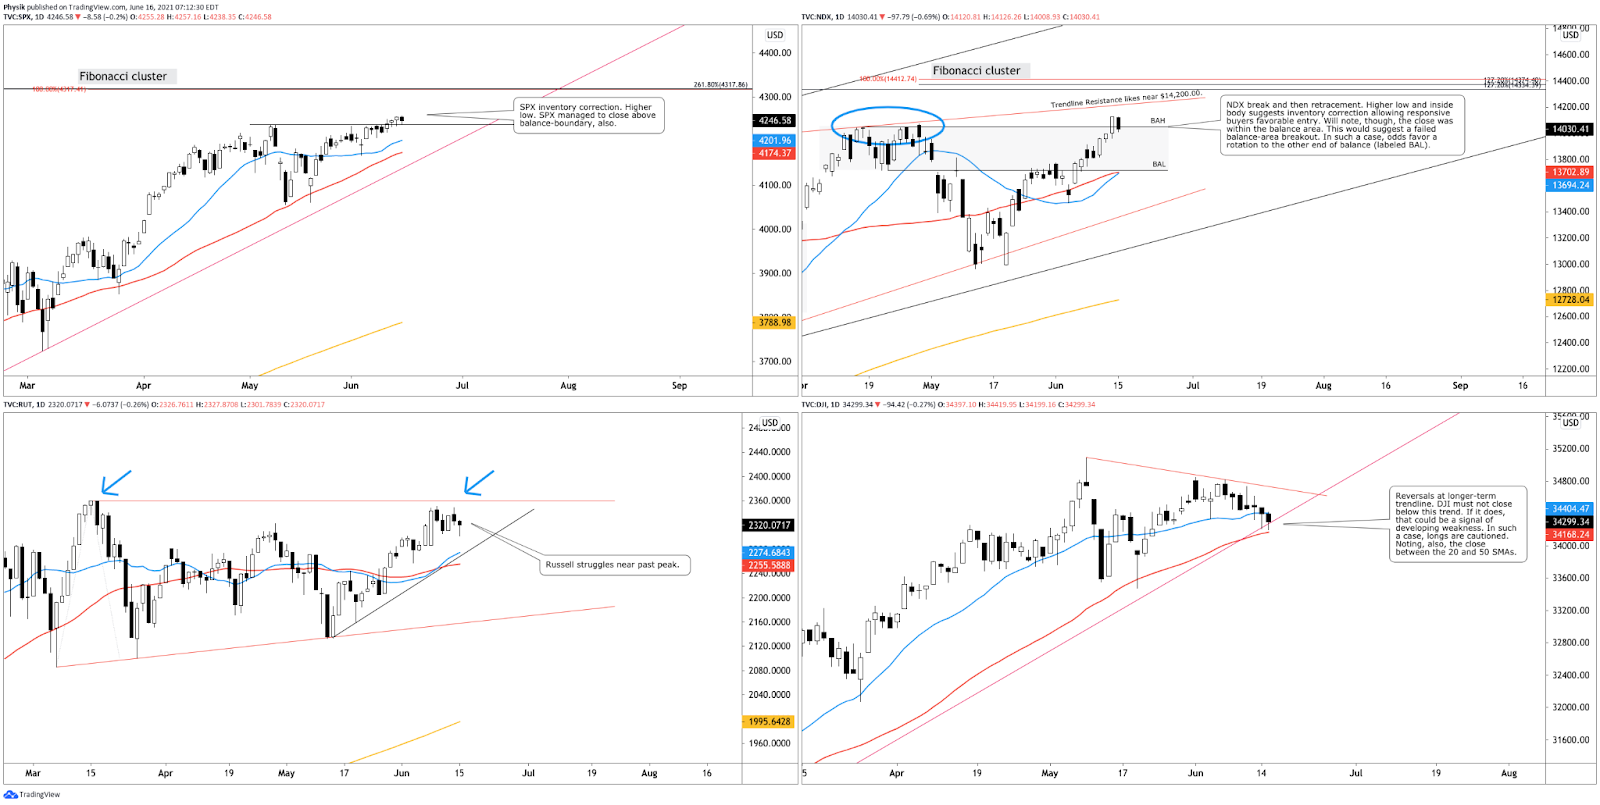
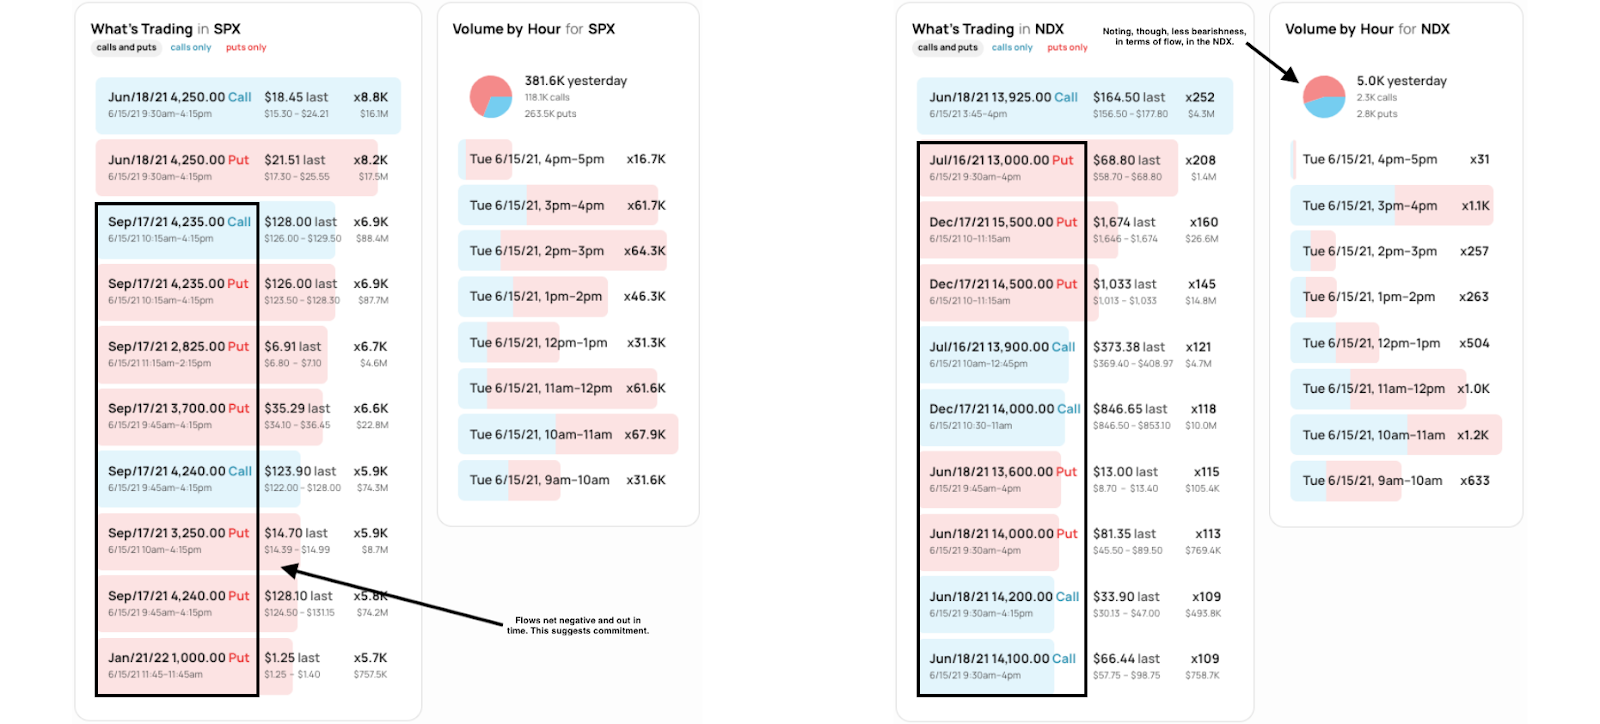
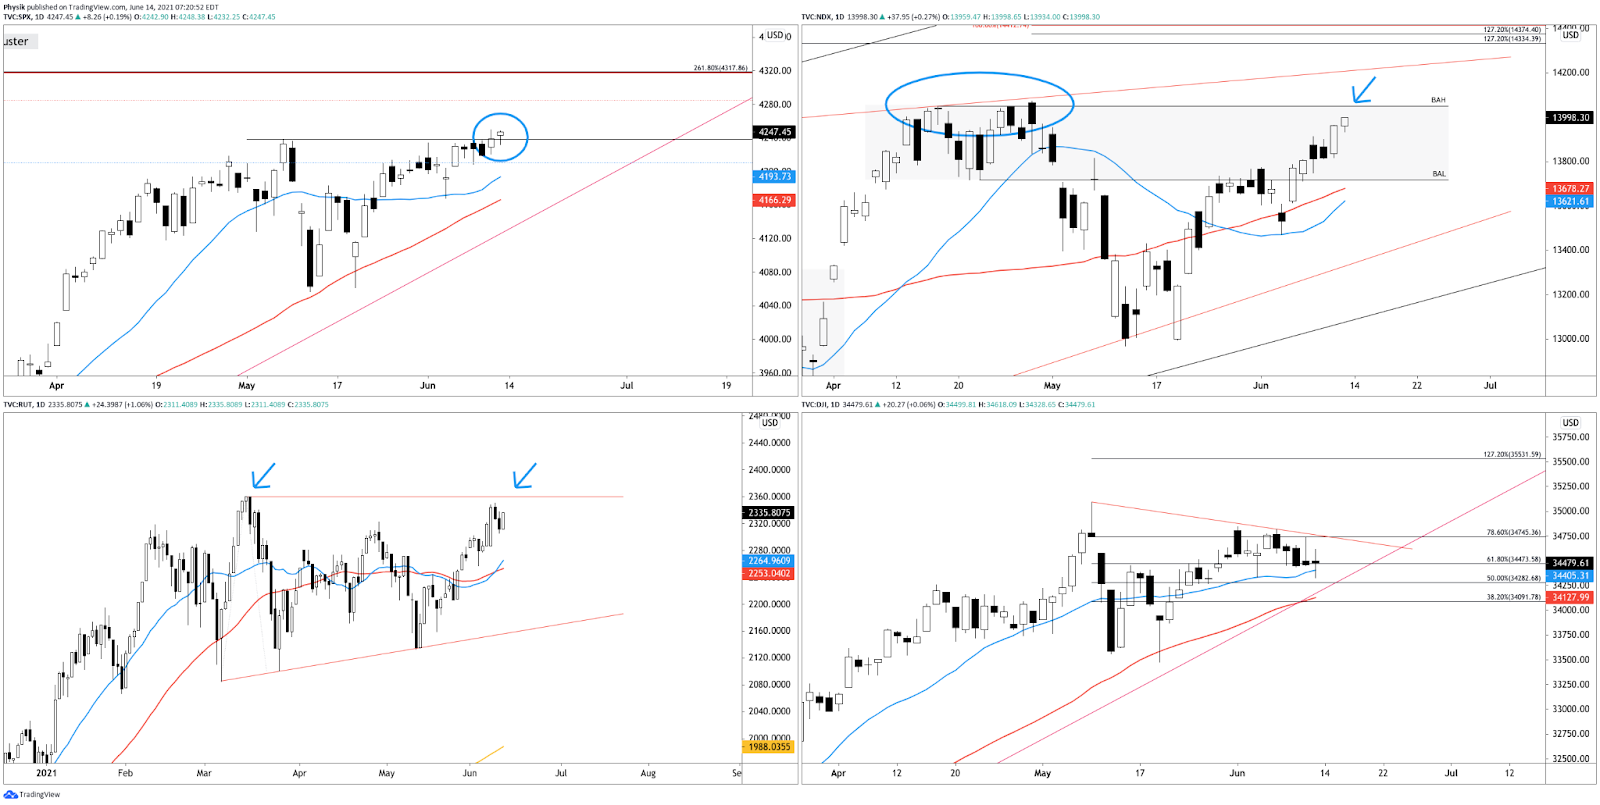
Graphic: 65-minute profile chart of the Micro E-mini S&P 500 Futures.Graphic: Daily candlestick charts of the S&P 500 (top left), Nasdaq 100 (top right), Russell 2000 (bottom left), and Dow Jones Industrial Average (bottom right). Important to monitor where the indices close, today. Above balance high or trend, bullish. Below, that’s near-term bearish.Graphic: SHIFT search suggests participants were most interested in put strikes at and below current prices in the cash-settled S&P 500 Index (INDEX: SPX) and Nasdaq 100 Index (INDEX: NDX), yesterday.
Economy | China’s economic data disappoints as spending lags. (BBG)
Politics | Disagreements, low expectations as Biden and Putin meet. (REU)
Economy | U.S. retail sales drop, hinting at shift to services spend. (BBG)
Politics | China’s government made warning. Planes fly over Taiwan. (Axios)
Markets | Citi is latest to warn of bigger-than-expected trading drop. (BBG)
What People Are Saying
When gamma is squeezed, unlike oranges, you can put the juice back in.
On Monday traders pile into Friday calls, which squeezes things into Wed. By Thursday calls bleed out, pressuring the stocks "unsqueezing" into Friday expiry.$AMC: 60% of gamma & >200k ITM calls exp 6/18 pic.twitter.com/4QPnw85Ggv
FOMC MENTAL PREP. I think the odds for high volatility are present. Tuesday's high is weak (within a single tick of Monday's high) with Monday's low being poor (no excess). In other words, no completion at either end of the two-day range. #ES_F#Futures$spy
FinTech | The big difference between a digital dollar and a CBDC. (BBG)
Markets | Everyone’s a rising star when debt is relatively cheap. (BBG)
Markets | Well-behaved bubbles often make history. An analysis. (a16z)
Markets | The latest blow to 60/40 model is an exodus of pensions. (BBG)
COVID | How prior coronavirus infections factor into herd immunity. (Axios)
Travel | You’ll soon be able to use your iPhone as ID at the airport. (Verge)
FinTech | Exchanges are looking to accelerate their cloud adoption. (TM)
About
Renato founded Physik Invest after going through years of self-education, strategy development, and trial-and-error. His work reporting in the finance and technology space, interviewing leaders such as John Chambers, founder, and CEO, JC2 Ventures, Kevin O’Leary, businessman and Shark Tank host, Catherine Wood, CEO and CIO, ARK Invest, among others, afforded him the perspective and know-how very few come by.
Having worked in engineering and majored in economics, Renato is very detailed and analytical. His approach to the markets isn’t built on hope or guessing. Instead, he leverages the unique dynamics of time and volatility to efficiently act on opportunity.
Disclaimer
At this time, Physik Invest does not manage outside capital and is not licensed. In no way should the materials herein be construed as advice. Derivatives carry a substantial risk of loss. All content is for informational purposes only.
Index futures exit balance, discover higher prices.
The calm before the storm (FOMC).
Ahead: Production, PPI, retail sales.
Indices trade higher, then sideways.
What Happened: U.S. stock index futures traded higher ahead of key releases on U.S. industrial production, producer prices, and retail sales. Tomorrow, of bigger concern, is Wednesday’s Federal Open Market Committee (FOMC) rate decision.
As stated in Monday’s commentary, the FOMC will likely not change its forward guidance on interest rates or asset purchases. That’s according to Moody’s which noted: “The statement will likely strengthen the FOMC’s assessment of the acceleration in inflation and possibly mention the central bank has the tools to address inflation if needed. This would be an effort to keep long-term inflation expectations in check.”
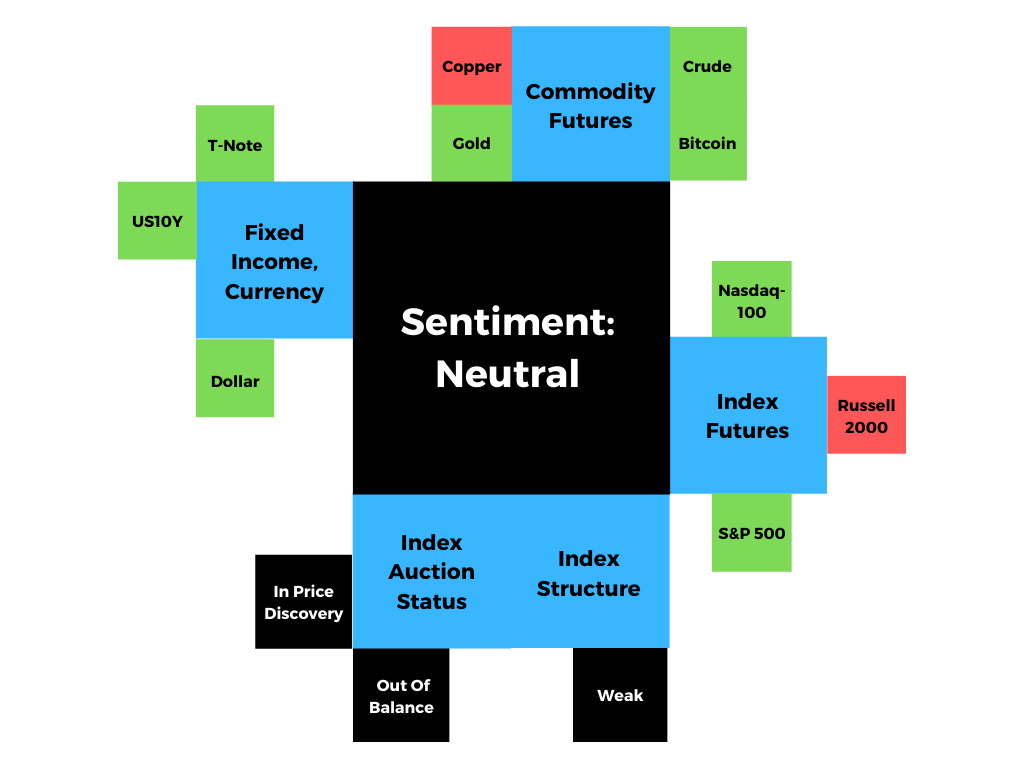
Graphic updated 6:43 AM ET.
What To Expect: Tuesday’s regular session (9:30 AM – 4:00 PM EST) in the S&P 500 may open just outside of prior-range and -value, suggesting a potential for immediate directional opportunity.
Adding, during the prior day’s regular trade, the best case outcome occurred, evidenced by initiative trade above the $4,249.00 minimal excess high.
Initiative Buying: Buying within or above the previous day’s value area.

Excess: A proper end to price discovery; the market travels too far while advertising prices. Responsive, other-timeframe (OTF) participants aggressively enter the market, leaving tails or gaps which denote unfair prices.
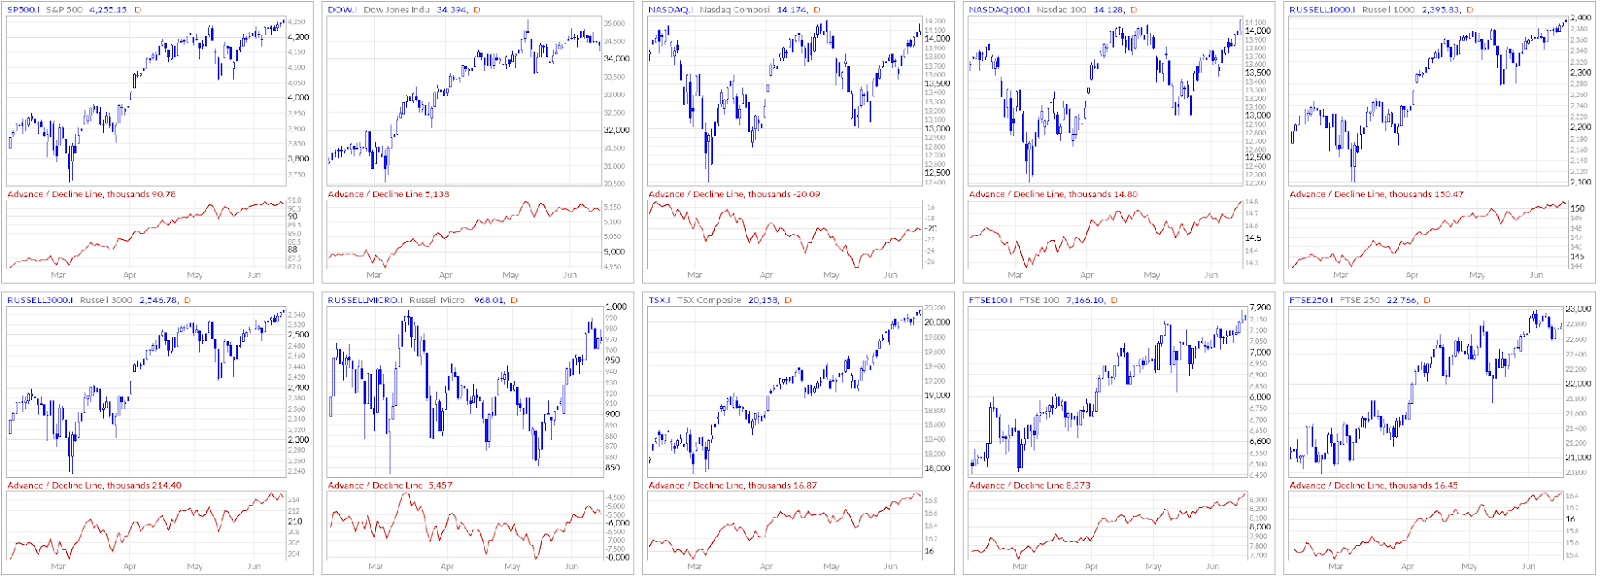
This move higher, across the broad market, comes as participants attempt to jack up prices in accordance with their views on issues like inflation, COVID-19, employment, supply chains, and more. Adding, measures of breadth indicate index constituents are participating.
Graphic: Advance/Decline Lines for broad market indices suggest breadth has improved, via MarketInOut.
On the other hand, metrics, such as S&P 500 skew – a measure of perceived tail risk and the chances of a black swan event – suggest participants are pricing the slope of implied volatility higher. At the same time, sentiment cooled and individual stock volatility rose.
Further, for today, participants can trade from the following frameworks.
In the best case, the S&P 500 trades sideways or higher; activity above the $4,238.00 spike base puts in play the $4,249.00 low volume area (LVNode). Initiative trade beyond the LVNode could reach as high as the $4,258.00 overnight high (ONH) and $4,270.25 Fibonacci price extension.
Spikes: Spike’s mark the beginning of a break from value. Spikes higher (lower) are validated by trade at or above (below) the spike base (i.e., the origin of the spike).

Volume Areas: A structurally sound market will build on past areas of high volume. Should the market trend for long periods of time, it will lack sound structure (identified as a low volume area which denotes directional conviction and ought to offer support on any test).

If participants were to auction and find acceptance into areas of prior low volume, then future discovery ought to be volatile and quick as participants look to areas of high volume for favorable entry or exit.

Overnight Rally Highs (Lows): Typically, there is a low historical probability associated with overnight rally-highs (lows) ending the upside (downside) discovery process.
In the worst case, the S&P 500 trades lower; activity below the $4,238.00 spike base puts in play the $4,229.00 point of control (POC). Thereafter, if lower than the $4,227.00 composite high volume area (HVNode), the $4,213.75 balance area low (BAL) comes into play.
POCs: POCs (like HVNodes described above) are valuable as they denote areas where two-sided trade was most prevalent. Participants will respond to future tests of value as they offer favorable entry and exit.
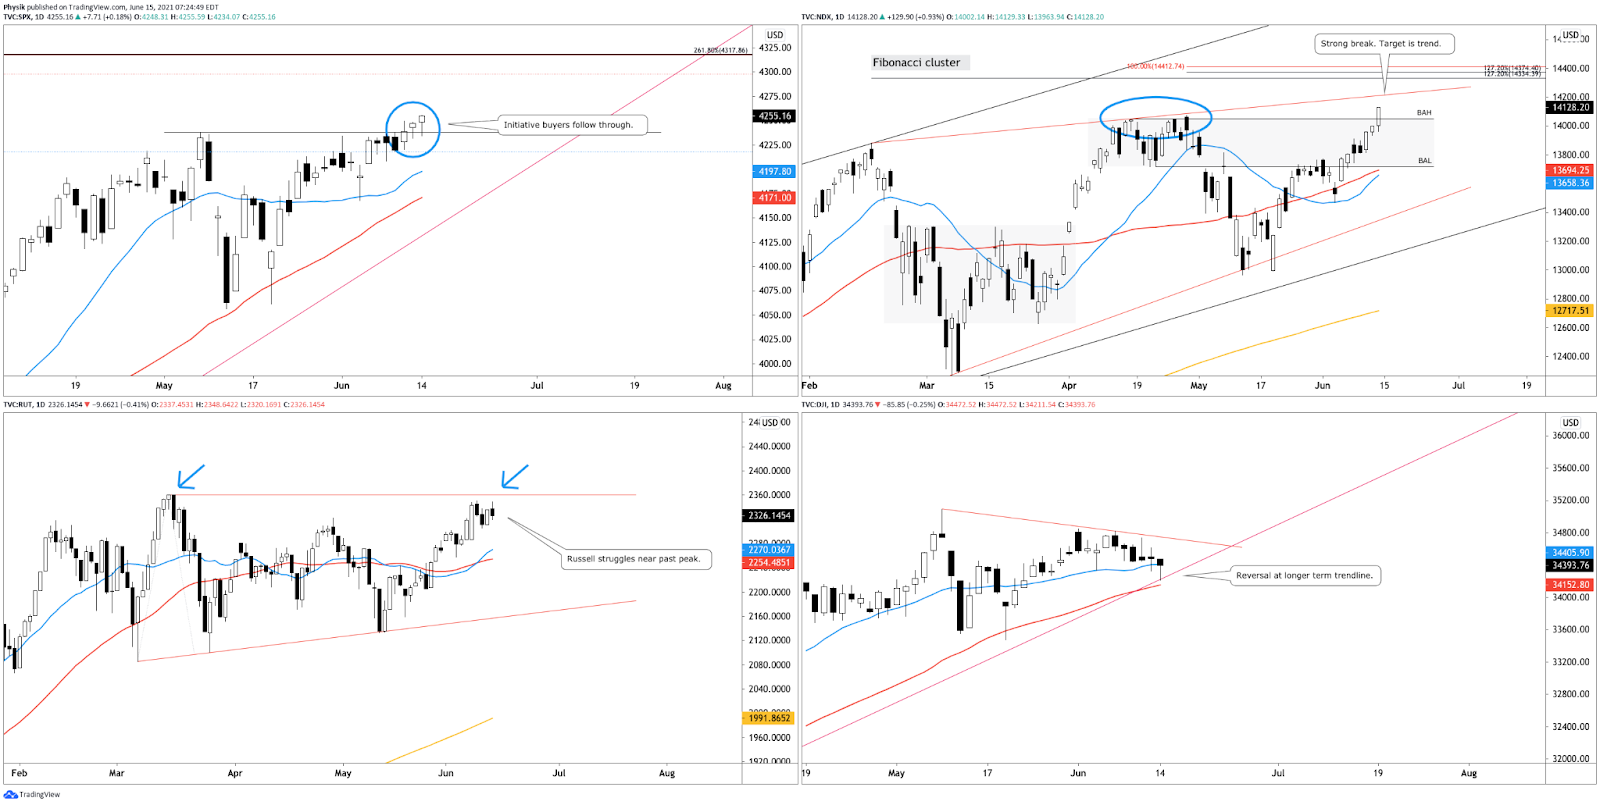
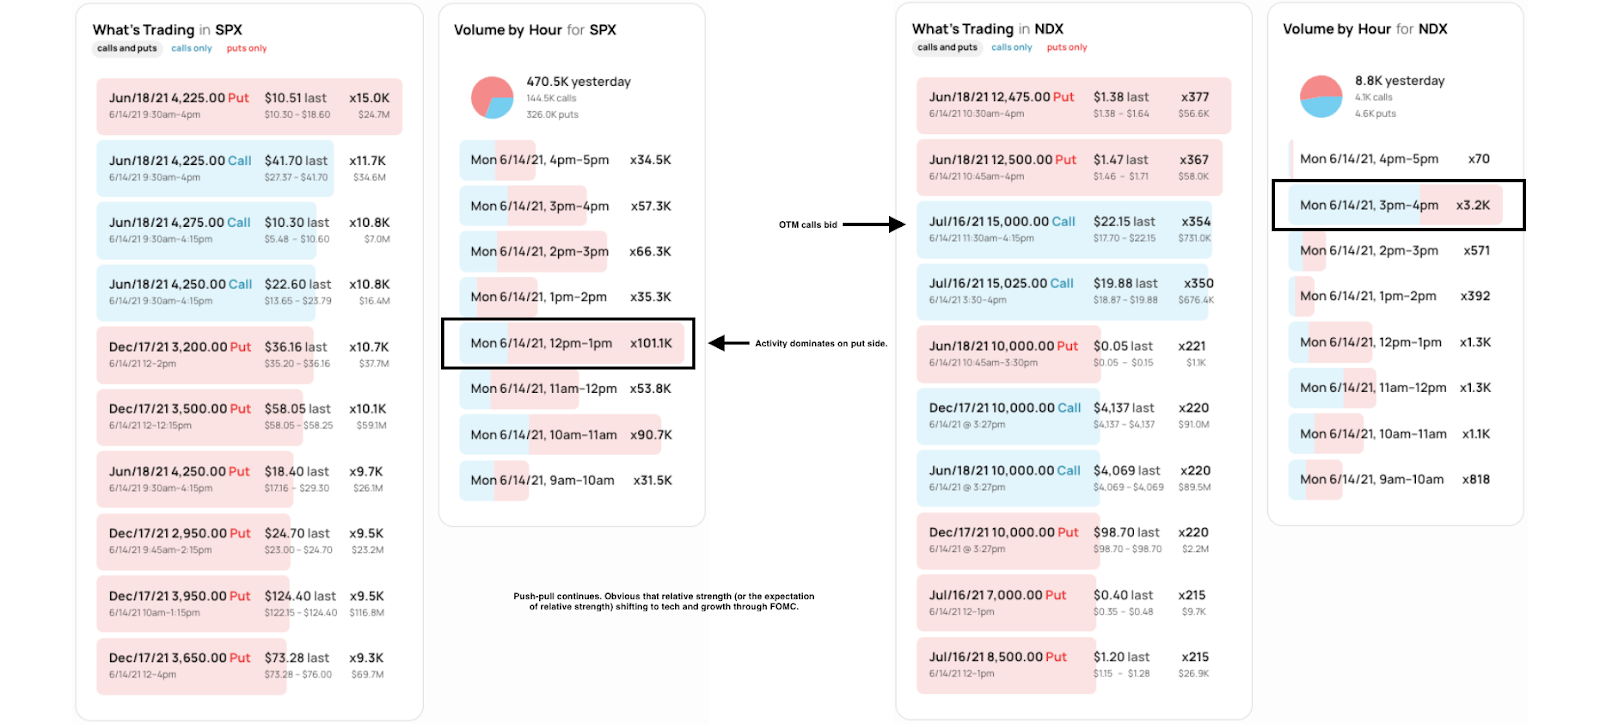
Graphic: 65-minute profile chart of the Micro E-mini S&P 500 Futures.Graphic: Daily candlestick charts of the S&P 500 (top left), Nasdaq 100 (top right), Russell 2000 (bottom left), and Dow Jones Industrial Average (bottom right). The S&P 500 and Nasdaq 100 follow-through on breakouts. Russell struggles with past peaks. Dow puts in reversal candle at a longer-term trendline.Graphic: SHIFT search suggests participants were most interested in put strikes at and below in the cash-settled S&P 500 Index (INDEX: SPX), Monday. The same is true for the cash-settled Nasdaq 100 Index (INDEX: NDX). Note, however, a bid in far out-of-the-money calls on Nasdaq, through FOMC. This activity supports a rotation back into technology and growth, possibly.
News And Analysis
Politics | China calling U.S. ill after Biden rallies G-7 against Beijing. (BBG)
Politics | EU, U.S. agree to a five-year truce on Boeing-Airbus trade. (BBG)
Economy | EU is set to lift travel curbs for U.S. residents this week. (BBG)
Politics | House antitrust bills taking a tight aim at technology giants. (Axios)
Economy | Dimon said JPMorgan hoarding cash due to inflation. (CNBC)
What People Are Saying
More of an affirmation that upside negative gamma exposure offers a ton of opportunities right now (when searching long delta) especially when it’s coupled with the fact that call side skew will naturally be underpriced with the systematic overwriting suppressing Vols. https://t.co/eS7vvGu1VH
$SKEW at record highs. 10 day MA of the $PCALL at record lows. And $IYT (transports) rolling over. Overall a solid week to ease out of longs, go to cash and start looking for short signals.
Politics | White House releases national strategy for domestic terror. (Axios)
FinTech | Mark Cuban suggesting ‘banks should be scared’ of DeFi. (CNBC)
Economy | The bubbliest housing markets flash 2008-type warnings. (BBG)
FinTech | Bitcoin’s most significant code improvement was approved. (Axios)
About
Renato founded Physik Invest after going through years of self-education, strategy development, and trial-and-error. His work reporting in the finance and technology space, interviewing leaders such as John Chambers, founder, and CEO, JC2 Ventures, Kevin O’Leary, businessman and Shark Tank host, Catherine Wood, CEO and CIO, ARK Invest, among others, afforded him the perspective and know-how very few come by.
Having worked in engineering and majored in economics, Renato is very detailed and analytical. His approach to the markets isn’t built on hope or guessing. Instead, he leverages the unique dynamics of time and volatility to efficiently act on opportunity.
Disclaimer
At this time, Physik Invest does not manage outside capital and is not licensed. In no way should the materials herein be construed as advice. Derivatives carry a substantial risk of loss. All content is for informational purposes only.
Index futures balance and attempt to discover higher prices.
Ahead: Fed 2-day policy meeting.
Indexes trade sideways to higher.
What Happened: U.S. stock index futures auctioned sideways-to-higher, ahead of an impactful Federal Reserve policy meeting.
Further, it is likely that cost-push inflation will be the main driver of inflation into next year. That is according to Moody’s which suggests the Fed is betting on this, too. If wrong, however, it would be due to a wage-price spiral which is still unlikely to occur given that the economy is not near full employment.
Adding, the Federal Open Market Committee (FOMC) will likely not change its forward guidance on interest rates or asset purchases; “The statement will likely strengthen the FOMC’s assessment of the acceleration in inflation and possibly mention the central bank has the tools to address inflation if needed. This would be an effort to keep long-term inflation expectations in check.”
Graphic updated 6:51 AM ET.
What To Expect: Monday’s regular session (9:30 AM – 4:00 PM EST) in the S&P 500 may open just outside of prior-range and -value, suggesting the potential for immediate directional opportunity.
Adding, during the prior day’s regular trade, the best case outcome occurred, evidenced by initiative trade above the $4,227.00 high volume area (HVNode). This is significant because that particular level marks a pivot (i.e., above = bullish, below = bearish) on the composite profile.
Volume Areas: A structurally sound market will build on past areas of high volume. Should the market trend for long periods of time, it will lack sound structure (identified as a low volume area which denotes directional conviction and ought to offer support on any test).

If participants were to auction and find acceptance into areas of prior low volume, then future discovery ought to be volatile and quick as participants look to areas of high volume for favorable entry or exit.
Further, for today, participants can trade from the following frameworks.
In the best case, the S&P 500 trades sideways or higher; activity above the $4,239.50 regular trade high puts in play the $4,249.00 minimal excess high. Initiative trade beyond that figure could reach as high as the $4,270.00 161.80% Fibonacci price extension and $4,294.75 127.20% extension.
Excess: A proper end to price discovery; the market travels too far while advertising prices. Responsive, other-timeframe (OTF) participants aggressively enter the market, leaving tails or gaps which denote unfair prices.
In the worst case, the S&P 500 trades sideways or lower; activity below the $4,239.50 puts in play the HVNode pivot at $4,227.00. If lower, the $4,213.75 low volume area (LVNode) comes into play first. Thereafter, participants ought to look for responses at the $4,206.25, $4,198.75, and $4,177.25 HVNodes.
Graphic: 65-minute profile chart of the Micro E-mini S&P 500 Futures.Graphic: Daily candlestick charts of the S&P 500 (top left), Nasdaq 100 (top right), Russell 2000 (bottom left), and Dow Jones Industrial Average (bottom right). Note where each index is trading in relation to resistance.Graphic: SHIFT search suggests participants were most interested in put strikes at and below current prices in the larger cash-settled S&P 500 Index (INDEX: SPX) and Nasdaq 100 Index (INDEX: NDX), last week.
News And Analysis
Economy | Goldman: ‘Too big to fail’ may not apply in China anymore. (BBG)
Economy | U.K.’s Johnson set to announce a delay to end restrictions. (REU)
Fear is the #1 killer for traders. For me-fear leads to outcome based trading, trading my P&L not my process. I believe one main reason 90+% of us fail is we think the answer is external(more or better info), it is & will be internal. What fear is creating pressure that hurts us?
Each Friday night, we highlight swing candidates from Accumulator charts. Users then look to the fundamentals on these issues before taking a position. The chart isn't the only reason to consider a position.$HD has a good upside range potential. pic.twitter.com/hKF3LEWxLV
1/x The $15 Monday SPX straddle, & even more so $31.5 6/16 SPX Fed straddle should tell U everything U need to know. Dealers are saddled w/more🍌’s than U could possibly imagine. The PAIN trade is more of the ‘Summer of George.’ If only someone had warned us all 2 weeks ago!!!😉 https://t.co/pRH0Z2i91bpic.twitter.com/M9umTm5QeS
Economy | Americans hoarded money to survive during the pandemic. (BBG)
Markets | Market veterans are mourning the slow death of historic pits. (FT)
FinTech | Investors are craving more of the payments company Stripe. (WSJ)
Economy | A great resignation wave could be coming for companies. (Axios)
About
Renato founded Physik Invest after going through years of self-education, strategy development, and trial-and-error. His work reporting in the finance and technology space, interviewing leaders such as John Chambers, founder, and CEO, JC2 Ventures, Kevin O’Leary, businessman and Shark Tank host, Catherine Wood, CEO and CIO, ARK Invest, among others, afforded him the perspective and know-how very few come by.
Having worked in engineering and majored in economics, Renato is very detailed and analytical. His approach to the markets isn’t built on hope or guessing. Instead, he leverages the unique dynamics of time and volatility to efficiently act on opportunity.
Disclaimer
At this time, Physik Invest does not manage outside capital and is not licensed. In no way should the materials herein be construed as advice. Derivatives carry a substantial risk of loss. All content is for informational purposes only.
Key Takeaways: Index futures exit balance, attempt to discover higher prices.
One big thing: Inflation temporary.
Ahead: FOMC 2-day rate meeting.
Indices were divergent but higher.
What Happened: Last week, the movement was both volatile and mechanical, halting short of key visual references.
This technically-driven trade denotes a lack of interest by institutional participants, at record highs; supply chain uncertainties and rising inflation, fiscal and monetary tightening, COVID-19 concerns, political risks, employment, and the like, are some of the emerging concerns larger participants have been looking to price in.
Further, on Thursday, participants were provided more clarity on the hot topic of inflation.
Why is inflation such a hot topic? In short, as described in prior commentaries, inflation and rates move inversely to each other. Low rates stimulate demand for loans (i.e., borrowing money is more attractive). With the rapid recovery, though, market participants were fearful that rates would rise to protect the economy from overheating.
Higher rates have the potential to reduce the present value of future earnings, making stocks, especially those that are high growth, less attractive.
Further, despite hot prices, consumer price index (CPI) data, Thursday, suggested inflation would be temporary. Thereafter, U.S. stock index futures broke balance, and rates on the 10 Year T-Note went lower as participants now thought it was more likely the Federal Reserve would maintain its easy monetary policy.
Coinciding with that breakdown in yields, the Nasdaq 100 and Russell 2000 ended the week strong while the S&P 500 and Dow Jones Industrial Average traded relatively weak, taking back Thursday’s vertical price rise on the CPI number.
Notwithstanding, there has been an inclination to talk taper.
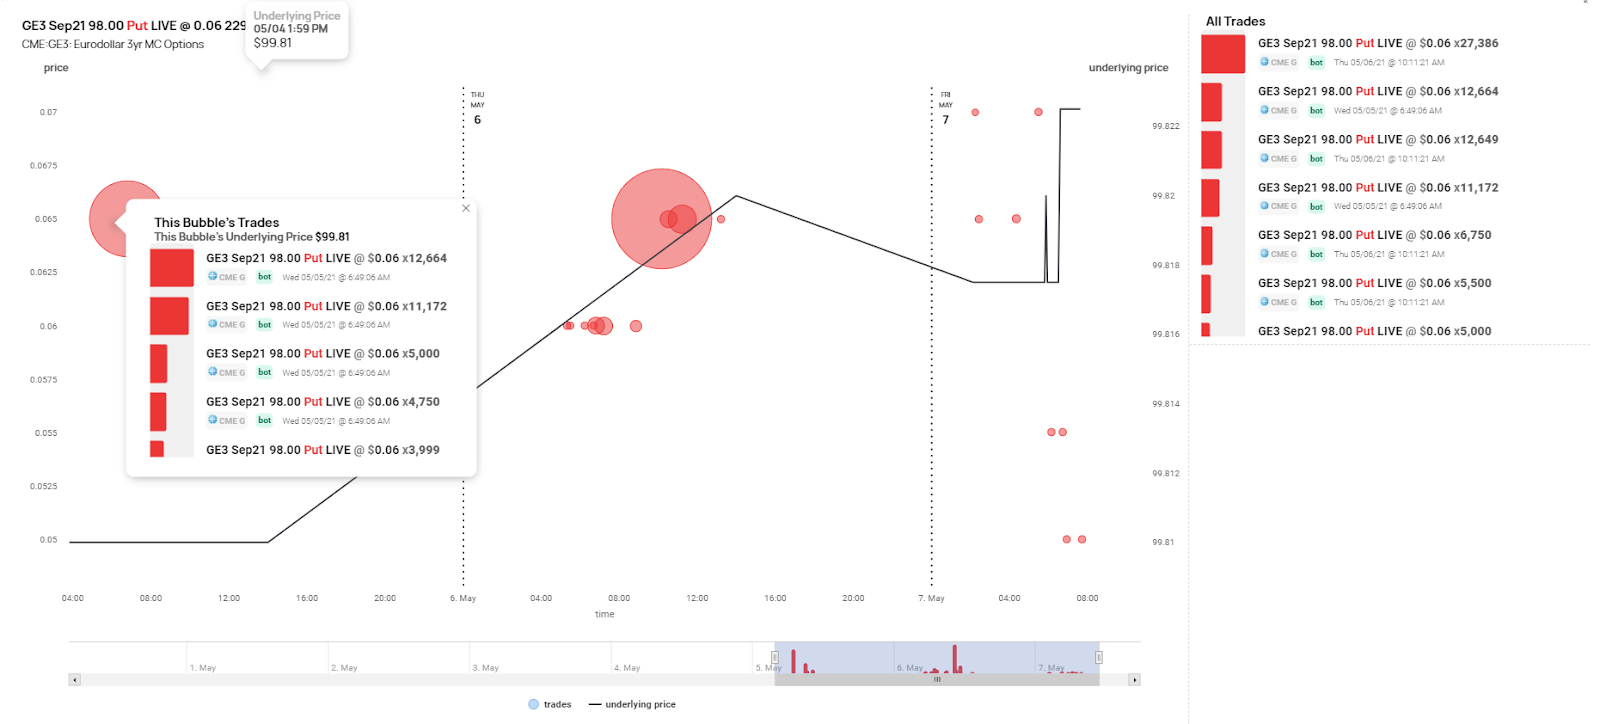
This was evidenced by some big option bets, earlier this year; of interest was one Eurodollar bet – carrying a notional value of $40 billion – focused on a potential surprise at the Jackson Hole symposium, used in the past to signal policy changes.
Graphic: Eurodollar bet on SHIFT’s institutional platform. The purchase of 98.00 strike put options suggested traders were looking to add “two Fed hikes to [current] expectations.”
In a statement, Grant Thornton chief economist Diane Swonk said that despite investors not fearing an immediate change in course on monetary policy, inflation has surprised and will likely be the basis for taper talk at Jackson Hole, later this year.
“I always expected tapering talk to begin more openly at the Jackson Hole meeting. It hasn’t changed my view. Some people thought the Fed would get closer to full employment before they did liftoff on tapering,” Swonk said.
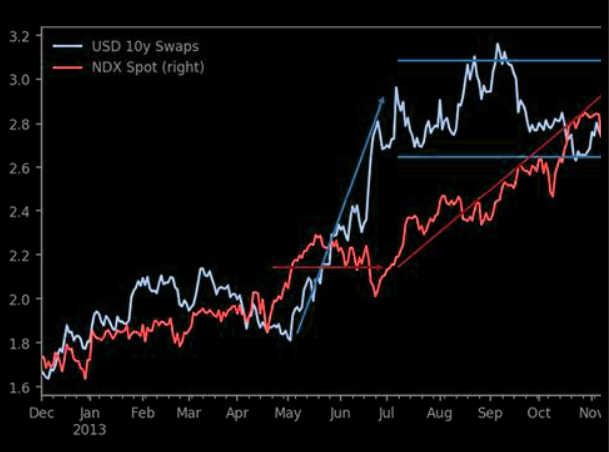
In terms of the impact on equities, looking back, according to The Market Ear, even during the so-called Taper Tantrum, in the early 2010s, rates settled in a wide range, and equities rallied big.
Graphic: Nasdaq 100 rallies in 2013 after rates settle in a wide range, via The Market Ear.
Moreover, next week is a large monthly options expiration (OPEX). This is noteworthy because option expiries mark an end to pinning (i.e, the theory that market makers and institutions short options move stocks to the point where the greatest dollar value of contracts will expire worthless) and the reduction dealer gamma exposure.
Options: If an option buyer was short (long) stock, he or she would buy a call (put) to hedge upside (downside) exposure. Option buyers can also use options as an efficient way to gain directional exposure.

Gamma: The sensitivity of an option to changes in the underlying price. Dealers that take the other side of options trades hedge their exposure to risk by buying and selling the underlying. When dealers are short-gamma, they hedge by buying into strength and selling into weakness. When dealers are long-gamma, they hedge by selling into strength and buying into weakness. The former exacerbates volatility. The latter calms volatility.
Aside from the Fed meeting and OPEX, some outlier risks remain; with VIX spreads at their lows, S&P 500 skew – a measure of perceived tail risk and the chances of a black swan event – rose dramatically over the past few weeks. At the same time, sentiment cooled considerably, while individual stock volatility increased the potential for another meme stock de-risking event.
What To Expect: In the coming sessions, participants will want to focus their attention on where the S&P 500 trades in relation to the $4,227.00 high volume area (HVNode), a pivot on the composite profile.
Volume Areas: A structurally sound market will build on past areas of high volume. Should the market trend for long periods of time, it will lack sound structure (identified as a low volume area which denotes directional conviction and ought to offer support on any test).

If participants were to auction and find acceptance into areas of prior low volume, then future discovery ought to be volatile and quick as participants look to areas of high volume for favorable entry or exit.
Given the minimal excess high at $4,249.00, as well as the subsequent liquidation – a typical response – and lower value, participants can trade from the following frameworks.
Excess: A proper end to price discovery; the market travels too far while advertising prices. Responsive, other-timeframe (OTF) participants aggressively enter the market, leaving tails or gaps which denote unfair prices.
Like Friday, in the best case, the S&P 500 trades sideways or higher; activity above the $4,227.00 high volume area (HVNode) puts in play the $4,249.00 minimal excess high. Initiative trade beyond that figure could reach as high as the $4,270.00 161.80% Fibonacci price extension and $4,294.75 127.20% extension.
In the worst case, the S&P 500 trades lower; activity below the $4,227.00 HVNode confirms a failed balance-area breakout. In such a case, the $4,213.75 low volume area (LVNode) comes into play first. Thereafter, if lower, participants ought to look for responses at the $4,206.25, $4,198.75, and $4,177.25 HVNodes.
Graphic: 4-hour profile chart of the Micro E-mini S&P 500 Futures.Graphic: Weekly candlestick charts of the S&P 500 (top left), Nasdaq 100 (top right), Russell 2000 (bottom left), and Dow Jones Industrial Average (bottom right). Note the weakness in the S&P 500 and Dow Jones Industrial Average. Graphic: SHIFT search suggests participants were most interested in put strikes at and below current prices in the larger cash-settled S&P 500 Index (INDEX: SPX) and Nasdaq 100 Index (INDEX: NDX), last week.
Politics | Biden’s China policy emerging – and it looks like Trump’s. (WSJ)
What People Are Saying
1/2 As Western Democracies are forced to confront the increased success/influence of China’s centralized gov’t, US Democracy has become increasingly dysfunctional…‘We’ve always had elections every 2 yrs, any of which could change the party in control of the Senate, House, &/or
Technical analysis is often frowned upon by the quant land but there are times where it becomes significantly relevant as it almost acts as a self fulfilling prophecy.
I believe the application of this is actually relevant in the crypto space right now.
Venture | Funding, new unicorns, exits continue at a strong pace. (CB)
FinTech | G-7 dialogue on crypto to hasten the disintermediation. (Moody’s)
Trading | How to keep the gamma squeeze going with put sales. (SG)
Aviation | In aviation, the revolution likely will not be supersonic. (WSJ)
About
Renato founded Physik Invest after going through years of self-education, strategy development, and trial-and-error. His work reporting in the finance and technology space, interviewing leaders such as John Chambers, founder, and CEO, JC2 Ventures, Kevin O’Leary, businessman and Shark Tank host, Catherine Wood, CEO and CIO, ARK Invest, among others, afforded him the perspective and know-how very few come by.
Having worked in engineering and majored in economics, Renato is very detailed and analytical. His approach to the markets isn’t built on hope or guessing. Instead, he leverages the unique dynamics of time and volatility to efficiently act on opportunity.
Disclaimer
At this time, Physik Invest does not manage outside capital and is not licensed. In no way should the materials herein be construed as advice. Derivatives carry a substantial risk of loss. All content is for informational purposes only.
A lot of new subscribers this week in light of Physik Invest’s webinar with Benzinga. If you want access to the slides presented, click here.
Additionally, I am honored for your decision to follow along and will do my best to provide an objective, “no fluff” view into the who, what, when, where, why, and how in finance and technology.
Quick note, from May 25 to May 28, the daily newsletter will be off as I will be on a trip. It would not be fair for me to provide lackluster content since I won’t have all the tools at my disposal.
That said, I’ll try to be objective and concise in today’s note to ensure you have the proper direction for the volatile trade ahead.
What Happened: Last week, U.S. stock index futures auctioned sideways-to-higher, as participants looked to price in emerging dynamics with respect to rising inflation, fiscal and monetary tightening, COVID-19 concerns, political risks, and the like.
In pricing in these dynamics, the movement was both volatile and mechanical, halting short of key visual references suggesting the participants involved were short-term (i.e., technically driven) in nature.
Adding, amid this rotation, quite a bit of poor structure was cleaned up (i.e., low volume areas), but still, judging by a lack of excess at certain points on the composite volume profile, odds point to limited conviction and commitment.
Excess: A proper end to price discovery; the market travels too far while advertising prices. Responsive, other-timeframe (OTF) participants aggressively enter the market, leaving tails or gaps which denote unfair prices.
Holistically, equities are in a seasonally weak period. At the same time, inflation and uninspiring economic data are major worries investors are attempting to price in.
Just last week, the Federal Reserve’s minutes showed that some on the committee were interested in tapering discussions.
“It was a surprise to hear the talk about Fed tapering,” Joyce Chang, JPMorgan’s chair of global research, said. “The market had been thinking there might be a couple of months before you really saw this particular issue come into focus.”
Generally speaking, inflation and rates move inverse to each other. Low rates stimulate demand for loans (i.e., borrowing money more attractive). With the rapid recovery, though, market participants fear that rates will rise to protect the economy from overheating.
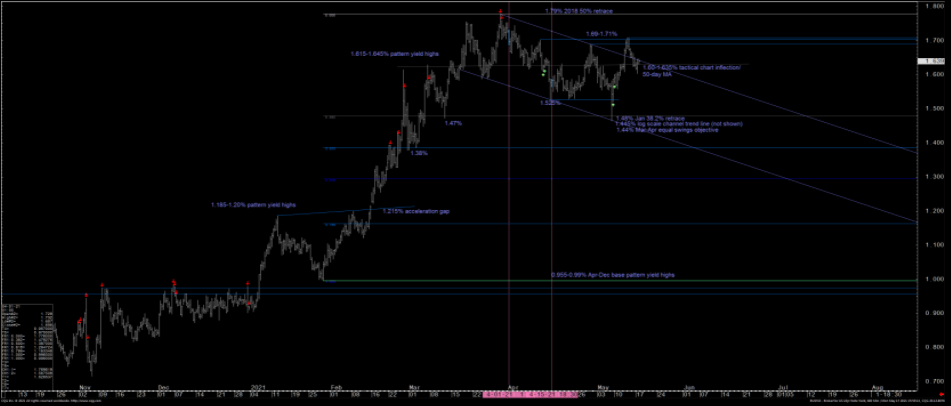
Higher rates have the potential to reduce the present value of future earnings, making stocks, especially those that are high growth, less attractive. To note, however, rates remain range-bound; rates on the 10 Year T-Note sit below their March high and are likely to continue higher, which the market may absorb.
Graphic: JPMorgan Chase & Co (NYSE: JPM) analysts believe yields on the 10-year note will stay rangebound before breaking higher this summer, via The Market Ear.
How may the market absorb a move higher in rates? Looking back, according to The Market Ear, during the so-called Taper Tantrum, in the early 2010s, rates settled in a wide range, and equities rallied big. Adding, research by JPMorgan Chase & Co (NYSE: JPM) suggests equities may be getting cheap with reflationary themes the go-to play, still.
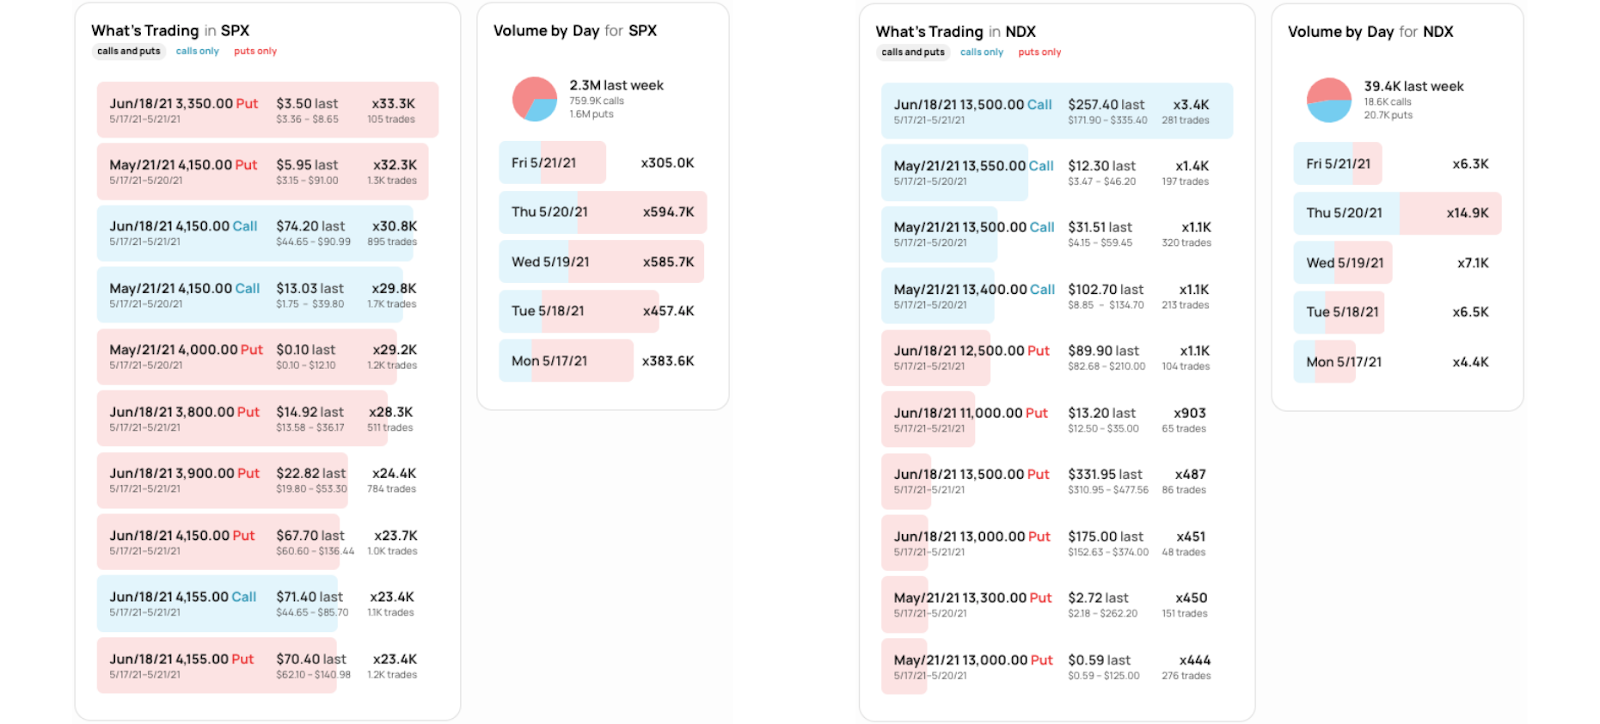
In support, during the May 19 reversal, in the S&P 500 and Nasdaq 100, participants increased exposure to the upside with relatively cheap, longer-dated calls.
Still, overall, the flows point to a lot of opportunistic hedging (see graphic below).
Graphic: SHIFT search suggests participants were most interested in put strikes at and below current prices in the cash-settled S&P 500 Index (INDEX: SPX) and Nasdaq 100 Index (INDEX: NDX), last week. To note, however, participants began paying up for longer-dated upside exposure (evidenced by call activity).
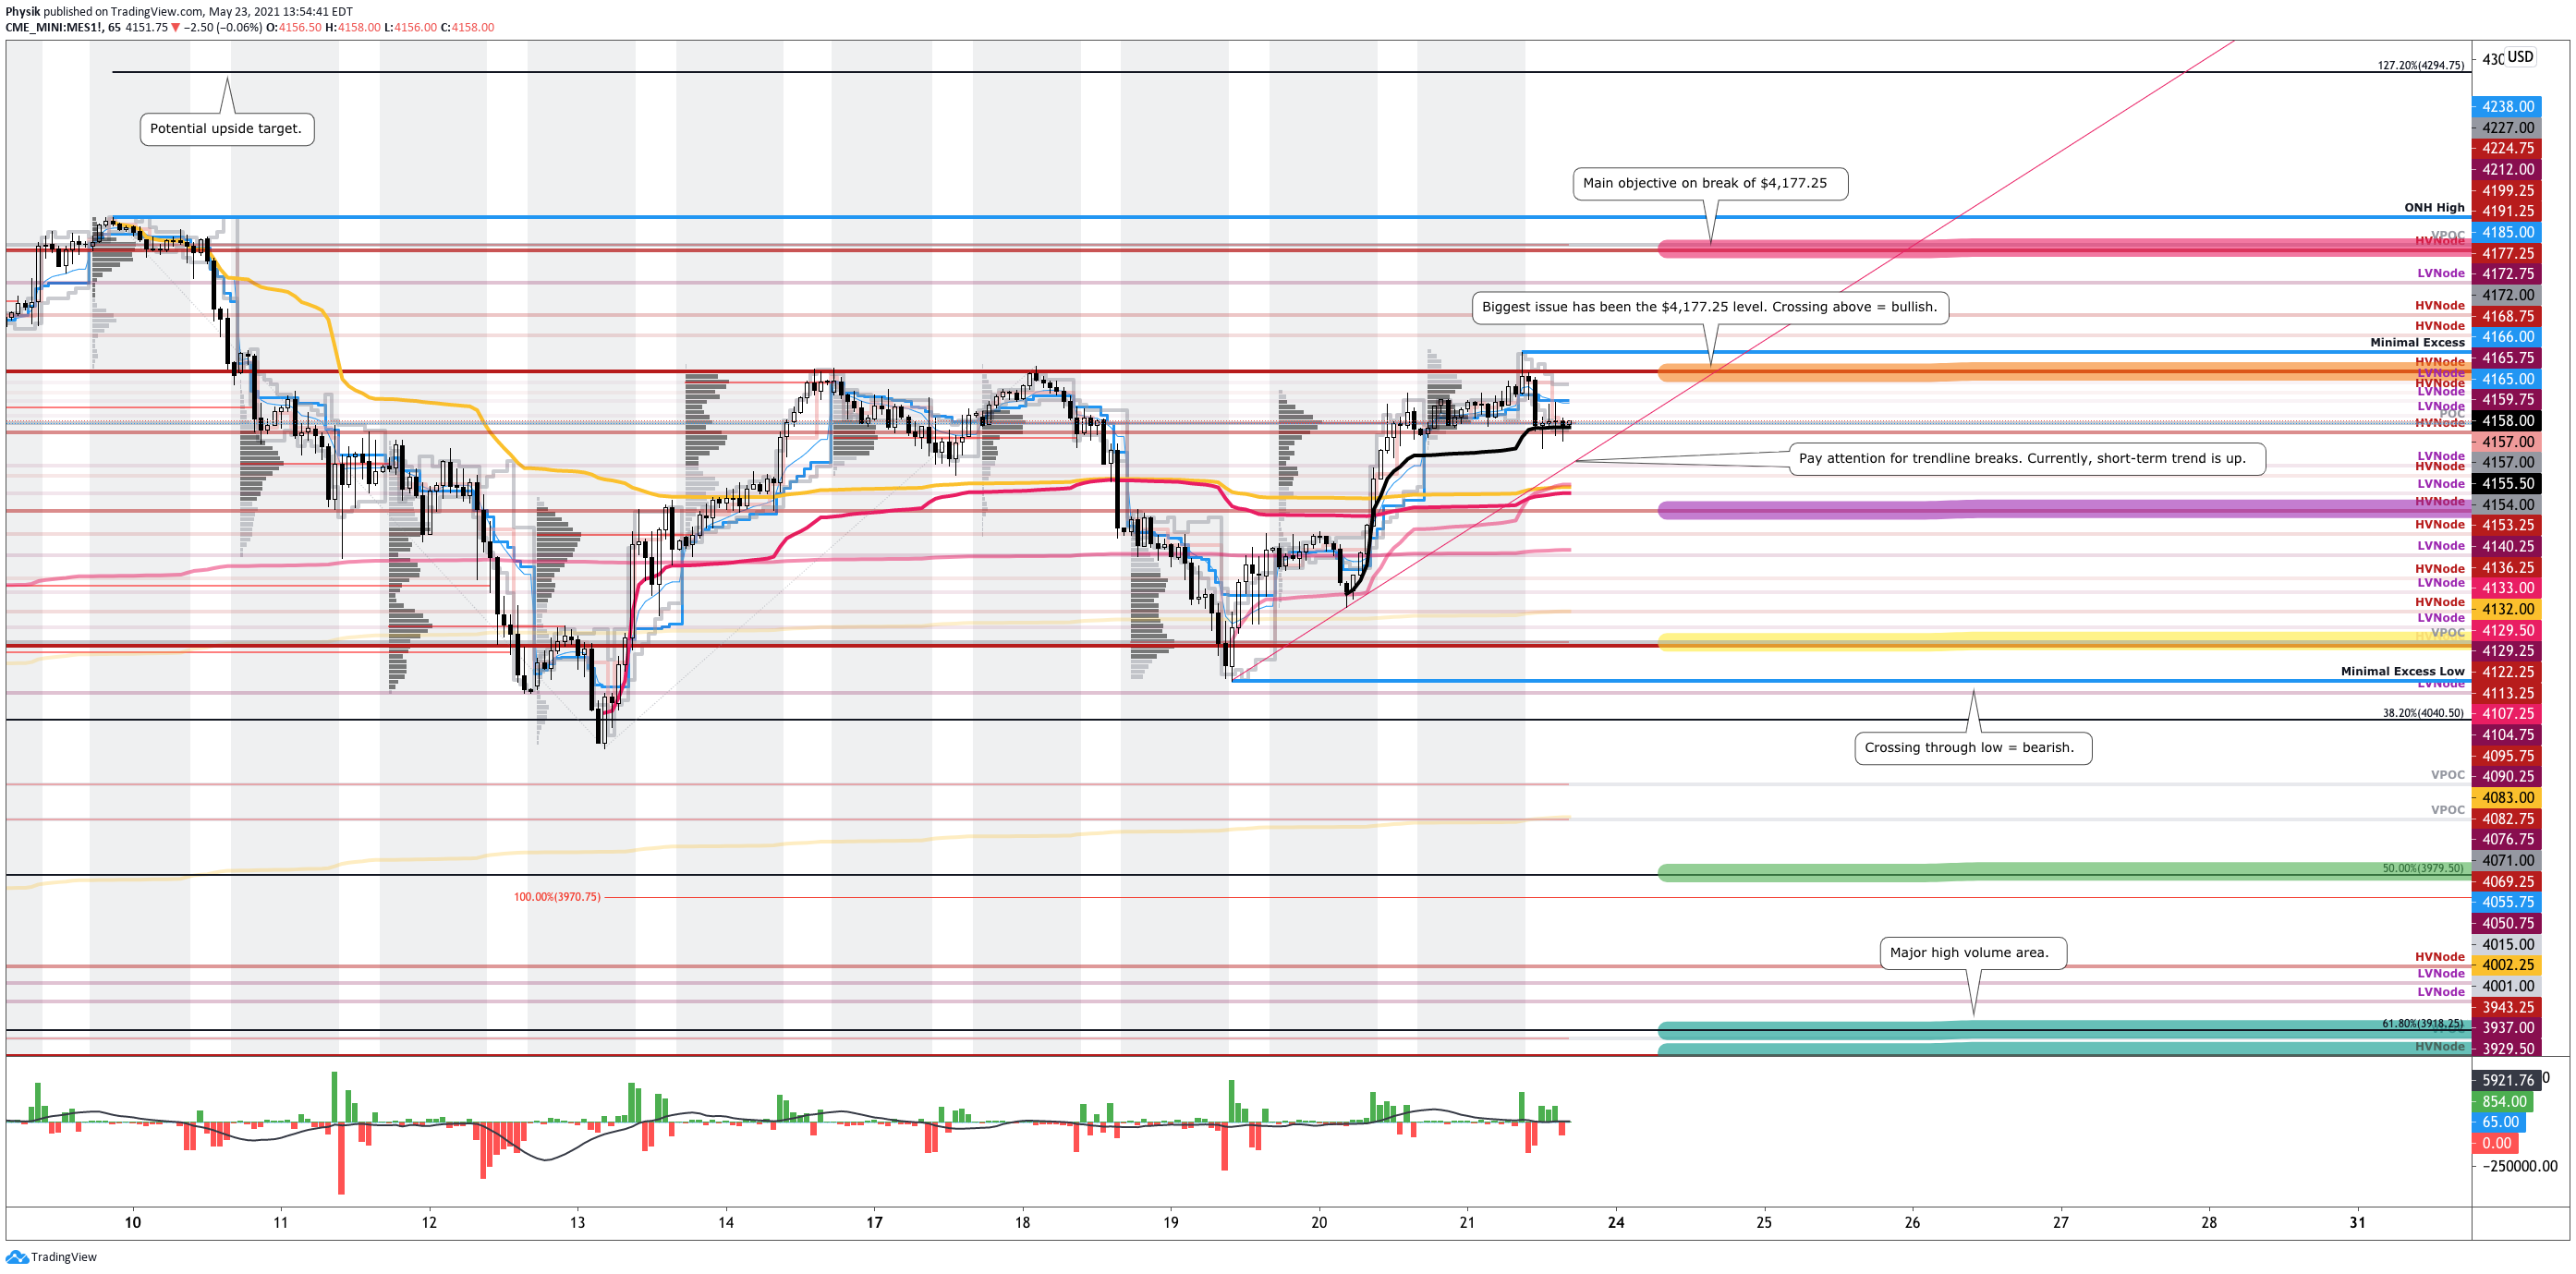
What To Expect: In the coming sessions, participants will want to focus their attention on where the S&P 500 trades in relation to its $4,177.25 composite high volume area (HVNode).
Volume Areas: A structurally sound market will build on past areas of high volume. Should the market trend for long periods of time, it will lack sound structure (identified as a low volume area which denotes directional conviction and ought to offer support on any test).

If participants were to auction and find acceptance into areas of prior low volume, then future discovery ought to be volatile and quick as participants look to areas of high volume for favorable entry or exit.
In the best case, the index trades sideways or higher; activity above the $4,177.25 HVNode puts in play the $4,227.00 point of control (POC). Initiative trade beyond the POC could reach as high as first the $4,238.00 overnight all-time high and then, the $4,294.75 Fibonacci-derived price extension, a typical recovery target.
POCs: POCs (like HVNodes described above) are valuable as they denote areas where two-sided trade was most prevalent. Participants will respond to future tests of value as they offer favorable entry and exit.

Overnight Rally Highs (Lows): Typically, there is a low historical probability associated with overnight rally-highs (lows) ending the upside (downside) discovery process.
In the worst case, the index trades lower; activity below the $4,122.25 HVNode puts in play the $4,071.00 POC. Thereafter, if lower, on a cross through the $4,050.75 low volume area (LVNode), long-biased traders should beware of a rapid liquidation, as low as first the $4,015.00 and $4,001.00 POCs. In such a liquidation, odds favor a test of ~$3,970.00 50.00% retracement, as well as the $3,918.00 61.80% retracement and HVNode.
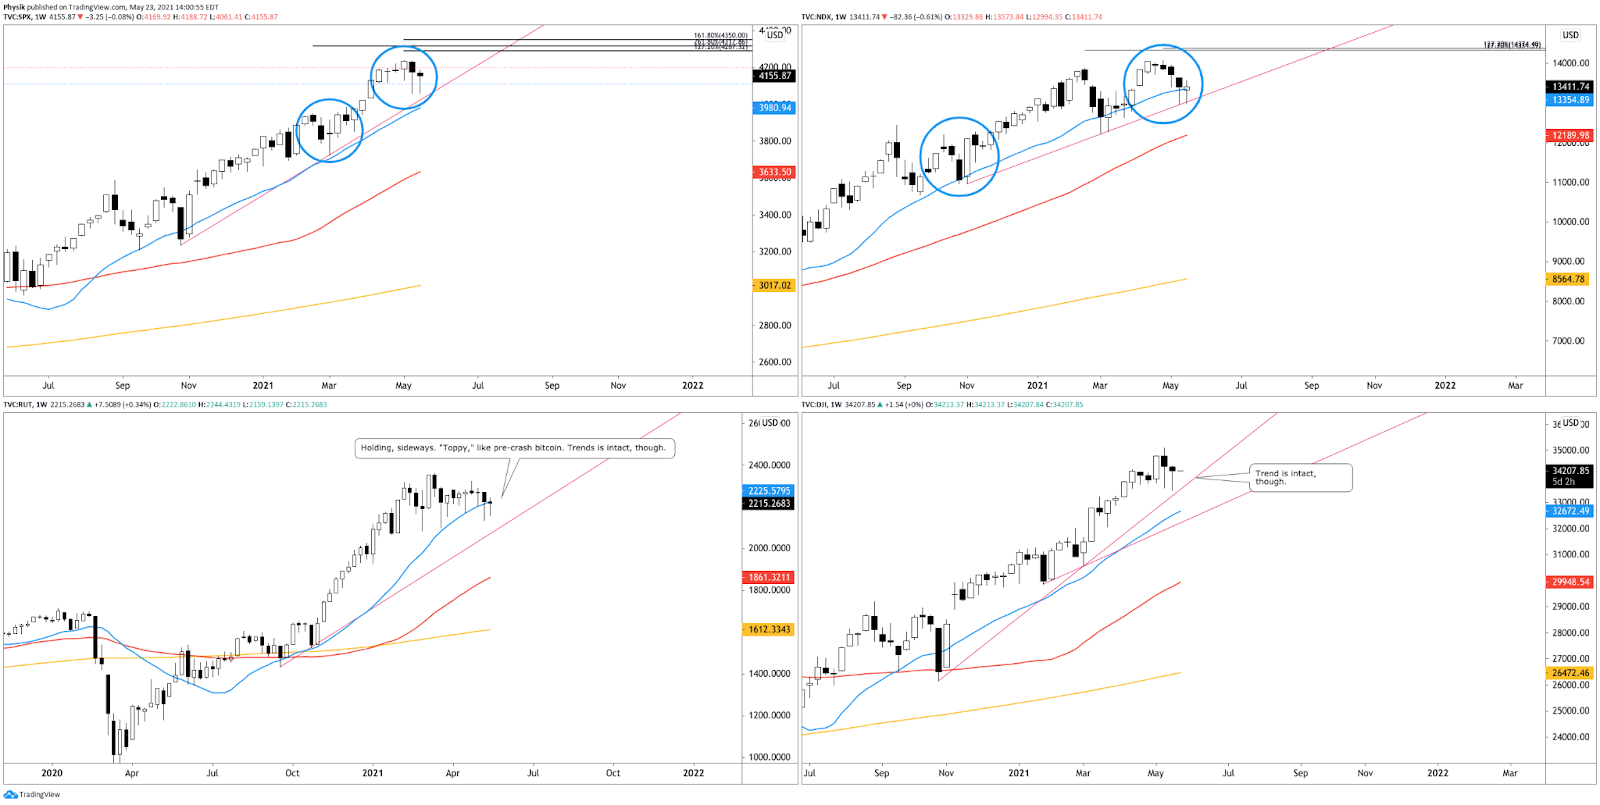
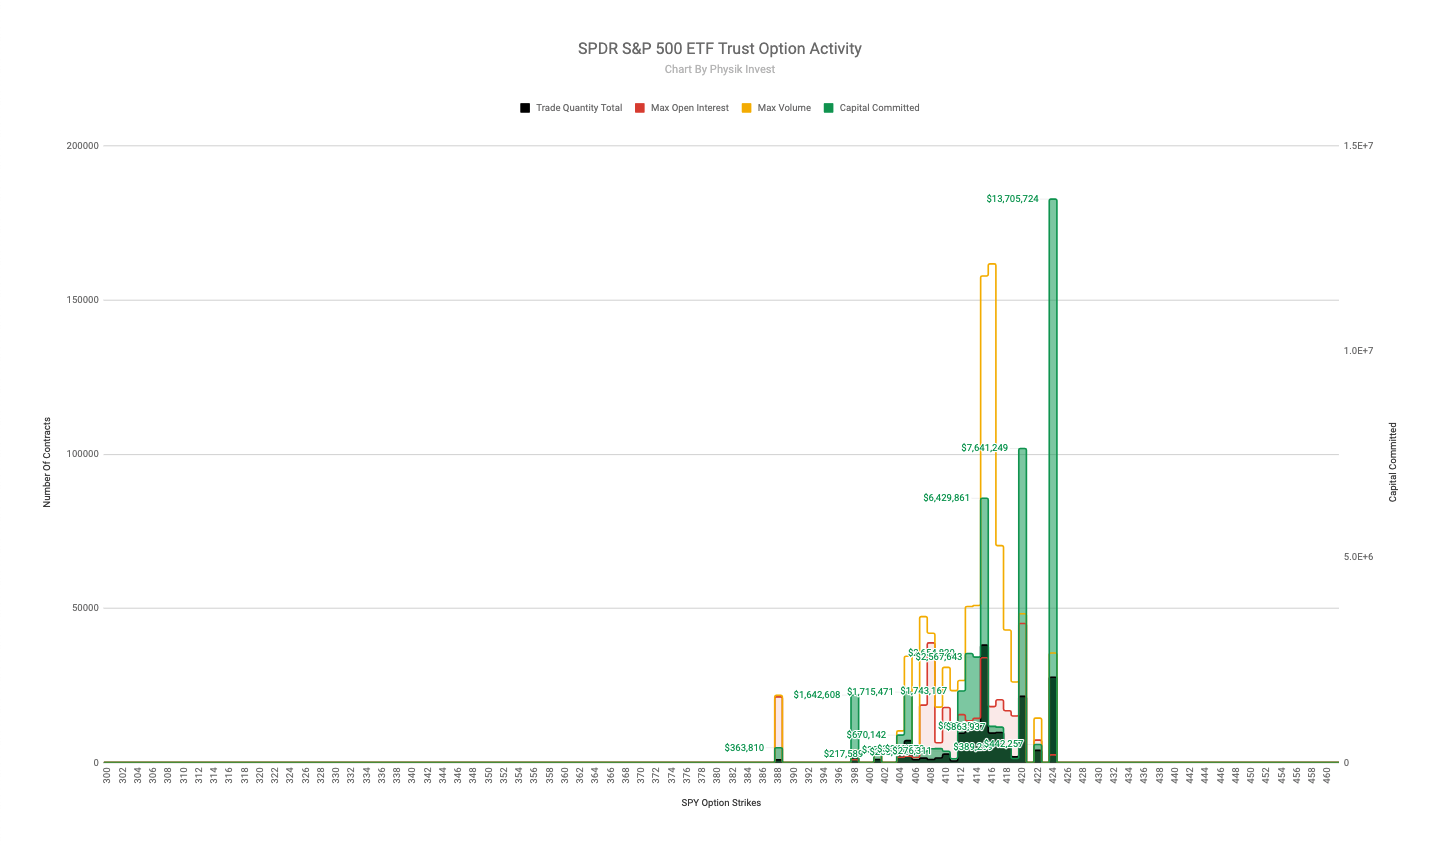
Graphic: 65-minute profile chart of the Micro E-mini S&P 500 Futures.Graphic: Weekly candlestick charts of the S&P 500 (top left), Nasdaq 100 (top right), Russell 2000 (bottom left), and Dow Jones Industrial Average (bottom right). Note Russell’s “toppy” rotation, and similar pullbacks to trend in the S&P 500 and Nasdaq. One last push, higher?Graphic: Physik Invest maps out the purchase of call and put options in the SPDR S&P 500 ETF Trust (NYSE: SPY), for last week. Though activity in the options market was primarily concentrated in short-dated tenors, increased trade in farther-dated call-side strikes is observed as a commitment to higher prices.
News And Analysis
Markets | Rotation from growth into value strengthens bull market. (ARK)
Recovery | Two COVID shots effective against the India variant. (REU)
Economy | U.S. inflation is transitory and consistent with recovery. (S&P)
Crypto | Google search volume for cryptocurrency breaks ATH. (Block)
Economy | PBOC will maintain its exchange rate basically stable. (BBG)
Markets | Global chip shortages cost automakers 5% of production. (Fitch)
Markets | JPMorgan cross-asset strategy head warns of drop. (BBG)
Markets | Nomura, UBS, UniCredit fined over bond trading cartel. (TT)
Recovery | CDC probes reports of myocarditis in the vaccinated. (Axios)
Economy | U.S. home prices push to record highs, buying slows. (WSJ)
I see this as a re-test of the previous low at 30K. Trading range between 30K and 42.5K is intact. Highly possible we see more choppy price action between these two levels. https://t.co/We5sBZgVP7pic.twitter.com/U7c15LF7Ua
NINE DAYS OF INDECISION – I see no immediate change. The structure above Friday's settle is equally poor when contrasted to the 9 day low. My short-term focus is on 4114-4140.
— Jim Dalton Trading (@daltontrading) May 23, 2021
Innovation And Emerging Trends
FinTech | How cryptocurrency fits into Brazil’s vision for banking. (Block)
FinTech | Major Asia-Pacific region banks upping their fintech bets. (S&P)
FinTech | U.S. Federal Reserve plans to publish a paper on CBDC. (Block)
Real Estate | Manhattan’s apartment vacancy rate stubbornly high. (WSJ)
About
Renato founded Physik Invest after going through years of self-education, strategy development, and trial-and-error. His work reporting in the finance and technology space, interviewing leaders such as John Chambers, founder, and CEO, JC2 Ventures, Kevin O’Leary, businessman and Shark Tank host, Catherine Wood, CEO and CIO, ARK Invest, among others, afforded him the perspective and know-how very few come by.
Having worked in engineering and majored in economics, Renato is very detailed and analytical. His approach to the markets isn’t built on hope or guessing. Instead, he leverages the unique dynamics of time and volatility to efficiently act on opportunity.
Disclaimer
At this time, Physik Invest does not manage outside capital and is not licensed. In no way should the materials herein be construed as advice. Derivatives carry a substantial risk of loss. All content is for informational purposes only.