Categories
Results

Case Study: Trading Tesla’s S&P 500 Inclusion

What Happened: On November 17, 2020, shares of Tesla Inc (NASDAQ: TSLA) surged on news that S&P Dow Jones Indices would include the stock in the S&P 500, the most liquid index in the world.

Since markets are most influenced by credit and positioning, news of the inclusion was impactful. Funds tied to the S&P 500 would purchase Tesla shares from a dealer by the addition date. This means that dealers would look to purchase shares of the stock heading into the event, to later supply funds at the close of Friday, December 18, the last session before the inclusion.

In the simplest of terms, the event was a positive since it meant that (1) speculative derivatives activity and associated hedging, (2) short-term traders, as well as (3) dealers and index funds would now support the stock.

The following sequence analysis unpacks how Physik Invest traded equity and derivatives tied to the carmaker’s stock leading up to the December 21, 2020 index inclusion.

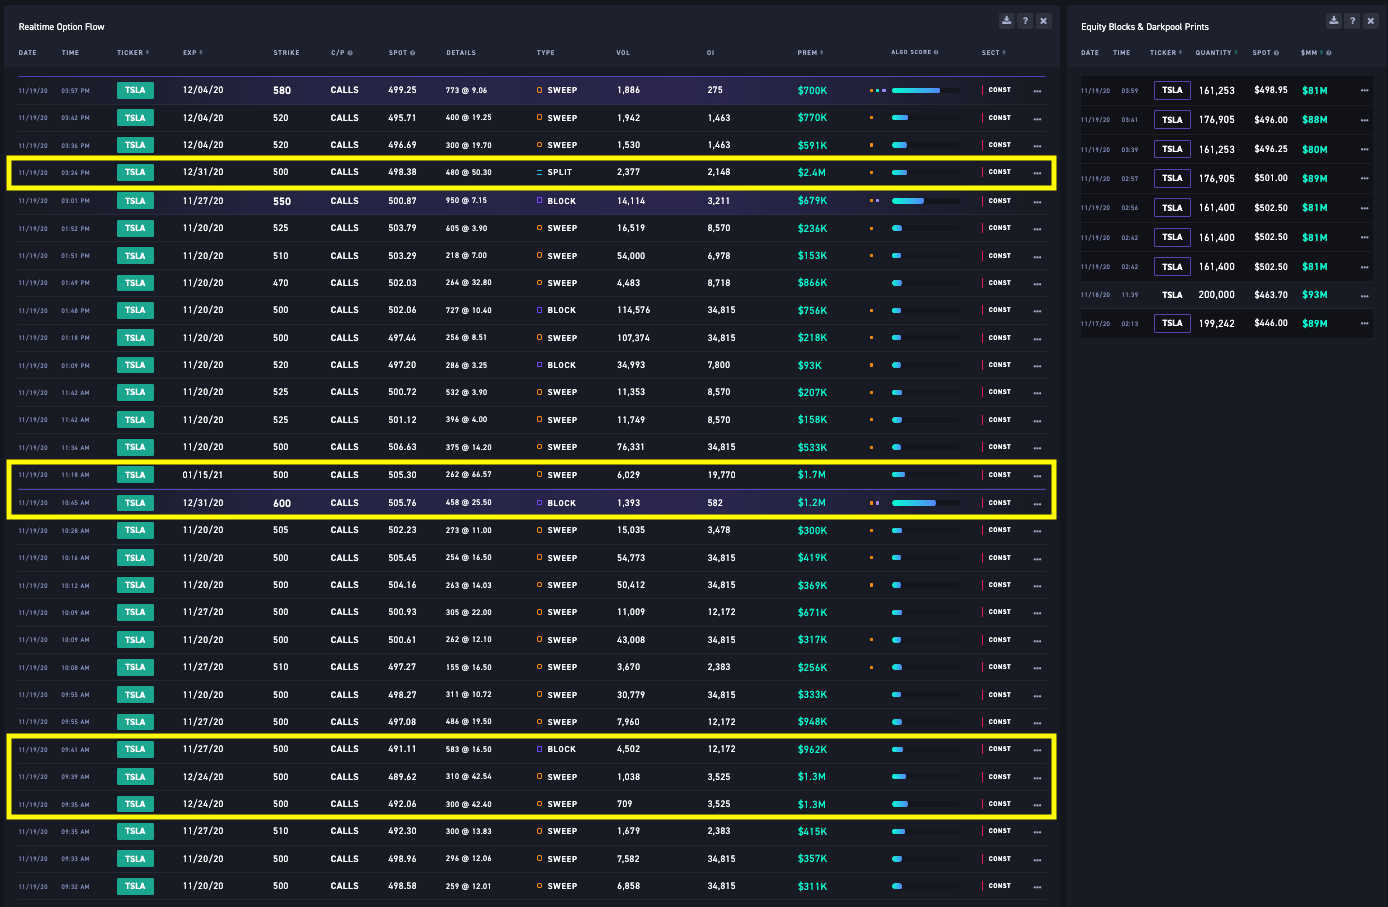
Note: Click here to view all transactions.

Sequence 1: On news of the inclusion, market participants initiated shares of Tesla out of balance, beyond trend resistance. Thereafter, in accordance with a typical give and go scenario, the stock faded, filling 50% of the low-volume area left after the initial move higher, before aggressive buying resurfaced to continue the new trend.

Through November 19, the following positions were added for a $61.00 debit, in total. At this point if all legs were to remain out of the money (i.e., expire worthless) by November 20, the maximum loss would be $61.00, approximately 1/10 of a standard risk unit, or the capital risked in a typical position.

  • 500+1/530-2 call ratio spread
  • 490+2/505-3 call ratio spread
  • 525+1/550-2 call ratio spread
  • 510+1/525-2 call ratio spread
  • 445-1 put
  • 460-1 put

By November 20, all aforementioned positions were closed for an $827.00 credit, a 1,255.74% return on initial investment.

All the above call-side structures were initiated against the $500 high open interest strike. Reason being, option expiries mark an end to pinning (i.e, the theory that market makers and institutions short options move stocks to the point where the greatest dollar value of contracts will expire worthless) and the reduction dealer gamma exposure.

On November 20, nearly 40% of Tesla’s gamma was to roll off. 

Pictured: November options gamma by Spot Gamma
Pictured: Speculative call-side options activity after the index inclusion announcement 

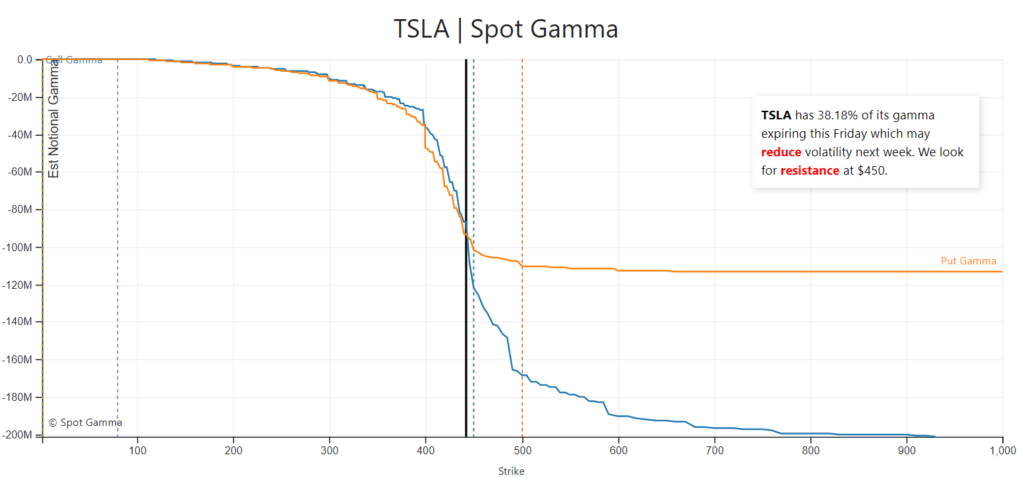
Moreover, since derivatives exposure was rolled into farther dated expiries, the stock would now be supported by dealers buying to hedge their derivatives exposure and facilitate the index inclusion.

Noting, at a simplistic level, prices often encounter resistance at prior highs due to the supply of old business. These areas take time to resolve. Breaking and establishing value (i.e., trading more than 15-minutes above this level) portends continuation.

Sequence 2: On November 20, the following structures expiring on December 4 were initiated for a $644.00 credit.

  • 450-1 put
  • 520+1/550-1 call ratio spread
  • 570+1/600-2 call ratio spread
  • 490-1/475+1 put ratio spread

Through November 24, the above structures were removed for a $876.00 credit.

Sequence 3: On November 24, the cost basis from November 19 ($61.00 debit) was reduced via an intraday long stock delta hedge that bought 10 shares at an average of $539.50.

The initial cost basis, after this particular trade, was brought down to a $0.20 debit.

Sequence 4: On November 25 the following positions were opened and closed the same day for a $179.30 credit.

  • Bought stock at $550.14 average
  • 480+1/500-2 call ratio spread

Sequence 5: On November 27, the following positions were initiated and closed by December 3 for a $117.10 debit.

  • Bought stock at $595.55 average
  • 475+1/437.5-2 put ratio spread

Sequence 6: On December 1 through December 3, the following positions were initiated, and then exited from by December 7 for a $1.77 debit.

  • Bought stock at $589.20 average
  • Bought stock at $563.77 average
  • 740+1/780C-2 call ratio spread

Sequence 7: Through December 17, the following positions were initiated and closed for a total $452.30 credit.

  • 720+1/820-2 call ratio spread
  • 740+1/830-2 call ratio spread
  • Bought stock at $632.17 average
  • 720+1/820-2 call ratio spread
  • Bought stock at $606.88 average
  • 800+1/860-2 call ratio spread
  • 500+1/480-2 put ratio spread

Sequence 8: From December 17 through December 23 the following positions were entered and exited from for a $322.00 credit.

  • 500+2/450-4 put ratio spread
  • 800+2/850-4 call ratio spread
  • 670+1/685-2 call ratio spread

Summary: In total, the above sequence of trades net a $3,098.29 credit after commissions and fees.

The strategies employed were in accordance with Physik Invest’s methodology: the trade of ratioed, multi-leg strategies that combine short and long positions to reduce risk and increase returns. 

Yes, in hindsight, one could have opted for something as simple as risk-reversals (e.g., buying calls and selling puts). However, the risks tied to such strategies are immense. By leveraging the dynamics of time and volatility, through complex spreads, risk was reduced.

Note: There were many times, during these sequences, that positions were structured in a way that would net no loss had the security moved sideways or lower into expiry.

Adding, per Fibonacci principles, one core aspect of Physik Invest’s market structure analysis, an upside target of $675.10 was established early on in the process. Tesla spent the majority of its December 18 session at this level.

Disclaimer: There is a $0.11 discrepancy between the transaction sheet and numbers provided in this case study. This is attributable to differences in rounding.

Categories
Commentary

Market Commentary For The Week Ahead: ‘All In At The Top’

Key Takeaways:

  • Analysts extended 2021 S&P 500 targets.
  • Fear and greed are tugging at each other. 
  • Jefferies ups 2021 GDP forecast to 5.25%.
  • Net equity buying the largest in months.
  • Inflation is rising where you don’t want it.
  • Positioning suggests elevation of volatility.
  • The big picture breakouts remain intact.

What Happened: Coming into the extended holiday weekend, on tapering volumes, U.S. index futures balanced within prior range. 

This activity occurred in the context of a larger balance-area forming just beyond the $3,600.00 multi-month break-out point. Given the lack of range expansion, in addition to the aforementioned responsive, back-and-forth trade, participants are signaling a lack of conviction.

Though there is a lot of noise in the markets — an uneven recovery, stimulus, elections, trade, and the like — one key point remains: the multi-month upside breakout targeting S&P 500 prices as high as $4,000.00 remains intact. Add to this the recovery of Monday’s liquidation fueled by weak-handed, short-term buyers, and the fact that the all-time $3,724.25 rally-high was established in an overnight session, it is highly likely that the upside discovery process has yet to end.

Note: Historically, there is a low probability that overnight all-time highs end the upside discovery process. 

Pictured: Profile overlays on a 30-minute candlestick chart of the Micro E-mini S&P 500 Futures

What To Expect: Friday’s session found responsive selling surface near the $3,691.00 profile level. Given that participants had difficulty in sustaining higher prices, alongside shortened holiday trade, the following frameworks apply for next week’s trade.

In the best case, the S&P 500 remains above its $3,667.75 HVNode, and continues to balance. As stated earlier, given the tapering volume and holiday, the odds of directional resolve are quite low. 

Two go, no-go levels exist; trade that finds increased involvement above $3,691.00 and below $3,667.75 would suggest a change in conviction. Anything in-between favors responsive trade.

Conclusion: Bank of America Corp’s (NYSE: BAC) Michael Hartnett summarized it best: “[T]he year of the virus, the lockdown, a crash, a recession, an epic policy panic, the greatest stock market rally of all-time, a V-shape economic recovery, and ending with a vaccine for COVID-19.”

Though risks remain, markets are pricing in the odds of a continued rebound. Unless some exogenous event were to transpire, technically speaking, all broad-market indices are in an uptrend. A move below $3,600.00 in the S&P 500 would denote a change in tone, increasing the likelihood of a failed breakout that would target prices as low as $3,200.00.

Pictured: Retest of the upside breakpoint on a daily candlestick chart of the cash S&P 500 Index

Levels Of Interest: The $3,691.00 boundary and $3,667.75 HVNode.

Bonus: Here is a look at some of the opportunities unfolding.

Photo by Raka Miftah from Pexels.

Categories
Commentary

Market Commentary For 12/23/2020

What Happened: After a day of balance, and a brief overnight liquidation alongside news that President Donald Trump would not sign a coronavirus relief bill until the size of stimulus checks is increased, U.S. index futures rebounded, with the S&P 500 returning to the $3,691.00 ledge, a level that’s repeatedly attracted responsive sellers.

What Does It Mean: During Tuesday’s session, participants accepted the prior day’s recovery, evidenced by the two-sided trade at prices where the most activity occurred during the prior day, or point of control (POC).

Given that participants deem the high end of Monday’s range fair to do business in, participants will come into Wednesday’s session knowing that the $3,691.00 high-volume ledge is a key upside reference. The aforementioned ledge denotes a pause in discovery, likely attributable to the declining participation ahead of the holiday weekend.

That said, below the ledge, responsive buyers continue to resurface at the $3,667.75 high-volume node (HVNode) on long liquidations (i.e., those events that are caused by overly committed short-term participants that trim positions in panic because they lack the wherewithal or conviction to follow-through).

Pictured: Visual of /MES $3,691.00 ledge.

What To Expect: In light of the overnight recovery and trade near the $3,691.00 ledge, the following frameworks apply for today’s trade.

In the best case, buyers hold the the index above its $3,667.75 HVNode. Holding said reference would be indicative of continued balance after Monday’s recovery; in such case, participants would look for signs of follow-through above the $3,691.00 ledge. Once the ledge cracks (i.e., participants initiate and accept, spend more than 15-minutes above the level), it ought to (1) offer support and (2) draw in buyers to continue the upside discovery process up to, at least, the $3,700.00 and $3,707.75 HVNodes.

Anything higher targets the $3,724.25 overnight rally high.

Levels Of Interest: The $3,691.00 ledge, $3,667.75, $3,700.00 and $3,707.75 HVNodes, as well as the $3,724.25 overnight high.

Bonus: Big-picture breakout remains intact. See below for opportunities unfolding.

Pictured: Daily candlestick chart of the cash S&P 500 Index
Categories
Commentary

‘Rising Tide Lifts All Boats’: Market Commentary For The Week Ahead

Key Takeaways:

What Happened: U.S. index futures auctioned to new all-time highs before weakening into Friday’s derivative expiry.

What Does It Mean: After participants established a rally-high in the December 9 overnight session, the S&P 500 liquidated down to the balance-area boundary near $3,625.00.

After the December 14 gap open on COVID-19 coronavirus vaccine and stimulus progress, for the remainder of the week, indices negated prior selling, establishing a new all-time high. Friday’s trade managed to repair some structural deficiencies left in the aforementioned advance.

Pictured: Profile overlays on a 65-minute candlestick chart of the Micro E-mini S&P 500 Futures

What To Expect: Friday’s session found responsive buyers surface at the low-volume node (LVNode) near $3,680.00. Low-volume areas denote directional conviction and ought to resist future auction rotations. Auctioning through the LVNode would foreshadow further rotation and trade as low as the balance-area low.

Given that the higher-time frame breakout remains intact and selling appears non-committal, participants will come into Monday’s session knowing the following:

  1. Both sentiment and positioning are historically stretched, while the recovery remains uneven
  2. Inflation remains cool due to the profound influence of disruptive innovation.
  3. U.S. Congress reaches deal on COVID-19 aid package, plans votes for Monday. 
  4. The decline in realized correlation due to factor and sector rotation, as well as the return of systematic option selling strategies will push the long-gamma narrative in which volatility is suppressed and the market pins or slowly rises in a range-bound fashion.
  5. The S&P 500’s higher-time frame breakout remains intact (see chart below); JPMorgan Chase & Co. (NYSE: JPM) confirms equities will rally short-term with the S&P 500 auctioning as high as $4,000.
  6. Despite high CAPE ratios, stock-market valuations aren’t that absurd.

Therefore, the following frameworks for next week’s trade apply.

In the best case, buyers maintain conviction and hold the index above the $3,680.00 LVNode. Auctioning below said reference denotes a change in conviction. Participants would then look for a response near the $3,667.75 HVNode. Failure to remain above the HVNode would portend rotation, further balancing. 

In the worst case, participants initiate below the $3,625.00 balance-area low, jeopardizing the higher-time frame breakout.

Conclusion: As BlackRock Inc (NYSE: BLK) said, “a rising tide lifts all boats”; though financial markets have largely priced in positive news surrounding vaccines and stimulus, the rally remains intact, bolstered by a drive for yield — technical factors as a result of systemic and hedge fund strategies, among other things.

Pictured: Retest of the upside breakpoint on a daily candlestick chart of the cash S&P 500 Index

Levels Of Interest: $3,740.75 and $3773.75 price extensions, $3,724.25 all-time rally high, the micro-composite HVNode at $3,707.75, $3,691.00, and $3,667.75, as well as the $3,680 LVNode and poor structure near the $3,625.00 balance-area low.

Bonus: Here is a look at some of the opportunities unfolding.

Photo by Fede Roveda from Pexels.

Categories
Commentary

Market Commentary For 12/17/2020

What Happened: After yesterday’s Federal Reserve policy decision, U.S. index futures auctioned higher overnight alongside hopes of added U.S. fiscal and monetary stimulus, as well as vaccine rollouts.

What Does It Mean: During Wednesday’s regular trade, the S&P 500 initiated up to the $3,691.25 high-volume node, a valuable price, before sellers responded, established excess, and extended lower into the close.

Given the response to yesterday’s Federal Reserve decision, as well as overnight activity, the S&P 500 remains in a tactically bullish position, confirming the higher-time frame upside breakout which targets prices as high as $4,000.

What To Expect: In light of the overnight gap higher, the following frameworks apply for today’s trade.

In the best case, buyers maintain conviction and hold the index above the $3,691.25 high-volume node. Thereafter, upside references include the high-volume node near $3,710.00, and then the $3,720.00 price extension.

In the worst case, if the S&P 500 is brought back into range, participants can expect further balancing. The current market environment supports the long-gamma narrative in which volatility is suppressed and the market pins or slowly rises in a range-bound fashion.

Adding, the market has initiated back through $3,680.00, a low-volume area. Such low-volume areas denote directional conviction and ought to offer support on any test. Penetrating the low-volume area would put in play the $3,667.75 high-volume node.

Levels Of Interest:  $3,680.00 low-volume node, the $3,710.00 and $3,667.75 high-volume nodes, as well as the $3,720.00 price extension.

Bonus: Opportunities unfolding.

Categories
Commentary

Market Commentary For 12/16/2020

What Happened: Ahead of today’s Federal Reserve policy decision, U.S. index futures auctioned higher overnight.

What Does It Mean: During Tuesday’s regular trade, the S&P 500 initiated up to the $3,667.75 high-volume node, a valuable price, before sellers responded, extended lower, and then buyers retook control, one time framing higher into the close.

Given that Monday’s selling activity was negated yesterday, the S&P 500 sits in a tactically bullish position, confirming the higher-time frame upside breakout which targets prices as high as $4,000.

Pictured: Daily candlestick chart of the cash S&P 500 Index

Adding, the overnight auction brought the index back above its most valuable price over the past two weeks of trade, the most positive outcome.

What To Expect: In light of the overnight gap higher, the following frameworks apply for today’s trade.

In the best case, buyers maintain conviction through the Federal Reserve event, and hold the index above the $3,667.75 high-volume node. Thereafter, upside references include the high-volume node at $3,707.75, and then the prior all-time rally high.

In the worst case, if the S&P 500 is brought back below $3,667.75, participants would look to whether the auction — again — resists last Friday’s range. As stated yesterday, accepting Friday’s range puts in play the minimal excess lows near $3,625.00. Any activity below $3,625.00 would put in question the higher-time frame breakout.

Levels Of Interest:  $3,667.75 high-volume node is the go/no-go level today.

Key Takeaways: In the face of volatile positioning, and the S&P 500’s balancing activity, the macro- and technical-landscape remains bullish.

In support of a rally is the (1) return of systematic strategies, (2) seasonality, and (3) a weaker dollar, among other factors.

Still, the Fed decision and rebalancing are around the corner, while sentiment and other positioning metrics are at extremes. It’s a time to get picky with trades.

Bonus: Here is a look at a few of the opportunities unfolding.

Chipotle Mexican Grill Inc (NYSE: CMG) – Potential for upside breakout and continuation. Upgraded on Wednesday.

Shopify Inc (NYSE: SHOP) – Balance just shy of channel boundary. Potential for upside breakout and continuation.

Apple Inc (NASDAQ: AAPL) – Acceptance after higher-time frame balance-breakout.

Advanced Micro Devices Inc (NASDAQ: AMD) – Acceptance after higher-time frame balance-breakout.

Spotify Technology SA (NYSE: SPOT) – Acceptance after higher-time frame balance-breakout. Potential remains for a push to the balance-area projection.

Categories
Commentary

Market Commentary For 12/15/2020

What Happened: After a day emotional selling, dominated by short-term market participants, U.S. index futures auctioned higher overnight alongside news of COVID-19 relief measures.

What Does It Mean: During Monday’s trade, the S&P 500 initiated up to the $3,690.75 high-volume node, a valuable price, before sellers responded and extended range.

Later, as the auction traversed prior poor structures (i.e., low-volume areas), selling intensified — via a spike lower — and the session ended at extremes.

The overnight auction, however, negated the late-day selling, bringing the S&P 500 back to its most valuable price over the past two weeks of trade.

What To Expect: In light of the overnight gap higher, the following frameworks apply for today’s trade.

In the best case, buyers maintain conviction and initiate through the $3,667.75 high-volume node before continuing to at least the next high-volume node at $3,690.75, and then the prior all-time rally high.

In the worst case, if the S&P 500 remains below $3,667.75, participants would look to whether the auction — again — resists Friday’s range. Accepting Friday’s range puts in play the minimal excess lows near $3,625.00. Auctioning below $3,625.00 would put in question the higher-time frame breakout.

Levels Of Interest:  $3,667.75 high-volume node is the go/no-go level today.

Bonus: Please see the below chart for context on the higher-time frame S&P 500 breakout.

Pictured: Daily candlestick chart of the cash S&P 500 Index
Categories
Commentary

Market Commentary For 12/14/2020

What Happened: Alongside optimism surrounding the COVID-19 coronavirus vaccine and stimulus talks, U.S. index futures auctioned higher overnight.

What Does It Mean: During last week’s trade, U.S. index futures auctioned to new all-time highs, before moving back into balance.

For the remainder of the week, participants accepted lower prices until Friday’s session established minimal excess lows, broke into prior poor structure, and ended the technical downtrend. 

Since Friday’s session found responsive buying surface at a key technical level (i.e., the high-volume node near $3,630.00 and 20-day simple moving average), buyers extended range through the $3,667.75 high-volume node, the most positive outcome.

What To Expect: In light of the overnight gap higher, the following frameworks apply for today’s trade.

In the best case, the auction makes an attempt to repair some of the poor overnight structure. Thereafter, buyers regain conviction and initiate back through the $3,667.75 high-volume node before continuing to at least the next high-volume node at $3,690.75, and then the prior all-time rally high.

In the worst case, if the S&P 500 auctions below $3,667.75, participants would look to whether the S&P 500 resists Friday’s range. Accepting Friday’s range (i.e., spending more than one half-hour period) may put in play the minimal excess lows near $3,625.00.

Levels Of Interest:  $3,667.75 high-volume node is the go/no-go level.

Bonus: Opportunities unfolding.

Categories
Commentary

‘To Infinity And Beyond’: Market Commentary For The Week Ahead

Key Takeaways:

What Happened: During last week’s trade, U.S. index futures auctioned to new all-time highs, before moving back into balance.

What Does It Mean: After participants established an all-time rally high during Wednesday’s overnight session, the S&P 500 liquidated in regular trading, down to the micro-composite high-volume node near $3,667.75, a price level where participants spent a large amount of time in the past. The session ended in prior balance and range with poor profile structure denoting the presence of directional conviction.

For the remainder of the week, participants accepted lower prices until Friday’s session established minimal excess lows, broke into prior poor structure, and ended the technical downtrend. 

Given the mechanical trade (i.e., minimal excess at Friday’s lows) and poor structure (e.g., low-volume areas), it’s very likely that the selling range extension was the result of weak-handed, short-term momentum buyers liquidating positions in panic.

Pictured: Profile overlays on a 65-minute candlestick chart of the Micro E-mini S&P 500 Futures

What To Expect: Friday’s session found responsive buyers surface at a key technical level (i.e., the high-volume node near $3,630.00 and 20-day simple moving average). The fact that there was a response at a technical reference confirms that participation in the market is overwhelmingly short-term; in other words, institutions (e.g, funds) tend not to transact at exact technical levels. 

Given that the higher-time frame breakout remains intact, participants will come into Monday’s session knowing the following:

  1. Both sentiment and positioning are historically stretched while the market has entered a short-gamma environment; in such cases, dealers hedge their derivatives exposure by buying into strength and selling into weakness. This, alongside the presence of short-term traders in U.S. equities, will exacerbate volatility in the coming week.
  2. Looking to 2021, the decline in realized correlation due to factor and sector rotation, as well as the return of systematic option selling strategies should push the long-gamma narrative in which volatility is suppressed and the market pins or slowly rises in a range-bound fashion.
  3. JPMorgan Chase & Co. (NYSE: JPM) strategist Marko Kolanovic suggests equities will rally short-term with the S&P 500 auctioning as high as $4,000 on the basis of low rates, improved fundamentals, buybacks, as well as systematic and hedge fund strategies.
  4. Despite high CAPE ratios, stock-market valuations aren’t that absurd.
  5. Prior trade points to the non-presence of committed selling; after Friday’s session saw a failure to range extend and establish excess, the technical down-trend was broken.

Therefore, the following frameworks for next week’s trade apply.

In the best case, buyers surface at the $3,654.75 low-volume node and extend range up to the high-volume node at $3,667.75. High-volume areas denote value and should slow prices allowing participants enough time to enter and exit trades. An initiative drive through this area would portend a test of the $3,690.75 high-volume node, and then the prior all-time rally high.

In the worst case, if the S&P 500 auctions below $3,630.00, participants would look to repair the poor structure just shy of $3,625.00. Finding acceptance (i.e., spending more than one half-hour of regular trade) below Friday’s range would be the most negative outcome.

Conclusion: Though sentiment and positioning imply limited potential for further upside, the S&P 500’s higher-time frame breakout remains intact.

Pictured: Retest of the upside breakpoint on a daily candlestick chart of the cash S&P 500 Index

Levels Of Interest: $3,720.00 extension, $3,715.00 all-time rally high, the micro-composite HVNode at $3,690.75, $3,667.75, and $3,630.00, as well as the $3,654.75 LVNode and poor structure near $3,625.00.

Bonus: Here is a look at some of the opportunities unfolding.

Spotify Technology SA (NYSE: SPOT) – Acceptance after higher-time frame balance-breakout. Potential remains for a push to the balance-area projection.

Apple Inc (NASDAQ: AAPL) – Acceptance after higher-time frame balance-breakout. Potential scenarios include (1) continued rotation, (2) upside continuation, or (3) failed breakout and a return to balance.

Advanced Micro Devices Inc (NASDAQ: AMD) – Acceptance after higher-time frame balance-breakout. Potential for upside continuation or failed breakout and return to balance.

Shopify Inc (NYSE: SHOP) – Balance just shy of channel boundary. Potential for upside breakout and continuation.

Chipotle Mexican Grill Inc (NYSE: CMG) – Just shy of balance-area high. Potential for upside breakout and continuation.

Tesla Inc (NASDAQ: TSLA) – Rejected prior week’s balance-area. Likelihood of continuation up to S&P 500 index inclusion intact on surging call volumes, dealer accumulation. $700 strike is the high-OI strike of interest.

Zoom Video Communications Inc (NASDAQ: ZM) – Just shy of long-term trend, anchored VWAP. Potential for responsive buying.

Summit Materials Inc (NYSE: SUM) – Failed breakout, but speculative call volumes surfaced on the return into balance. Potential exists for another attempt higher.

Nasdaq-100 (INDEXNASDAQ: NDX) – Retest of balance-area high. Higher time-frame breakout remains intact.

Cover photo by SpaceX from Pexels.

Categories
Commentary

Market Commentary For 12/11/2020

What Happened: Alongside worries over the economic impact of a resurgent pandemic, U.S. index futures auctioned lower overnight.

What Does It Mean: During Thursday’s regular trading, buyers responded to lower prices, at the high-volume node near $3,667.75, a price level where the auction spent a lot of time in the past.

The session ended inside of prior balance and range denoting acceptance of the lower prices.

What To Expect: In light of yesterday’s price acceptance and the overnight gap lower, the following frameworks apply for today’s trade.

In the best case, the auction makes an attempt to repair some of the poor overnight structure. Thereafter, buyers regain conviction and initiate through the $3,642.75 balance-area boundary, ending the downtrend. This scenarios would put in play the high-volume node at $3,667.75.

In the worst case, if the S&P 500 auctions below $3,630.00, participants would look to whether the $3,592.25 balance-boundary offers a response. If not, the higher-time frame breakout is put into question.

Levels Of Interest:  $3,642.75 and $3,592.25 balance-area boundary, as well as the $3,667.75 and $3,630.00 high-volume nodes.

Bonus: The higher-time frame breakout remains intact and selling appears measured. Still, the rally is on hold; monitor for continuation.

Pictured: Daily candlestick chart of the cash S&P 500 Index