Categories
Commentary

‘Go Forth’: Market Commentary For The Week Ahead

Key Takeaways:

Last Week Unpacked: During much of the week, participants lacked the conviction to break through to new highs. This was evidenced by mechanical trade (i.e., low-excess at the edges of balance).

However, after Thursday’s liquidation on news that Pfizer Inc (NYSE: PFE) would slash its 2020 vaccine production target flushed out weak-handed participants, responsive buyers surfaced and recovered the balance-area high.

During Friday’s regular trading, initiative buyers extended range — through the $3,682.00 balance-area high — up to the $3,700.00 high gamma strike. The after-hours session introduced a 4-tick excess high, providing a clear end to the upside discovery process.

Pictured: Profile overlays on a 30-minute candlestick chart of the Micro E-mini S&P 500 Futures

What To Expect: Friday’s auction saw the separation and acceptance of value beyond a week-long balance-area.

This came after Thursday’s afternoon pullback found responsive buyers surface at a key technical level (i.e., the low-volume node near $3,655.00). The fact that there was a response at that technical reference confirms that participation in the market has been overwhelmingly short-term; in other words, institutions (e.g, funds) tend not to transact at exact technical levels.

Moreover, given that initiative buyers are in control, participants will come into Monday’s session in light of the following: 

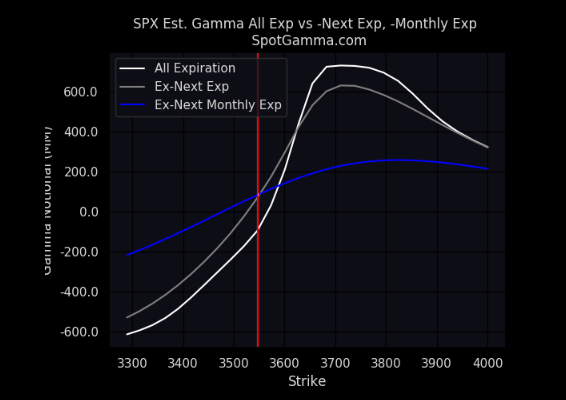
  1. Both sentiment and positioning are historically stretched while the market is stuck in a long-gamma environment; in such cases, dealers hedge their derivatives exposure by selling into strength and buying into weakness. As a result, volatility is suppressed and the market pins or slowly rises in a range-bound fashion, as we’re seeing.
  2. JPMorgan Chase & Co. (NYSE: JPM) strategist Marko Kolanovic suggests equities will rally short-term, with the S&P 500 auctioning as high as $4,000 in Q1 2021 on the basis of improved fundamentals.
  3. Though prior trade points to the non-presence of committed buying, Friday’s session saw the separation and acceptance of value above a week-long balance area, further confirming the higher-time frame breakout.

Therefore, knowing that higher S&P 500 prices have been accepted, the following frameworks for next week’s trade apply.

In the best case, if participants manage to further spend time and build value above the $3,682.00 balance boundary, then initiative buyers remain in control — the nearest upside level of interest is the projection near $3,710.00.

In the worst case, an initiative drive below $3,682.00 would portend a response at the $3,667.75 high-volume node. Auctioning even lower would denote a clear change in conviction. As a result participants would look to whether the $3,640.00 balance boundary holds. Breaking that reference puts the rally on hold.

Conclusion: Though sentiment and positioning imply limited potential for further upside, the market remains in a strong technical uptrend bolstered by improved fundamental factors.

Overall, the S&P 500 has confirmed a multi-month balance-break.

Pictured: Daily candlestick chart of the cash S&P 500 Index

Levels Of Interest: $3,710.00 projection, the micro-composite HVNode at $3,690.75 and $3,667.75, as well as the $3,682.00 and $3,640.00 balance boundary.

Photo by Abhishek Gaurav from Pexels.

Categories
Commentary

Market Commentary For 12/3/2020

What Happened: Ahead of fundamental data releases and stimulus news, U.S. stock index futures are trading within a two-day balance area after successfully defending Monday’s upside break.

What Does It Mean: During Wednesday’s regular trading in the S&P 500, participants defended multiple attempts to auction back into last week’s balance area, marked by the $3,640 ledge.

Further, despite a lack of breadth, given the market’s response to the ledge, the odds of further upside have risen. Adding, remaining above the upper balance boundary — $3,640 ledge — the bullish bias remains. Auctioning below the upper balance boundary would be the most negative outcome, and could foreshadow a test as low as the lower balance area boundary, near $3,590.

Going into today’s session, participants know that (1) the S&P 500 is trading within a two-day balance area and (2) buyers remain in control. As a result, auctioning above the $3,677 boundary, participants should follow along the initiative activity, targeting prices as high as the upside projections near $3,700. Auctioning below the $3,640 boundary, puts the rally on hold, and suggests further balance.

Levels Of Interest: $3,677 and $3,640 two-day balance boundary.

Categories
Commentary

Market Commentary For 12/2/2020

What Happened: A day after major indices established record highs, futures remain outside of a bigger balance-area, suggesting acceptance of higher prices and improved odds of further upside.

What Does It Mean: In Tuesday’s regular trading, initiative buyers extended range, further confirming the break from last week’s balance area.

Thus far, there were two significant attempts overnight to auction back into the balance area. Auctioning below the upper balance boundary, below the $3,640 ledge, would be the most negative outcome, and could foreshadow a test as low as the lower balance area boundary, near $3,590.

Given that the S&P 500 remains outside of the week-long balance area, above the $3,640 ledge, participants know that initiative buyers remain in control and pullbacks are buyable. Auctioning into and below the balance area boundary, puts the rally on hold, and suggests further balance.

Levels Of Interest: $3,640 ledge.

Bonus: The S&P 500’s higher timeframe breakout remains intact.

Pictured: Daily candlestick chart of the cash S&P 500 Index
Categories
Commentary

‘Dualism’: Market Commentary For The Week Ahead

Key Takeaways:

  • Decline in cash levels is a sign of stretched sentiment. 
  • Positioning: Odds of sustained directional resolve low.
  • Potential confirmation of multi-month balance-break.

What Happened: During last week’s shortened holiday trade, U.S. index futures broke out to new all-time highs.

What Does It Mean: After Tuesday’s initiative upside drive alongside news that provided clarity on the election transition, participants rotated back over the $3,580 balance-area boundary, invalidating the prior week’s initiative selling activity. Thereafter, conviction disappeared and the market remained range-bound, as evidenced by a non-participatory delta (i.e., the non-presence of committed buying) and mechanical trade (i.e., low-excess at the edges of developing balance).

Pictured: Profile overlays on a 15-minute candlestick chart of the Micro E-mini S&P 500 Futures

What To Expect: During Friday’s shortened holiday session, the S&P 500 remained in balance, further auctioning and accepting value into Tuesday’s excess high, which marked an end to the upside discovery process. 

Given that initiative buyers remained in control after auctioning into the micro-composite high-volume node at $3,631, the fairest price to do business after Tuesday’s upside drive, participants come into Monday’s session knowing the following: 

  1. The amount of cash investors are holding in their portfolios fell to levels last seen prior to the February sell-off. 
  2. Market sentiment, as represented by Citigroup Inc’s (NYSE: C) Panic/Euphoria Model, is historically stretched.
  3. Tuesday’s upside impulse, through the low-volume node at $3,580, was reminiscent of short-term, momentum-driven buying. 
  4. Holiday trade was dominated by low-volume and responsive participation, implying the non-presence of conviction and institutions (e.g., funds that transact at non-technical levels).
  5. Positioning suggests dealers are long gamma, meaning they sell into strength and buy into weakness, suppressing volatility and the potential for directional resolve.
Graphic by Spotgamma, taken from The Market Ear

Therefore, given the acceptance of higher prices, the following frameworks for next week’s trade apply.

If participants manage to spend time and build value above the $3,631 micro-composite high-volume node, then initiative buyers remain in control — nearest targets include the $3,655 and $3,668.75 rally highs.

Otherwise, the auction ought to find responsive buyers near the high-volume node. An initiative drive below that figure would put the rally on hold, and would target first $3,620, and then the node near $3,610.

Conclusion: Though sentiment and positioning imply limited potential for further upside, the market remains in a strong technical uptrend bolstered by factors including a divided government, vaccine administration, rebound in profits, low rates, and a small rise in the yield curve.

As of now, the S&P 500 is on the verge of confirming a multi-month balance-break.

Pictured: Daily candlestick chart of the cash S&P 500 Index

Levels Of Interest: Micro-composite HVN at $3,631, the $3,655 and $3,668.75 rally highs, as well as the nodes near $3,620 and $3,610.

Cover photo courtesy by cottonbro from Pexels.