Equity index futures, commodities, and yields trade lower.
Concerns around the debt ceiling.
SPX below balance, 50-day SMA.
Ahead is a 2-day FOMC meeting.
Today we receive NAHB updates.
What Happened: U.S. stock index futures auctioned lower alongside commodities and yields as Treasury Secretary Janet Yellen seeks to raise or suspend the debt ceiling alongside Evergrande fears.
Ahead is data on the National Association of Home Builders Index (10:00 AM ET).
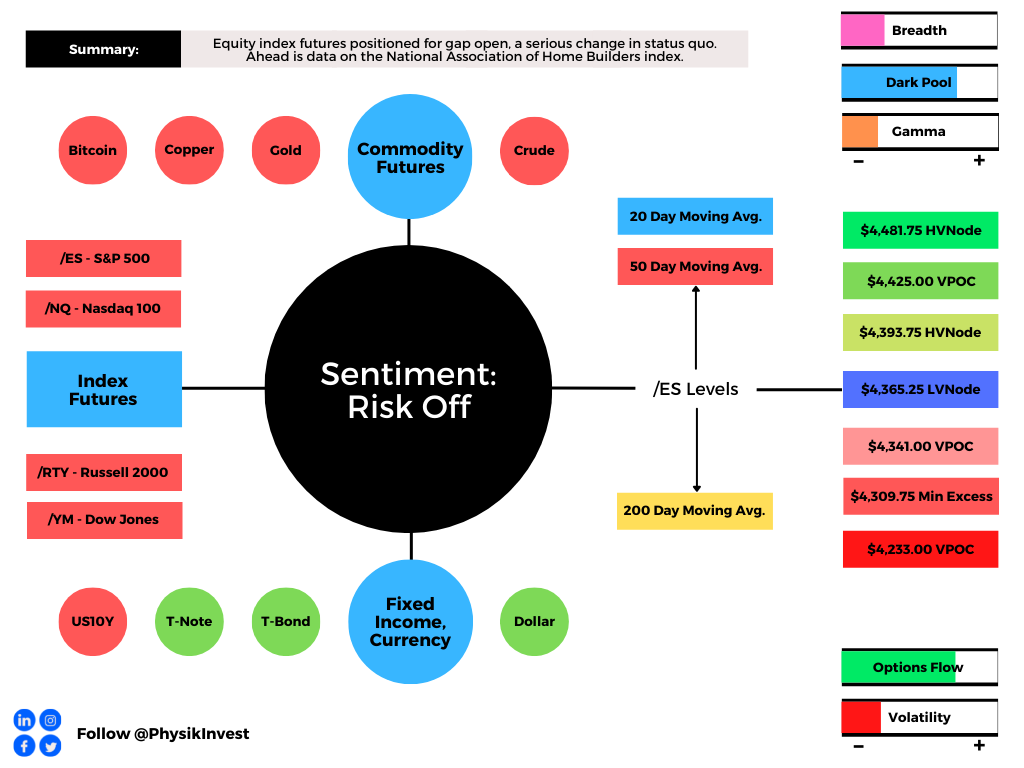
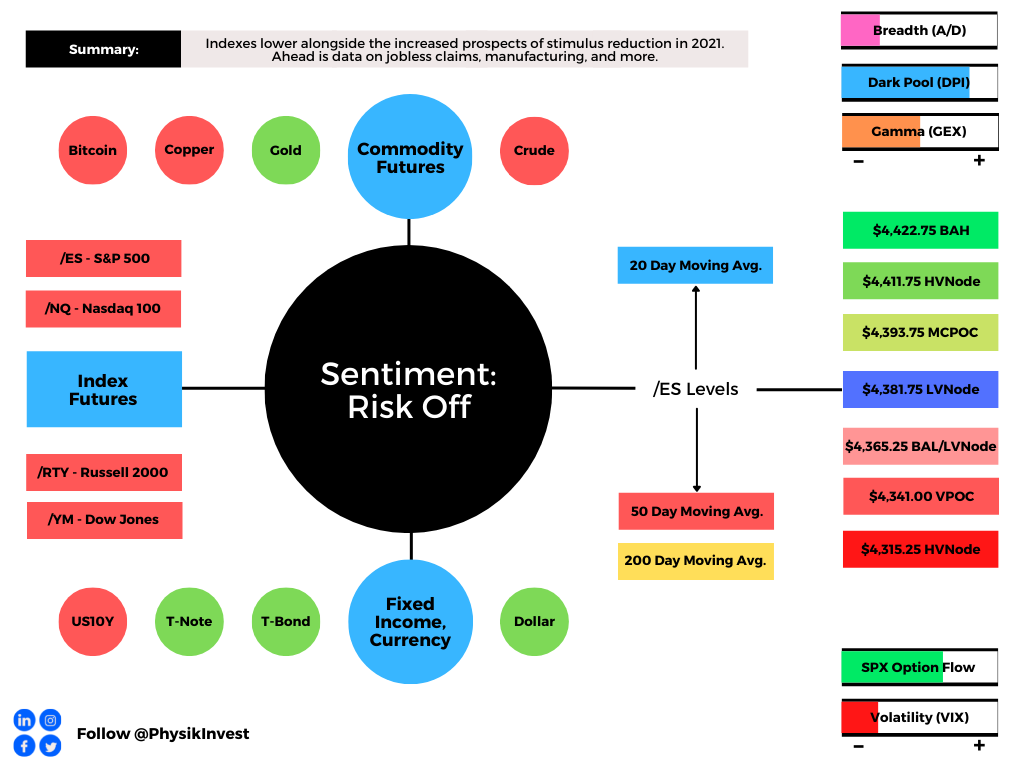
Graphic updated 7:15 AM ET. Sentiment Risk-Off if expected /ES open is below the prior day’s range. /ES levels are derived from the profile graphic at the bottom of the following section. SqueezeMetrics Dark Pool Index (DIX) and Gamma (GEX) calculations are based on where the prior day’s reading falls with respect to the MAX and MIN of all occurrences available. A higher DIX is bullish. At the same time, the lower the GEX, the more (expected) volatility. SHIFT data used for S&P 500 (INDEX: SPX) options activity. Note that options flow is sorted by the call premium spent; if more positive then more was spent on call options. Breadth reflects a reading of the prior day’s NYSE Advance/Decline indicator. VIX reflects a current reading of the CBOE Volatility Index (INDEX: VIX) from 0-100.
What To Expect: As of 7:15 AM ET, Monday’s regular session (9:30 AM – 4:00 PM EST) in the S&P 500 will likely open outside of prior-range and -value, suggesting a high potential for immediate directional opportunity.
Gap Scenarios In Play: Gaps ought to fill quickly. Should they not, that’s a signal of strength; do not fade. Leaving value behind on a gap-fill or failing to fill a gap (i.e., remaining outside of the prior session’s range) is a go-with indicator.

Auctioning and spending at least 1-hour of trade back in the prior range suggests a lack of conviction; in such a case, do not follow the direction of the most recent initiative activity.
During the prior week’s trade, on weakbreadth, the worst-case outcome occurred, evidenced by a balance-area breakout and separation of value below the S&P 500’s 50-day simple moving average (i.e., a visual level likely paid attention to by short-term, technically-driven market participants who generally are unable to defend retests).
Further, the aforementioned trade is happening in the context of a waning economic recovery, heightened valuations in the face of strong EPS expectations, the prospects of stimulus reduction, non-seasonally aligned flows, impactful options and equity market dynamics, divergent sentiment, as well as fears of a mid-cycle transition.
A key risk, as highlighted by Treasury Secretary Janet Yellen, is the debt ceiling which, if not resolved, some economists argue “that an announcement on tapering is likely to be delayed to December, and that Treasury yields could fall further as a result.”
We note that – as Goldman Sachs writes – “The upcoming debt limit deadline is beginning to look as risky as the 2011 debt limit showdown that led to Standard & Poor’s downgrade of the US sovereign rating and eventually to budget sequestration, or the 2013 deadline that overlapped with a government shutdown.”
Adding, as SpotGamma said, “over 50% of stocks [had] their largest gamma position” roll-off Friday. This suggests an increased potential for volatility heading into the September 21-22 FOMC event. SqueezeMetrics confirms.
Today (9/17) is a big OpEx, and SPX dealer gamma (yes, dealers are still long gamma) is getting cut in half by the end of the day.
Moreover, for today, participants may make use of the following frameworks.
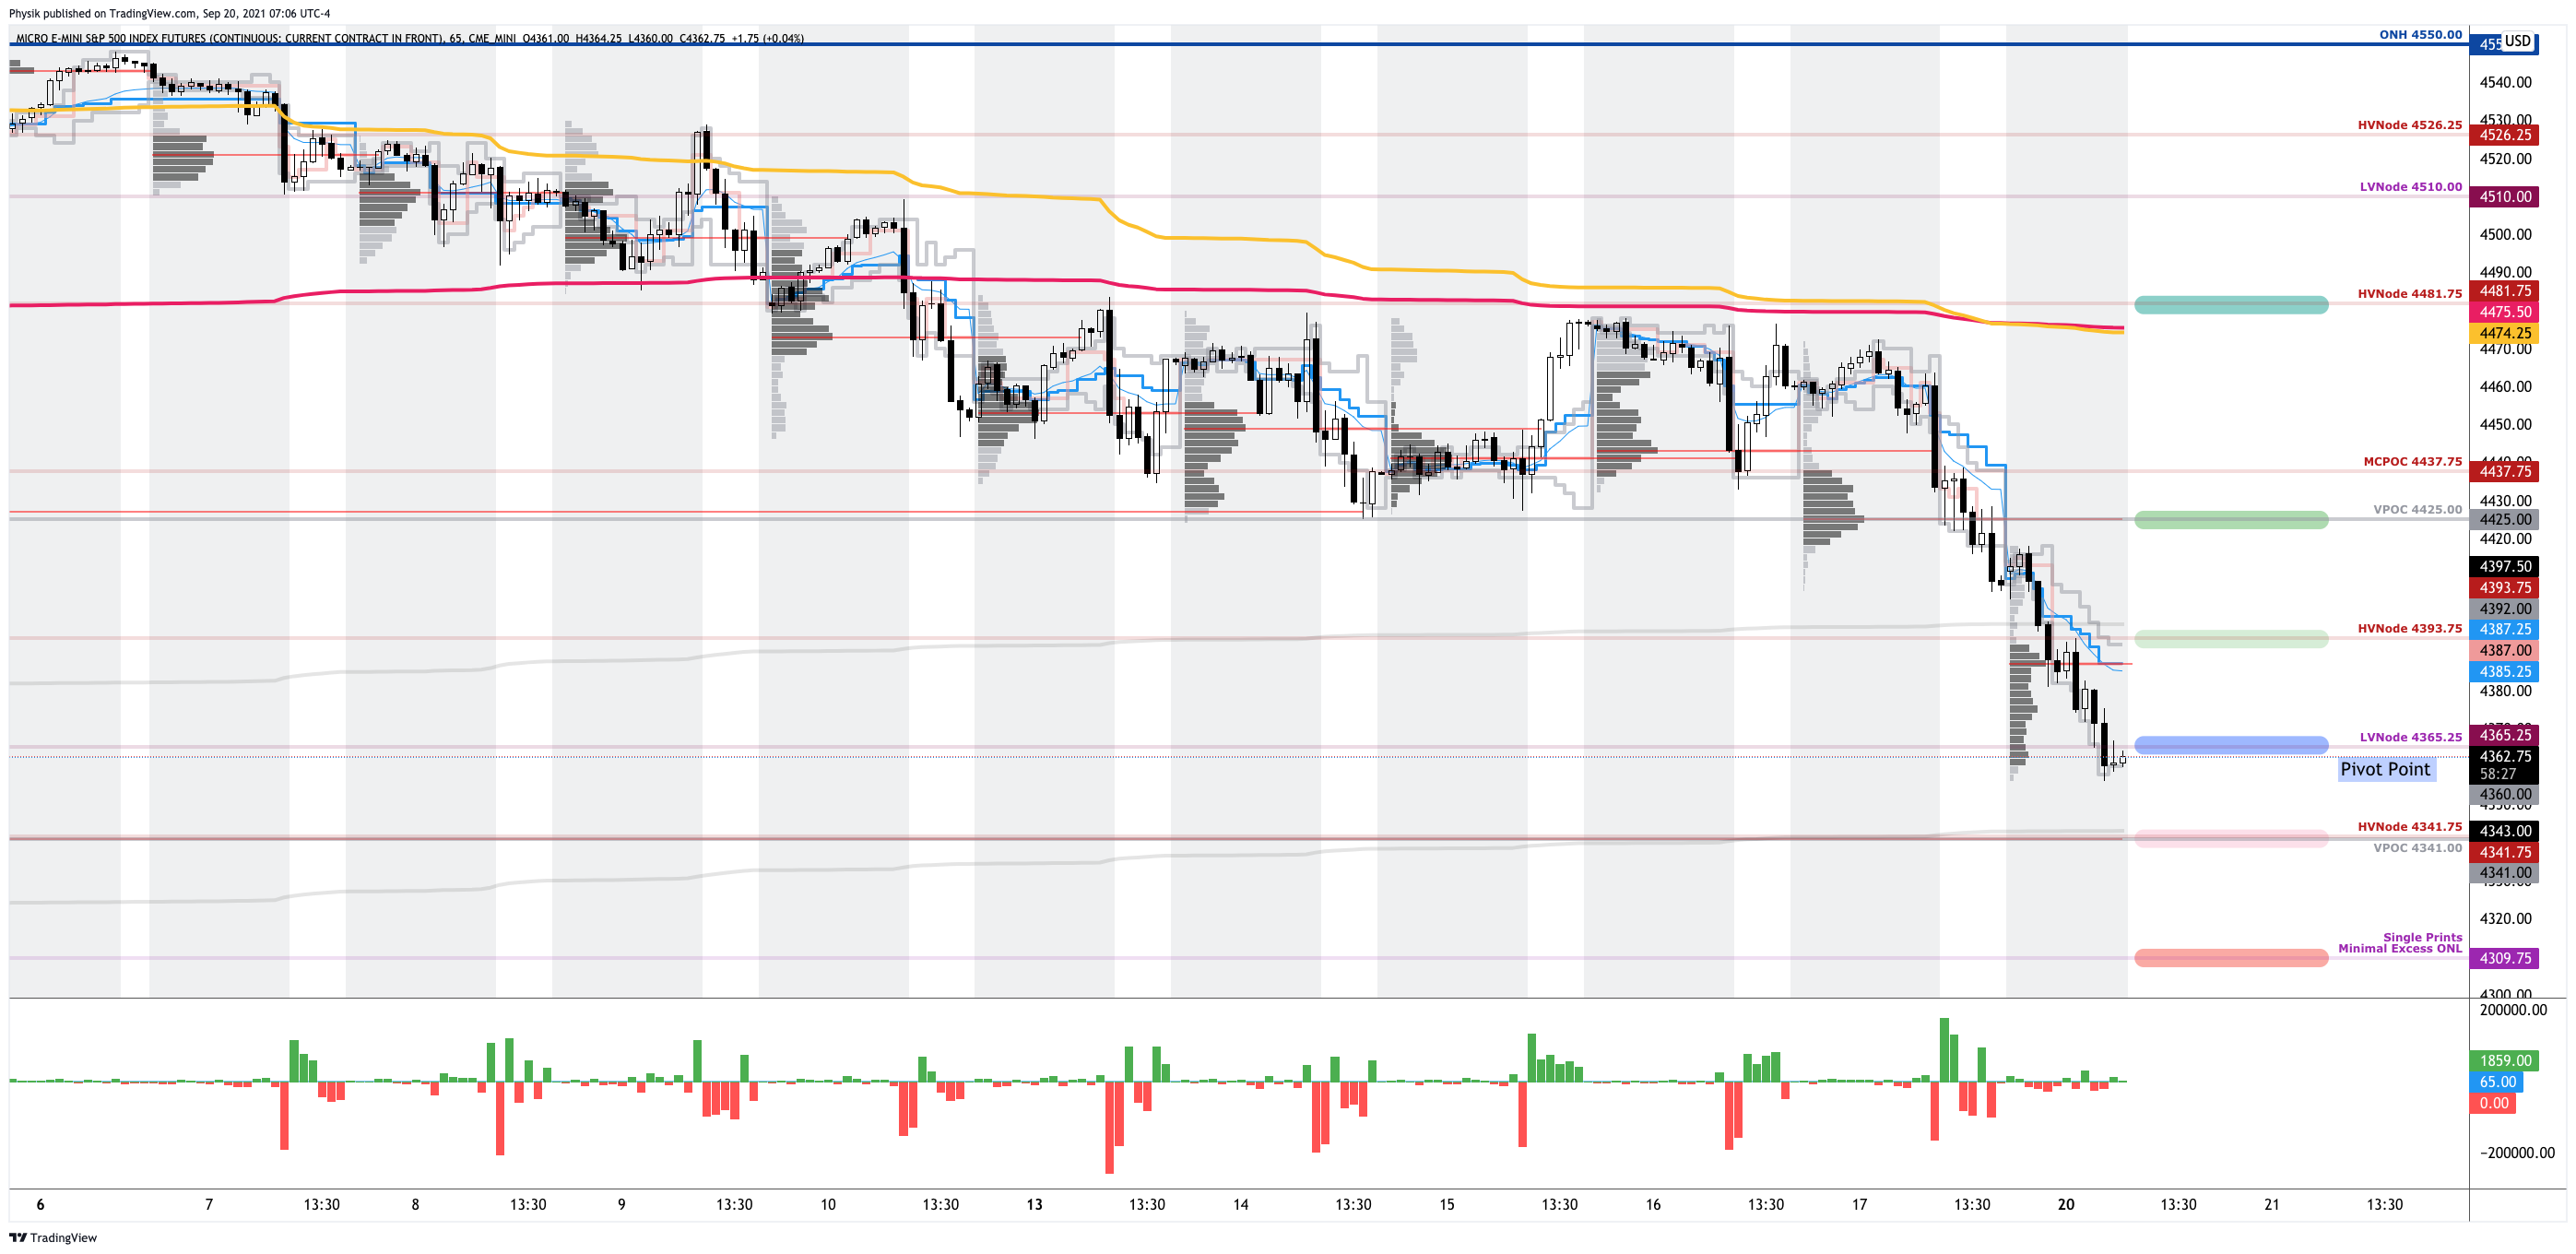
In the best case, the S&P 500 trades sideways or higher; activity above the $4,365.25 low volume area (LVNode) pivot puts in play the $4,393.75 high volume area (HVNode). Initiative trade beyond the HVNode could reach as high as the $4,425.00 untested point of control (VPOC) and $4,481.75 HVNode, or higher.
In the worst case, the S&P 500 trades lower; activity below the $4,365.25 LVNode puts in play the $4,341.00 VPOC. Initiative trade beyond the VPOC could reach as low as $4,309.75 (the intersection of a minimal excess overnight low and poor structure in a prior day session), or lower.
Graphic: 65-minute profile chart of the Micro E-mini S&P 500 Futures updated 7:15 AM ET.
Definitions
Volume Areas: A structurally sound market will build on areas of high volume (HVNodes). Should the market trend for long periods of time, it will lack sound structure, identified as low volume areas (LVNodes). LVNodes denote directional conviction and ought to offer support on any test.
If participants were to auction and find acceptance into areas of prior low volume (LVNodes), then future discovery ought to be volatile and quick as participants look to HVNodes for favorable entry or exit.
POCs: POCs are valuable as they denote areas where two-sided trade was most prevalent in a prior day session. Participants will respond to future tests of value as they offer favorable entry and exit.
News And Analysis
Analyzing the nightmare scenario for China’s economy.
FOMC preview: How to make tapering data-dependent.
China’s property fear is spreading beyond Evergrande.
Goldman Sachs: Low-rate world favors quality growth.
Airbnb CEO Brian Chesky to herald a travel revolution.
Pfizer/BioNTech vaccine is safe and protective for kids.
Risks associated with rising government debt, inflation.
The global housing market is broken dividing countries.
Trudeau set for slimmer victory than hoped in election.
Yellen renews call to up debt limit to avoid catastrophe.
Solana blackout reveals the fragility of cryptocurrency.
FX Weekly: There’s a Lehman in China every 3 years.
What People Are Saying
The problem with backtests is that they tell us an awful lot about the past and an unknown amount about the future.
I’d rather have [a known but small about of knowledge] than [an unknown amount of knowledge].
After years of self-education, strategy development, and trial-and-error, Renato Leonard Capelj began trading full-time and founded Physik Invest to detail his methods, research, and performance in the markets.
Additionally, Capelj is a finance and technology reporter. Some of his biggest works include interviews with leaders such as John Chambers, founder and CEO, JC2 Ventures, Kevin O’Leary, businessman and Shark Tank host, Catherine Wood, CEO and CIO, ARK Invest, among others.
Disclaimer
At this time, Physik Invest does not manage outside capital and is not licensed. In no way should the materials herein be construed as advice. Derivatives carry a substantial risk of loss. All content is for informational purposes only.
Editor’s Note: Late today. So sorry! The main takeaway is that we’re in a window of volatility and participants should focus on leveraging rich skew and complex spreads to hedge or speculate on sideways to lower trade.
Market Commentary
SPX below balance, 50-day SMA.
Ahead is a 2-day FOMC meeting.
Concerns around the debt ceiling.
Rich skew makes hedging easier.
Post OPEX volatility likely in play.
What Happened: U.S. stock index futures auctioned lower, last week, into Friday’s quadruple witching derivatives expiry.
Of interest this week is a meeting of the Federal Open Market Committee (FOMC).
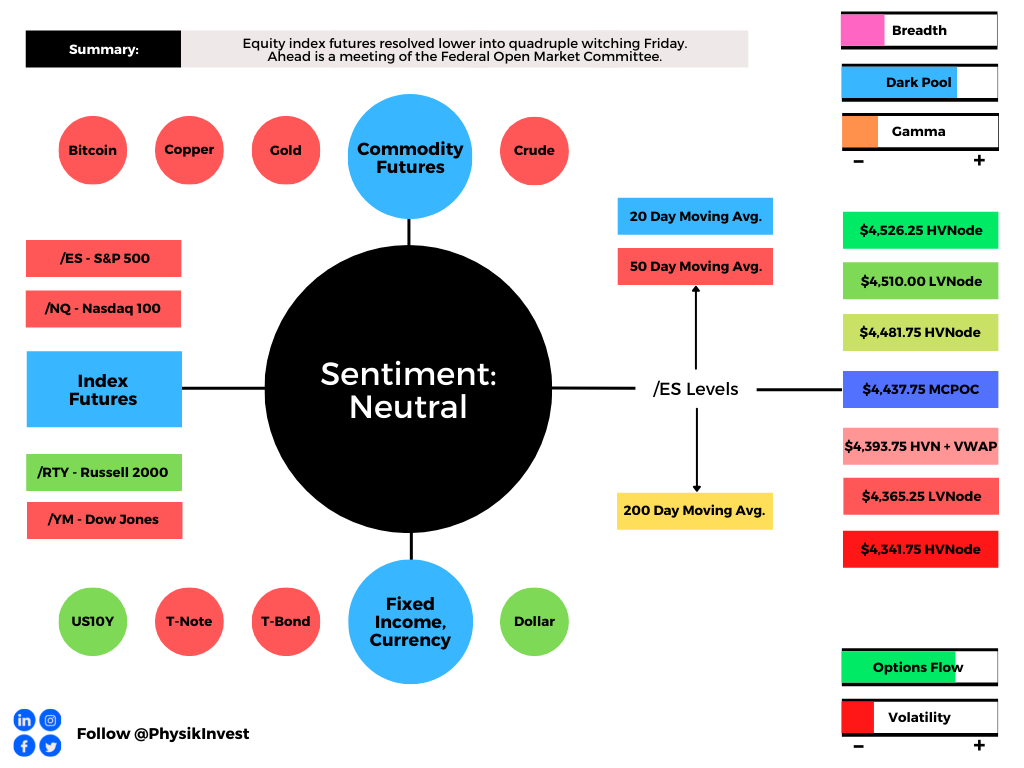
Graphic updated 5:30 PM ET Sunday. Sentiment Neutral if expected /ES open is inside of the prior day’s range. /ES levels are derived from the profile graphic at the bottom of the following section. SqueezeMetrics Dark Pool Index (DIX) and Gamma (GEX) calculations are based on where the prior day’s reading falls with respect to the MAX and MIN of all occurrences available. A higher DIX is bullish. At the same time, the lower the GEX, the more (expected) volatility. SHIFT data used for S&P 500 (INDEX: SPX) options activity. Note that options flow is sorted by the call premium spent; if more positive then more was spent on call options. Breadth reflects a reading of the prior day’s NYSE Advance/Decline indicator. VIX reflects a current reading of the CBOE Volatility Index (INDEX: VIX) from 0-100.
What To Expect: During the prior week’s trade, on weakbreadth, the worst-case outcome occurred, evidenced by a balance-area breakout and separation of value below the S&P 500’s 50-day simple moving average (i.e., a visual level likely paid attention to by short-term, technically-driven market participants who generally are unable to defend retests).
Balance-Break Scenarios: A change in the market (i.e., the transition from two-time frame trade, or balance, to one-time frame trade, or trend) has occurred.

We now monitor for rejection (i.e., return inside of balance) which portends a move to the opposite end of the balance.
Further, the aforementioned trade is happening in the context of a waning economic recovery, heightened valuations in the face of strong EPS expectations, the prospects of stimulus reduction, non-seasonally aligned flows, impactful options and equity market dynamics, divergent sentiment, as well as fears of a mid-cycle transition.
In a Goldman Sachs Group Inc (NYSE: GS) note posted by The Market Ear, analysts “believe it is a critical period for many investors and companies that manage performance to calendar year-end. Such pressures boost volumes and volatility as investors observe earnings reports, analyst days and managements’ guidance for the following year.”
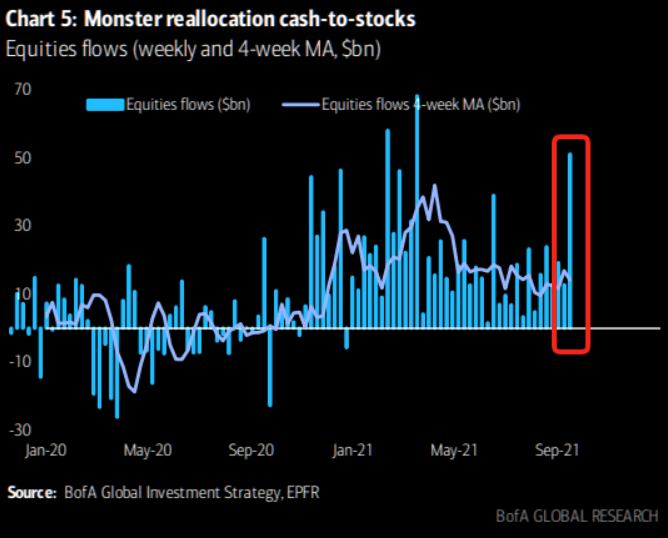
At the same time, inflows into equities are exploding to the upside as JPMorgan Chase & Co (NYSE: JPM) technicians “do not see a pattern on the [S&P 500] chart or any cross-market dynamics that would suggest the market is set for a lasting bearish reversal. The late-Aug systematic sell signals lose statistical significance into next week and the seasonal trends improve into early-Oct.”
Graphic: Bank of America Corporation (NYSE: BAC) charts equity flows, via The Market Ear.
That said, we hone in on risks.
If concerns like the debt ceiling are not resolved, some economists argue, according to Bloomberg, “that an announcement on tapering is likely to be delayed to December, and that Treasury yields could fall further as a result.”
We note that – as Goldman Sachs writes – “The upcoming debt limit deadline is beginning to look as risky as the 2011 debt limit showdown that led to Standard & Poor’s downgrade of the US sovereign rating and eventually to budget sequestration, or the 2013 deadline that overlapped with a government shutdown.”
On the other hand, according to SqueezeMetrics, “the current combination of weak put flows and large customer vanna exposure” is fragile; “people are [still] overexposed to changes in VIX, and will be hurt more than usual if VIX starts moving up. Historically, this means SPX down, VIX up.”
Following SqueezeMetrics’ remarks, SpotGamma adds that “over 50% of stocks [had] their largest gamma position” roll-off Friday. This suggests an increased potential for volatility heading into the September 21-22 FOMC event.
In this post-quad-witching window of non-strength, we may, as a result, use the rich skew to hedge (see below Weekly Trade Idea section).
Today (9/17) is a big OpEx, and SPX dealer gamma (yes, dealers are still long gamma) is getting cut in half by the end of the day.
Moreover, for today, given an increased potential for heightened volatility and initiative trade, participants may make use of the following frameworks.
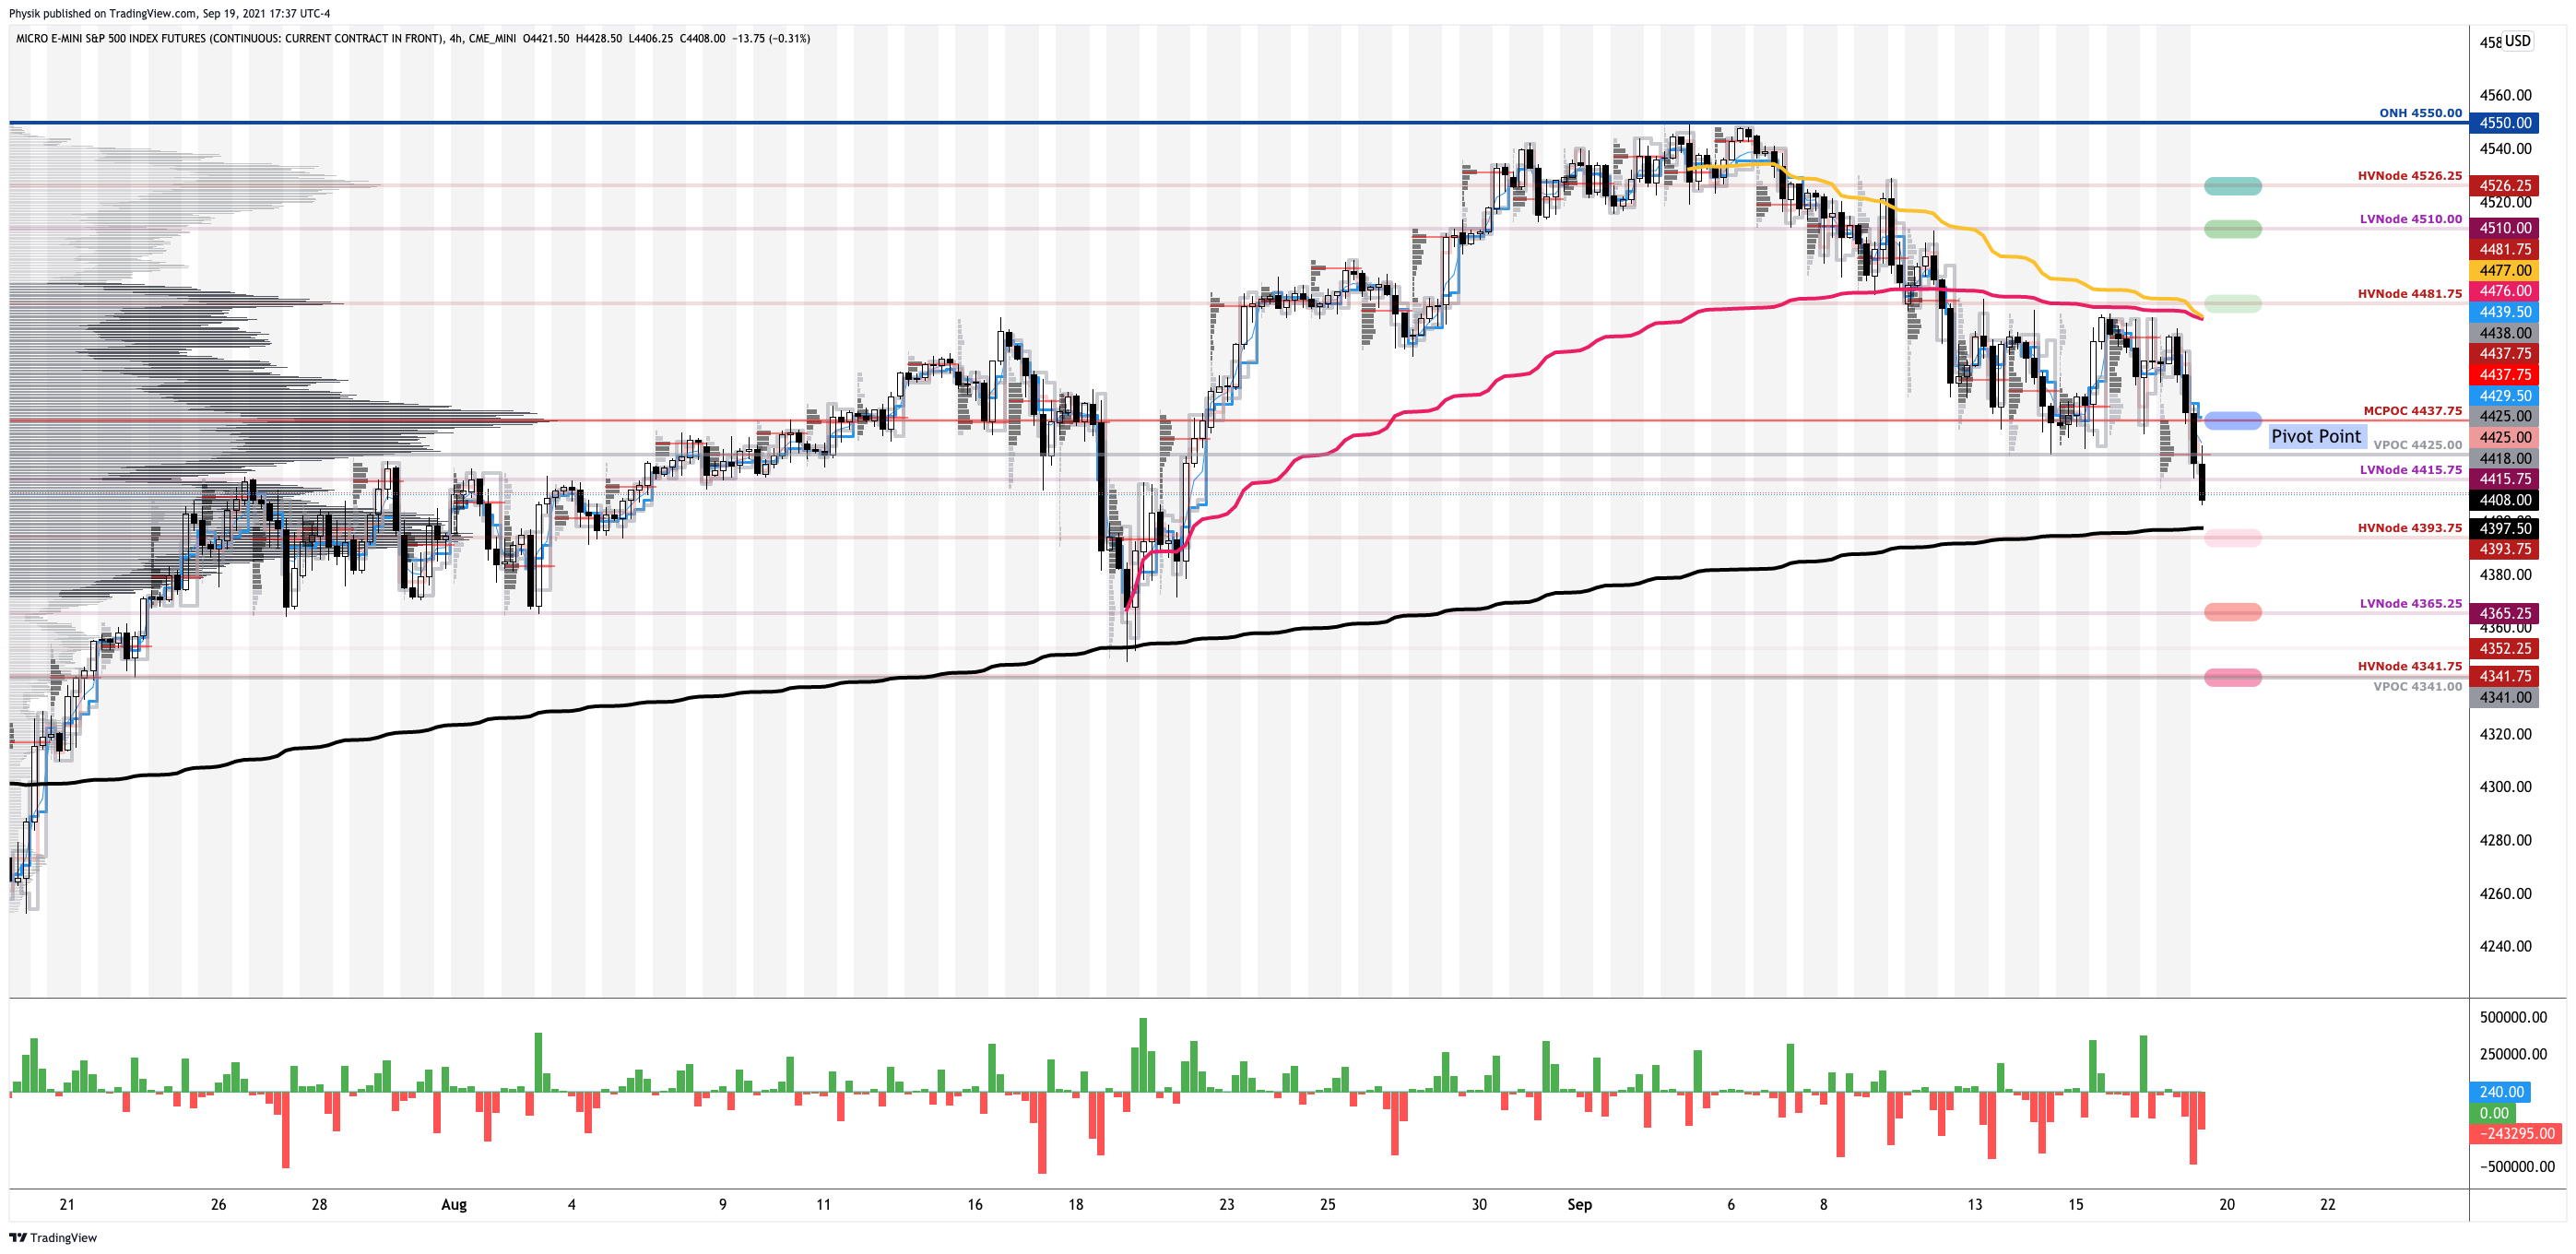
In the best case, the S&P 500 trades sideways or higher; activity above the $4,437.75 micro-composite point of control (MCPOC) puts in play the $4,481.75 high volume area (HVNode). Initiative trade beyond the $4,481.75 HVNode could reach as high as the $4,510.00 low volume area (LVNode) and $4,526.25 HVNode, or higher.
In the worst case, the S&P 500 trades lower; activity below the $4,437.75 MCPOC puts in play the $4,393.75 HVNode. Initiative trade beyond the $4,393.75 HVNode could reach as low as the $4,365.25 LVNode and $4,341.00 untested point of control (VPOC), or lower.
We note that the $4,481.75 and $4,393.75 HVNodes intersect key anchored volume-weighted average price levels. These are metrics highly regarded by chief investment officers, among other participants, for quality of trade. Additionally, liquidity algorithms are benchmarked and programmed to buy and sell around VWAPs.
Graphic: 4-hour profile chart of the Micro E-mini S&P 500 Futures updated 5:30 PM ET Sunday.
Key Definitions
Volume Areas: A structurally sound market will build on areas of high volume (HVNodes). Should the market trend for long periods of time, it will lack sound structure, identified as low volume areas (LVNodes). LVNodes denote directional conviction and ought to offer support on any test.
If participants were to auction and find acceptance into areas of prior low volume (LVNodes), then future discovery ought to be volatile and quick as participants look to HVNodes for favorable entry or exit.
POCs: POCs are valuable as they denote areas where two-sided trade was most prevalent in a prior day session. Participants will respond to future tests of value as they offer favorable entry and exit.
MCPOCs: POCs are valuable as they denote areas where two-sided trade was most prevalent over numerous day sessions. Participants will respond to future tests of value as they offer favorable entry and exit.
Weekly Trade Idea
Please Note: In no way is the below a trade recommendation. Derivatives carry a substantial risk of loss. All content is for informational purposes only.
Options offer an efficient way to gain directional exposure.
If an option buyer was short (long) stock, he or she could buy a call (put) to hedge upside (downside) exposure. Additionally, one can spread, or buy (+) and sell (-) options together, strategically.
Commonly discussed spreads include credit, debit, ratio, back, and calendar.
Credit: Sell -1 option closer to the money. Buy +1 option farther out of the money.
Debit: Buy +1 option closer to the money. Sell -1 option farther out of the money.
Ratio: Buy +1 option closer to the money. Sell -2 options farther out of the money.
Back: Sell -1 option closer to the money. Buy +2 options farther out of the money.
Calendar: Sell -1 option. Buy +1 option farther out in time, at the same strike.
Typically, if bullish (bearish), sell at-the-money put (call) credit spread and/or buy a call (put) debit/ratio spread structured around target price. Alternatively, if the expected directional move is great (small), opt for a back spread (calendar spread). Also, if credit spread, capture 50-75% of the premium collected. If debit spread, capture 2-300% of the premium paid.
Be cognizant of risk exposure to direction (delta), time (theta), and volatility (vega).
Negative (positive) delta = synthetic short (long).
Negative (positive) theta = time decay hurts (helps).
I’m neutral to bearish on the S&P 500 and I think the index may slide toward $4,300. I will structure a spread below the current index price, expiring in about 2 weeks. I will buy the 4400 put option once (+1) and sell the 4300 put option twice (-2) for a $0.65 credit. Should the index not move to my target, I keep the $65 credit. Should it move to $4,300, I could make $10,065.00 at expiry. Should the index move past $4,200.00 or so, I may incur unlimited losses. My goal, with this spread, is to capture the initial credit and close for additional credit if the index moves lower.

If necessary, I will hedge the position by either (A) selling futures, (B) widening strikes, (C) buying a far out-of-the-money put option to cap downside in case of an unpredictable move lower, or (D) roll strikes down in price and out in time.
News And Analysis
An essay on why you keep losing money as a trader.
August retail sales reflect strong consumer demand.
UBS: Resist temptation to time market despite highs.
U.S. debt ceiling fight could cause markets to tumble.
Nasdaq on whether Rule 605 works better in dollars.
Rally driven less by reflation prospects; TINA to stock.
DeFi is disrupting but not derailing traditional finance.
OpenSea admitted recent incident as insider trading.
SEC looks to greater oversight of the crypto markets.
Central bank digital currency; cash for the digital age.
White House to put forward three CFTC nominations.
Some key lessons from NYC’s first SALT conference.
Let’s Hang Out
Salt Lake City, UT September 28-30
About
After years of self-education, strategy development, and trial-and-error, Renato Leonard Capelj began trading full-time and founded Physik Invest to detail his methods, research, and performance in the markets.
Additionally, Capelj is a finance and technology reporter. Some of his biggest works include interviews with leaders such as John Chambers, founder and CEO, JC2 Ventures, Kevin O’Leary, businessman and Shark Tank host, Catherine Wood, CEO and CIO, ARK Invest, among others.
Disclaimer
At this time, Physik Invest does not manage outside capital and is not licensed. In no way should the materials herein be construed as advice. Derivatives carry a substantial risk of loss. All content is for informational purposes only.
Editor’s Note: Before getting into today’s commentary, we take a moment to reflect on the following quote taken from page 123 of The Disciplined Traderby Mark Douglas.
“For years, many people in the academic community believed that the markets were random; this is a perfect example of their general lack of understanding of human nature. People act as a force on prices in perfectly logical ways, when you understand the logic of their fears.”
Also, given Labor Day, markets are closed Monday, September 6. As a result, Daily Briefs will resume Tuesday, September 7. Thank you and have a great extended weekend!
Equity index futures traded sideways to higher last week.
Reality throwing a wrench in seasonality.
Ahead: Light calendar to base decisions.
Equity indices rising; SPX above 50-day.
Positioning risks mount case for volatility.
A couple trade ideas for the week ahead.
What Happened: U.S. stock index futures auctioned mostly sideways to higher, into Friday’s nonfarm payrolls miss.
Next week participants have a light calendar to base decisions around.
Graphic updated 10:30 AM ET 9/4/2021. Sentiment Neutral if expected /ES open is inside of the prior day’s range. SqueezeMetrics Dark Pool Index (DIX) and Gamma (GEX) calculations are based on where the prior day’s reading falls with respect to the MAX and MIN of all occurrences available. A higher DIX is bullish. At the same time, the lower the GEX, the more (expected) volatility. SHIFT data used for S&P 500 (INDEX: SPX) options activity approximation. Note that options flow is sorted by the call premium spent; if more positive then more was spent on call options. Breadth reflects a reading of the prior day’s NYSE Advance/Decline indicator. VIX reflects a current reading of the CBOE Volatility Index (INDEX: VIX) from 0-100.
What To Expect: During the prior week’s trade, on mostly lackluster intraday breadth and market liquidity metrics, the best case outcome occurred, evidenced by new all-time highs in the S&P 500 and Nasdaq 100.
This is significant because the sideways to higher trade marks acceptance, or a willingness to transact at higher prices after a v-pattern recovery, above the key 50-day simple moving average.
V-Pattern: A pattern that forms after a market establishes a high, retests some support, and then breaks above said high. In most cases, this pattern portends continuation.
Graphic: S&P 500 maintaining prices above the 50-day simple moving average. This moving average can be looked at as a key dynamic level on any move lower. Losing that particular level likely changes the tone.
Further, the aforementioned trade is happening in the context of peak growth and a moderation in the economic recovery, as well as non-seasonally aligned inflows, impactful options market dynamics, divergent sentiment, and fears of a mid-cycle transition.
The implications of these themes on price are contradictory.
To elaborate, August, over the past 25 years, has historically been the largest month for equity outflows. According to Goldman Sachs Group Inc’s (NYSE: GS) Scott Rubner, “We have seen none of these outflows and it has been buying the dip (TINA).”
Given this divergence from the norm, advances are not “welcomed and may lead to a quick right tail hedging … [as] option volume notional is 120% of stock volume notional.”
To put it simply, an increased share of options being traded expires within two weeks. The hedging of these directionally sensitive options can represent an increased share of volume in underlying stocks.
As a result, option flows impact the underlying’s price, markedly.
We couple this so-called right-tail hedging with the structural positioning – the so-called wall of worry – that can drive the market through three factors – change in the underlying price (gamma), implied volatility (vanna), and time (charm) – that are well known to impact an options exposure to directional risk or delta.
“Charm is a major driver for support in the markets,” said Cem Karsan of Kai Volatility Advisors. “All of that support is leading up to and accelerating into that Monday-Wednesday window” ahead of options expiration (OPEX). “And then the window really opens for lack of support. It’s not like there’s a bunch of selling all of a sudden. It’s a window of non-strength; a lack of these supportive flows that have been there prior.”
Graphic: @pat_hennessy breaks down returns for the S&P 500, categorized by the week relative to OPEX. Based on his analysis, Pat sees that the “2 weeks prior to OPEX (e.g., 7/30/21 to 8/6/21 in this late-cycle) [have] been extremely bullish.”
With the August monthly OPEX behind us, the focus shifts now to September. At and around the same time, Morgan Stanley’s (NYSE: MS) Michael Wilson expects a formal signal (which would align with Karsan’s window of non-strength) on the taper of asset purchases, that could lead to a mid-cycle transition and possibly an S&P 500 correction.
“Assuming a stable equity risk premium at 345bp, P/Es would fall to 19x, or 10% lower.”
Graphic: @pat_hennessy breaks down S&P 500 OPEX returns. Pat sees that “OPEX week returns peaked in 2016 and have trended lower since.”
Adding, the eventual reduction in the Federal Reserve’s balance sheet – a removal of liquidity – may exacerbate any sort of risk-off scenario in which participants try to get ahead of whatever cascading reaction may come with a taper.
As Karsan explains: “It’s not a coincidence that the mid-February to mid-March 2020 downturn literally started the day after February expiration and ended the day of March quarterly expiration. These derivatives are incredibly embedded in how the tail reacts and there’s not enough liquidity, given the leverage, if the Fed were to taper.”
SpotGamma – in a September 2, 2021 note – echoed the possibility of volatility; “markets are fast approaching a window of volatility which could produce some pretty sharp volatility: 9/15 VIX expiration, 9/17 Quarterly OPEX and the 9/22 FOMC. This lineup is particularly interesting as we believe that expiration leads to a pickup in volatility – however, traders may hold the pause button on selling that volatility due to the FOMC. This could catch less sophisticated vol sellers off guard and lead to some exacerbated volatility.”
Others, like SqueezeMetrics – which sees “the current combination of weak put flows and large customer vanna exposure” as fragile – suggest that volatility risks have risen, too.
Given the big picture context (i.e., status quo – higher prices – in the face of volatility risks) participants may make use of the following frameworks.
In the best case, the S&P 500 trades sideways or higher; activity above the $4,527.75 high volume area (HVNode) pivot puts in play the $4,550.00 overnight high (ONH). Initiative trade beyond the ONH could reach as high as the Fibonacci extensions at $4,556.25 and $4,592.25.
In the worst case, the S&P 500 trades lower; activity below the $4,527.75 HVNode puts in play the $4,510.00 regular trade high (RTH High). Initiative trade beyond the RTH High could reach as low as the $4,495.00 and $4,481.75 HVNodes.
Overnight Rally Highs (Lows): Typically, there is a low historical probability associated with overnight rally-highs (lows) ending the upside (downside) discovery process.

Volume Areas: A structurally sound market will build on past areas of high volume. Should the market trend for long periods of time, it will lack sound structure (identified as a low volume area which denotes directional conviction and ought to offer support on any test).

If participants were to auction and find acceptance into areas of prior low volume, then future discovery ought to be volatile and quick as participants look to areas of high volume for favorable entry or exit.
Graphic: 65-minute profile chart of the Micro E-mini S&P 500 Futures updated 10:30 AM ET 9/4/2021.
Weekly Trade Ideas
Please Note: In no way is the below a trade recommendation. Derivatives carry a substantial risk of loss. All content is for informational purposes only.
Options offer an efficient way to gain directional exposure.
If an option buyer was short (long) stock, he or she could buy a call (put) to hedge upside (downside) exposure. Additionally, one can spread, or buy (+) and sell (-) options together, strategically.
Commonly discussed spreads include credit, debit, ratio, back, and calendar.
Credit: Sell -1 option closer to the money. Buy +1 option farther out of the money.
Debit: Buy +1 option closer to the money. Sell -1 option farther out of the money.
Ratio: Buy +1 option closer to the money. Sell -2 options farther out of the money.
Back: Sell -1 option closer to the money. Buy +2 options farther out of the money.
Calendar: Sell -1 option. Buy +1 option farther out in time, at the same strike.
Typically, if bullish (bearish), sell at-the-money put (call) credit spread and/or buy a call (put) debit/ratio spread structured around target price. Alternatively, if the expected directional move is great (small), opt for a back spread (calendar spread). Also, if credit spread, capture 50-75% of the premium collected. If debit spread, capture 2-300% of the premium paid.
Be cognizant of risk exposure to direction (delta), time (theta), and volatility (vega).
Negative (positive) delta = synthetic short (long).
Negative (positive) theta = time decay hurts (helps).
Trade Idea 1: SELL -1 1/2 BACKRATIO GOOGL 100 17 SEP 21 2770/2670 PUT @.15 LMT
I’m neutral on Alphabet Inc and I think the stock may travel sideways to lower over the next couple of weeks, toward $2,770.00, or the volume-weighted average price anchored from the July 28 gap. I will structure a spread below the current stock price, expiring in 2 weeks. I will buy the 2770 put option once (+1) and sell the 2670 put option twice (-2) for a $0.15 credit. Should the stock not move to my target, I keep the $15 credit. Should it move to $2,670.00 I could make $10,015.00 at expiry. Should the stock move past $2,570.00 or so, I may incur unlimited losses. My goal, with this spread, is to capture the initial credit and close for additional credit if the stock moves lower.
If necessary, I will hedge the position by either (A) selling stock, (B) widening strikes, (C) buying a far out-of-the-money put option to cap downside in case of an unpredictable move lower, or (D) roll strikes down in price and out in time.
Trade Idea 2: SELL -1 1/2 BACKRATIO SPX 100 (Weeklys) 10 SEP 21 4480/4430 PUT @.25 LMT
I’m neutral on the S&P 500 and I think the index may travel sideways to lower over the next week, toward its key moving averages. I will structure a spread below the current index price, expiring in 2 weeks. I will buy the 4480 put option once (+1) and sell the 4430 put option twice (-2) for a $0.25 credit. Should the index not move to my target, I keep the $25 credit. Should it move to $4,430.00, past the 20-day simple moving average, I could make $5,025.00 at expiry. Should the index move past $4,380.00 or so, beyond the 50-day simple moving average, I may incur unlimited losses. My goal, with this spread, is to capture the initial credit and close for additional credit if the index moves lower.
If necessary, I will hedge the position by either (A) selling futures, (B) widening strikes, (C) buying a far out-of-the-money put option to cap downside in case of an unpredictable move lower, or (D) roll strikes down in price and out in time.
News And Analysis
Moody’s Weekly Market Outlook on Ida, gas, and inflation.
Reinventing tail risk: a fresh look at market crash protection.
Kansas City Southern mulls $27B CP Rail bid after ruling.
ARK Invest on commodities, innovation, economic signals.
Taliban relies on financing from China following withdrawal.
Hedge Funds cut exposure to stocks that count on China.
Three hours a week: China has put limits on video gaming.
Global gas prices threatening to dent economic recovery.
Are Treasuries in a cautious stance as debt story unfolds?
Could the macro theme/picture be an edge for day traders?
George Soros: Investors in China face a rude awakening.
400,000 homeowners enter the final month in forbearance.
Let’s Hang Out
Los Angeles, CA September 10-12
Salt Lake City, UT September 28-30
About
After years of self-education, strategy development, and trial-and-error, Renato Leonard Capelj began trading full-time and founded Physik Invest to detail his methods, research, and performance in the markets.
Additionally, Capelj is a finance and technology reporter. Some of his biggest works include interviews with leaders such as John Chambers, founder and CEO, JC2 Ventures, Kevin O’Leary, businessman and Shark Tank host, Catherine Wood, CEO and CIO, ARK Invest, among others.
Disclaimer
At this time, Physik Invest does not manage outside capital and is not licensed. In no way should the materials herein be construed as advice. Derivatives carry a substantial risk of loss. All content is for informational purposes only.
Equity index and commodity futures trade higher overnight. Yields and VIX are higher, too.
Unpacking drivers behind market.
Ahead: Data on new home sales.
Eyeing digestion, sideways trade.
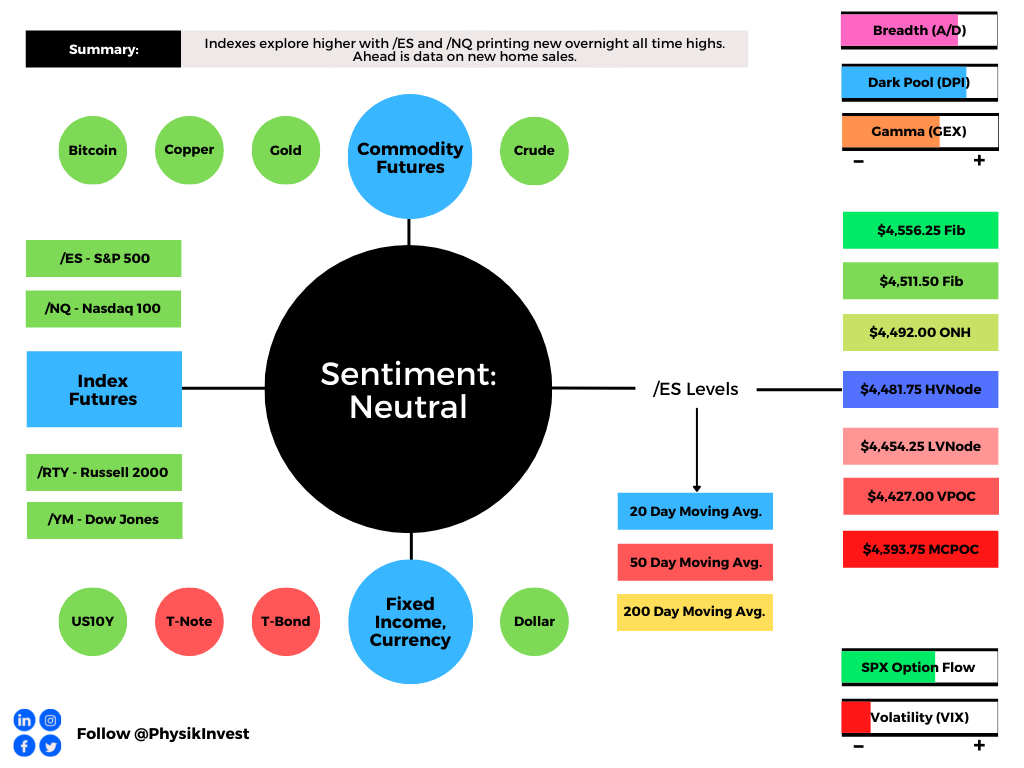
What Happened: U.S. stock index futures explored higher prices overnight as investors looked to position themselves for the upcoming Jackson Hole Economic Symposium August 26-28, 2021. The Russell 2000 is leading the pack alongside the Nasdaq 100.
Ahead is data on new home sales (10:00 AM ET).
Graphic updated 6:30 AM ET. Sentiment Neutral if expected /ES open is inside of the prior day’s range. See here for more on the Dark Pool Index (DPI) and Gamma (GEX). A higher DPI approximation is bullish. At the same time, the lower the GEX approximation, the more volatility. SHIFT data used for options activity approximation. Note that options flow is sorted by the call premium spent; if green and more positive then more was spent on call options. Breadth reflects a reading of the prior day’s Advance/Decline indicator. VIX reflects a current reading of the CBOE Volatility Index from 0-100.
What To Expect: As of 6:30 AM ET, Tuesday’s regular session (9:30 AM – 4:00 PM EST) in the S&P 500 will likely open just inside of prior-range and -value, suggesting a limited potential for immediate directional opportunity.
Adding, during the prior day’s regular trade, on strong intraday breadth and middling market liquidity metrics, the best case outcome occurred, evidenced by trade above the $4,476.50 overnight high (ONH). This is significant because Monday’s trade took back 100% of last week’s liquidation, completing a v-pattern recovery.
V-Pattern: A pattern that forms after a market establishes a high, retests some support, and then breaks above said high. In most cases, this pattern portends continuation.
Further, the aforementioned trade is happening in the context of impactful options market dynamics, moderating growth, and inclination to taper stimulus in spite of a resurgence in COVID-19.
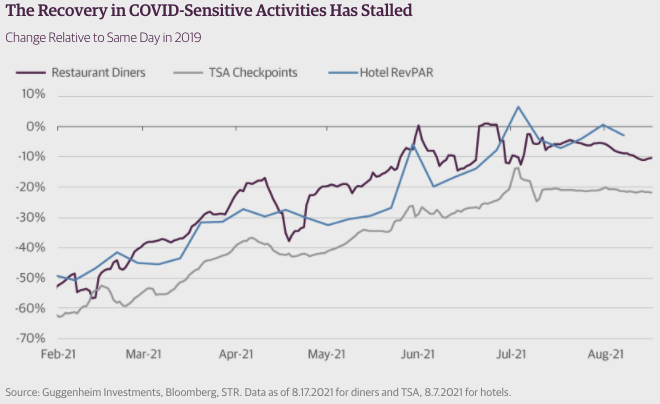
Some of the implications of these themes on price are supportive and contradictory; to elaborate, “[t]he good news is that our economic recovery is unlikely to fully reverse, given lack of political will for a return to stricter lockdown measures. But evidence of a slowdown in third-quarter economic activity will continue to mount in the coming weeks, putting the Fed’s 7 percent real GDP growth projection for 2021 out of reach,” strategists at Guggenheim noted.
“This string of weaker data will likely prompt the Fed, led by Chair Powell and Governor Brainard, to take a more cautious approach to the timing and speed of tapering plans, in turn keeping Treasury yields low.”
At the same time, briefly, we should touch on the so-called sale of any volatility spike which can – through the process of hedging – support the market. Here’s just one example that’s been receiving a lot of attention.
“In theory, if a stock was dropping and the retail masses all started to sell puts, they could push market makers to start buying large blocks of shares,” SpotGamma, an important voice in the space, says. “This could stabilize a dropping stock.”
Graphic: SqueezeMetrics details the implications of customer activity in the options market, on the underlying’s order book. For instance, in selling a put, customers add liquidity and stabilize the market. How? The counterparty long the put will buy (sell) the underlying to neutralize directional risk as price falls (rises).
Moreover, for today, given expectations of heightened volatility and responsive trade, participants may make use of the following frameworks.
Responsive Buying (Selling): Buying (selling) in response to prices below (above) an area of recent price acceptance.
In the best case, the S&P 500 trades sideways or higher; activity above the $4,481.75 high volume area (HVNode) puts in play the $4,492.00 overnight, minimal excess all-time high (ONH). Initiative trade beyond the ONH could reach as high as the $4,511.50 and $4,556.25 Fibonacci extensions.
In the worst case, the S&P 500 trades lower; activity below the $4,481.75 HVNode puts in play the $4,454.25 low volume area (LVNode). Initiative trade beyond the LVNode could reach as low as the $4,427.00 untested point of control (VPOC) and $4,393.75 micro composite point of control (MCPOC).
Overnight Rally Highs (Lows): Typically, there is a low historical probability associated with overnight rally-highs (lows) ending the upside (downside) discovery process.

Excess: A proper end to price discovery; the market travels too far while advertising prices. Responsive, other-timeframe (OTF) participants aggressively enter the market, leaving tails or gaps which denote unfair prices.

Volume Areas: A structurally sound market will build on past areas of high volume. Should the market trend for long periods of time, it will lack sound structure (identified as a low volume area which denotes directional conviction and ought to offer support on any test).

If participants were to auction and find acceptance into areas of prior low volume, then future discovery ought to be volatile and quick as participants look to areas of high volume for favorable entry or exit.

POCs: POCs are valuable as they denote areas where two-sided trade was most prevalent. Participants will respond to future tests of value as they offer favorable entry and exit.
Graphic: 65-minute profile chart of the Micro E-mini S&P 500 Futures updated 6:30 AM ET.
News And Analysis
Ignoring Risk: S&P 500 doubles to the fastest bull market.
Moviegoers return, but COVID, streaming threaten theater.
S&P Global unpacks digital asset infrastructure – custody.
Existing home sales back on a rise as inventory improves.
Latin American conditions are painting a favorable portrait.
Funds trimming hawkish Fed bets as Jackson Hole looms.
Ten cities successfully weathering COVID on management.
Cumberland Advisors: Who is working and who is not yet?
PBOC will boost its credit support, stabilize money growth.
USDC reserve to be converted into less risky investments.
Year-to-date loan default volumes down 88% versus 2020.
Bank acquisitions of big fintechs rare amid startup growth.
What People Are Saying
Several people asked me, WTF is this 100 point, 2 trading day, w/out even a .3% pullback Rally?! What’s causing it?! I don’t know. But what I can tell u w/confidence is when 1 of the oldest info brokers on the street turns the market, u pay attention.Especially w/the Fed in play. https://t.co/9cApnAcW1g
It now takes >8 yrs of wages to buy a used home (!), 20% above the 50-yr norm. If this excess gets resolved via the numerator, we'll have a housing bubble burst that could rival 2008. This is the Black Swan. If rates do back up, they'll come crashing right back down again.
Fear and trust cannot exist at the same time. Traders have to understand what our fears are so we work to build trust. Before we open, breath deeply to slow everything down. Breath in trust……. Breath out fear.
After years of self-education, strategy development, and trial-and-error, Renato Leonard Capelj began trading full-time and founded Physik Invest to detail his methods, research, and performance in the markets.
Additionally, Capelj is a finance and technology reporter. Some of his biggest works include interviews with leaders such as John Chambers, founder and CEO, JC2 Ventures, Kevin O’Leary, businessman and Shark Tank host, Catherine Wood, CEO and CIO, ARK Invest, among others.
Disclaimer
At this time, Physik Invest does not manage outside capital and is not licensed. In no way should the materials herein be construed as advice. Derivatives carry a substantial risk of loss. All content is for informational purposes only.
Equity index and commodity futures trade higher overnight. Yields and VIX are higher, too.
Post-FOMC minutes recovery continues.
Ahead: CFNAI, Markit PMI, home sales.
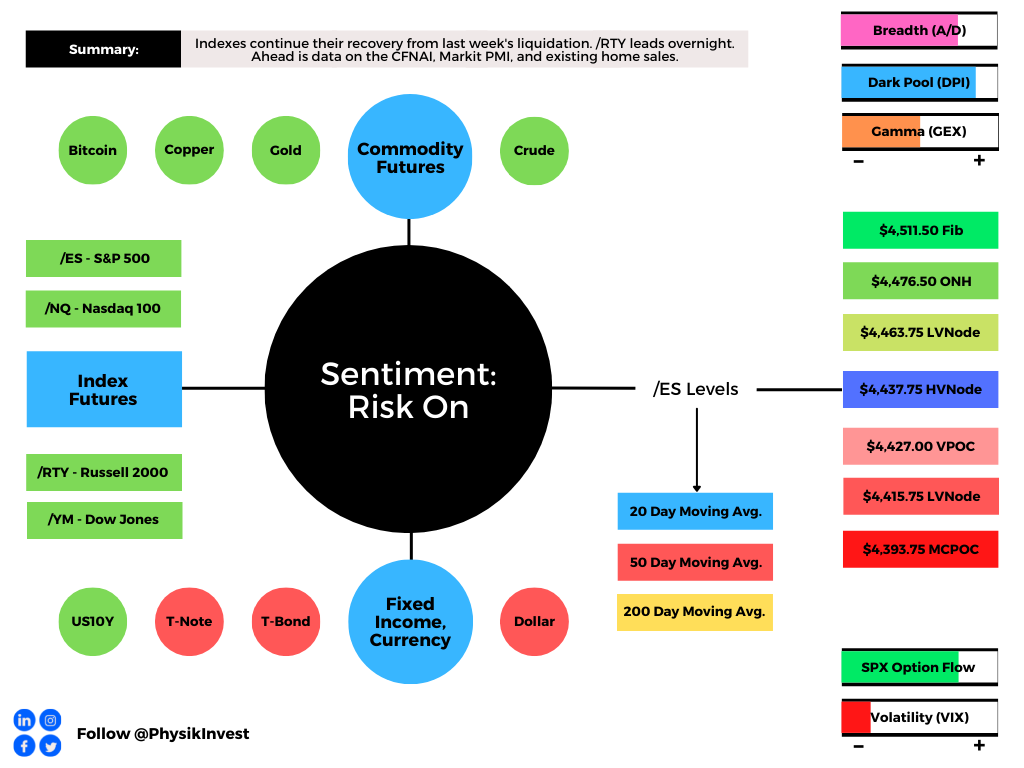
What Happened: U.S. stock index futures auctioned higher, continuing their recovery from last week’s liquidation that intensified after the release of Federal Open Market Committee (FOMC) minutes. Leading the overnight price rise is the Russell 2000, a laggard in recent trade.
Ahead is data on the Chicago Fed National Activity Index (8:30 AM ET), Markit manufacturing and services PMI (9:45 AM ET), as well as existing home sales (10:00 AM ET).
Graphic updated 6:40 AM ET. Sentiment Risk-On if expected /ES open is above the prior day’s range. See here for more on the Dark Pool Index (DPI) and Gamma (GEX). A higher DPI approximation is bullish. At the same time, the lower the GEX approximation, the more volatility. SHIFT data used for options activity approximation. Note that options flow is sorted by the call premium spent; if green and more positive then more was spent on call options. Breadth reflects a reading of the prior day’s Advance/Decline indicator. VIX reflects a current reading of the CBOE Volatility Index from 0-100.
What To Expect: As of 6:20 AM ET, Monday’s regular session (9:30 AM – 4:00 PM EST) in the S&P 500 will likely open just outside of prior-range and -value, suggesting a potential for immediate directional opportunity.
Adding, during Friday’s regular trade, on stronger intraday breadth and market liquidity metrics, the best-case outcome occurred, evidenced by trade above the spike base a few ticks below the $4,422.75 balance area high (BAH). This is significant because the post-FOMC minutes liquidation has been negated.
Gap Scenarios In Play: Gaps ought to fill quickly. Should they not, that’s a signal of strength; do not fade. Leaving value behind on a gap-fill or failing to fill a gap (i.e., remaining outside of the prior session’s range) is a go-with indicator.

Auctioning and spending at least 1-hour of trade back in the prior range suggests a lack of conviction; in such a case, do not follow the direction of the most recent initiative activity.
Further, the aforementioned trade is happening in the context of – most importantly – the Federal Reserve’s intent to taper asset purchases. This theme’s implications on price are contradictory; to elaborate, unemployment is falling rapidly, signaling to the Fed the need to reduce support.
“Bottom line, the critical element is inflation expectations,” former Fed Chairman Ben Bernanke says. “As long as they stay in the vicinity of 2%, the Fed’s strategy will achieve its goals. If inflation expectations were to move significantly higher, the Fed would be forced to tighten more quickly and probably slow the economy more than they would like.”
Ultimately, “[r]ising interest rates could be the kryptonite to the bubble in long-duration assets,” Rich Bernstein of Richard Bernstein Associates adds.
Moreover, for today, given expectations of heightened volatility and responsive trade into the Jackson Hole Economic Policy Symposium August 26-28, 2021, participants may make use of the following frameworks.
Responsive Buying (Selling): Buying (selling) in response to prices below (above) an area of recent price acceptance.
In the best case, the S&P 500 trades sideways or higher; activity above the $4,437.75 high volume area (HVNode) puts in play the $4,463.75 low volume area (LVNode). Initiative trade beyond the LVNode could reach as high as the $4,476.50 overnight high (ONH) and $4,511.50 Fibonacci extension.
In the worst case, the S&P 500 trades lower; activity below the $4,437.75 HVNode puts in play the $4,427.00 untested point of control (VPOC). Initiative trade beyond the VPOC could reach as low as the $4,415.75 LVNode and $4,393.75 micro composite point of control (MCPOC).
Overnight Rally Highs (Lows): Typically, there is a low historical probability associated with overnight rally-highs (lows) ending the upside (downside) discovery process.

Volume Areas: A structurally sound market will build on past areas of high volume. Should the market trend for long periods of time, it will lack sound structure (identified as a low volume area which denotes directional conviction and ought to offer support on any test).

If participants were to auction and find acceptance into areas of prior low volume, then future discovery ought to be volatile and quick as participants look to areas of high volume for favorable entry or exit.

POCs: POCs are valuable as they denote areas where two-sided trade was most prevalent. Participants will respond to future tests of value as they offer favorable entry and exit.
Graphic: 65-minute profile chart of the Micro E-mini S&P 500 Futures updated 6:20 AM ET.
1/x Whoa horsy. Whoa! The BTD crew has given us another quick 100 pts again in the 🪟of weakness, but we are now beginning to outrun our correction in 🕰. With Jackson hole event-Vol still a week away, Vol in front of Jackson Hole is well supplied.All those 🍌🍌should help to put pic.twitter.com/vPtigimaS1
After years of self-education, strategy development, and trial-and-error, Renato Leonard Capelj began trading full-time and founded Physik Invest to detail his methods, research, and performance in the markets.
Additionally, Capelj is a finance and technology reporter. Some of his biggest works include interviews with leaders such as John Chambers, founder and CEO, JC2 Ventures, Kevin O’Leary, businessman and Shark Tank host, Catherine Wood, CEO and CIO, ARK Invest, among others.
Disclaimer
At this time, Physik Invest does not manage outside capital and is not licensed. In no way should the materials herein be construed as advice. Derivatives carry a substantial risk of loss. All content is for informational purposes only.
Equity index futures recover after last week’s liquidation.
Unpacking the inclination to taper.
Ahead: Busy week. Jackson Hole.
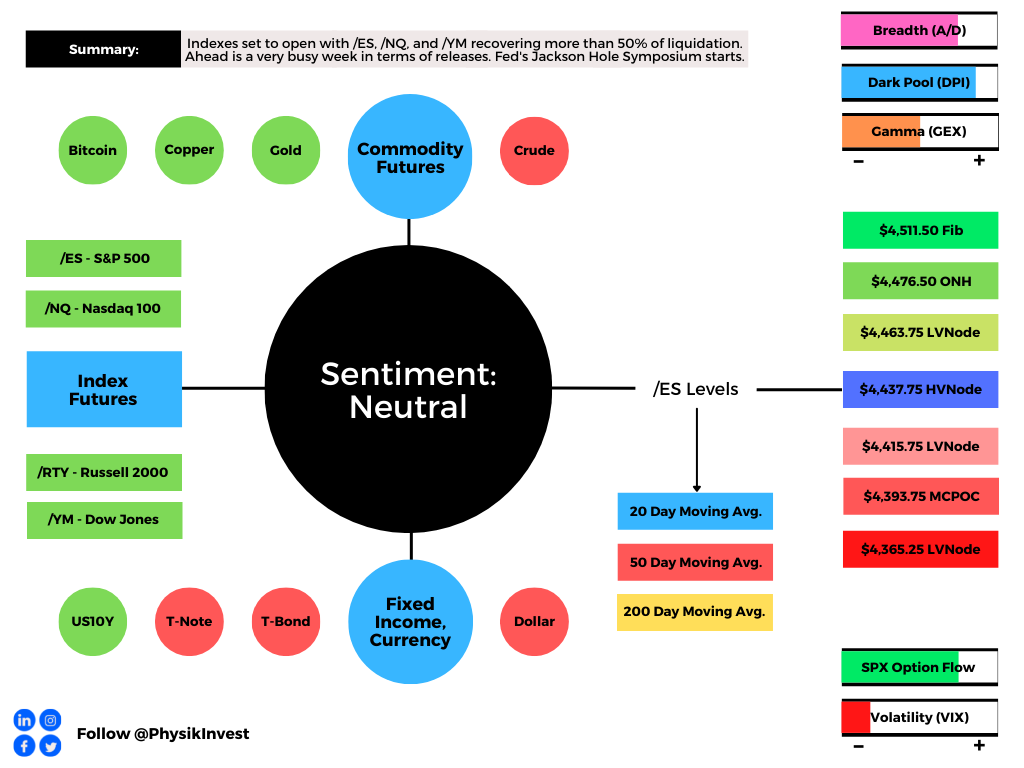
What Happened: The S&P 500, Nasdaq 100, and Dow Jones Industrial Average recovered more than 50% of last week’s liquidation. The Russell 2000 remains a laggard, trading weak below the halfway point of a multi-month consolidation.
Ahead is data on the Markit manufacturing and services PMI (Monday), existing-home sales (Monday), new home sales (Tuesday), durable goods orders (Wednesday), nondefense capital goods orders (Wednesday), jobless claims (Thursday), GDP revision (Thursday), personal income (Friday), consumer spending (Friday), core PCE price index (Friday), trade in goods (Friday), as well University of Michigan consumer sentiment (Friday).
Also, the Jackson Hole Economic Policy Symposium starts Thursday.
Graphic updated 12:30 PM ET Sunday. Sentiment Neutral if expected /ES open is inside of the prior day’s range. See here for more on the Dark Pool Index (DPI) and Gamma (GEX). A higher DPI approximation is bullish. At the same time, the lower the GEX approximation, the more volatility. SHIFT data used for options activity approximation. Note that options flow is sorted by the call premium spent; if green and more positive then more was spent on call options. Breadth reflects a reading of the prior day’s Advance/Decline indicator. VIX reflects a current reading of the CBOE Volatility Index from 0-100.
What To Expect: During the prior week’s trade, on weak intraday breadth and market liquidity metrics, the worst-case outcome occurred, evidenced by a liquidation that repaired poor profile structures as low as the S&P 500’s $4,353.00 point of control (POC).
POCs: POCs are valuable as they denote areas where two-sided trade was most prevalent. Participants will respond to future tests of value as they offer favorable entry and exit.
Then, during Friday’s session, a p-shaped profile structure (which denotes short covering) took back the spike base a few ticks below the $4,422.75 balance area high (BAH) – a prior break from value – negating the post-Federal Open Market Committee (FOMC) minutes liquidation.
Further, the aforementioned trade is happening in the context of moderating growth, peak long equity positioning, breadth divergences, a resurgence in COVID-19, geopolitical tensions, and an inclination to taper stimulus.
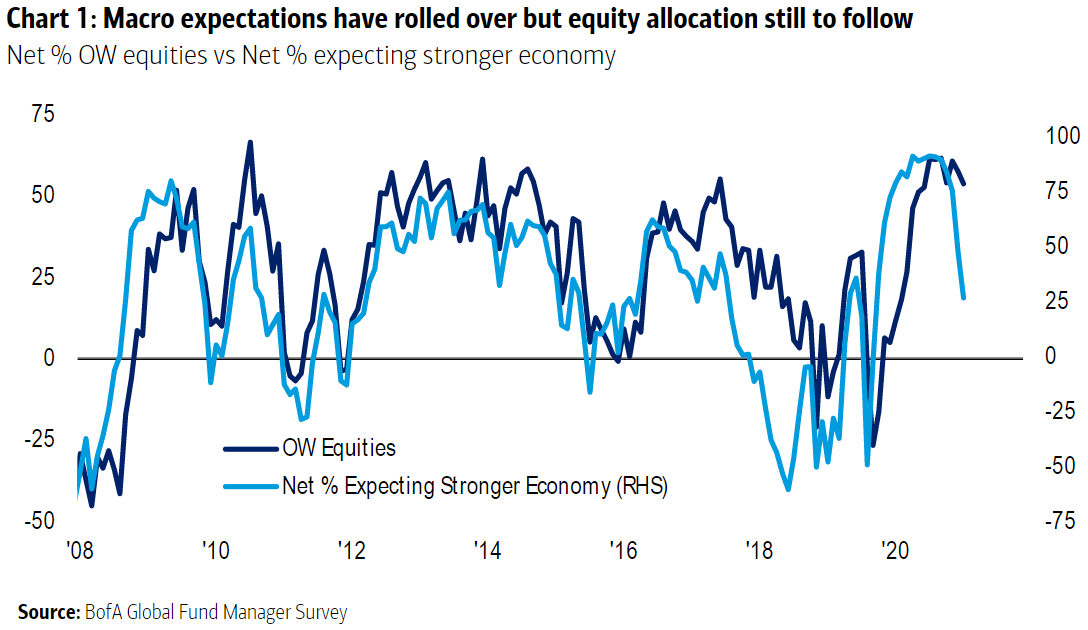
The implications of these themes on price are contradictory; to elaborate, as measures of macro expectations rolled over, in line with companies’ profit expectations, Treasury yields declined, triggering a rotation back into high growth equities.
Graphic: As created by Bank of America Corporation (NYSE: BAC) and shared by Bloomberg, the proportion of fund managers expecting a stronger economy tumbles while the number who are overweight in equities has barely moved.
This comes at the same time a strong July jobs report helped the Federal Reserve (Fed) move toward a consensus on tapering. Given the Fed’s enormous share of the Treasury market, fear of downside equity volatility is apparent; a shift higher in the VIX futures terms structure denotes demand for protection into and through the Jackson Hole Economic Policy Symposium August 26-28, 2021.
“The Fed has fostered a broad range of bubbles because their massive liquidity injections have been trapped in the financial economy,” Rich Bernstein of Richard Bernstein Associates said in a summaryquoted by Bloomberg. “As with any cornered market, there are limited buyers and prices fall as the “cornerer” sells. Accordingly, bond prices seem likely to fall (interest rates rise) [as the] Fed reduces its cornered positions. Rising interest rates could be the kryptonite to the bubble in long-duration assets (long-term bonds, technology, innovation, disruption, bitcoin, etc.).”
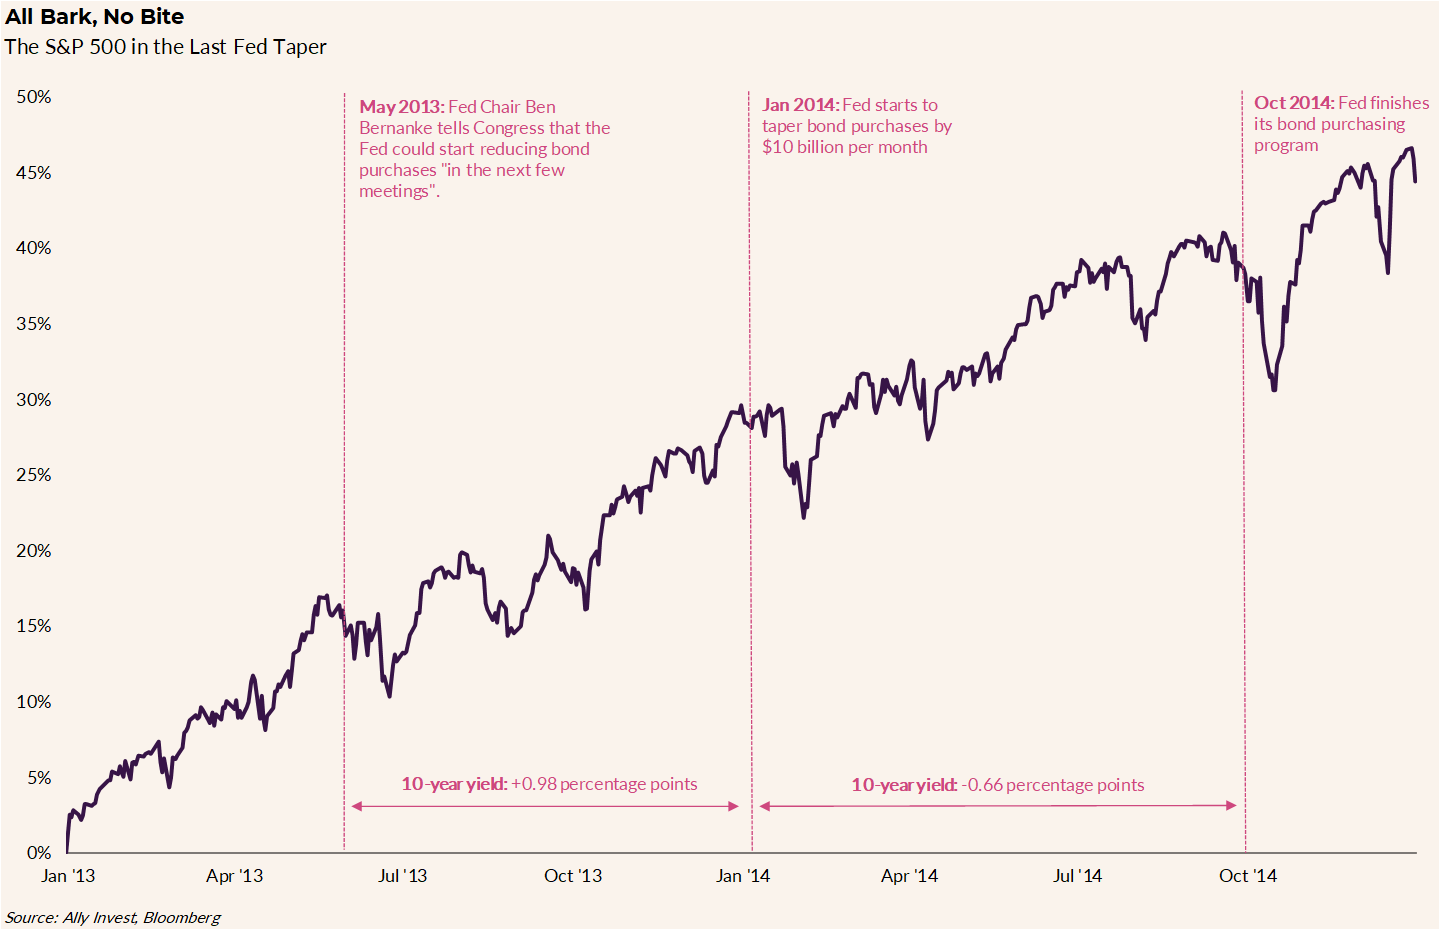
Obviously, tapering may have major repercussions. However, to balance our expectations, looking back to 2014, when the Fed was scaling back bond purchases, the S&P 500 rose over 10% and rates fell after spiking initially.
Graphic: Ally Financial Inc-owned (NYSE: ALLY) Ally Invest unpacks 2014 taper of Federal Reserve bond buying.
Ally Invest’s chief investment strategist Lindsey Bell concludes: “Conditions may not be perfect, but they could be strong enough to move from a wheelchair to some heavy-duty crutches, especially if it means keeping overheating symptoms like inflation at bay.”
Regardless, major risks remain given the growth of derivatives and the potential for offsides positioning. Even the slightest reduction in the Federal Reserve’s balance sheet – the removal of liquidity – may prompt a cascading reaction that exacerbates underlying price movements.
As Kai Volatility’s Cem Karsan once told me for a Benzinga article: “It’s not a coincidence that the mid-February to mid-March 2020 downturn literally started the day after February expiration and ended the day of March quarterly expiration. These derivatives are incredibly embedded in how the tail reacts and there’s not enough liquidity, given the leverage, if the Fed were to taper.”
Moreover, for next week, given expectations of heightenedvolatility, participants may make use of the following frameworks.
In the best case, the S&P 500 trades sideways or higher; activity above the $4,437.75 high volume area (HVNode) pivot puts in play the $4,463.75 low volume area (LVNode). Initiative trade beyond the LVNode could reach as high as the $4,476.50 overnight high (ONH) and $4,511.50 Fibonacci extension, or higher.
In the worst case, the S&P 500 trades lower; activity below the $4,437.75 HVNode puts in play the $4,415.75 LVNode. Initiative trade beyond the LVNode could reach as low as $4,393.75 micro composite point of control (MCPOC) and $4,365.25 LVNode, or lower.
Overnight Rally Highs (Lows): Typically, there is a low historical probability associated with overnight rally-highs (lows) ending the upside (downside) discovery process.

Volume Areas: A structurally sound market will build on past areas of high volume. Should the market trend for long periods of time, it will lack sound structure (identified as a low volume area which denotes directional conviction and ought to offer support on any test).

If participants were to auction and find acceptance into areas of prior low volume, then future discovery ought to be volatile and quick as participants look to areas of high volume for favorable entry or exit.
Graphic: 65-minute profile chart of the Micro E-mini S&P 500 Futures updated 12:30 PM ET Sunday.
News And Analysis
Moody’s discusses taper – maybe this year, maybe not.
Single-family home construction the highest since 2007.
Fannie Mae says COVID-19 surge won’t impact growth.
Goldman Sachs cut its U.S. growth forecast on the virus.
APAC corporate rating recovery may stall as cases rise.
Wall Street is just as baffled about markets as last year.
Canadian inflation has risen to 3.7%, troubling Trudeau.
Powell second term approval boosted by Yellen backing.
A gaping 10-year bond call reveals growth uncertainties.
Michael Burry of ‘Big Short’ bet against ARK Invest ETF.
Outcry rises after White House looks to quell gas prices.
Big risks and trends facing banks globally and regionally.
Could a Western U.S. drought threaten municipal credit.
Bulls need to take the price quickly (in few trading sessions) to 225 levels. Any hesitation to rebound from support will send weak signal and "can" risk breaking down the horizontal support around 2100. $RUTpic.twitter.com/UVT3BwJibJ
Every trader has a plan, but what separates good traders from bad traders is how they execute their plan & how they deal with changing conditions when the market environment changes. I also share my thoughts on #ES_F & #ETH in this #developyouredge
After years of self-education, strategy development, and trial-and-error, Renato Leonard Capelj began trading full-time and founded Physik Invest to detail his methods, research, and performance in the markets.
Additionally, Capelj is a finance and technology reporter. Some of his biggest works include interviews with leaders such as John Chambers, founder and CEO, JC2 Ventures, Kevin O’Leary, businessman and Shark Tank host, Catherine Wood, CEO and CIO, ARK Invest, among others.
Disclaimer
At this time, Physik Invest does not manage outside capital and is not licensed. In no way should the materials herein be construed as advice. Derivatives carry a substantial risk of loss. All content is for informational purposes only.
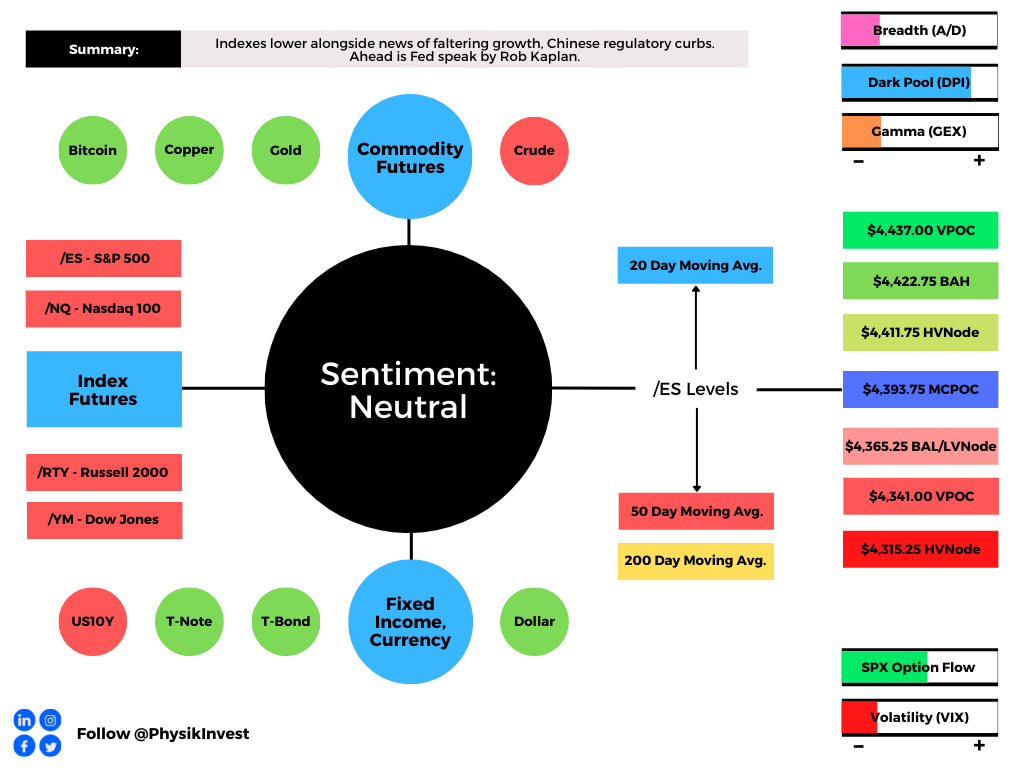
What Happened: U.S. stock index futures auctioned sideways to lower overnight alongside news of faltering growth and Chinese regulatory curbs, ahead of a monthly options expiration (OPEX) and next week’s Federal Reserve event at Jackson Hole.
Ahead is Fed-speak by Rob Kaplan (11:00 AM ET).
Graphic updated 6:30 AM ET. Sentiment Neutral if expected /ES open is inside of the prior day’s range. See here for more on the Dark Pool Index (DPI) and Gamma (GEX). A higher DPI approximation is bullish. At the same time, the lower the GEX approximation, the more volatility. SHIFT data used for options activity approximation. Note that options flow is sorted by the call premium spent; if green and more positive then more was spent on call options. Breadth reflects a reading of the prior day’s Advance/Decline indicator. VIX reflects a current reading of the CBOE Volatility Index from 0-100.
What To Expect: As of 6:30 AM ET, Friday’s regular session (9:30 AM – 4:00 PM EST) in the S&P 500 will likely open inside of prior-range and -value, suggesting a limited potential for immediate directional opportunity.
Adding, during the prior day’s regular trade, on weak intraday breadth and market liquidity metrics, the best case outcome occurred, evidenced by trade above the $4,381.75 low volume area (LVNode), up to the $4,411.75 high volume area (HVNode).
Volume Areas: A structurally sound market will build on past areas of high volume. Should the market trend for long periods of time, it will lack sound structure (identified as a low volume area which denotes directional conviction and ought to offer support on any test).

If participants were to auction and find acceptance into areas of prior low volume, then future discovery ought to be volatile and quick as participants look to areas of high volume for favorable entry or exit.
Despite trading higher yesterday, the S&P 500, in particular, validated the knee-jerk, albeit weaker, selling, after the release of Federal Open Market Committee (FOMC) minutes.
Given how far up into Wednesday’s range participants found acceptance, the spike base a few ticks below the $4,422.75 balance area high (BAH) is firmly in play today.
Spike Rules In Play: Spike’s mark the beginning of a break from value. Spikes higher (lower) are validated by trade at or above (below) the spike base (i.e., the origin of the spike).
Further, the aforementioned trade is happening in the context of an inclination to taper stimulus in the face of a resurgent COVID-19 coronavirus. This theme’s implications on price are contradictory; to elaborate, “A strong job report in July was enough to move the Fed needle from a very early debate on tapering in June to a consensus on tapering this year in July,” Nordea strategists note.
“[A] tapering process should lead to 1) a stronger USD, 2) a flatter yield curve, 3) an expensive USD in the xCcy basis and 4) underperformance of small caps. The USD curve already started flattening markedly on the heels of the message delivered in June when Powell started hinting that tapering was actually debated within the Fed.”
Moreover, for today, given expectations of higher volatility and responsive trade, in light of an expected open in balance, participants may make use of the following frameworks.
Balance (Two-Timeframe Or Bracket): Rotational trade that denotes current prices offer favorable entry and exit. Balance-areas make it easy to spot a change in the market (i.e., the transition from two-time frame trade, or balance, to one-time frame trade, or trend).
In the best case, the S&P 500 trades sideways or higher; activity above the $4,393.75 micro composite point of control (MCPOC) puts in play the $4,411.75 HVNode. Initiative trade beyond the HVNode could reach as high as the $4,422.75 BAH and $4,437.00 untested point of control (VPOC), repairing Thursday’s minimal excess high.
In the worst case, the S&P 500 trades lower; activity below the $4,393.75 MCPOC puts in play the $4,365.25 balance area low (BAL) and LVNode. Initiative trade beyond the $4,365.25 figure could reach as low as the $4,341.00 VPOC and $4,315.25 HVNode.
POCs: POCs are valuable as they denote areas where two-sided trade was most prevalent. Participants will respond to future tests of value as they offer favorable entry and exit.

Excess: A proper end to price discovery; the market travels too far while advertising prices. Responsive, other-timeframe (OTF) participants aggressively enter the market, leaving tails or gaps which denote unfair prices.
Graphic: 65-minute profile chart of the Micro E-mini S&P 500 Futures updated 6:30 AM ET. A key go/no-go level of interest is the dark blue Volume Weighted Average Price (VWAP) anchored from the FOMC minutes release (blue in color). VWAPs are a metric highly regarded by chief investment officers, among other participants, for quality of trade. Additionally, liquidity algorithms are benchmarked and programmed to buy and sell around VWAPs. Based on trade in relation to AVWAP, the average buyer since FOMC is losing. What happens when we remain above AVWAP?
News And Analysis
Savings stash built up during pandemic mostly spent.
Elon Musk unveils a humanoid robot for boring work.
BlackRock: Dollar assets a way to manage volatility.
Emerging oil nations reject climate curb on exploring.
APAC corporate rating recovery may stall on COVID.
Surging delta cases reverse march back to the office.
What People Are Saying
“the Street has too much notional to insure, but not enough balance-sheet available to insure it” … 😓
After years of self-education, strategy development, and trial-and-error, Renato Leonard Capelj began trading full-time and founded Physik Invest to detail his methods, research, and performance in the markets.
Additionally, Capelj is a finance and technology reporter. Some of his biggest works include interviews with leaders such as John Chambers, founder and CEO, JC2 Ventures, Kevin O’Leary, businessman and Shark Tank host, Catherine Wood, CEO and CIO, ARK Invest, among others.
Disclaimer
At this time, Physik Invest does not manage outside capital and is not licensed. In no way should the materials herein be construed as advice. Derivatives carry a substantial risk of loss. All content is for informational purposes only.
Equity index futures continued yesterday’s late-day liquidation.
Chop-chop: Fed nears time to taper.
Busy morning in regards to releases.
Range is wide; volatility may persist.
What Happened: U.S. stock index futures auctioned lower overnight alongside the increased prospects of stimulus reduction in 2021.
Ahead is data on jobless claims (8:30 AM ET), Philadelphia Fed manufacturing index (8:30 AM ET), and the index of leading economic indicators (10:00 AM ET).
Graphic updated 6:45 AM ET. Sentiment Risk-Off if expected /ES open is below the prior day’s range. See here for more on the Dark Pool Index (DPI) and Gamma (GEX). A higher DPI approximation is bullish. At the same time, the lower the GEX approximation, the more volatility. SHIFT data used for options activity approximation. Note that options flow is sorted by the call premium spent; if green and more positive then more was spent on call options. Breadth reflects a reading of the prior day’s Advance/Decline indicator. VIX reflects a current reading of the CBOE Volatility Index from 0-100.
What To Expect: As of 6:45 AM ET, Thursday’s regular session (9:30 AM – 4:00 PM EST) in the S&P 500 will likely open outside of prior-range and -value, suggesting a higher potential for immediate directional opportunity.
Adding, during the prior day’s regular trade, on weak intraday breadth and market liquidity metrics, the worst-case outcome occurred, evidenced by a close below the $4,422.75 balance area high (BAH) and 20-day simple moving average (SMA).
This is significant because the BAH marked a go/no-go level on a prior breakout and the SMA – a metric that ought to solicit a response by short-term (i.e., technically driven) participants who may be unable to defend retests – broke. As a result of this failure, odds supported the move to the $4,365.25 balance area low (BAL), the lower end of the balance.
Gap Scenarios In Play: Gaps ought to fill quickly. Should they not, that’s a signal of strength; do not fade. Leaving value behind on a gap-fill or failing to fill a gap (i.e., remaining outside of the prior session’s range) is a go-with indicator.

Auctioning and spending at least 1-hour of trade back in the prior range suggests a lack of conviction; in such a case, do not follow the direction of the most recent initiative activity.
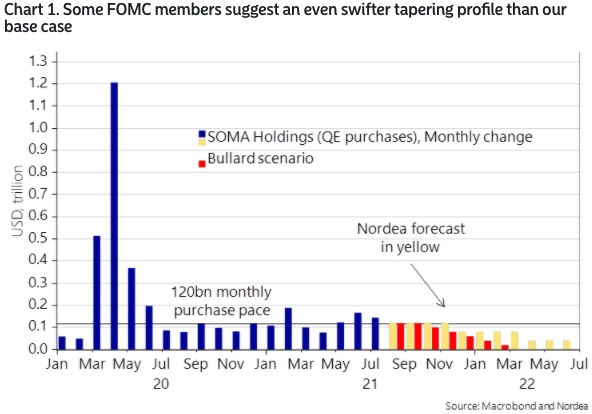
Further, the aforementioned trade is happening in the context of a shift in the tapering debate, ahead of the Jackson Hole Economic Policy Symposium August 26-28, 2021. This theme’s implications on price are contradictory; to elaborate, the summary of the late July Federal Open Market Committee (FOMC) meeting suggests an inclination to start reducing the pace of asset purchases this year.
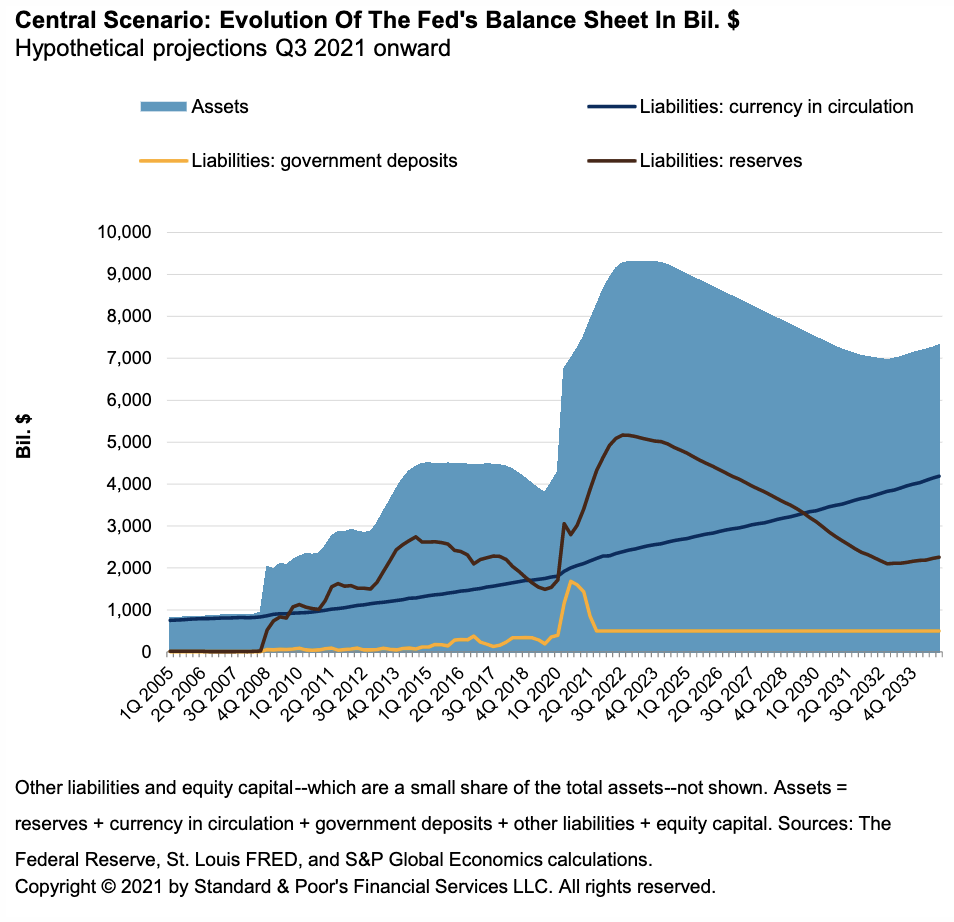
Graphic: S&P Global unpacks Federal Reserve balance sheet hypotheticals.
As an aside, markets went on a historic tear over the past year or so given monetary frameworks and max liquidity, so to speak. Add in the growth of derivatives exposure and potential for offsides positioning, even the slightest reduction in the Federal Reserve’s balance sheet – the removal of liquidity – has the potential to prompt a cascading reaction that exacerbates underlying price movements.
As Kai Volatility’s Cem Karsan, in a conversation with me for a Benzinga article, said: “It’s not a coincidence that the mid-February to mid-March 2020 downturn literally started the day after February expiration and ended the day of March quarterly expiration. These derivatives are incredibly embedded in how the tail reacts and there’s not enough liquidity, given the leverage, if the Fed were to taper.”
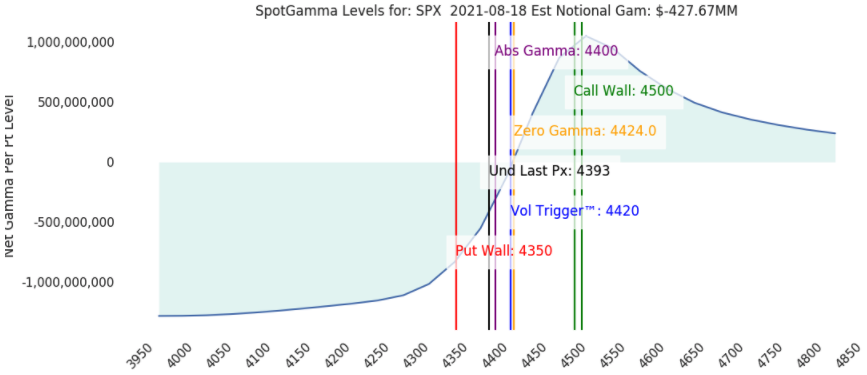
Graphic: SpotGamma data suggests the cash-settled S&P 500 Index (INDEX: SPX) may open in short-gamma territory. To note, gamma is the sensitivity of an option to changes in the underlying price. Dealers that take the other side of options trades hedge their exposure to risk by buying and selling the underlying. When dealers are short-gamma, they hedge by buying into strength and selling into weakness. When dealers are long-gamma, they hedge by selling into strength and buying into weakness. The former exacerbates volatility. The latter calms volatility.
Moreover, for today, in light of higher volatility and responsive trade expectations – given overextension from value (i.e., fair prices for two-sided trade as derived from the volume profile) and a test of a key anchored volume-weighted average price (VWAP) – participants may make use of the following frameworks.
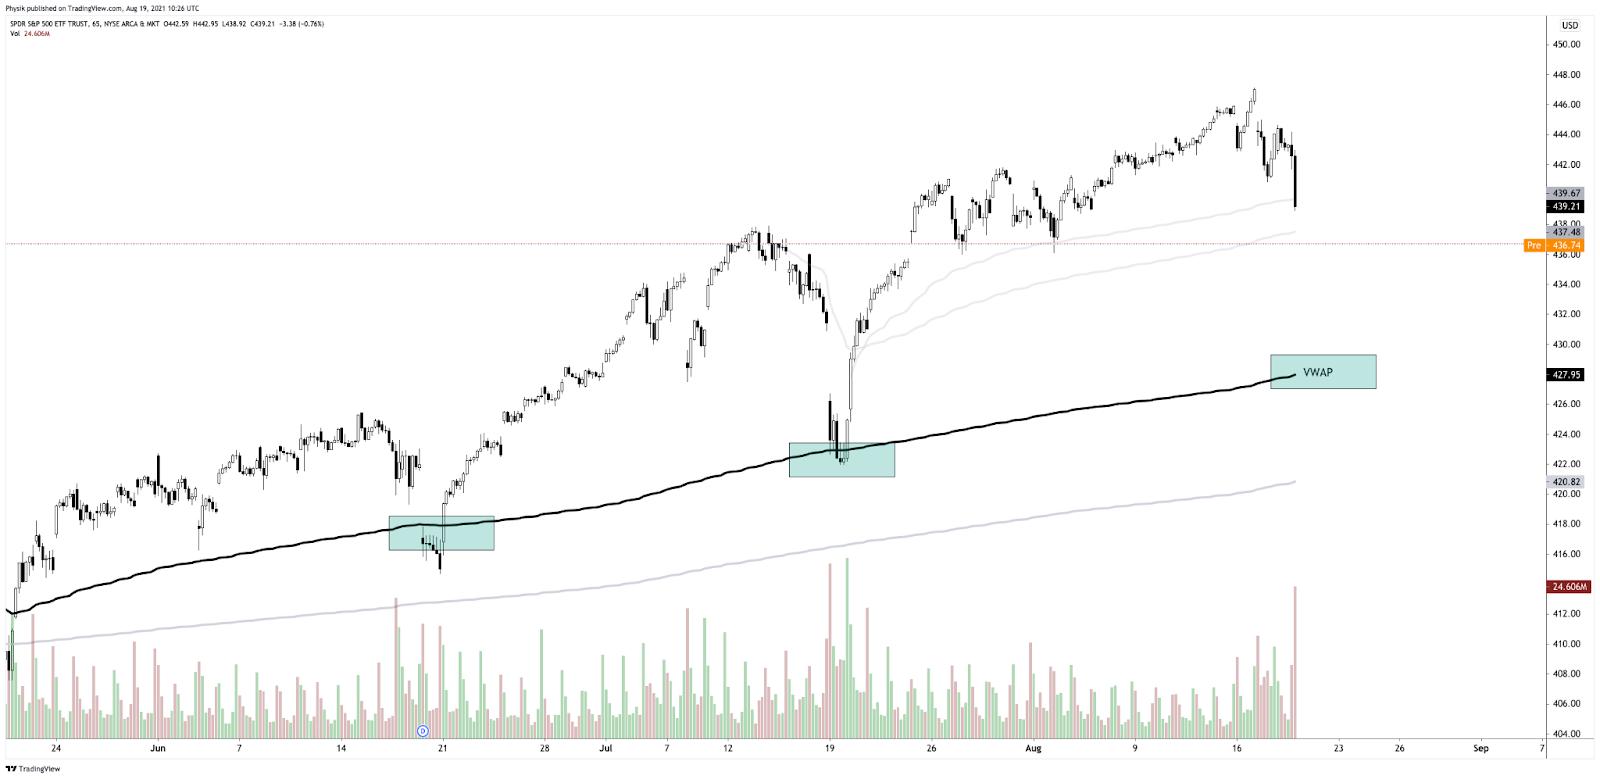
More On Volume-Weighted Average Prices (VWAPs): A metric highly regarded by chief investment officers, among other participants, for quality of trade. Additionally, liquidity algorithms are benchmarked and programmed to buy and sell around VWAPs.
Graphic: SPDR S&P 500 Trust ETF (NYSE: SPY) flirts with key downside anchored VWAPs. A key downside level in SPY lies at $427.95, currently.
In the best case, the S&P 500 trades sideways or higher; activity above the $4,381.75 low volume area (LVNode) pivot puts in play the $4,393.75 micro composite point of control (MCPOC). Initiative trade beyond the MCPOC could reach as high as the $4,411.75 high volume area (HVNode) and the aforementioned $4,422.75 BAH.
In the worst case, the S&P 500 trades lower; activity below the $4,381.75 low volume area (LVNode) puts in play the $4,365.25 BAL/LVNode. Initiative trade beyond the BAL/LVNode could reach as low as the $4,341.00 untested point of control (VPOC) and $4,315.25 HVNode.
Volume Areas: A structurally sound market will build on past areas of high volume. Should the market trend for long periods of time, it will lack sound structure (identified as a low volume area which denotes directional conviction and ought to offer support on any test).

If participants were to auction and find acceptance into areas of prior low volume, then future discovery ought to be volatile and quick as participants look to areas of high volume for favorable entry or exit.

POCs: POCs are valuable as they denote areas where two-sided trade was most prevalent. Participants will respond to future tests of value as they offer favorable entry and exit.
Graphic: 65-minute profile chart of the Micro E-mini S&P 500 Futures updated 6:45 AM ET.
News And Analysis
Landlords from Florida to California are jacking up rents.
COVID vaccines are less effective against new variants.
UK Fintech market runs hot but fear of bubble premature.
Tencent warns of more China tech curbs after growth hit.
A closer look at the investment/speculative-grade divide.
US restaurants up prices to offset labor inflation, demand.
Disenchanted investors help drive the record gold prices.
A complete Fed balance sheet normalization years away.
What People Are Saying
"Market makers likely need to buy over $150mm of vega (in one-year equivalent terms) in a down 5% move in SPX, which is ~20% of the average daily vega traded in S&P 500 options market. This is not a typo. It is huge." – MS
the longer volatility is suppressed the more its going to pop. the reflexive volatility selling feedback loop eventually hits a lower bound, which keeps getting sold only there is no juice left to squeeze. I think its what led to volmegeddon and also exacerbated March'20 pic.twitter.com/mxg4lv366a
Derivative pricing on the $VIX side not really budging on these market pullbacks now.
Despite the market printing red yesterday and the bid in VX futures, the options on some of the VIX stuff was not pricing in fear. Vol of vol barely budged. pic.twitter.com/TfzwNJBfuo
1/2 Though I appreciate your flair, respectfully it’s hardly the END OF AN ERA. The era’s just beginning…The flows are bigger & easier than ever to track, & the patterns that they produce are more evident & concentrated than ever…Tho the tail may have been trimmed @ OpEx due to https://t.co/NeV2er5PIE
Expectations are mounting for a September #Fed announcement of tapering plans, but I don’t see that happening. The Delta variant is having a significant impact on consumer behavior and slowing the forward progress of the economy. https://t.co/166FkLGWnPpic.twitter.com/8UPpYGTvHM
After years of self-education, strategy development, and trial-and-error, Renato Leonard Capelj began trading full-time and founded Physik Invest to detail his methods, research, and performance in the markets.
Additionally, Capelj is a finance and technology reporter. Some of his biggest works include interviews with leaders such as John Chambers, founder and CEO, JC2 Ventures, Kevin O’Leary, businessman and Shark Tank host, Catherine Wood, CEO and CIO, ARK Invest, among others.
Disclaimer
At this time, Physik Invest does not manage outside capital and is not licensed. In no way should the materials herein be construed as advice. Derivatives carry a substantial risk of loss. All content is for informational purposes only.
Equity index futures recover from a violent liquidation.
Push-pull on contradicting narratives.
Ahead: Housing data, FOMC minutes.
Volatility rises ahead of a large OPEX.
What Happened: U.S. stock index futures auctioned sideways to higher, overnight, ahead of key releases including the latest Federal Reserve minutes.
“Unless Fed minutes ‘reveal something substantively different from recent source stories, the market is unlikely to react significantly, and choppy trading may continue,’” Mizuho International Plc strategists including Peter Chatwell said in a note featured by Bloomberg.
Ahead is data on building permits and housing starts (8:30 AM ET), Fed speak by James Bullard (12:00 PM ET), and FOMC minutes (2:00 PM ET).
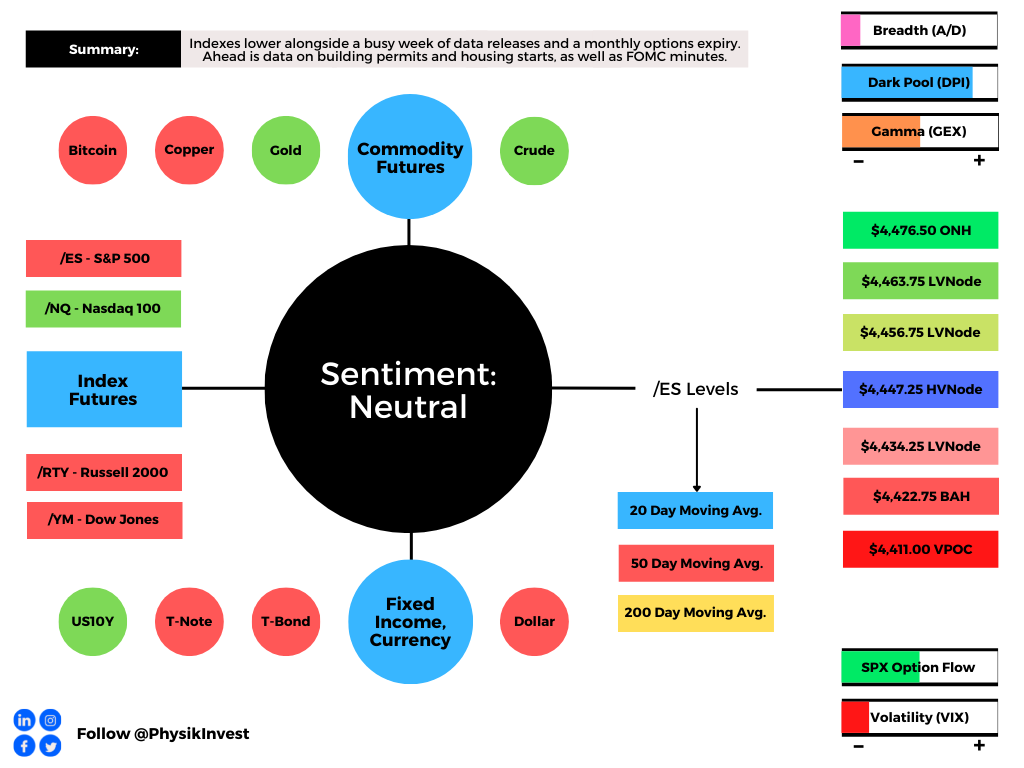
Graphic updated 6:45 AM ET. Sentiment Neutral if expected /ES open is inside of the prior day’s range. See here for more on the Dark Pool Index (DPI) and Gamma (GEX). A higher DPI approximation is bullish. At the same time, the lower the GEX approximation, the more volatility. SHIFT data used for options activity approximation. Note that options flow is sorted by the call premium spent; if green and more positive then more was spent on call options. Breadth reflects a reading of the prior day’s Advance/Decline indicator. VIX reflects a current reading of the CBOE Volatility Index from 0-100.
What To Expect: As of 6:45 AM ET, Wednesday’s regular session (9:30 AM – 4:00 PM EST) in the S&P 500 will likely open inside of prior-range and -value, suggesting a limited potential for immediate directional opportunity.
Adding, during the prior day’s regular trade, on weak intraday breadth and market liquidity metrics, the worst-case outcome occurred, evidenced by trade below the $4,456.75 low volume area (LVNode) pivot.
This is significant because the initiative trade resulted in a test of the $4,422.75 balance area high (BAH) – a go/no-go level on a prior breakout – as well as the 20-day simple moving average, a metric that ought to solicit a response by short-term (i.e., technically driven) participants who may be unable to defend retests.
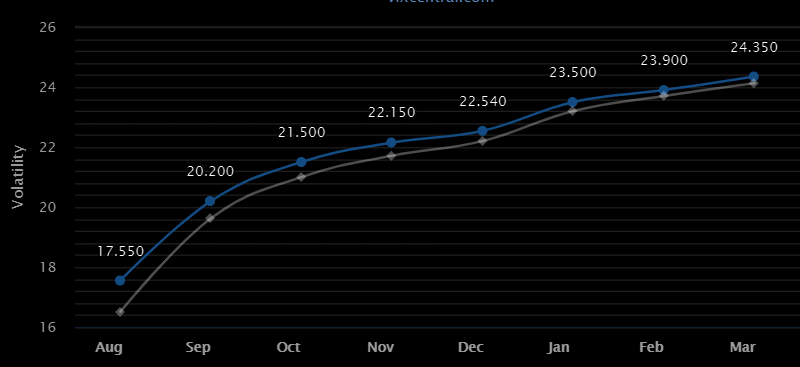
Further, the aforementioned trade is happening in the context of a rollover in macro expectations, peak long equity positioning, breadth divergences, a monthly options expiry (OPEX), as well as a shift higher in the VIX futures term structure.
The implications of these themes on price are contradictory; to elaborate, extended positioning – which alone suggests risks are asymmetric – coupled with a large OPEX and pronounced shift in shorter-dated VIX expiries, warns of elevated near-term risks for equity market stability.
Graphic: VIX term structure shifts higher with the biggest move happening at the short end of the curve, via VIX Central, from The Market Ear.
Moreover, for today, given expectations of middling volatility and responsive trade, participants may make use of the following frameworks.
In the best case, the S&P 500 trades sideways or higher; activity above the $4,447.25 high volume area (HVNode) pivot puts in play the $4,456.75 low volume area (LVNode). Initiative trade beyond the $4,456.75 LVNode could reach as high as the $4,463.75 LVNode and $4,476.50 overnight high (ONH).
In the worst case, the S&P 500 trades lower; activity below the $4,447.25 HVNode puts in play the $4,434.25 LVNode. Initiative trade beyond the $4,434.25 LVNode could reach as low as the aforementioned $4,422.75 BAH and $4,411.00 VPOC, which is a tick or so below the minimal excess low Tuesday’s liquidation produced.
Volume Areas: A structurally sound market will build on past areas of high volume. Should the market trend for long periods of time, it will lack sound structure (identified as a low volume area which denotes directional conviction and ought to offer support on any test).

If participants were to auction and find acceptance into areas of prior low volume, then future discovery ought to be volatile and quick as participants look to areas of high volume for favorable entry or exit.

Overnight Rally Highs (Lows): Typically, there is a low historical probability associated with overnight rally-highs (lows) ending the upside (downside) discovery process.

Excess: A proper end to price discovery; the market travels too far while advertising prices. Responsive, other-timeframe (OTF) participants aggressively enter the market, leaving tails or gaps which denote unfair prices.

POCs: POCs are valuable as they denote areas where two-sided trade was most prevalent. Participants will respond to future tests of value as they offer favorable entry and exit.
Graphic: 65-minute profile chart of the Micro E-mini S&P 500 Futures updated 6:45 AM ET.
This is the period every month where we get a few days of selling. This week it is looking timed to destroy all of the weekly calls bought yesterday. On the $NQ, $NDX a close below 14850 opens the door to 14000 over the next several weeks.
After years of self-education, strategy development, and trial-and-error, Renato Leonard Capelj began trading full-time and founded Physik Invest to detail his methods, research, and performance in the markets.
Additionally, Capelj is a finance and technology reporter. Some of his biggest works include interviews with leaders such as John Chambers, founder and CEO, JC2 Ventures, Kevin O’Leary, businessman and Shark Tank host, Catherine Wood, CEO and CIO, ARK Invest, among others.
Disclaimer
At this time, Physik Invest does not manage outside capital and is not licensed. In no way should the materials herein be construed as advice. Derivatives carry a substantial risk of loss. All content is for informational purposes only.
What Happened: U.S. stock index futures auctioned within prior range alongside positive earnings reports, infrastructure progress, China liquidity injections, and optimism that the Federal Reserve would not taper stimulus.
Adding, in a statement, Neil Dutta, head of U.S. economics at Renaissance Macro Research, explained: “The Fed is starting the clock on tapering. It is not happening now or even in September, but expect the pace of asset buying to slowdown late this year or early next.”
Moreover, participants should keep an eye out for data on initial and continuing jobless claims, U.S. GDP, as well as pending home sales and earnings.
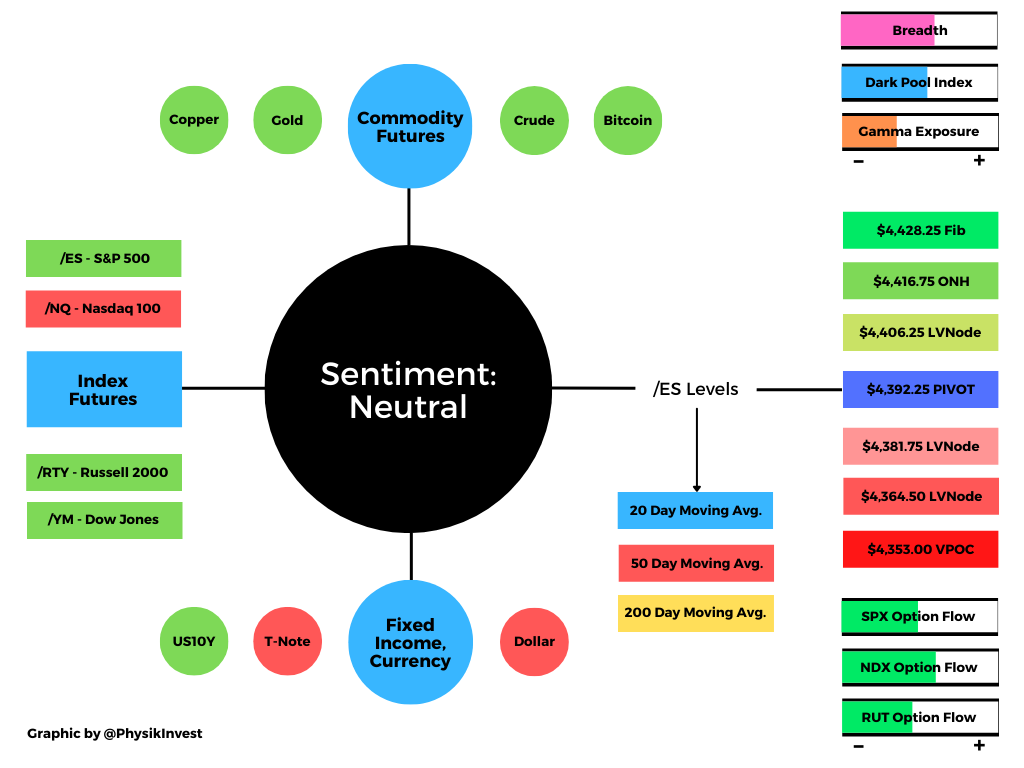
Graphic updated 6:30 AM ET. Sentiment Neutral if expected /ES open is inside of the prior day’s range. See here for more on the Dark Pool Index and Gamma. A positive Dark Pool Index reading is bullish. At the same time, the higher (lower) the gamma, the less (more) volatility. SHIFT Search data used for options activity. Note that options flow is sorted by the call premium spent; if green and more (less) positive then more (less) was spent on call options. Breadth reflects a reading of the prior day’s Advance/Decline indicator.
What To Expect: As of 6:30 AM ET, Thursday’s regular session (9:30 AM – 4:00 PM EST) in the S&P 500 will likely open inside of prior-range and -value, suggesting a limited potential for immediate directional opportunity.
Adding, during the prior day’s regular trade, the best case outcome occurred, evidenced by resolve above the Volume Weighted Average Price (blue in color on the below profile graphic) anchored from the 2:00 PM ET Federal Open Market Committee (FOMC) announcement.
This is significant because this metric paints the picture of who is winning, so to speak; simply put, since FOMC, the average buyer is in a better position.
Moreover, as evidenced by the developing 5-day balance area in the profile graphic below, participants are finding higher prices valuable as they position themselves for a directional move, given increased clarity over earnings, taper, and more.
Balance (Two-Timeframe Or Bracket): Rotational trade that denotes current prices offer favorable entry and exit. Balance-areas make it easy to spot a change in the market (i.e., the transition from two-time frame trade, or balance, to one-time frame trade, or trend).
The modus operandi, in light of the above, is responsive trade. Auctioning beyond the $4,416.75 overnight high (ONH) or $4,364.50 opens the window for follow-through. In such a case, participants ought to abandon their focus on responsive trade.
Overnight Rally Highs (Lows): Typically, there is a low historical probability associated with overnight rally-highs (lows) ending the upside (downside) discovery process.

Initiative Buying (Selling): Buying (selling) within or above (below) the previous day’s value area.

Responsive Buying (Selling): Buying (selling) in response to prices below (above) an area of recent price acceptance.
Internally speaking, after the Russell 2000 and Nasdaq 100 weakness in days prior, conditions improved markedly. Breadth, at the exchange level, was positive with a steady inflow into the stocks that were up, versus those that were down. However, though, weakness in the Nasdaq 100 returned this morning, a potential drag on any initiative activity in the coming session(s).
To note, quickly, we remember that as time passes, alongside the ebbing of post-FOMC volatility, there will be positive flows with respect to the unwind of options hedges.
Further, for today, participants can trade from the following frameworks.
In the best case, the S&P 500 trades sideways or higher; activity above the $4,393.75 high volume area (HVNode) pivot puts in play the $4,406.25 low volume area (LVNode). Initiative trade beyond the $4,406.25 LVNode puts in play the $4,416.75 ONH and $4,428.25 Fibonacci extension.
In the worst case, the S&P 500 trades lower; activity below the $4,393.75 HVNode puts in play the $4,381.75 LVNode. Initiative trade beyond the $4,381.75 LVNode could reach as low as the $4,364.50 LVNode and $4,341.75 micro-composite point of control (MCPOC).
Volume Areas: A structurally sound market will build on past areas of high volume. Should the market trend for long periods of time, it will lack sound structure (identified as a low volume area which denotes directional conviction and ought to offer support on any test).

If participants were to auction and find acceptance into areas of prior low volume, then future discovery ought to be volatile and quick as participants look to areas of high volume for favorable entry or exit.

POCs: POCs are valuable as they denote areas where two-sided trade was most prevalent. Participants will respond to future tests of value as they offer favorable entry and exit.
Graphic: 65-minute profile chart of the Micro E-mini S&P 500 Futures. Graphic updated 6:30 AM ET.
News And Analysis
Gold demand has yet to recover fully from COVID-19, says WGC.
MBS Recap: Fed hinted at a tapering, but bonds don’t really care.
The four biggest ways that the Robinhood app changed investing.
Biden’s two-front economic agenda made headway in the Senate.
China stocks rally as Beijing intensifies efforts to calm the market.
S&P Data: Growth is still on track despite rising COVID-19 cases.
U.S. corporate bond market near record pace as Fed taper looms.
Oversight of China payment companies likely boosts compliance.
“once an event has passed … the excess ‘Event Vol’ from the event … releases potential energy in the form of [natural supportive] Wanda … flows” = 1st move
After years of self-education, strategy development, and trial-and-error, Renato Leonard Capelj began trading full-time and founded Physik Invest to detail his methods, research, and performance in the markets. Additionally, Capelj is a finance and technology reporter. Some of his biggest works include interviews with leaders such as John Chambers, founder and CEO, JC2 Ventures, Kevin O’Leary, businessman and Shark Tank host, Catherine Wood, CEO and CIO, ARK Invest, among others.
Disclaimer
At this time, Physik Invest does not manage outside capital and is not licensed. In no way should the materials herein be construed as advice. Derivatives carry a substantial risk of loss. All content is for informational purposes only.