Physik Invest’s Daily Brief is read by thousands of subscribers. You, too, can join this community to learn about the fundamental and technical drivers of markets.
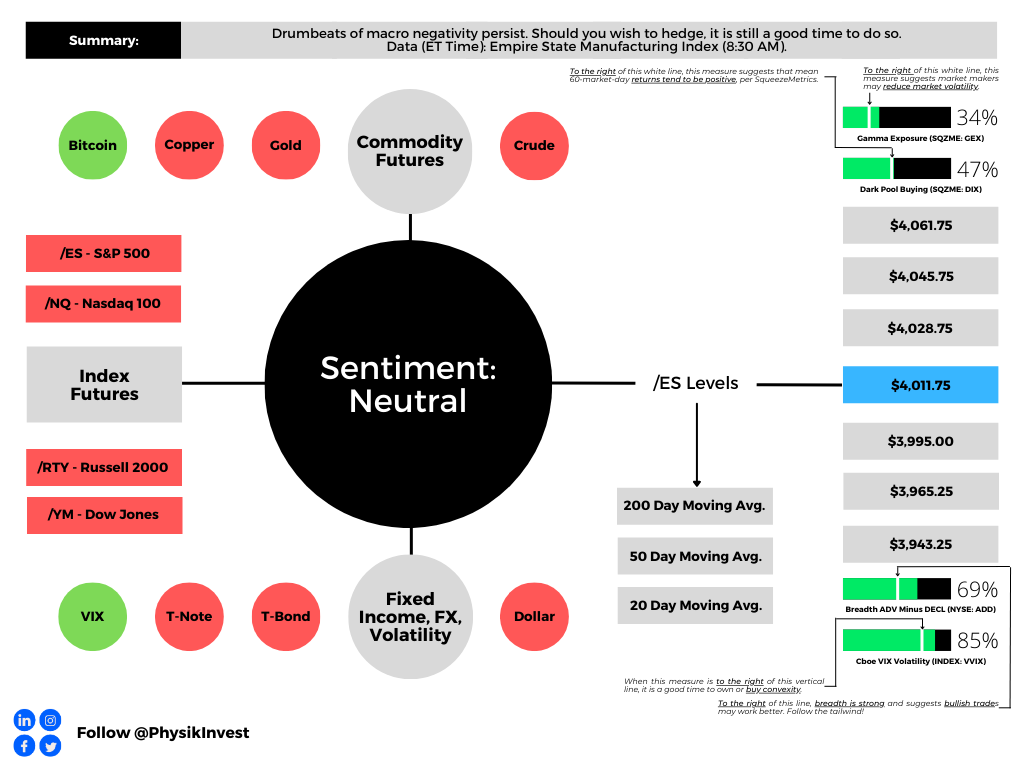
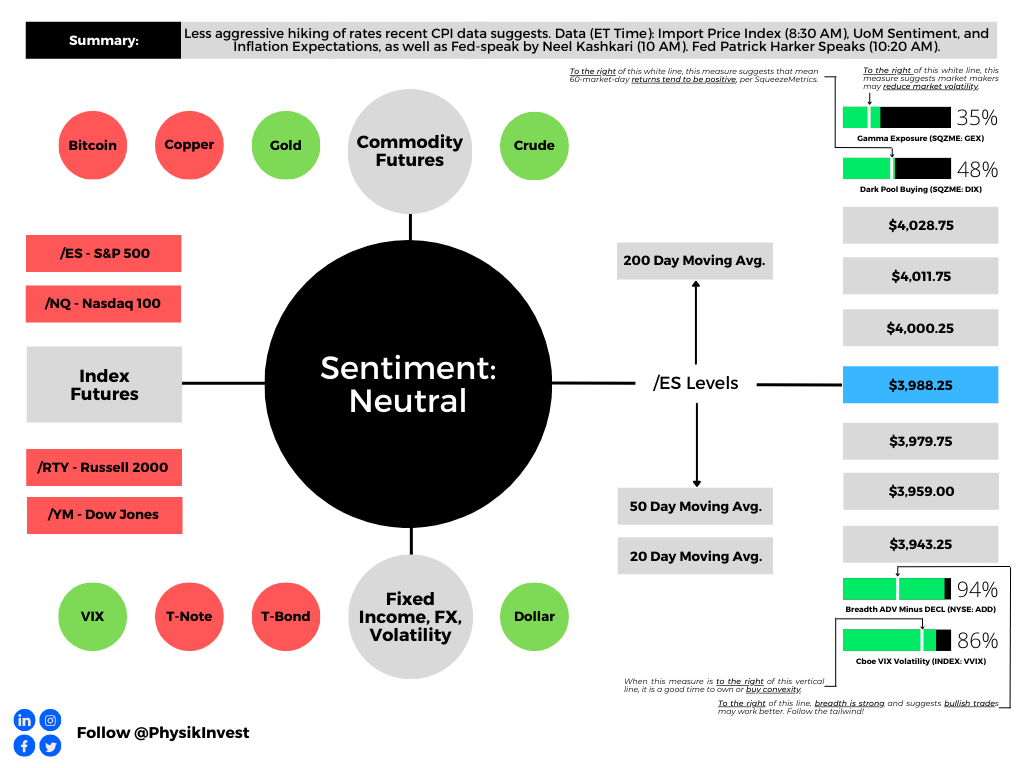
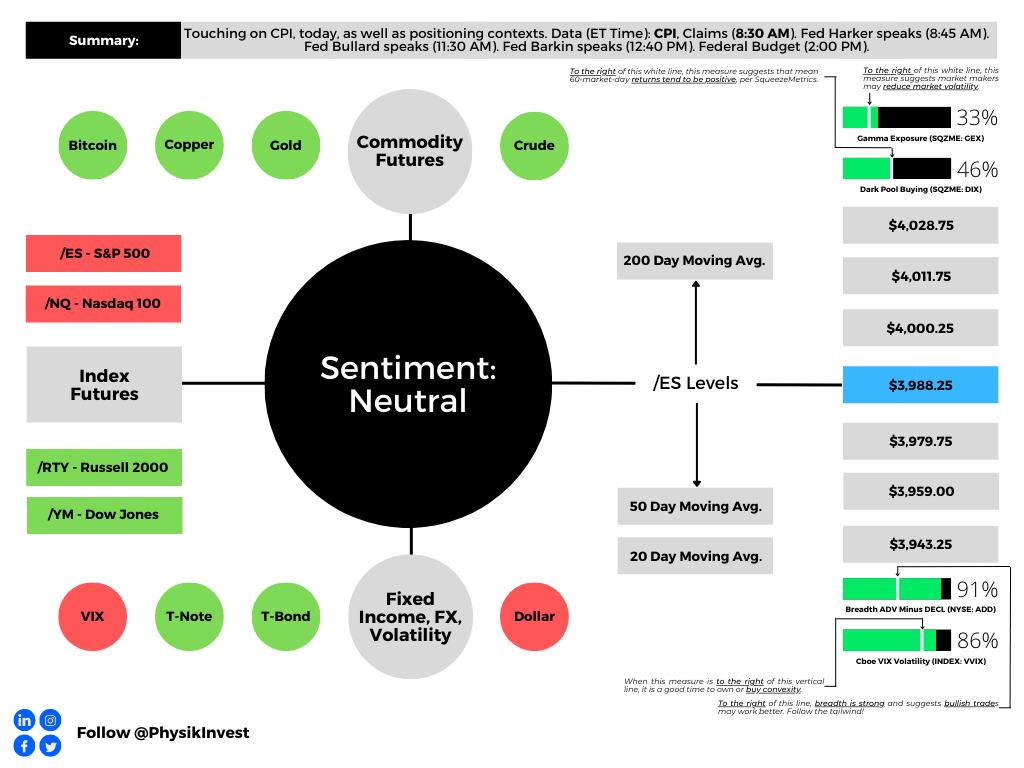
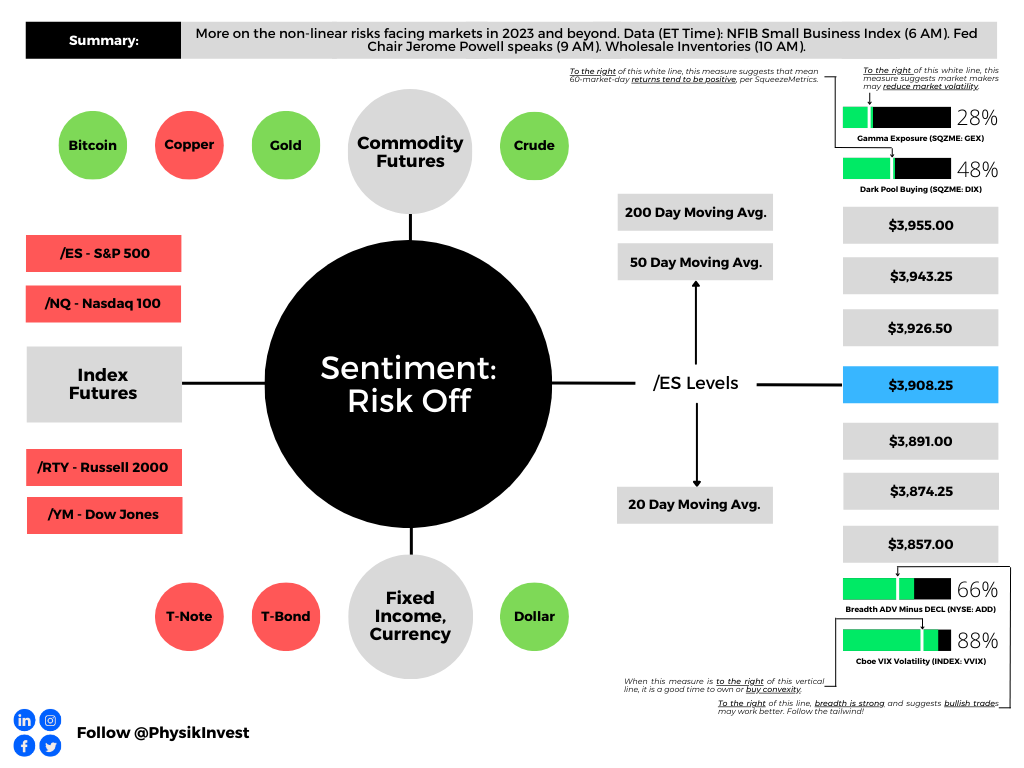
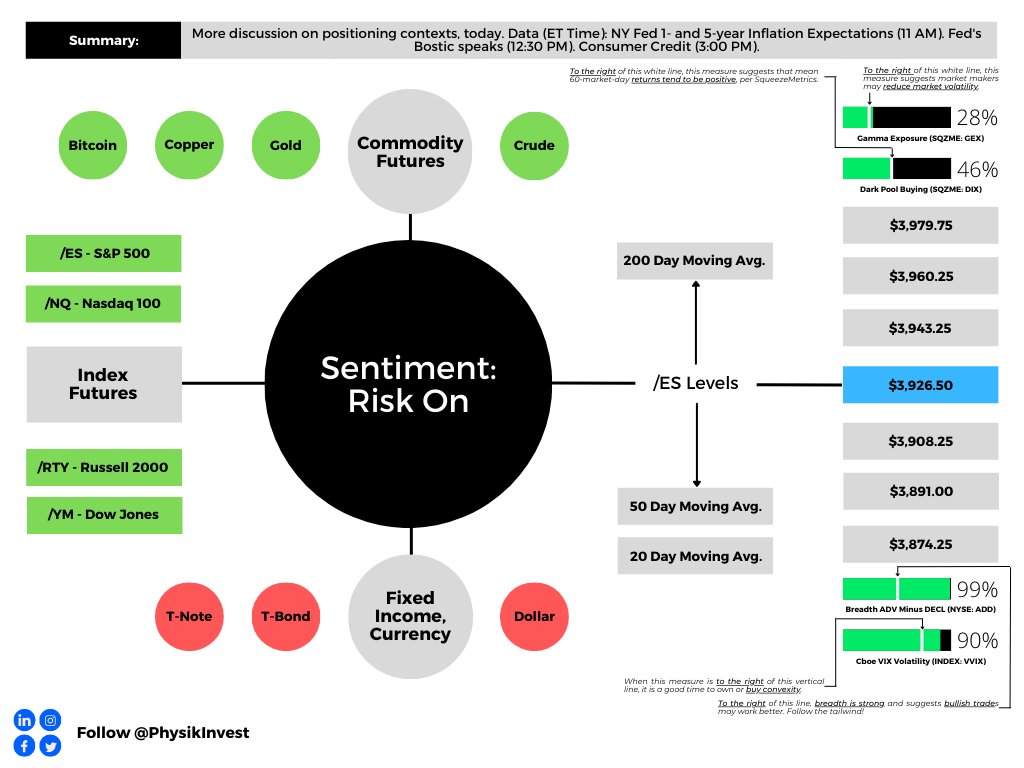
Graphic updated 3:40 AM ET. Sentiment Neutral if expected /ES open is inside of the prior day’s range. /ES levels are derived from the profile graphic at the bottom of this letter. Levels may have changed since initially quoted; click here for the latest levels. SqueezeMetrics Dark Pool Index (DIX) and Gamma (GEX) with the latter calculated based on where the prior day’s reading falls with respect to the MAX and MIN of all occurrences available. A higher DIX is bullish. At the same time, the lower the GEX, the more (expected) volatility. Click to learn the implications of volatility, direction, and moneyness. Breadth reflects a reading of the prior day’s NYSE Advance/Decline indicator. The CBOE VIX Volatility Index (INDEX: VVIX) measure reflects the total attractiveness of owning volatility.
Administrative
Morning, team! Upon your letter writer’s return next week from the World Economic Forum in Switzerland, the more in-depth letters will resume. We’ll keep it brief with some perspectives to mull amid the recent market relief.
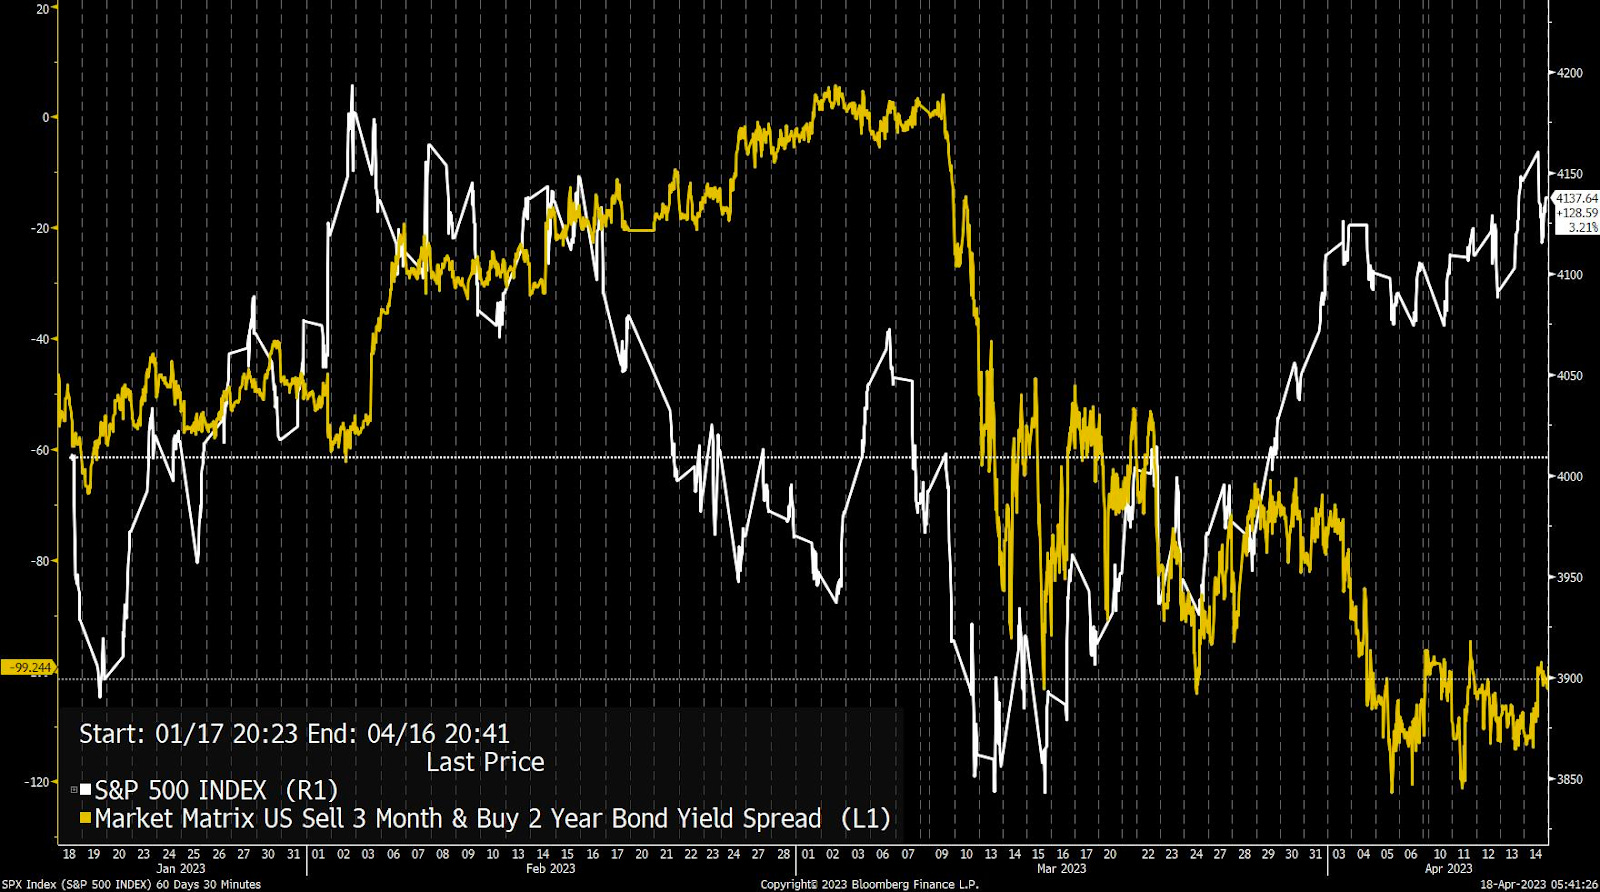
In short, recent “euphoria might be premature,” said Fabian Wintersberger. Even if the economy has a mild recession in the first half of the year, there is not much reason for the Fed to pivot.
This perspective is supported by ex-Fed trader Joseph Wang. Wang believes wages rising, coupled with a large “credit boom” in the banking sector, bolsters inflation, and this may lead to rates higher for longer, a market pressure.
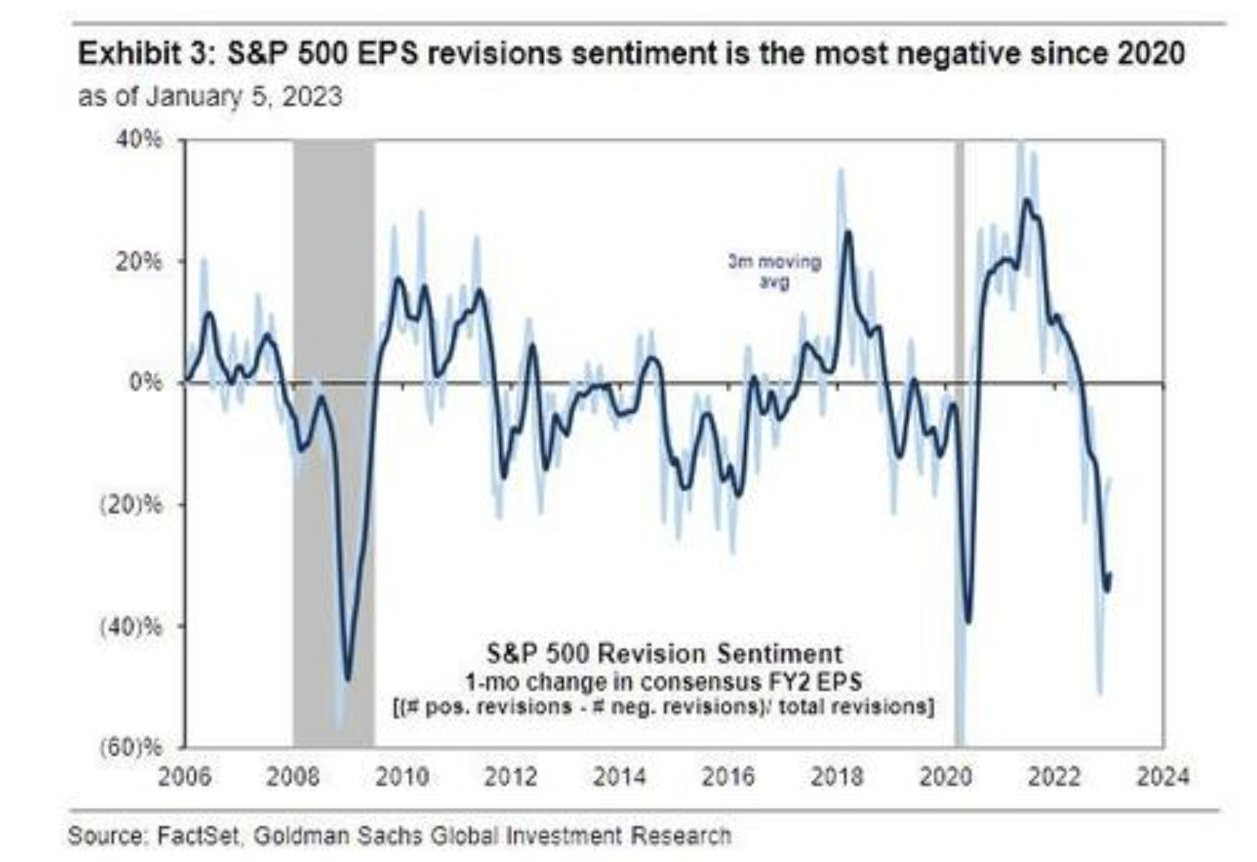
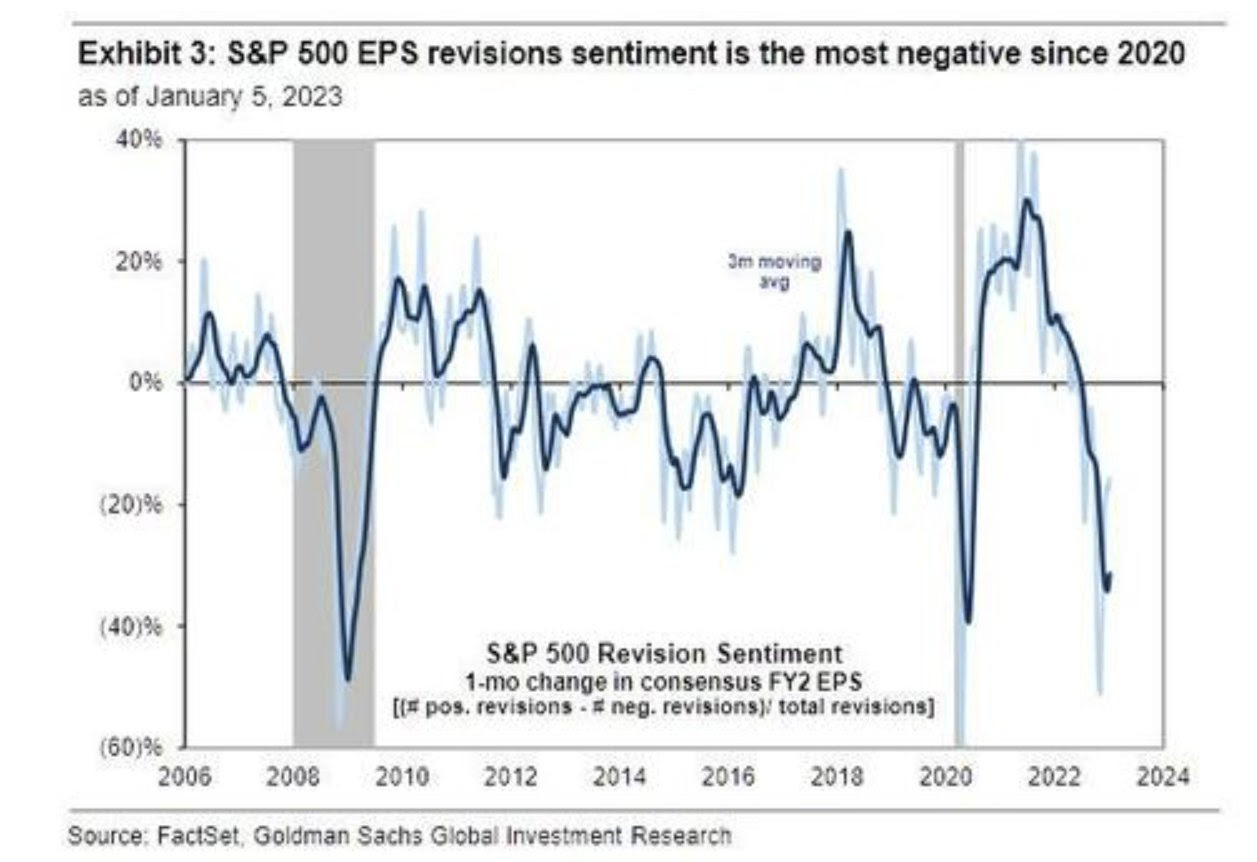
If there’s a severe recession, “the current expected corporate earnings are too high,” and adjustments would be an added pressure on the markets Wintersberger noted. Bloomberg’s John Authers echoed Wintersberger’s remarks. Profit expectations are the “biggest contrary indicator to the burgeoning optimism.”
Graphic: Retrieved from Goldman Sachs Group Inc (NYSE: GS) via Callum Thomas.
Technical
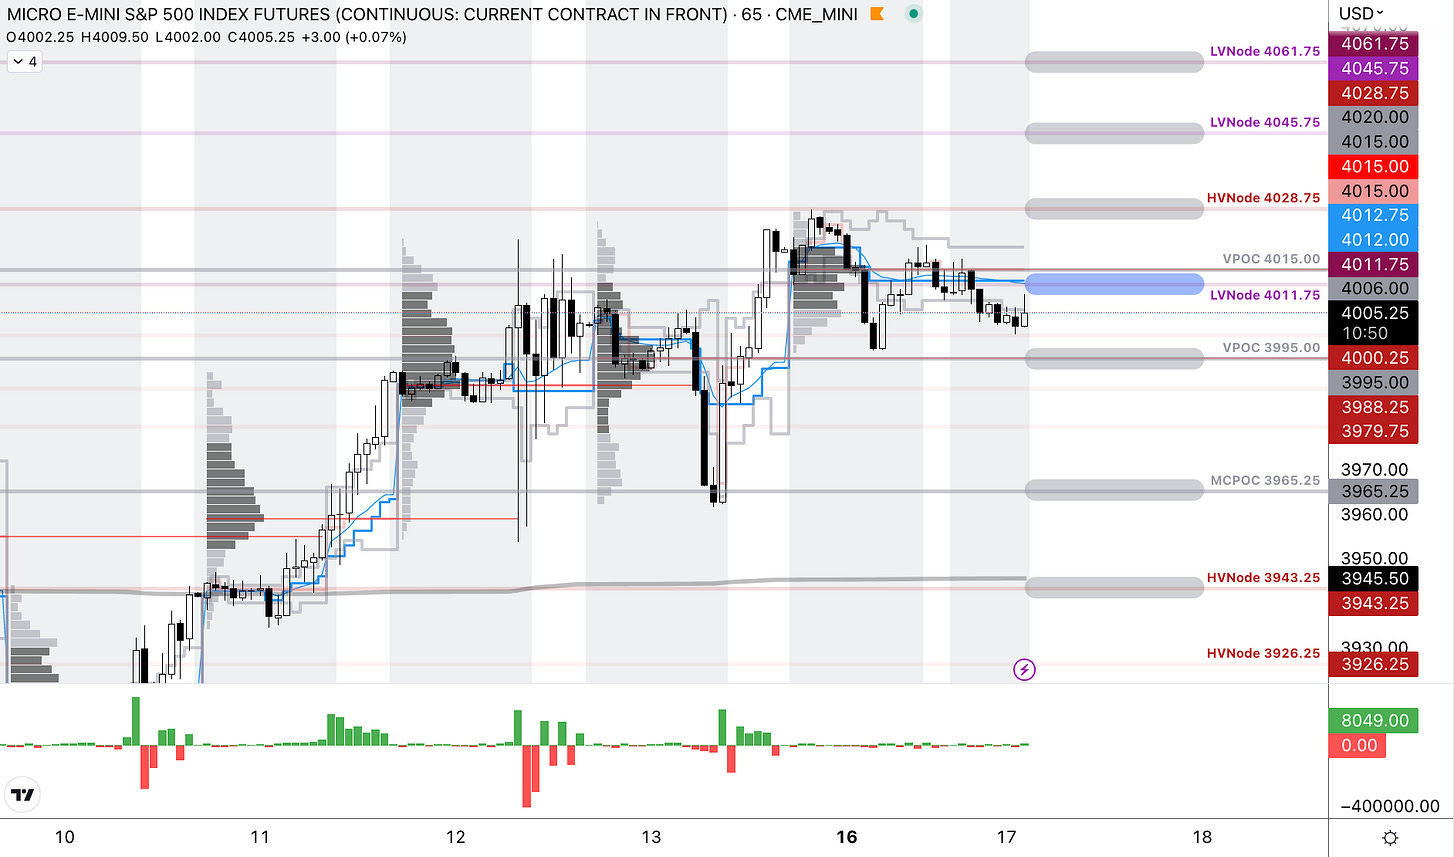
As of 3:40 AM ET, Tuesday’s regular session (9:30 AM – 4:00 PM ET), in the S&P 500, is likely to open in the middle part of a negatively skewed overnight inventory, inside of prior-range and -value, suggesting a limited potential for immediate directional opportunity.
Our S&P 500 pivot for today is $4,011.75.
Key levels to the upside include $4,028.75, $4,045.75, and $4,061.75.
Key levels to the downside include $3,995.00, $3,965.25, and $3,943.25.
Click here to load today’s key levels into the web-based TradingView platform. All levels are derived using the 65-minute timeframe. New links are produced, daily.
As a disclaimer, the S&P 500 could trade beyond the levels quoted in the letter. Therefore, you should load the above link on your browser for more relevant levels.
Graphic: 65-minute profile chart of the Micro E-mini S&P 500 Futures.
Definitions
Volume Areas: Markets will build on areas of high-volume (HVNodes). Should the market trend for long periods of time, it will be identified by low-volume areas (LVNodes). LVNodes denote directional conviction and ought to offer support on any test.
If participants auction and find acceptance in an area of a prior LVNode, then future discovery ought to be volatile and quick as participants look to HVNodes for favorable entry or exit.
POCs: Denote areas where two-sided trade was most prevalent in a prior day session. Participants will respond to future tests of value as they offer favorable entry and exit.
MCPOCs: Denote areas where two-sided trade was most prevalent over numerous sessions. Participants will respond to future tests of value as they offer favorable entry and exit.
About
In short, an economics graduate working in finance and journalism.
Capelj spends most of his time as the founder of Physik Invest through which he invests and publishes daily analyses to subscribers, some of whom represent well-known institutions.
Separately, Capelj is an equity options analyst at SpotGamma and an accredited journalist interviewing global leaders in business, government, and finance.
Physik Invest’s Daily Brief is read by thousands of subscribers. You, too, can join this community to learn about the fundamental and technical drivers of markets.
Graphic updated 7:00 AM ET. Sentiment Neutral if expected /ES open is inside of the prior day’s range. /ES levels are derived from the profile graphic at the bottom of this letter. Levels may have changed since initially quoted; click here for the latest levels. SqueezeMetrics Dark Pool Index (DIX) and Gamma (GEX) with the latter calculated based on where the prior day’s reading falls with respect to the MAX and MIN of all occurrences available. A higher DIX is bullish. At the same time, the lower the GEX, the more (expected) volatility. Click to learn the implications of volatility, direction, and moneyness. Breadth reflects a reading of the prior day’s NYSE Advance/Decline indicator. The CBOE VIX Volatility Index (INDEX: VVIX) measure reflects the total attractiveness of owning volatility.
Administrative
A bit late as your letter writer is getting ready to travel. Sorry and have a great Friday!
Fundamental
Thursday’s inflation update was as expected.
The Consumer Price Index (CPI) saw a 6.5% rise year-over-year (YoY) and a 0.1% fall month-over-month (MoM). Core CPI was +5.7% YoY and +0.3% MoM.
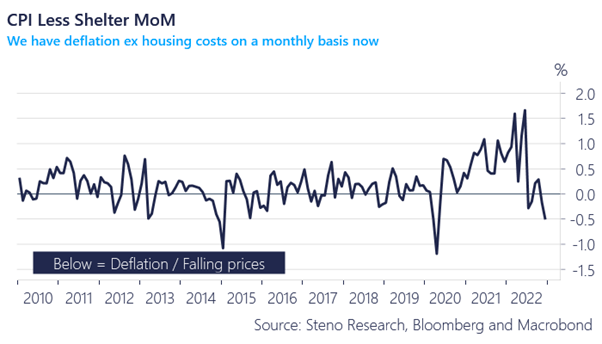
In his post-CPI analysis, Andreas Steno Larsen said inflation has mostly disappeared, and, if we cut shelter costs, which are outdated, “deflation on a quarterly and monthly basis is here.”
The Federal Reserve’s (Fed) “favored statistical measures for underlying inflationary pressure all confirm a decline,” added Bloomberg’s John Authers.
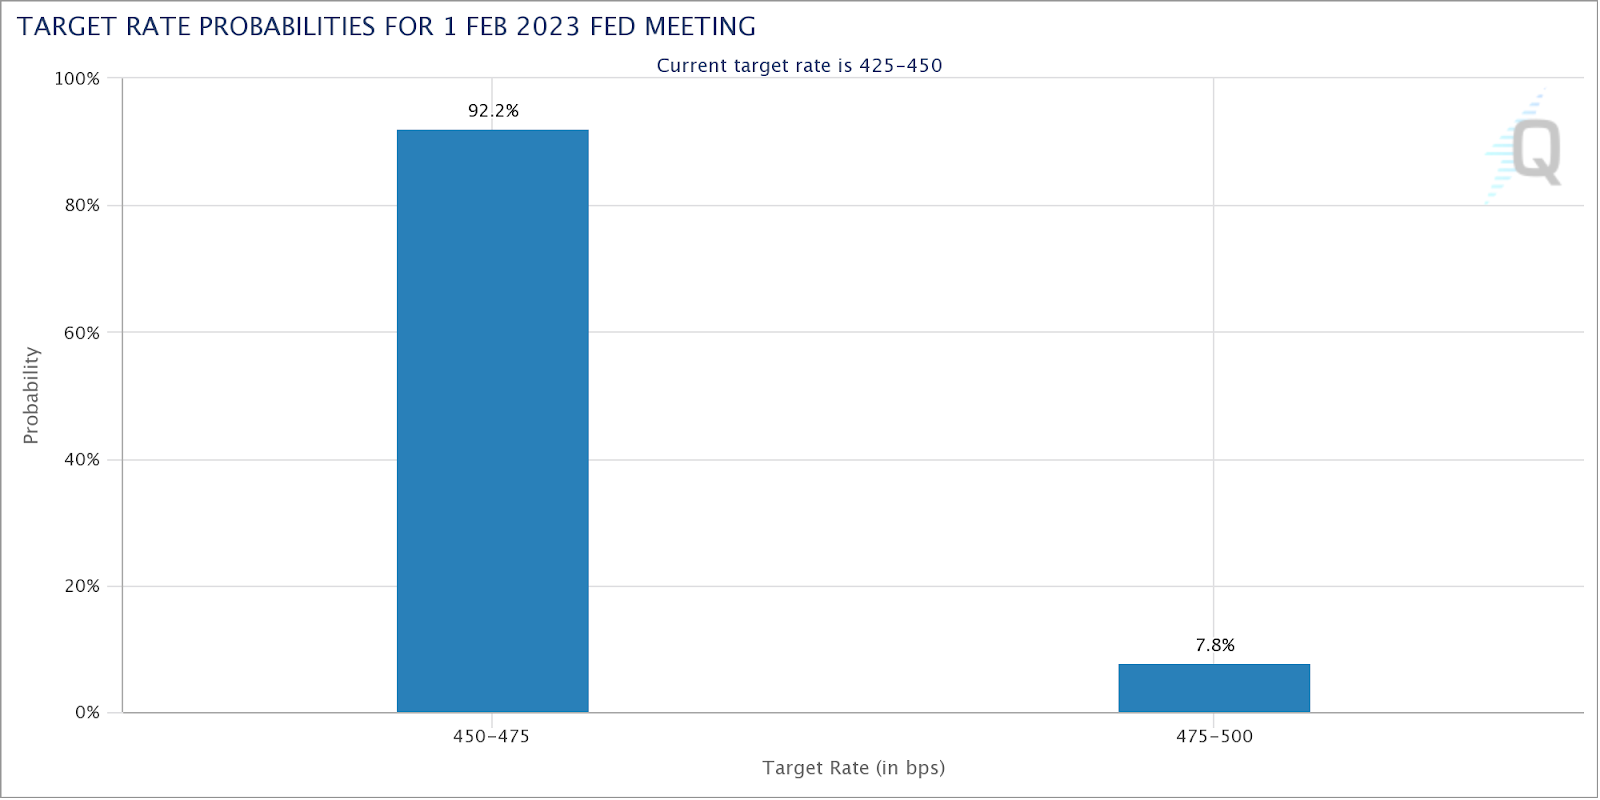
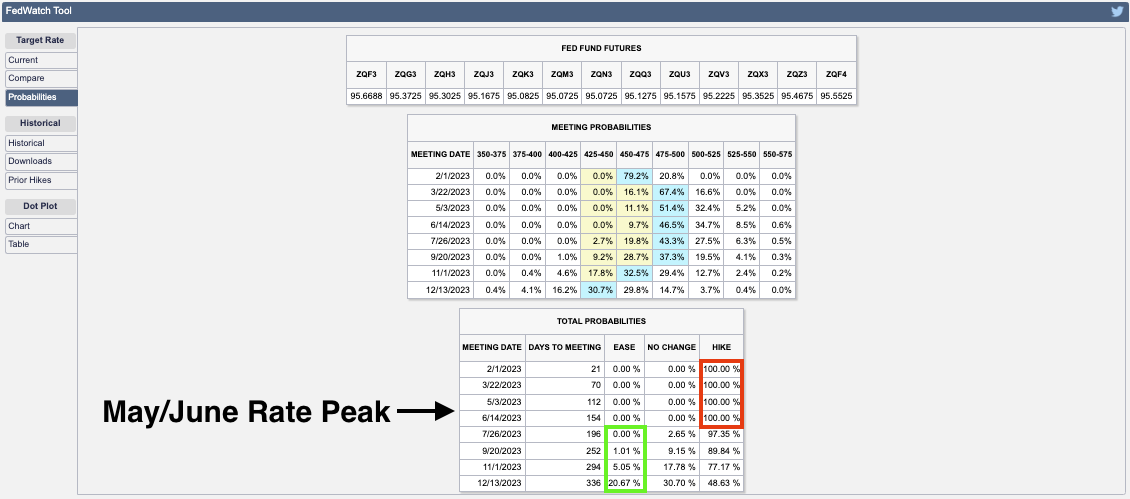
“Prices are beginning to behavemore as central bankers would wish,” paving the way to a downshift in tightening, as is priced by the markets. Using the CME Group Inc’s (NASDAQ: CME) FedWatch Tool, traders were split, and the odds of a 25 or 50 basis point hike were more even prior to CPI.
The odds are now skewed toward a 25 basis point hike.
Graphic: Retrieved from CME Group Inc’s (NASDAQ: CME) FedWatch Tool. Depending on the measure, rates are seen peaking between 4.9% and 5.10%.
Despite the odds of a less aggressive hike – yields falling and swaps suggesting the Fed could skip a hike in March – and the impact that has on valuing businesses (e.g., firm profits worth less at higher interest rates hence the de-rate of 2022), the data suggests that “inflation spikes have never been vanquished until the federal funds rate exceeds the inflation rate,” and, with the return in deflation, Steno Larsen said, the outlook for stocks remains poor.
“Remember that the PPI (and the CPI for that matter) is a leading indicator for EPS.” Consequently, “we are in for negative EPS.”
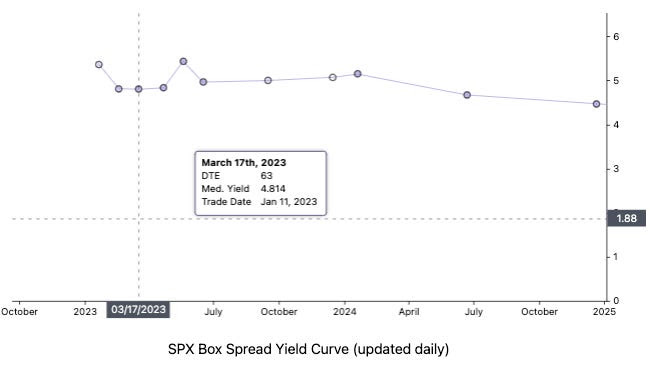
If you’re not an active trader and unable to participate in both the up- and down-side of markets, then you may capitalize on higher interest rates with Treasury bills or Box Spreads, which allow you to create loan structures similar to a Treasury bill. Upon the spread’s maturity, it settles and earns a competitive interest rate.
If you’re an active trader, as I said to one subscriber privately, “the more depressed technology names to the upside for debits [were] attractive” (i.e., buying call option structures in the likes of Tesla and Amazon).
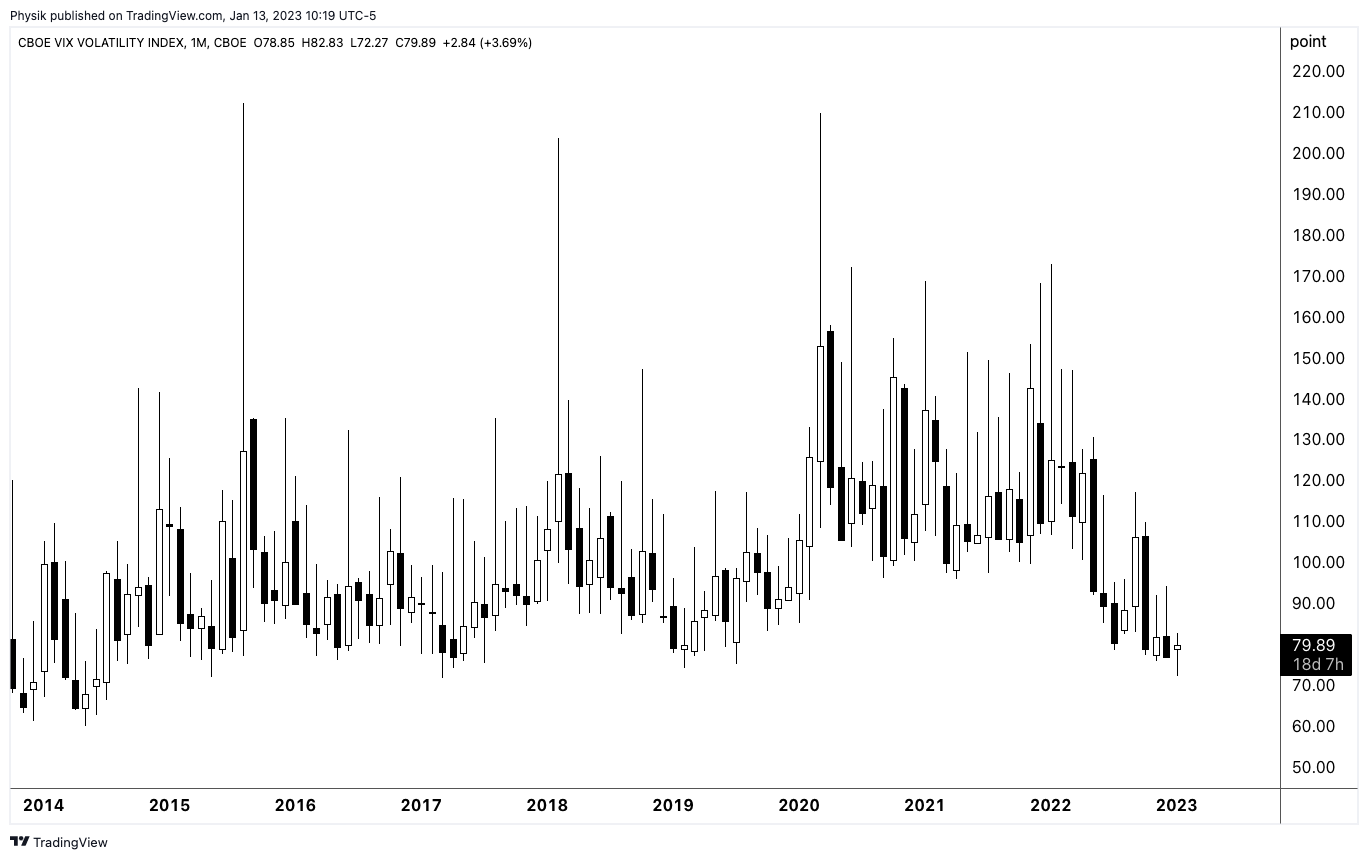
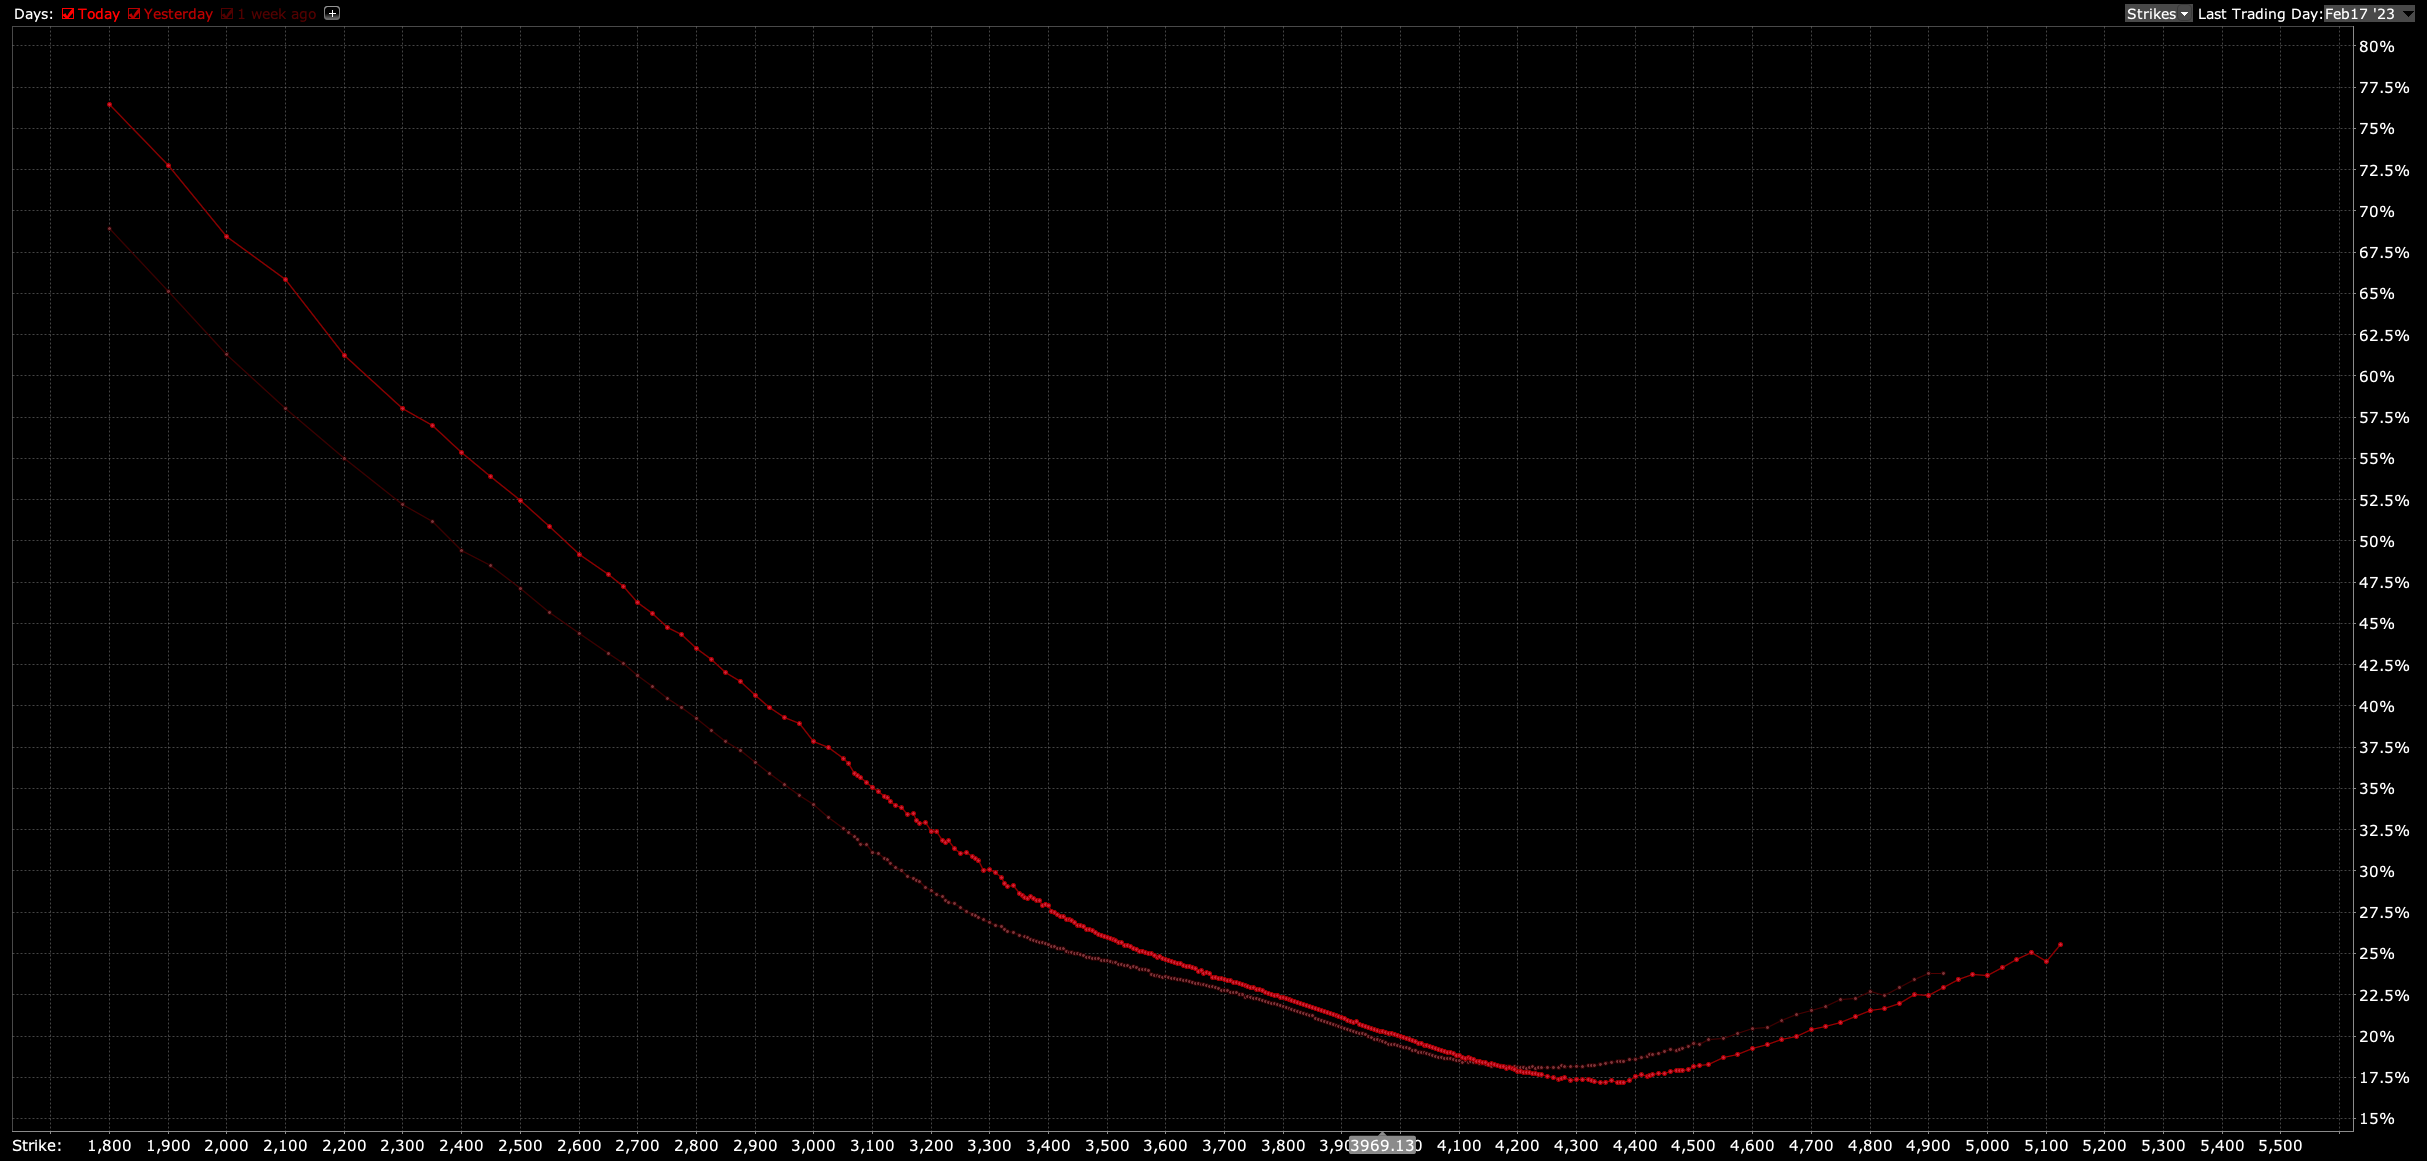
This is while put structures you may monetize in case of a large repricing in volatility have kept their values well amid what appears to be a shift higher in the skew; in the past days, we talked about measures including the Cboe VIX Volatility (INDEX: VVIX) printing at historic levels.
Graphic: Updated January 12, 2023. S&P 500 (INDEX: SPX) volatility skew retrieved from Interactive Brokers Group Inc’s (NASDAQ: IBKR) Trader Workstation.
Measures like the VVIX suggests “we can get cheap exposure to convexity while a lot of people are worried,” as The Ambrus Group’s Kris Sidial said in one article. Though volatility can be bimodal (i.e., stay low for longer for lack of better phrasing), from a “risk-to-reward perspective, … it’s a better bet to be on the long volatility side,” given “that there are so many things that … keep popping up” from a macro perspective.
Graphic: Cboe VIX Volatility (INDEX: VVIX) via TradingView.
Technical
As of 7:00 AM ET, Friday’s regular session (9:30 AM – 4:00 PM ET), in the S&P 500, is likely to open in the lower part of a negatively skewed overnight inventory, inside of prior-range and -value, suggesting a limited potential for immediate directional opportunity.
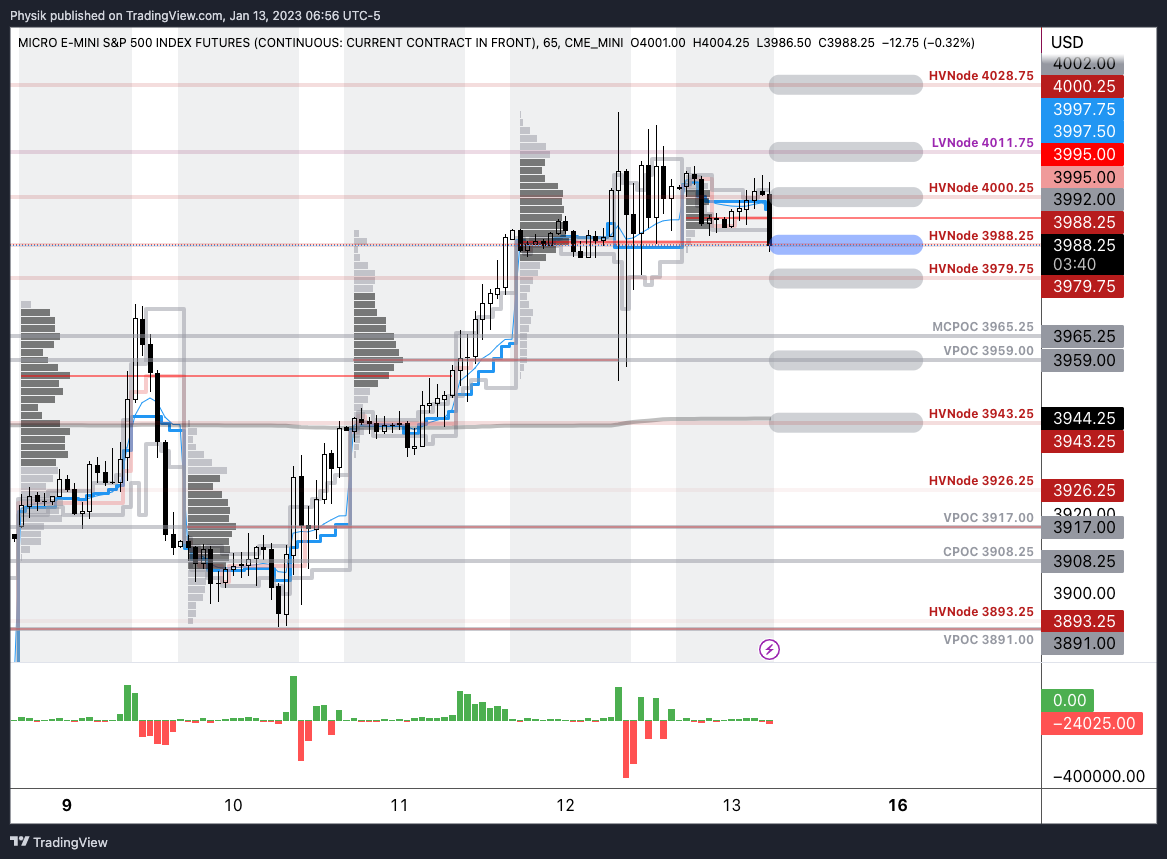
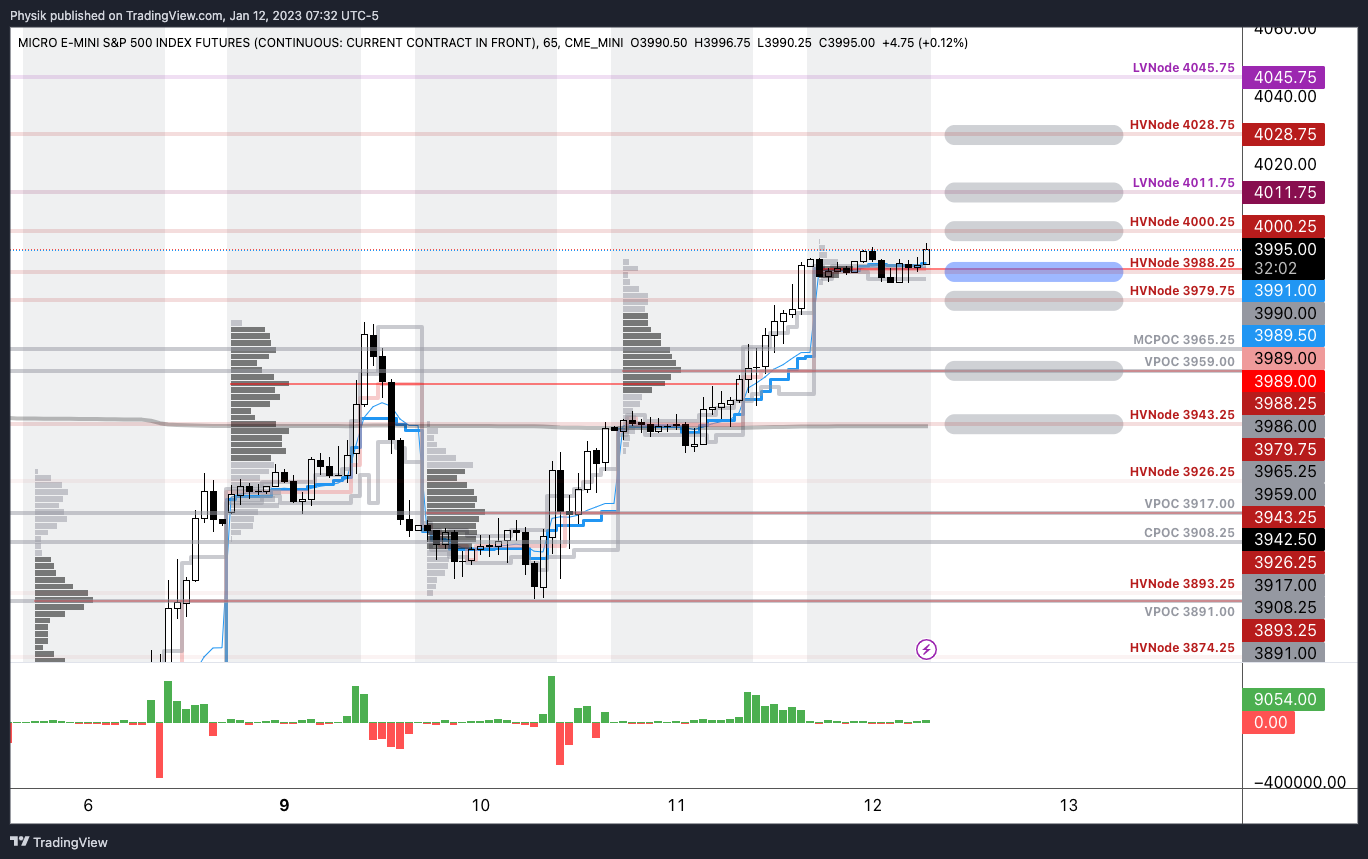
Our S&P 500 pivot for today is $3,988.25 HVNode.
Key levels to the upside include $4,000.25, $4,011.75, and $4,028.75.
Key levels to the downside include $3,979.75, $3,959.00, and $3,943.25.
Click here to load today’s key levels into the web-based TradingView platform. All levels are derived using the 65-minute timeframe. New links are produced, daily.
As a disclaimer, the S&P 500 could trade beyond the levels quoted in the letter. Therefore, you should load the above link on your browser for more relevant levels.
Graphic: 65-minute profile chart of the Micro E-mini S&P 500 Futures.
Definitions
Volume Areas: Markets will build on areas of high-volume (HVNodes). Should the market trend for long periods of time, it will be identified by low-volume areas (LVNodes). LVNodes denote directional conviction and ought to offer support on any test.
If participants auction and find acceptance in an area of a prior LVNode, then future discovery ought to be volatile and quick as participants look to HVNodes for favorable entry or exit.
POCs: Denote areas where two-sided trade was most prevalent in a prior day session. Participants will respond to future tests of value as they offer favorable entry and exit.
MCPOCs: Denote areas where two-sided trade was most prevalent over numerous sessions. Participants will respond to future tests of value as they offer favorable entry and exit.
About
In short, an economics graduate working in finance and journalism.
Capelj spends most of his time as the founder of Physik Invest through which he invests and publishes daily analyses to subscribers, some of whom represent well-known institutions.
Separately, Capelj is an equity options analyst at SpotGamma and an accredited journalist interviewing global leaders in business, government, and finance.
Physik Invest’s Daily Brief is read by thousands of subscribers. You, too, can join this community to learn about the fundamental and technical drivers of markets.
Graphic updated 8:45 AM ET. Sentiment Neutral if expected /ES open is inside of the prior day’s range. /ES levels are derived from the profile graphic at the bottom of this letter. Levels may have changed since initially quoted; click here for the latest levels. SqueezeMetrics Dark Pool Index (DIX) and Gamma (GEX) with the latter calculated based on where the prior day’s reading falls with respect to the MAX and MIN of all occurrences available. A higher DIX is bullish. At the same time, the lower the GEX, the more (expected) volatility. Click to learn the implications of volatility, direction, and moneyness. Breadth reflects a reading of the prior day’s NYSE Advance/Decline indicator. The CBOE VIX Volatility Index (INDEX: VVIX) measure reflects the total attractiveness of owning volatility.
Administrative
A quick letter today, apologies.
Given the large, post-CPI movement, the above dashboard may be out of date!
Separately, your letter writer will be heading to Davos, Switzerland during next week’s World Economic Forum. Let me know if you’ll be in town. Take care!
Fundamental
Today, market participants received data that appears in line with estimates.
Expected was a 6.5% rise year-over-year (YoY) and a 0.1% fall month-over-month (MoM). These numbers were +7.1% and +0.1% the release prior.
Mattering most is core inflation, which the Fed has more control over. The expectation was that core CPI rose 5.7% YoY and 0.3% MoM. In the release prior, these numbers were 6.0% and 0.2%, respectively.
Overall, the view that inflation is trending in the right direction is supported.
We often unpack the implications, but we will save that for a coming analysis.
Positioning
We saw meaningful outperformance in realized volatility (RVOL). This was, in part, a result of increased demand for short-dated exposures to movements (i.e., gamma), as well as a supply of farther-dated volatility (i.e., +gamma worked, +vega did not).
The trends, as your letter writer explained in recent write-ups, and in a Benzinga article, may eventually exhaust; measures like the VVIX, which is the volatility of the VIX or the volatility of the S&P 500’s volatility, are printing at levels seen in 2017.
According to Kai Volatility’s Cem Karsan, markets are in a transition period and what’s worked in 2022 may not work as well in 2023; trades are becoming crowded and S&P 500 volatility skews have hit a lower bound of sorts. That was echoed by The Ambrus Group’s Kris Sidial who said that “we can get cheap exposure to convexity while a lot of people are worried.”
Since the start of the year, the skew shifted meaningfully higher while the S&P 500 and VIX have moved higher in sync, as well. Some, like SpotGamma, have their own explanation (e.g., the fear of missing out on a move higher results in call buying that bids volatility), expressing that this may be a trend that persists through events like Thursday’s consumer price update.
This letter’s takeaway is as follows. Markets can experience more of the same. As history has shown, the right trade may turn out to be short volatility across longer time horizons, and long/own volatility across shorter time horizons, for longer (i.e., current trends promoting realized volatility outperformance may persist longer).
However, should current trends persist, the market is likely to become far less well-hedged, as Karsan said in the video. If a catalyst arises, there may be a repricing in volatility which traders would not want to be on the wrong side of. Notwithstanding, as Sidial says, “[if] you’re trading volatility, let there be an underlying catalyst for doing so.” Don’t just buy it because it is cheap, or sell it because it is expensive.
We’ll go through the charts and implications in far more detail over the coming sessions. Your letter writer is stretched for time this morning. Take care!
Technical
As of 7:30 AM ET, Thursday’s regular session (9:30 AM – 4:00 PM ET), in the S&P 500, is likely to open in the upper part of a positively skewed overnight inventory, outside of prior-range and -value, suggesting a potential for immediate directional opportunity.
Our S&P 500 pivot for today is $3,988.25 HVNode.
Key levels to the upside include $4,000.25, $4,011.75, and $4,028.75.
Key levels to the downside include $3,979.75, $3,959.00, and $3,943.25.
Click here to load today’s key levels into the web-based TradingView platform. All levels are derived using the 65-minute timeframe. New links are produced, daily.
As a disclaimer, the S&P 500 could trade beyond the levels quoted in the letter. Therefore, you should load the above link on your browser for more relevant levels.
Graphic: 65-minute profile chart of the Micro E-mini S&P 500 Futures.
Definitions
Volume Areas: Markets will build on areas of high-volume (HVNodes). Should the market trend for long periods of time, it will be identified by low-volume areas (LVNodes). LVNodes denote directional conviction and ought to offer support on any test.
If participants auction and find acceptance in an area of a prior LVNode, then future discovery ought to be volatile and quick as participants look to HVNodes for favorable entry or exit.
POCs: Denote areas where two-sided trade was most prevalent in a prior day session. Participants will respond to future tests of value as they offer favorable entry and exit.
MCPOCs: Denote areas where two-sided trade was most prevalent over numerous sessions. Participants will respond to future tests of value as they offer favorable entry and exit.
About
In short, an economics graduate working in finance and journalism.
Capelj spends most of his time as the founder of Physik Invest through which he invests and publishes daily analyses to subscribers, some of whom represent well-known institutions.
Separately, Capelj is an equity options analyst at SpotGamma and an accredited journalist interviewing global leaders in business, government, and finance.
Physik Invest’s Daily Brief is read by thousands of subscribers. You, too, can join this community to learn about the fundamental and technical drivers of markets.
Graphic updated 7:00 AM ET. Sentiment Risk-On if expected /ES open is above the prior day’s range. /ES levels are derived from the profile graphic at the bottom of this letter. Levels may have changed since initially quoted; click here for the latest levels. SqueezeMetrics Dark Pool Index (DIX) and Gamma (GEX) with the latter calculated based on where the prior day’s reading falls with respect to the MAX and MIN of all occurrences available. A higher DIX is bullish. At the same time, the lower the GEX, the more (expected) volatility. Click to learn the implications of volatility, direction, and moneyness. Breadth reflects a reading of the prior day’s NYSE Advance/Decline indicator. The CBOE VIX Volatility Index (INDEX: VVIX) measure reflects the total attractiveness of owning volatility.
Fundamental
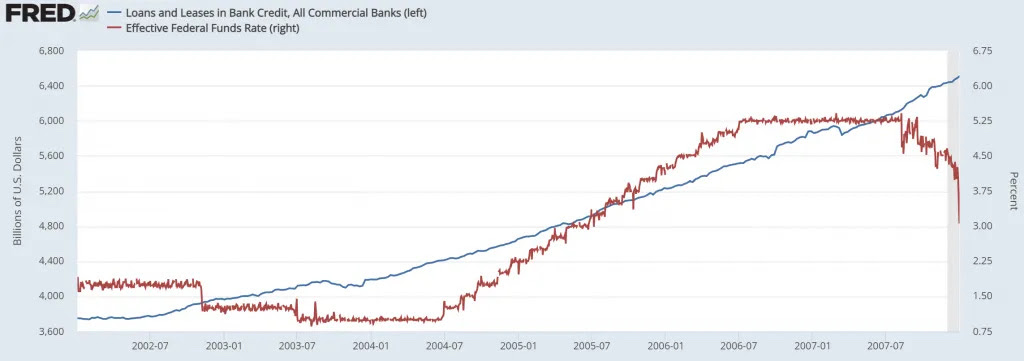
Ex-Federal Reserve (Fed) trader Joseph Wang said the 2020s credit boom is not over.
Per Wang’s analysis, there was “a boom in lending of epic proportions.” Bank loans totaled $1.2 trillion in 2022, while credit unions lent $0.23 trillion, about three times that of recent years.
Loan growth when rates are high is, in part, the result of the Fed’s post-GFC changes to transmitting monetary policy; “Higher rates mechanically raise net interest margins as funding costs are little changed.”
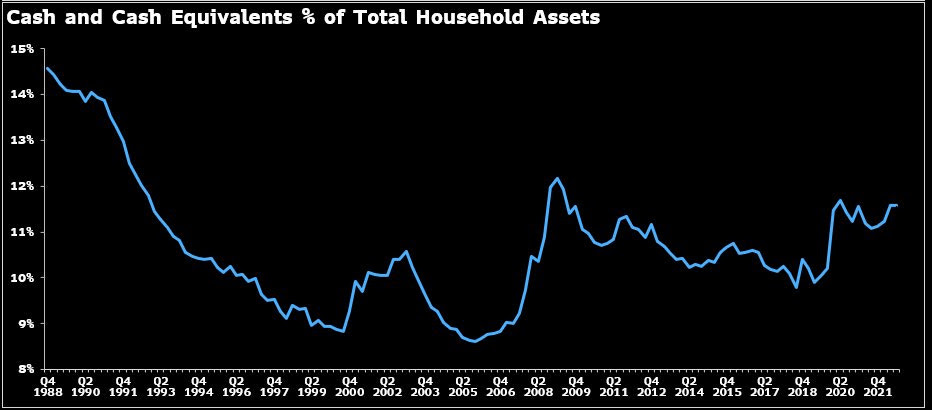
The banks’ strong position, coupled with households’ strong financial positions (i.e., higher net worth, favorable debt profile with the bulk of mortgages taken at low rates, and strong labor market) creates the context for credit growth amidst rising rates.
Graphic: Retrieved from @ginamartinadams via Daily Chartbook. “US households aren’t drawing on savings to support spending.”
Though this money must be repaid, borrowers “have $1.5 trillion more in purchasing power,” and this credit cycle “can last for years,” just as “[t]he housing led boom of the early 2000s continued for years even as rates rose.”
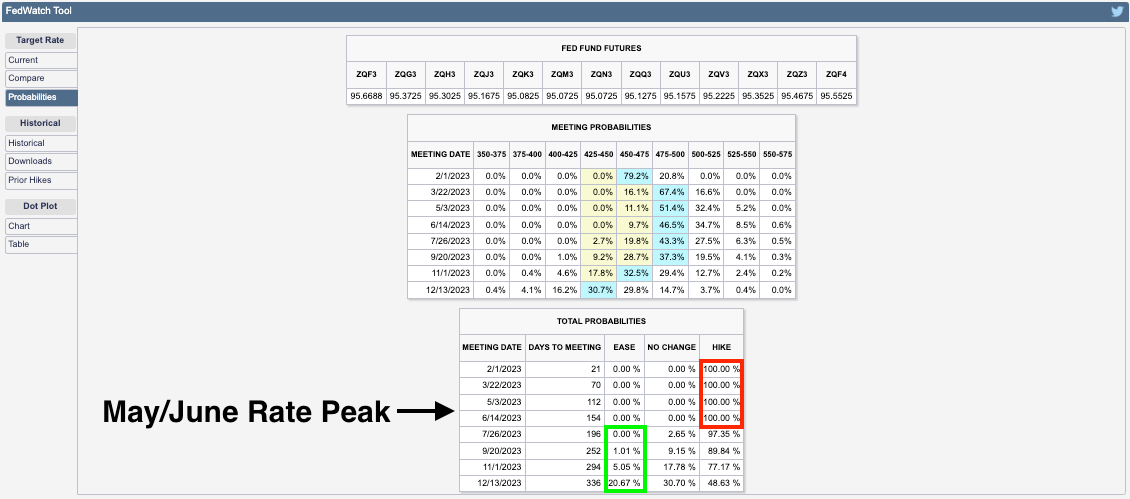
Graphic: Retrieved from CME Group Inc’s (NASDAQ: CME) FedWatch Tool. Rates are likely to rise.
Therefore, “the credit boom … should sustain demand for the coming years.” More detail on other contexts and implications in the coming letters. Have a great day!
Graphic: Retrieved from Joseph Wang via Federal Reserve Economic Data (FRED).
Technical
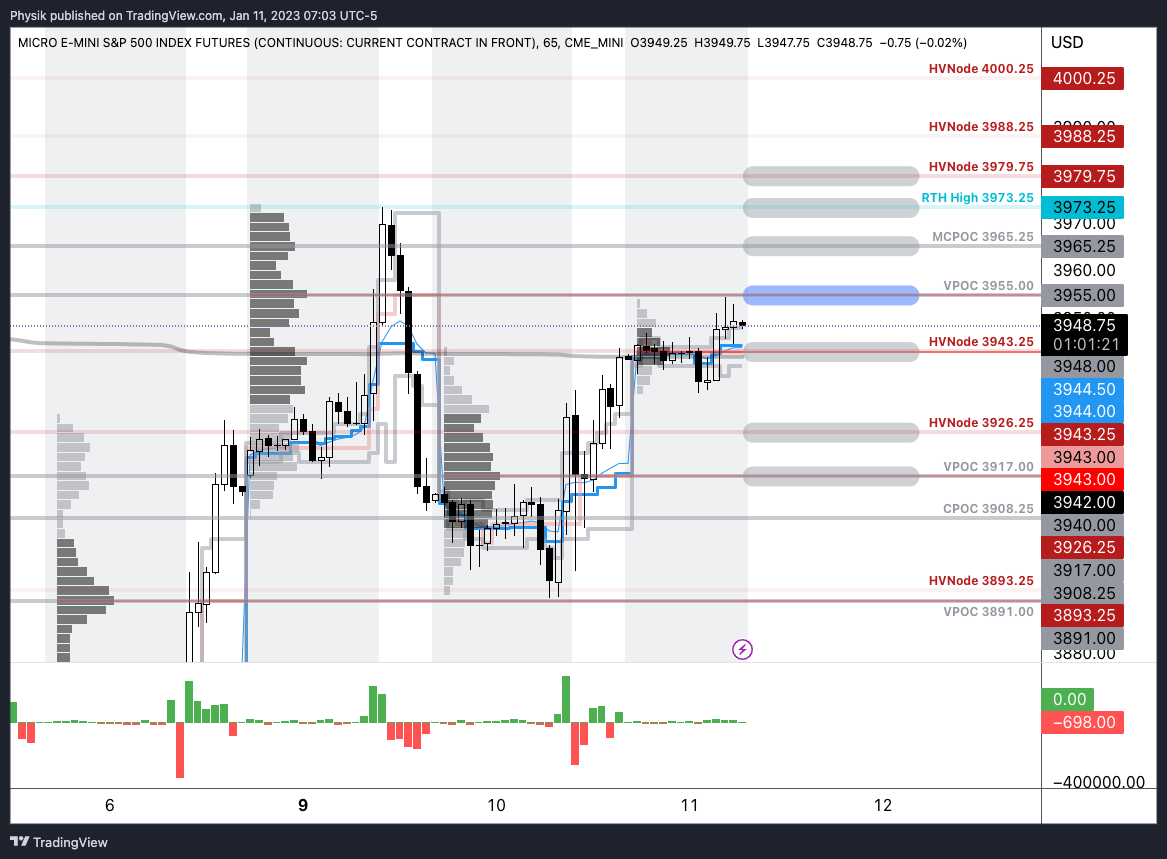
As of 7:00 AM ET, Wednesday’s session (9:30 AM – 4:00 PM ET), in the S&P 500, is likely to open in the upper part of a positively skewed overnight inventory, outside of prior-range and -value, suggesting a potential for immediate directional opportunity.
Our S&P 500 pivot for today is $3,955.00.
Key levels to the upside include $3,965.25, $3,973.25, and $3,979.75.
Key levels to the downside include $3,943.25, $3,926.25, and $3,917.00.
Click here to load today’s key levels into the web-based TradingView platform. All levels are derived using the 65-minute timeframe. New links are produced, daily.
As a disclaimer, the S&P 500 could trade beyond the levels quoted in the letter. Therefore, you should load the above link on your browser for more relevant levels.
Graphic: 65-minute profile chart of the Micro E-mini S&P 500 Futures.
Definitions
Volume Areas: Markets will build on areas of high-volume (HVNodes). Should the market trend for long periods of time, it will be identified by low-volume areas (LVNodes). LVNodes denote directional conviction and ought to offer support on any test.
If participants auction and find acceptance in an area of a prior LVNode, then future discovery ought to be volatile and quick as participants look to HVNodes for favorable entry or exit.
CPOCs: Denote areas where two-sided trade was most prevalent over all sessions. Participants will respond to future tests of value as they offer favorable entry and exit.
POCs: Denote areas where two-sided trade was most prevalent in a prior day session. Participants will respond to future tests of value as they offer favorable entry and exit.
MCPOCs: Denote areas where two-sided trade was most prevalent over numerous (but not all) sessions. Participants will respond to future tests of value as they offer favorable entry and exit.
About
In short, an economics graduate working in finance and journalism.
Capelj spends most of his time as the founder of Physik Invest through which he invests and publishes daily analyses to subscribers, some of whom represent well-known institutions.
Separately, Capelj is an equity options analyst at SpotGamma and an accredited journalist interviewing global leaders in business, government, and finance.
Physik Invest’s Daily Brief is read by thousands of subscribers. You, too, can join this community to learn about the fundamental and technical drivers of markets.
Graphic updated 6:50 AM ET. Sentiment Risk-Off if expected /ES open is below the prior day’s range. /ES levels are derived from the profile graphic at the bottom of this letter. Levels may have changed since initially quoted; click here for the latest levels. SqueezeMetrics Dark Pool Index (DIX) and Gamma (GEX) with the latter calculated based on where the prior day’s reading falls with respect to the MAX and MIN of all occurrences available. A higher DIX is bullish. At the same time, the lower the GEX, the more (expected) volatility. Click to learn the implications of volatility, direction, and moneyness. Breadth reflects a reading of the prior day’s NYSE Advance/Decline indicator. The CBOE VIX Volatility Index (INDEX: VVIX) measure reflects the total attractiveness of owning volatility.
Fundamental
Apologies for the delayed send. Please be subscribed to our Substack to receive updates sooner every day!
Last week, we added to our discussion on the “non-linear shocks” keeping inflation above target. In short, these shifts are not good for portfolio constructions like 60/40.
Moreover, in a January 6 Credit Suisse (NYSE: CS) follow-up, Zoltan Pozsar provided what he thinks may be a more optimal portfolio construction: 20% cash, 40% stocks, 20% bonds, and 20% commodities.
“[T]his ain’t your parents’ global macro environment,” Pozsar put forth, adding that some of the crises impacting the stability of money stem from the crisis of inflation “driven by mother nature and geopolitics.” Consequently, central banks’ responses may not be good for risk assets.
Amid a re-shaping of global flows (i.e., lower demands for the US dollar and Treasury securities), the Federal Reserve (Fed) may focus on backstopping bonds; if the usual marginal buyer won’t buy, in the context of geopolitical events, Treasuries may be at risk of tailing in auctions, which could, then, drive volatility in equities, credit, and EM.
By the end of 2023, the solution may be quantitative easing (QE) under the guise of yield curve control (YCC); QE will happen in the context of dysfunction in the Treasury markets, and seek to “police swap spreads at high levels of interest rates, not depress yields [and] inflate risk assets.”
Technical
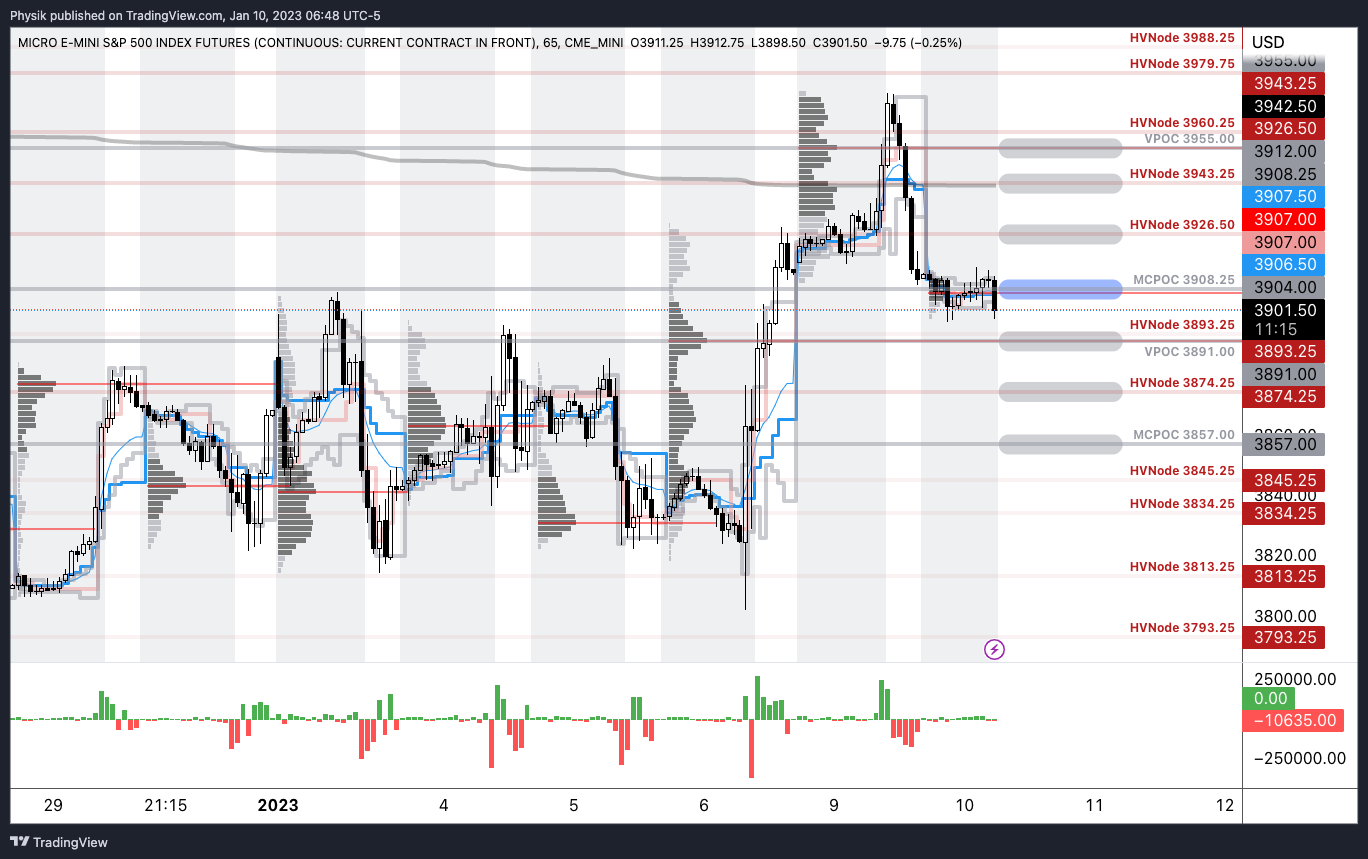
As of 6:45 AM ET, Tuesday’s regular session (9:30 AM – 4:00 PM ET), in the S&P 500, is likely to open in the lower part of a negatively skewed overnight inventory, outside of prior-range and -value, suggesting a potential for immediate directional opportunity.
Our S&P 500 pivot for today is $3,908.25.
Key levels to the upside include $3,926.50, $3,943.25, and $3,955.00.
Key levels to the downside include $3,891.00, $3,874.25, and $3,857.00.
Click here to load today’s key levels into the web-based TradingView platform. All levels are derived using the 65-minute timeframe. New links are produced, daily.
As a disclaimer, the S&P 500 could trade beyond the levels quoted in the letter. Therefore, you should load the above link on your browser for more relevant levels.
Graphic: 65-minute profile chart of the Micro E-mini S&P 500 Futures.
Definitions
Volume Areas: Markets will build on areas of high-volume (HVNodes). Should the market trend for long periods of time, it will be identified by low-volume areas (LVNodes). LVNodes denote directional conviction and ought to offer support on any test.
If participants auction and find acceptance in an area of a prior LVNode, then future discovery ought to be volatile and quick as participants look to HVNodes for favorable entry or exit.
POCs: Denote areas where two-sided trade was most prevalent in a prior day session. Participants will respond to future tests of value as they offer favorable entry and exit.
MCPOCs: Denote areas where two-sided trade was most prevalent over numerous sessions. Participants will respond to future tests of value as they offer favorable entry and exit.
About
In short, an economics graduate working in finance and journalism.
Capelj spends most of his time as the founder of Physik Invest through which he invests and publishes daily analyses to subscribers, some of whom represent well-known institutions.
Separately, Capelj is an equity options analyst at SpotGamma and an accredited journalist interviewing global leaders in business, government, and finance.
Physik Invest’s Daily Brief is read by thousands of subscribers. You, too, can join this community to learn about the fundamental and technical drivers of markets.
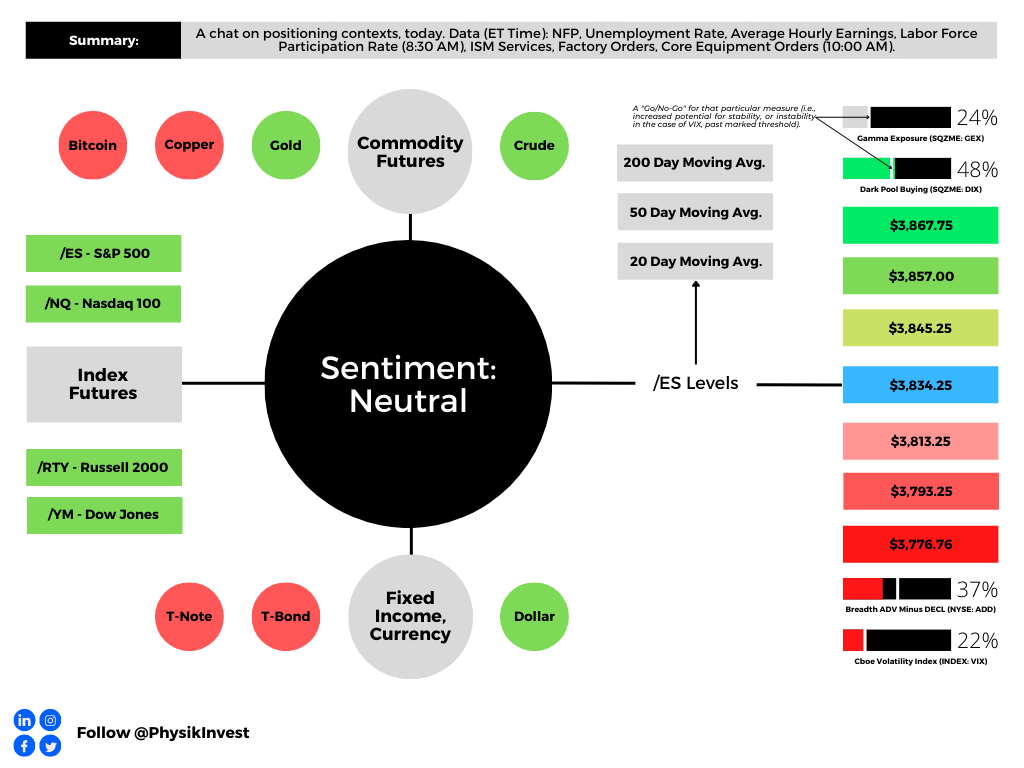
Graphic updated 7:50 AM ET. Sentiment Risk-On if expected /ES open is above the prior day’s range. /ES levels are derived from the profile graphic at the bottom of this letter. Levels may have changed since initially quoted; click here for the latest levels. SqueezeMetrics Dark Pool Index (DIX) and Gamma (GEX) with the latter calculated based on where the prior day’s reading falls with respect to the MAX and MIN of all occurrences available. A higher DIX is bullish. At the same time, the lower the GEX, the more (expected) volatility. Click to learn the implications of volatility, direction, and moneyness. Breadth reflects a reading of the prior day’s NYSE Advance/Decline indicator. The CBOE VIX Volatility Index (INDEX: VVIX) measure reflects the attractiveness of owning volatility. Green means that owning volatility is attractive.
Administrative
In last week’s letters, we discussed, mainly, fundamental and positioning contexts. Today’s letter will add to the discussion on the positioning.
Positioning
Last week, for an article published on Benzinga.com over the weekend, your letter writer spoke with The Ambrus Group’s co-chief investment officer Kris Sidial. Shared were the things to look out for in 2023 and tips for newer traders. The article can be viewed here, at this link.
In short, there are four big takeaways.
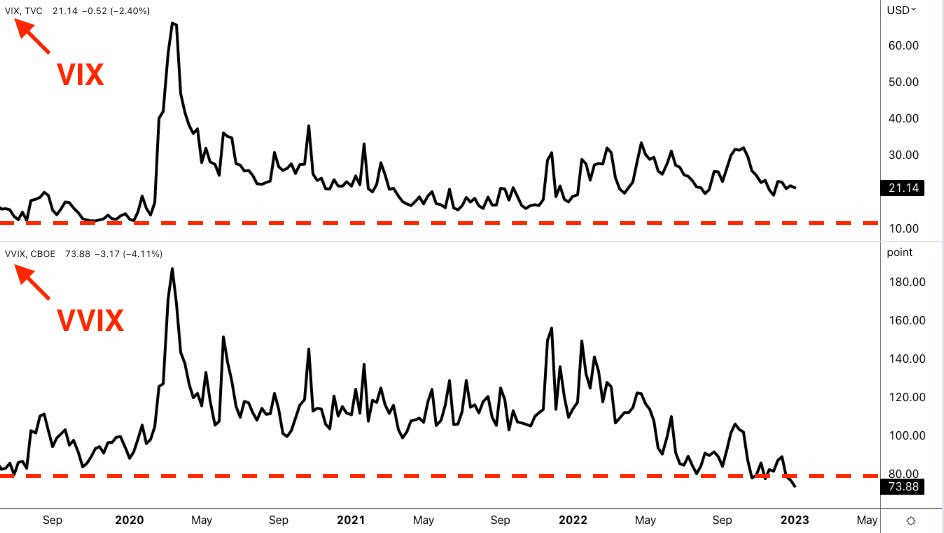
First, though options prices could stay under pressure, naive measures like the VVIX, which is the volatility of the VIX, or the volatility of the S&P 500’s volatility, are printing at levels last seen in 2017. This means “we can get cheap exposure to convexity while a lot of people are worried.”
Graphic: Retrieved from TradingView. Cboe Volatility Index (INDEX: VIX) is on the top. The volatility of the VIX itself (INDEX: VVIX) is at the bottom.
Second, on the other side of the growing S&P 500 and VIX complexes is a small concentrated group of market makers taking on far more exposure to risk.
Graphic: Retrieved from Ambrus’ publicly available research.
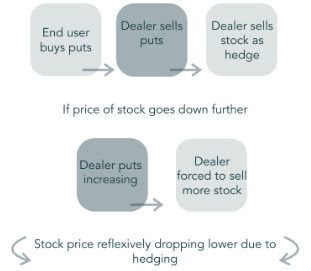
During moments of stress, these market makers may be “unable to keep up with the demands of frenetic investors,” Sidial said, pointing to GameStop Corporation (NYSE: GME) where “there was this reflexive dynamic” that helped push the stock higher in 2021.
“That same dynamic can happen on the way down”; market makers will mark up options prices during intense selling. As the options prices rise, options deltas (i.e., their exposure to direction) rise and this prompts so-called bearish vanna hedging flows.
Graphic: Retrieved from Ambrus’ publicly available research.
“Imagine a scenario where [some disaster happens] and everybody starts buying 0 DTE puts. That’s going to reflexively drive the S&P lower,” Sidial said. “Take, for example, the JPMorgan collar position that clearly has an effect on the market, and people are starting to understand that effect. That’s just one fund. Imagine the whole derivative ecosystem” leaning one way.
Graphic: Retrieved from Ambrus’ publicly available research.
The third is in reference to liquidity. As private market investors’ “deals are getting marked down, [t]o source liquidity, they may have to sell some of their holdings in the public equity markets.” Benn Eifert, the CIO at QVR Advisors, recently put forth that “late-stage technology is a great example where public comps are down 80-90% but privates marked down 20% or not at all. It is possible to imagine large institutions engaging in forced selling of liquid public equities to meet capital calls in private fund investments.”
And, lastly, investors often go “back and forth” and do not stick to a strict process. In trying to pick what will work at one specific time, investors can “miss what is going to work in the future.” Consequently, Sidial says investors should have an outlook and process to express that outlook. “It’s not as easy as saying: ‘Buy volatility because it’s cheap or sell it because it is expensive.’”
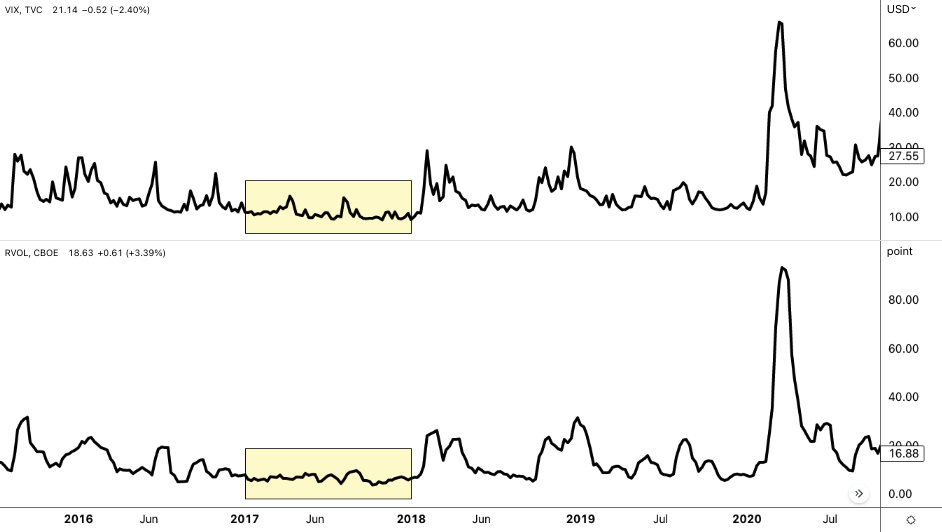
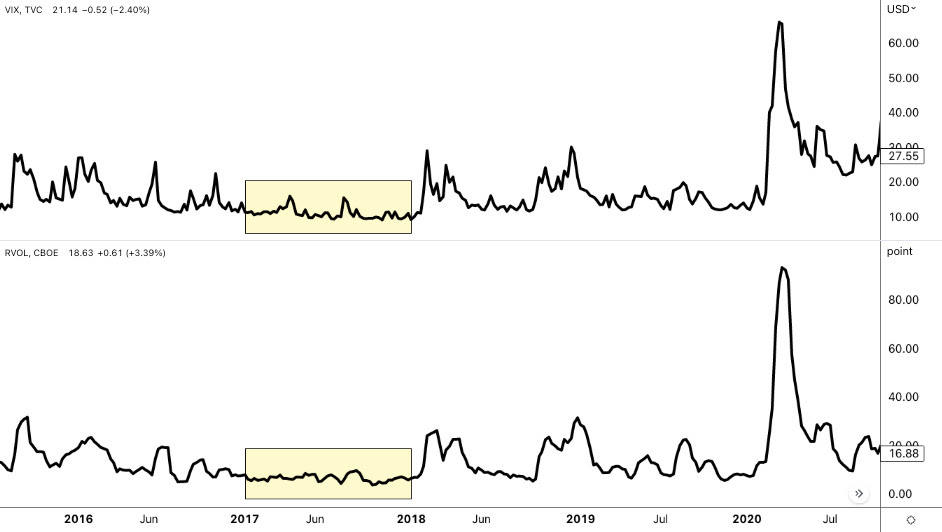
As a validation, in the Benzinga article, your letter writer wrote about 2017 when volatility was at some of its lowest levels. Back then, the correct trade was to sell volatility, in some cases, due to volatility’s bimodality; if you sold volatility back then, you made money due to its clustering.
Graphic: Retrieved from TradingView. Cboe Volatility Index (INDEX: VIX) is on the top. Cboe Realized Volatility (INDEX: RVOL) is at the bottom.
So, “if you’re trading volatility, let there be an underlying catalyst for doing so.” That said, from a “risk-to-reward perspective, … it’s a better bet to be on the long volatility side,” given “that there are so many things that … keep popping up” from a macro perspective.
For Ambrus’ publicly available research, click here. Also, follow Sidial on Twitter, here. Consider reading your letter writer’s past two conversations with Sidial, as well. Here is an article on 2021 and the meme stock debacle. Here is another article talking more about Ambrus’ processes.
Technical
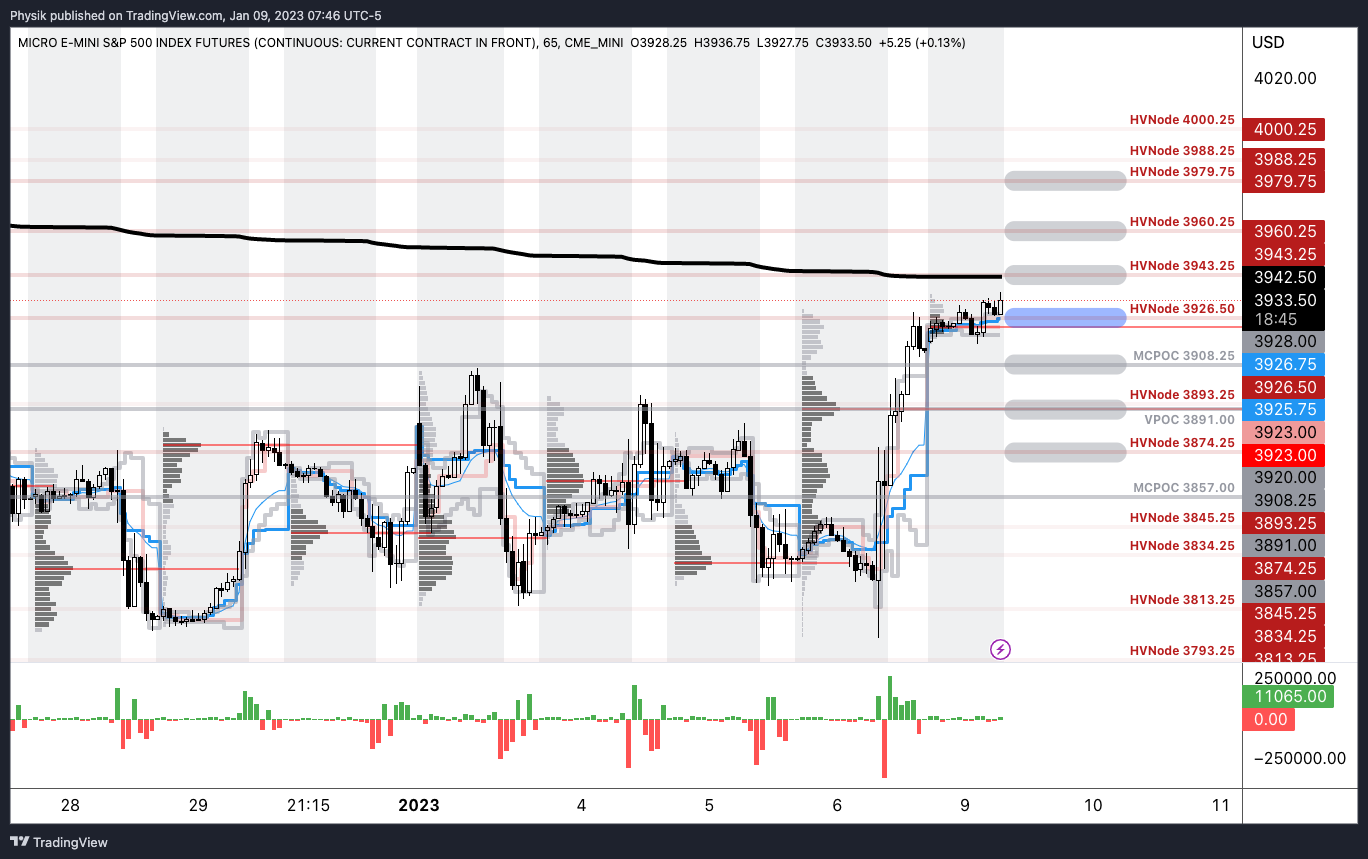
As of 7:50 AM ET, Monday’s regular session (9:30 AM – 4:00 PM ET), in the S&P 500, is likely to open in the upper part of a positively skewed overnight inventory, outside of prior-range and -value, suggesting a potential for immediate directional opportunity.
Our S&P 500 pivot for today is $3,926.50.
Key levels to the upside include $3,943.25, $3,960.25, and $3,979.75.
Key levels to the downside include $3,908.25, $3,891.00, and $3,874.25.
Click here to load today’s key levels into the web-based TradingView platform. All levels are derived using the 65-minute timeframe. New links are produced, daily.
As a disclaimer, note the S&P 500 could trade beyond the levels quoted in the letter. Therefore, you should load the key levels on your browser.
Graphic: 65-minute profile chart of the Micro E-mini S&P 500 Futures.
Definitions
Volume Areas: Markets will build on areas of high-volume (HVNodes). Should the market trend for long periods of time, it will be identified by low-volume areas (LVNodes). LVNodes denote directional conviction and ought to offer support on any test.
If participants auction and find acceptance in an area of a prior LVNode, then future discovery ought to be volatile and quick as participants look to HVNodes for favorable entry or exit.
Vanna: The rate at which the Delta of an option changes with respect to implied volatility.
POCs: Denote areas where two-sided trade was most prevalent in a prior day session. Participants will respond to future tests of value as they offer favorable entry and exit.
MCPOCs: Denote areas where two-sided trade was most prevalent over numerous sessions. Participants will respond to future tests of value as they offer favorable entry and exit.
About
In short, an economics graduate working in finance and journalism.
Capelj spends most of his time as the founder of Physik Invest through which he invests and publishes daily analyses to subscribers, some of whom represent well-known institutions.
Separately, Capelj is an equity options analyst at SpotGamma and an accredited journalist interviewing global leaders in business, government, and finance.
Physik Invest’s Daily Brief is read by thousands of subscribers. You, too, can join this community to learn about the fundamental and technical drivers of markets.
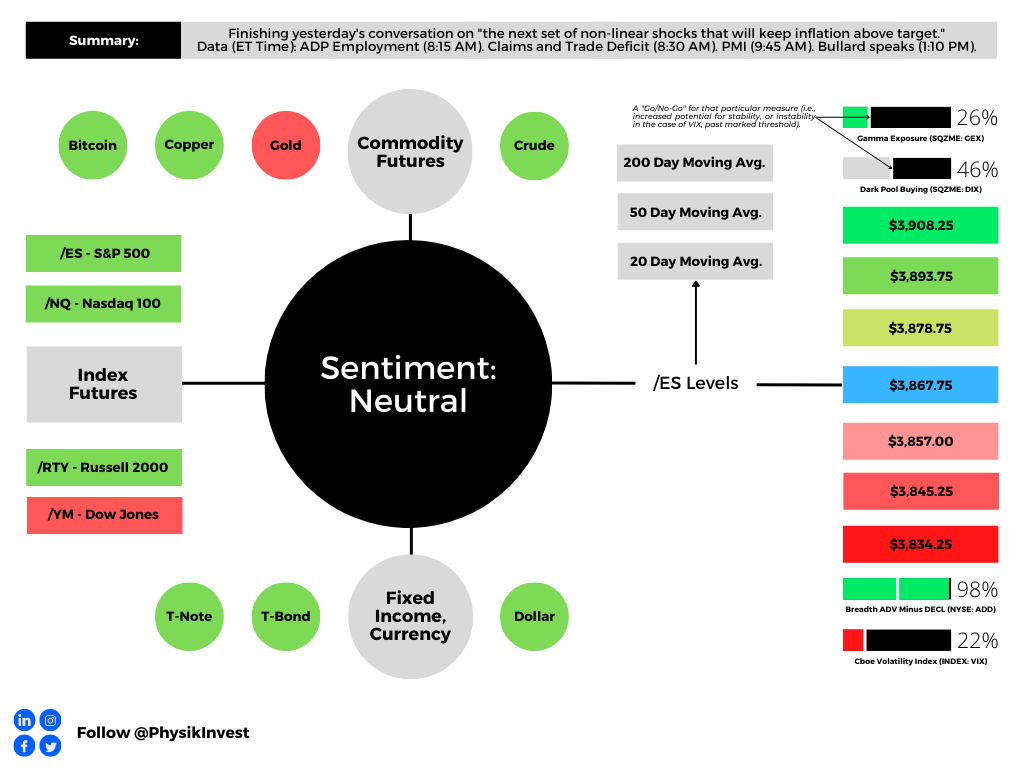
Graphic updated 8:30 AM ET. Sentiment Neutral if expected /ES open is inside of the prior day’s range. /ES levels are derived from the profile graphic at the bottom of this letter. Levels may have changed since initially quoted; click here for the latest levels. SqueezeMetrics Dark Pool Index (DIX) and Gamma (GEX) with the latter calculated based on where the prior day’s reading falls with respect to the MAX and MIN of all occurrences available. A higher DIX is bullish. At the same time, the lower the GEX, the more (expected) volatility. Click to learn the implications of volatility, direction, and moneyness. Breadth reflects a reading of the prior day’s NYSE Advance/Decline indicator. VIX reflects a current reading of the CBOE Volatility Index (INDEX: VIX) from 0-100.
Administrative
Hey team, hope you had a great week! Please consider reading our letters for January 3 and 4. In those letters, we discussed the potential drivers of long-lasting inflation that may not be good for traditional portfolio constructions like 60/40.
In today’s letter, we talk about some positioning contexts, leaning into this letter writer’s interview with The Ambrus Group’s Kris Sidial for a Benzinga article to be published either this weekend or next week.
This letter will serve as a primer. Next week, we will go into further depth. Have a great weekend!
Positioning
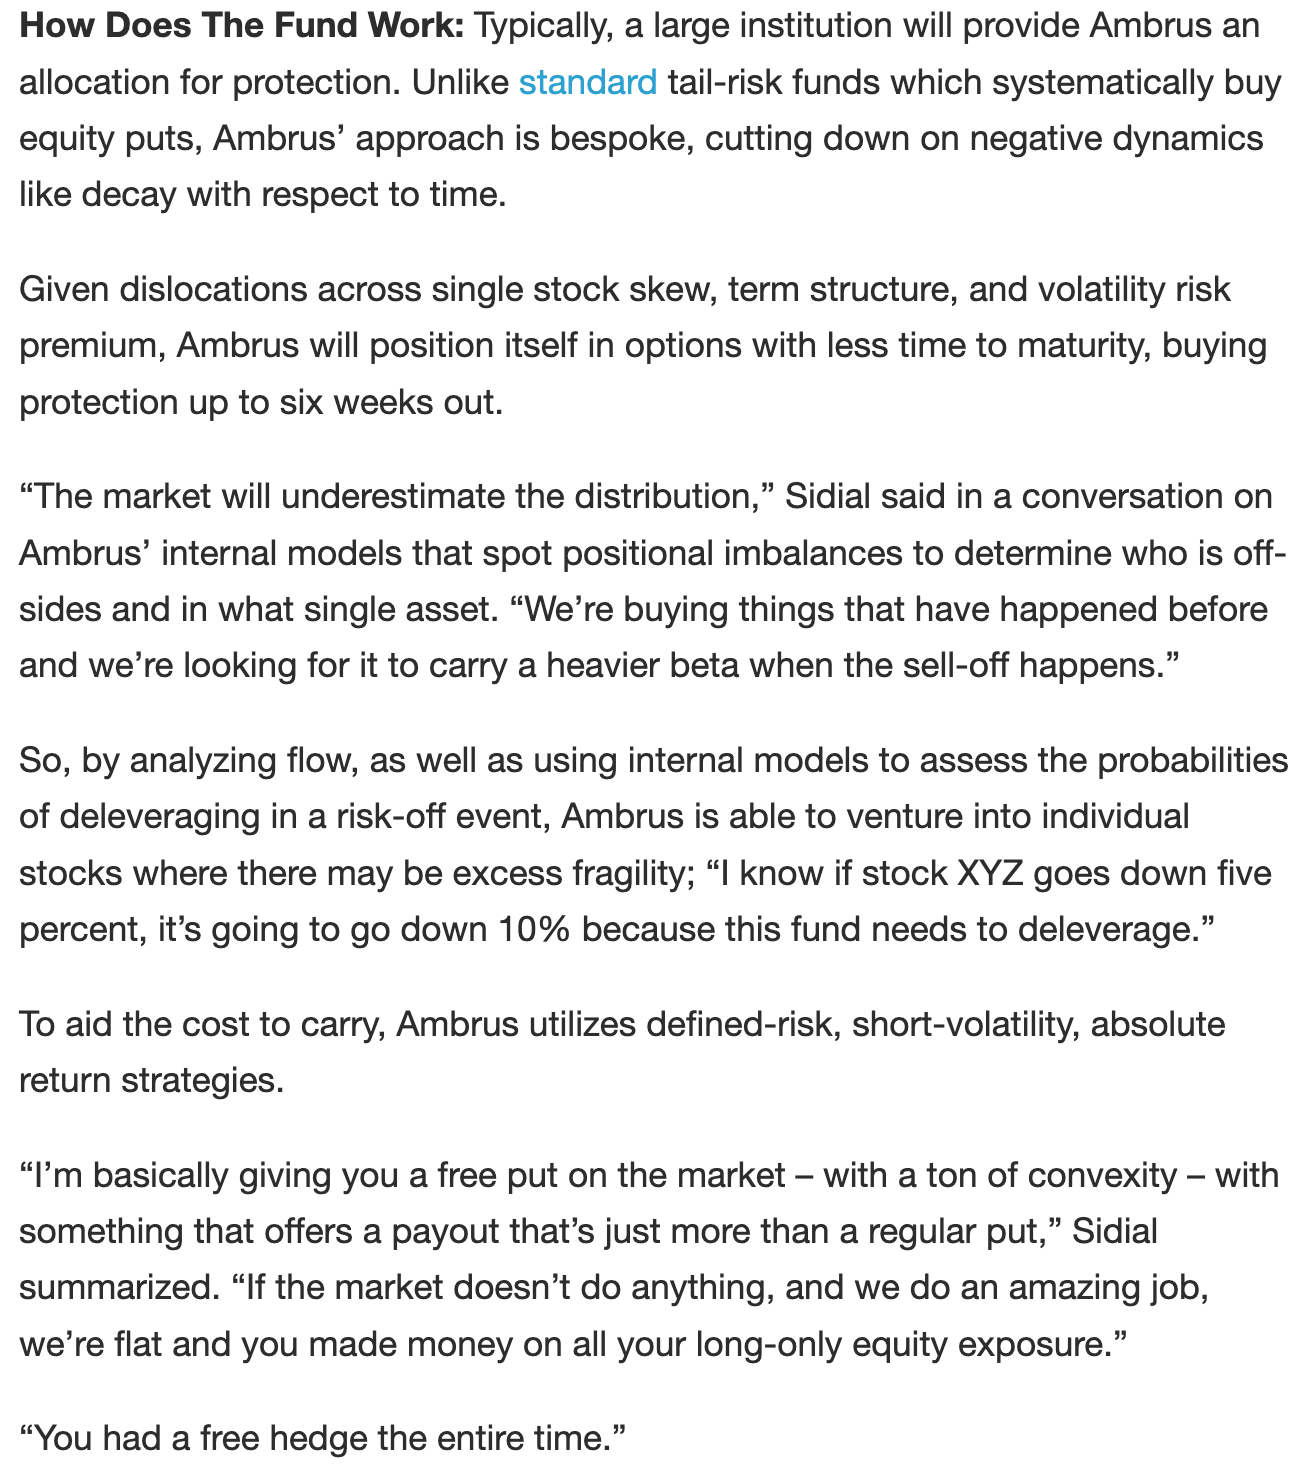
In a conversation with your letter writer prior to 2022, and on YouTube, Sidial and some other Ambrus members said markets were increasingly fragile and traditional portfolio constructions such as 60/40 (i.e., 60% of holdings held in stocks and 40% of the holdings held in bonds) would not perform as well as history would imply.
Instead, options (colloquially referred to as volatility) may “potentially outperform the market” and limit losses.
Pursuant to Ambrus’ warnings, 60/40 logged one of its worst stretches as inflation and interest rates rose. On the other hand, Ambrus, which is a volatility arbitrage fund, managed to end the year unscathed.
“That does not mean all volatility funds ended the same way,” Sidial said in a nod to his team’s unique approach to leveraging options’ multi-dimensionality in reducing the cost of protection they own for investors.
Here’s more on Ambrus’ approach from a previous conversation your letter writer had with Sidial for a Benzinga article.
This approach is limiting, though, Sidial notes. Increasing assets under management can eat into the firm’s own alpha.
Anyways, Sidial went on to discuss the performance of volatility in 2022 and its potential to outperform in 2023 and beyond.
“It caught everybody by surprise that long volatility underperformed,” he said in reference to a high spot-vol beta (i.e., volatility’s sensitivity to underlying prices) in 2021 suggesting volatility was likely to come to life in 2022, and “there would be more follow-through.”
However, there was no follow-through, and Sidial believes this was the result of allocations to commodity trading advisors or CTAs, and the “consensus trade,” or the sales of volatility on expectations markets would grind and chop lower for the entirety of 2022.
As this letter has put forth in the past, traders proactively hedged heading into 2022. The unwind or supply of some of these hedges, coupled with investors’ expectation markets would continue to grind far lower, prompted more volatility sales (a pressure on options prices), masked by the persistently high, albeit tame Cboe Volatility Index (INDEX: VIX) and metrics like the put-to-call ratio appearing inflated, potentially the result of stock loan desks replacing short stock with in-the-money puts given high-interest rates.
Though the price of volatility could move toward the extremes (i.e., clustering/mean-reverting), trends may be near exhaustion.
Naive measures like the VVIX, which is the volatility of the VIX (i.e., the volatility of the S&P 500 volatility), are printing at levels last seen in 2017. This suggests “we can get cheap exposure to convexity while a lot of people are worried.”
Therefore, “even if inflation continues, the rate at which inflation rises won’t be the same. Due to this, CTA exposures likely will not perform as well as they did in 2022, and that’s why you may see more opportunities in the volatility space.”
Moving on, though not catalysts or reasons for Ambrus to initiate trades per se, risks Sidial said could result in volatility performing well include the concentration of market makers and private markets’ sourcing of liquidity (or raising cash) through sales of public equity markets.
“During moments of market stress, the market makers are unable to keep up with the demands of frenetic investors. If you think of GameStop Corp (NYSE: GME), which we talked about before, there was this reflexive dynamic that happened when investors rushed into the stock one way.”
“That same dynamic can happen on the way down”; market makers mark up volatility during stress which can pressure markets. As the price of volatility rises, option deltas rise and this prompts bearish vanna hedging flows, as they are called.
Your letter writer will pause the commentary at this point while he further unpacks his discussion with Sidial, but at least you got a sneak peek ahead of next week’s article release. Take care!
Technical
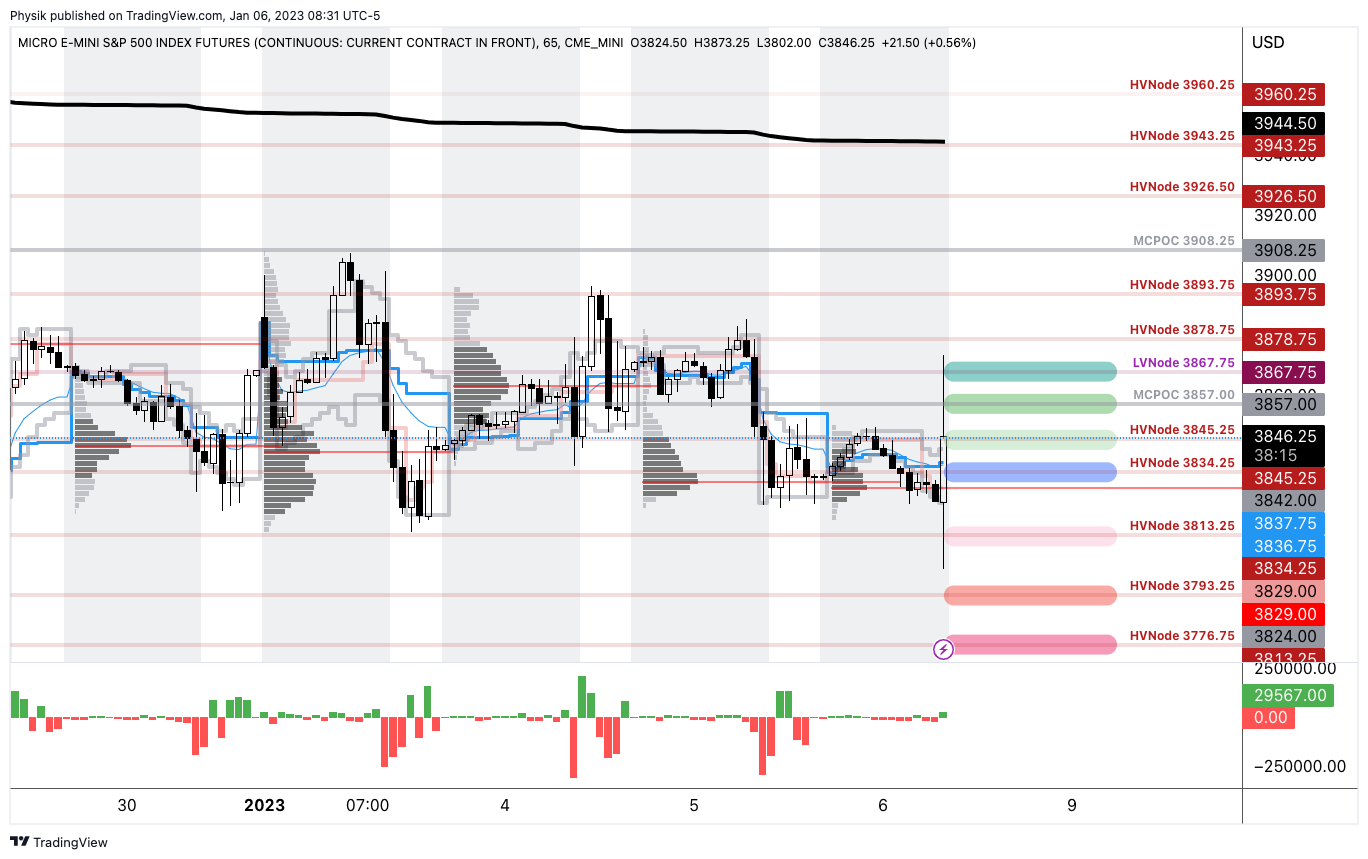
As of 8:30 AM ET, Friday’s regular session (9:30 AM – 4:00 PM ET), in the S&P 500, is likely to open in the middle part of a balanced overnight inventory, inside of prior-range and -value, suggesting a limited potential for immediate directional opportunity.
Our S&P 500 pivot for today is $3,834.25.
Key levels to the upside include $3,845.25, $3,857.00, and $3,867.75.
Key levels to the downside include $3,813.25, $3,793.25, and $3,776.75.
Click here to load today’s key levels into the web-based TradingView platform. All levels are derived using the 65-minute timeframe. New links are produced, daily.
Note that early morning news may result in quoted levels not performing well. Please make sure to use the link to view the real-time chart for more levels that may be in play.
Graphic: 65-minute profile chart of the Micro E-mini S&P 500 Futures.
Definitions
Volume Areas: Markets will build on areas of high-volume (HVNodes). Should the market trend for long periods of time, it will be identified by low-volume areas (LVNodes). LVNodes denote directional conviction and ought to offer support on any test.
If participants auction and find acceptance in an area of a prior LVNode, then future discovery ought to be volatile and quick as participants look to HVNodes for favorable entry or exit.
MCPOCs: Denote areas where two-sided trade was most prevalent over numerous sessions. Participants will respond to future tests of value as they offer favorable entry and exit.
About
In short, an economics graduate working in finance and journalism.
Capelj spends most of his time as the founder of Physik Invest through which he invests and publishes daily analyses to subscribers, some of whom represent well-known institutions.
Separately, Capelj is an equity options analyst at SpotGamma and an accredited journalist interviewing global leaders in business, government, and finance.
Physik Invest’s Daily Brief is read by thousands of subscribers. You, too, can join this community to learn about the fundamental and technical drivers of markets.
Graphic updated 7:05 AM ET. Sentiment Neutral if expected /ES open is inside of the prior day’s range. /ES levels are derived from the profile graphic at the bottom of this letter. Levels may have changed since initially quoted; click here for the latest levels. SqueezeMetrics Dark Pool Index (DIX) and Gamma (GEX) with the latter calculated based on where the prior day’s reading falls with respect to the MAX and MIN of all occurrences available. A higher DIX is bullish. At the same time, the lower the GEX, the more (expected) volatility. Click to learn the implications of volatility, direction, and moneyness. Breadth reflects a reading of the prior day’s NYSE Advance/Decline indicator. VIX reflects a current reading of the CBOE Volatility Index (INDEX: VIX) from 0-100.
Administrative
Today’s coverage adds to comments made, yesterday. See the Daily Brief for January 4, here. If you’re short on time, here’s an abstract:
There is the existence of “non-linear shocks that will keep inflation above target”
A shift, the first in generations, from unipolar to multipolar is not good for “60/40”
Fundamental
Yesterday’s letter discussed whether “the next set of non-linear shocks that will keep inflation above target” are priced. According to a December 27 note by the Credit Suisse Group AG’s (NYSE: CS) Zoltan Pozsar, these non-linear shocks have yet to be priced.
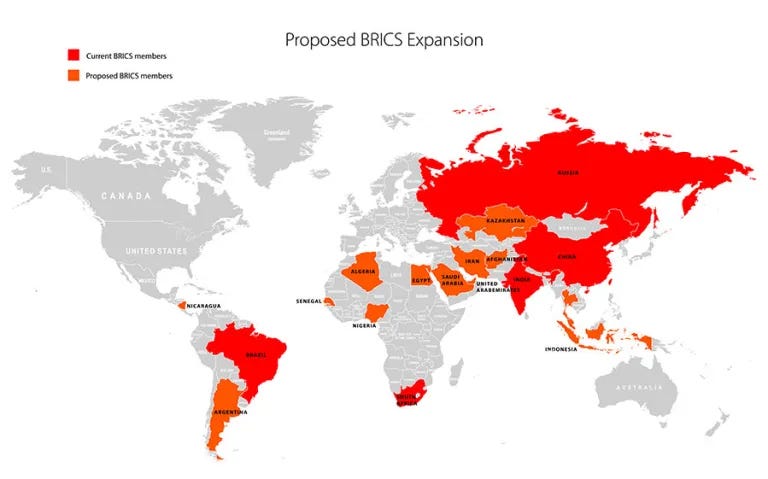
In summary, as Pozsar said on December 29, “whoever encumbers commodities and controls the factories rules inflation, whoever rules inflation controls interest rates, and whoever controls interest rates controls the level of the stock market and financial wealth more generally”; a shift, the first in generations, from unipolar to multipolar, via the “Great Power conflict, BRICSpansion, ‘BRICS coin’, and commodity encumbrance, … portends nothing good for your 60/40 portfolio.”
To stay ahead of these shifts, investors have to glean information from statesmen, rather than central bankers. The pursuit of “friend-shoring and Belt and Road” – cooperation, development, and the facilitation of interstate payments off the Western systems – to lower dependencies on the West and hedge against sanctions risks, is a reversal of trends that helped create a “more speculative, debt-fueled economy in the US,” per the Financial Times. Central bankers are not equipped to fight this trend reversal.
So, with that, where are we at with these shifts? Pozsar thinks “2023 will be pivotal.”
The G20 is set to become “the ‘G7 + Australia’ = 8 countries on one side, and ‘BRICS + new applicants + the thematically aligned’ = 11 countries on the other. 8 + 11 = 19. The remaining member, the European Union (EU), is perhaps the most directly affected by this global ‘split’”.
Graphic: Retrieved from the German press and information offices.
In fact, if new candidate countries for the BRICS expansion are accepted, “an entity with a GDP 30% larger than the United States, [with] over 50% of the global population [] in control of 60% of global gas reserves” could be created. This is significant. Per Pozsar, “the BRICS are most aligned on [] the de-dollarization of their fast-growing, bilateral trade flows.”
Consequently, in this strive for some independence from the West, “the US dollar and Treasury securities will likely be dealing with issues they never had to deal with before: less demand, not more; more competition, not less.” That’s information for us investors to keep in mind as 2023 unfolds and more seek to join the “friend-shoring and Belt and Road” train.
For an update on positioning, stay tuned for Friday, January 6’s newsletter.
Technical
As of 7:00 AM ET, Thursday’s regular session (9:30 AM – 4:00 PM ET), in the S&P 500, is likely to open in the upper part of a balanced overnight inventory, inside of prior-range and -value, suggesting a limited potential for immediate directional opportunity.
Our S&P 500 pivot for today is $3,867.75.
Key levels to the upside include $3,878.75, $3,893.75, and $3,908.25.
Key levels to the downside include $3,857.00, $3,845.25, and $3,834.25.
Click here to load today’s key levels into the web-based TradingView platform. All levels are derived using the 65-minute timeframe. New links are produced, daily.
Graphic: 65-minute profile chart of the Micro E-mini S&P 500 Futures.
Definitions
Volume Areas: Markets will build on areas of high-volume (HVNodes). Should the market trend for long periods of time, it will be identified by low-volume areas (LVNodes). LVNodes denote directional conviction and ought to offer support on any test.
If participants auction and find acceptance in an area of a prior LVNode, then future discovery ought to be volatile and quick as participants look to HVNodes for favorable entry or exit.
MCPOCs: Denote areas where two-sided trade was most prevalent over numerous sessions. Participants will respond to future tests of value as they offer favorable entry and exit.
About
In short, an economics graduate working in finance and journalism.
Capelj spends most of his time as the founder of Physik Invest through which he invests and publishes daily analyses to subscribers, some of whom represent well-known institutions.
Separately, Capelj is an equity options analyst at SpotGamma and an accredited journalist interviewing global leaders in business, government, and finance.
Physik Invest’s Daily Brief is read by thousands of subscribers. You, too, can join this community to learn about the fundamental and technical drivers of markets.
Graphic updated 8:45 AM ET. Sentiment Neutral if expected /ES open is inside of the prior day’s range. /ES levels are derived from the profile graphic at the bottom of this letter. Levels may have changed since initially quoted; click here for the latest levels. SqueezeMetrics Dark Pool Index (DIX) and Gamma (GEX) with the latter calculated based on where the prior day’s reading falls with respect to the MAX and MIN of all occurrences available. A higher DIX is bullish. At the same time, the lower the GEX, the more (expected) volatility. Click to learn the implications of volatility, direction, and moneyness. Breadth reflects a reading of the prior day’s NYSE Advance/Decline indicator. VIX reflects a current reading of the CBOE Volatility Index (INDEX: VIX) from 0-100.
Fundamental
Please note the following conversation gives us very little edge. Rather, this text simply keeps our view of markets well-rounded. Read on for more.
Our past letters explored the contexts for long-lasting and/or double-dip inflation. As explained by the Credit Suisse Group AG’s (NYSE: CS) Zoltan Pozsar, there were a series of “non-linear shocks” (e.g., pandemic and the response to it, supply chain issues and shortages in labor, as well as the Ukraine conflict), and those shocks prompted a shift away from “generating demand structurally to soak up an excess supply of cheap stuff, to curbing demand structurally to adjust to shortages.”
Consequently, the economy is on an L-shaped trajectory (i.e., drop in activity via recession, and flatline for a period of time as rates remain higher for longer to prevent another rise in inflation).
In Pozsar’s recent updates, he added “the next set of non-linear shocks that will keep inflation above target, forcing central banks to hike interest rates above 5% and keep them high as they ‘clean up’ the inflation mess caused by … geopolitics, resource nationalism, and BRICS,” have yet to be priced by the market. At stake is the future of the dollar and US Treasury liquidity.
“I don’t think five-year forward five-year rates are pricing the future correctly,” he said, using his knowledge that pricing is the result of “central banks’ inflation targets” and liquidity.
“If investors read only the speeches of central bankers but not statesmen, they will be even more behind the curve” as the world shifts “from unipolar to multipolar, … built not by G7 heads of state but by the ‘G7 of the East’ (the BRICS heads of state),” representative of about ~40% of the global population and ~25% of the world’s GDP.
What’s Pozsar’s support for this thesis?
It is the start of alliances as powerful as those struck in 1945 between the US and the Middle East which resulted in the petrodollar (i.e., the US’s import of oil in exchange for dollars that Saudi Arabia spent on US Treasuries, arms, and deposits in US banks).
Graphic: Retrieved from History.com. “King Abdul Aziz Ibn Saud of Saudi Arabia (center) meeting with President Franklin D. Roosevelt aboard the USS Quincy in Great Bitter Lake, Egypt on February 14, 1945.”
“President Xi [Jinping’s] visit with Saudi and GCC leaders marks the birth of the petroyuan and a leap in China’s growing encumbrance of OPEC+’s oil and gas reserves,” which is inflationary for the West (i.e., the US and beyond).
Graphic: Retrieved from the Ministry of Foreign Affairs of the People’s Republic of China.
Xi Jinping’s speech during his visit was along the lines of the following, Pozsar wrote:
“In the next three to five years, China is ready to work with GCC countries in the following priority areas: first, setting up a new paradigm of all-dimensional energy cooperation, where China will continue to import large quantities of crude oil on a long-term basis from GCC countries, and purchase more LNG. We will strengthen our cooperation in the upstream sector, engineering services, as well as [downstream] storage, transportation, and refinery. The Shanghai Petroleum and Natural Gas Exchange platform will be fully utilized for RMB settlement in oil and gas trade, […] and we could start currency swap cooperation and advance the m-CBDC Bridge project”.
It’s a response to reduce reliances and hedge against sanctions risks. In “the next three to five years,” China, Saudi Arabia, and the GCC are pursuing “all-dimensional energy cooperation, … and oil [in exchange] for development.” No funding would happen in US dollars. Instead, China will buy more oil at big discounts, and it will do so “in renminbi over the next three to five years, … which GCC countries will be able to decumulate” through investments and development, as well as convertibility to gold via exchanges in Shanghai and Hong Kong, and mechanisms that involve the use of CBDCs “interlinked to facilitate interstate payments ‘off the Western system.’”
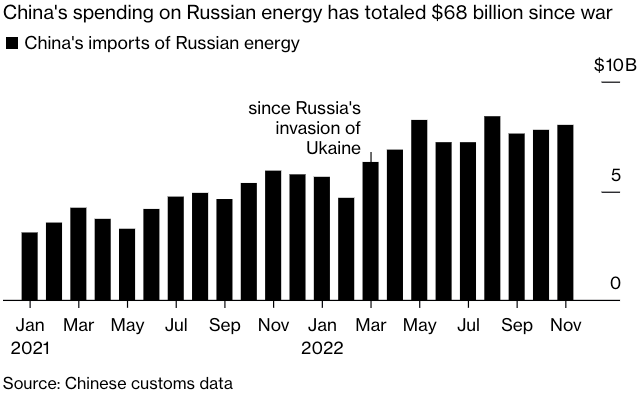
A product of this regime includes commodity encumbrance and rehypothecation, or the re-export of resources for profits (e.g., “China became a big exporter of Russian LNG to Europ, and India a big exporter of Russian oil and refined products such as diesel to Europe”).
Per the Financial Times’ Rana Foroohar, “the recycling of petrodollars by oil-rich nations” fueled “several emerging market debt crises” and prompted “the creation of a more speculative, debt-fueled economy in the US.”
“That trend may now start to go in reverse,” Foroohar added, a nod to Pozsar’s comments on the impact of the broader efforts to de-dollarize (e.g., the creation of a “commodity-weighted neutral reserve asset that encourages members to pledge their commodities to the BRICS ‘cause’”), all the while more drilling does less and less to boost the supply oil and gas.
Consequently, by encumbering commodities in strict supply, nations can boost their weights in currency baskets. This may “keep inflation from slowing and interest rates from falling for the rest of this decade.” Monetary policymakers are not well-equipped to fight this trend.
More on these themes in the coming newsletters. Have a great day!
Technical
As of 8:45 AM ET, Wednesday’s regular session (9:30 AM – 4:00 PM ET), in the S&P 500, is likely to open in the upper part of a positively skewed overnight inventory, inside of prior-range and -value, suggesting a limited potential for immediate directional opportunity.
Our S&P 500 pivot for today is $3,857.00.
Key levels to the upside include $3,867.75, $3,878.75, and $3,893.25.
Key levels to the downside include $3,845.25, $3,834.25, and $3,813.25.
Click here to load today’s key levels into the web-based TradingView platform. All levels are derived using the 65-minute timeframe. New links are produced, daily. The levels may have changed since initially quoted due to rapid movement prior to the market opening.
Graphic: 65-minute profile chart of the Micro E-mini S&P 500 Futures.
Definitions
Volume Areas: Markets will build on areas of high-volume (HVNodes). Should the market trend for long periods of time, it will be identified by low-volume areas (LVNodes). LVNodes denote directional conviction and ought to offer support on any test.
If participants auction and find acceptance in an area of a prior LVNode, then future discovery ought to be volatile and quick as participants look to HVNodes for favorable entry or exit.
MCPOCs: Denote areas where two-sided trade was most prevalent over numerous sessions. Participants will respond to future tests of value as they offer favorable entry and exit.
About
In short, an economics graduate working in finance and journalism.
Capelj spends most of his time as the founder of Physik Invest through which he invests and publishes daily analyses to subscribers, some of whom represent well-known institutions.
Separately, Capelj is an equity options analyst at SpotGamma and an accredited journalist interviewing global leaders in business, government, and finance.
Physik Invest’s Daily Brief is read by thousands of subscribers. You, too, can join this community to learn about the fundamental and technical drivers of markets.
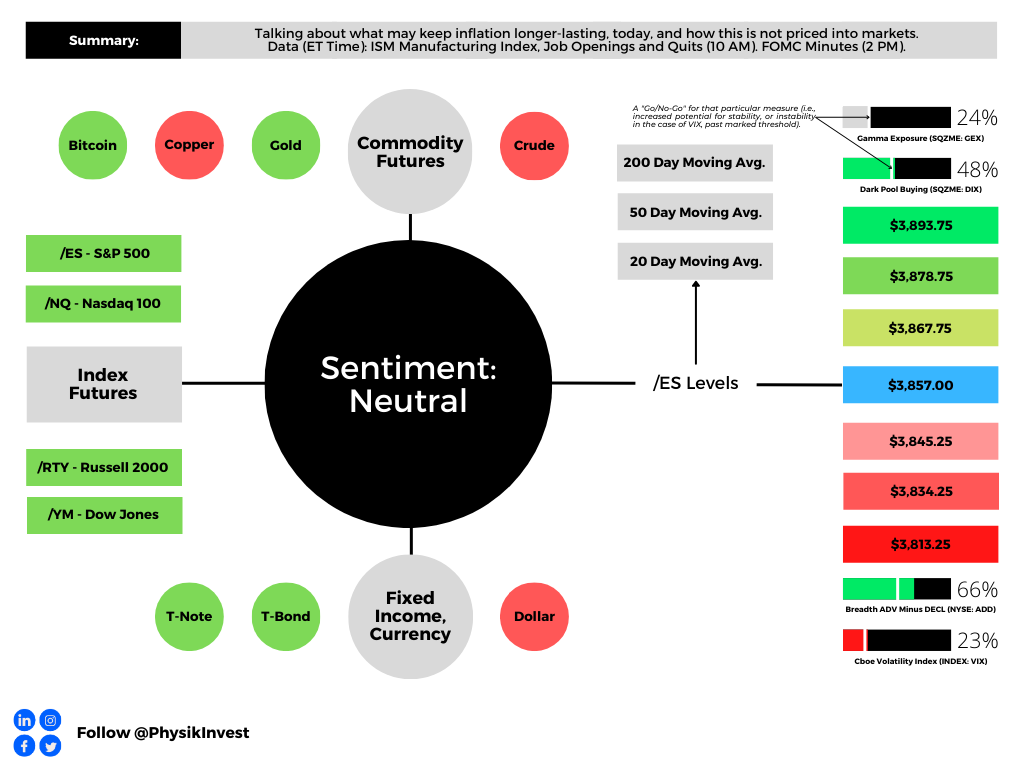
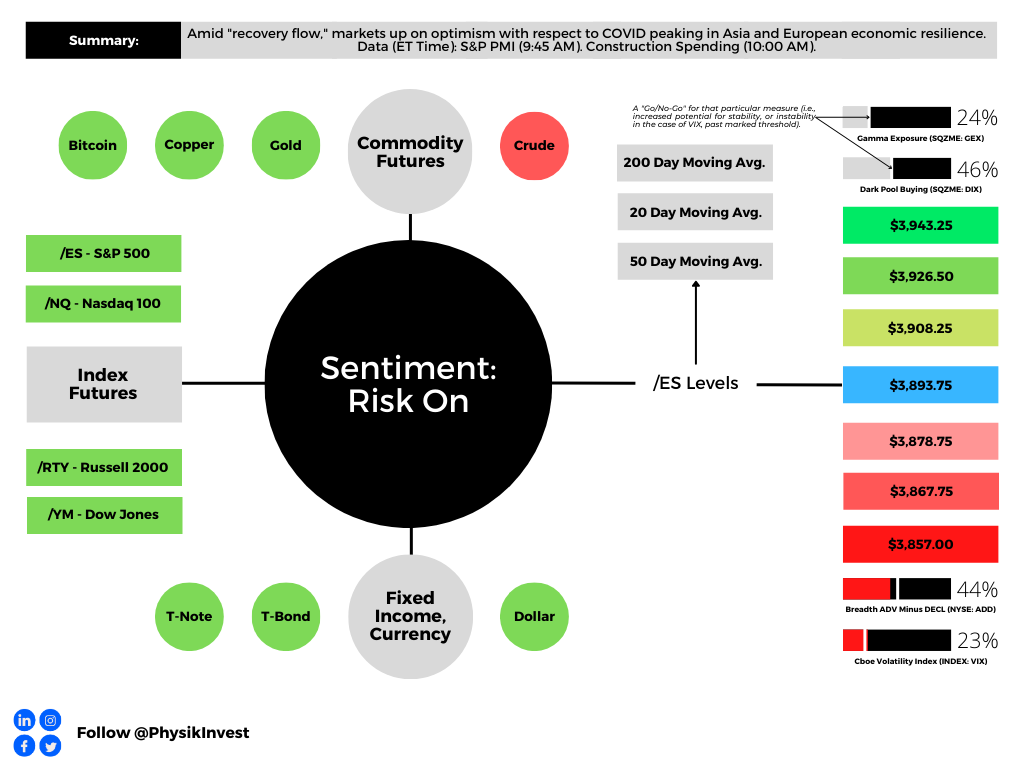
Graphic updated 6:30 AM ET. Sentiment Risk-On if expected /ES open is above the prior day’s range. /ES levels are derived from the profile graphic at the bottom of this letter. Levels may have changed since initially quoted; click here for the latest levels. SqueezeMetrics Dark Pool Index (DIX) and Gamma (GEX) with the latter calculated based on where the prior day’s reading falls with respect to the MAX and MIN of all occurrences available. A higher DIX is bullish. At the same time, the lower the GEX, the more (expected) volatility. Click to learn the implications of volatility, direction, and moneyness. Breadth reflects a reading of the prior day’s NYSE Advance/Decline indicator. VIX reflects a current reading of the CBOE Volatility Index (INDEX: VIX) from 0-100.
Administrative
Morning, everyone, and happy new year! Today’s letter will only provide updates to key levels. In the next few days, we will unpack the drivers of long-lasting inflation and end the week with some context on positioning (featuring exclusive comments as part of an interview your letter writer is conducting for a Benzinga article).
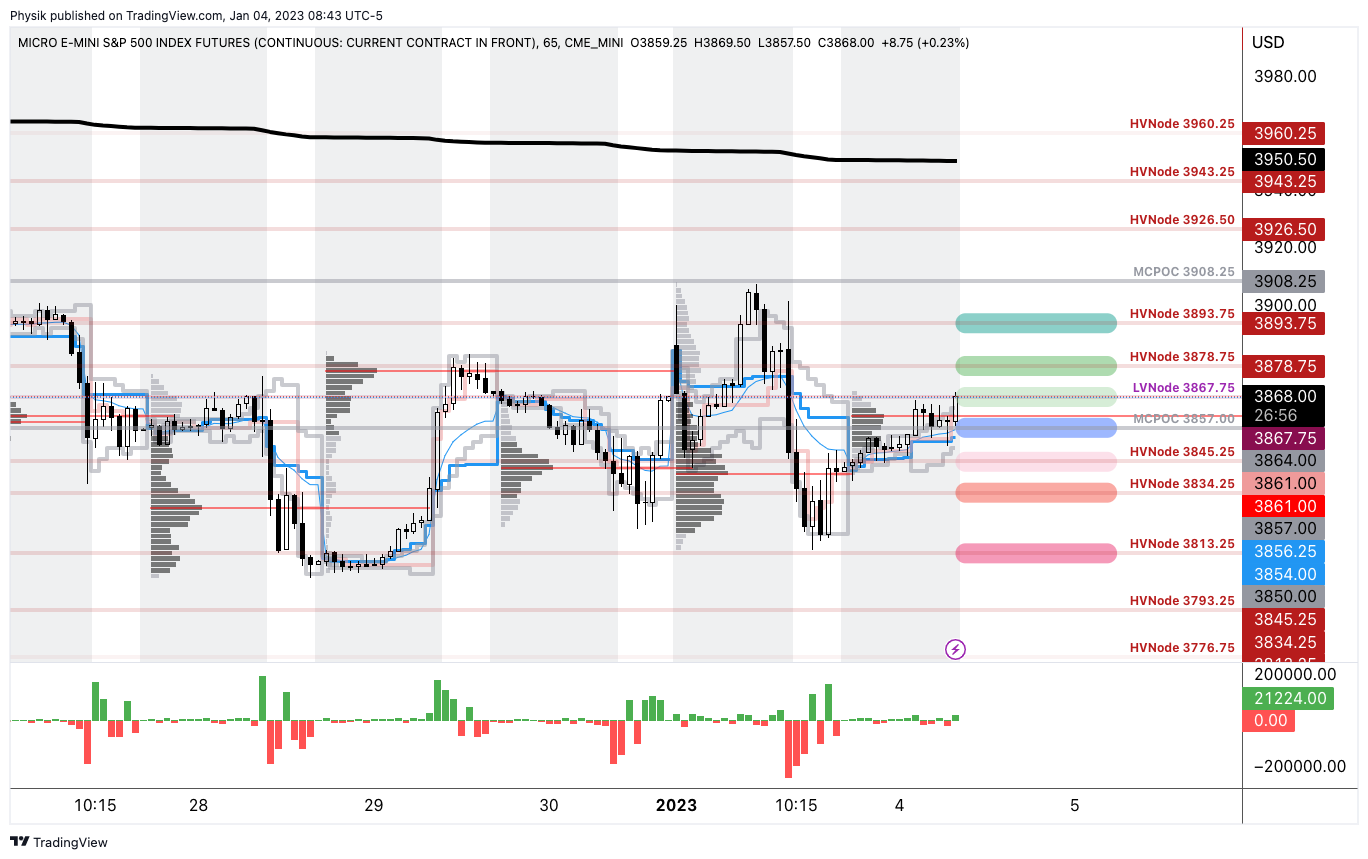
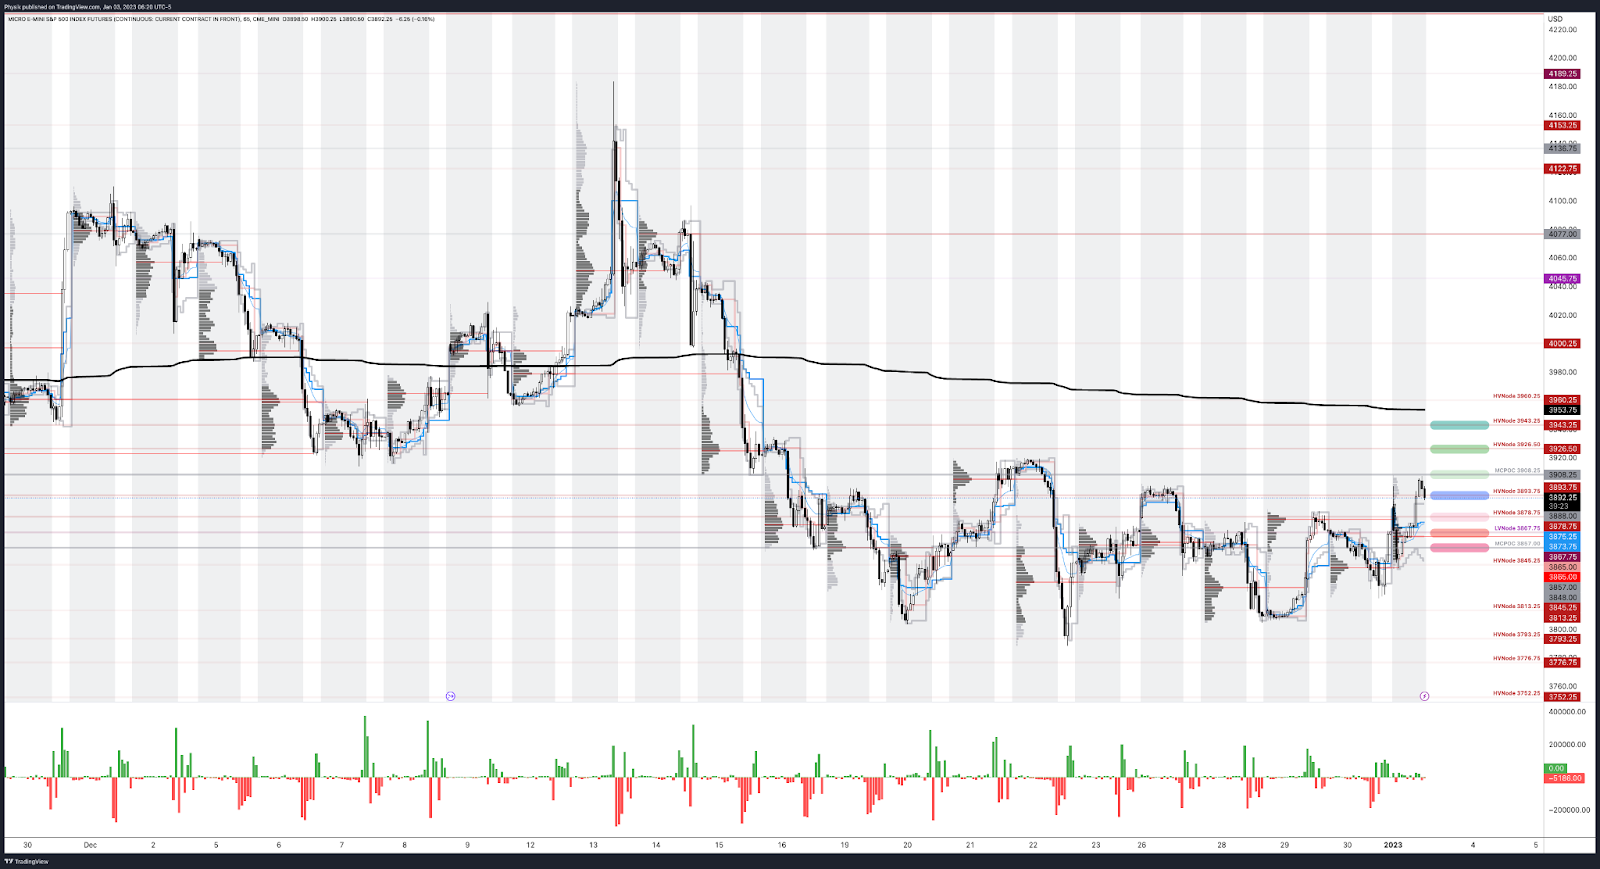
As of 6:30 AM ET, Tuesday’s regular session (9:30 AM – 4:00 PM ET), in the S&P 500, is likely to open in the upper part of a positively skewed overnight inventory, outside of prior-range and -value, suggesting a potential for immediate directional opportunity.
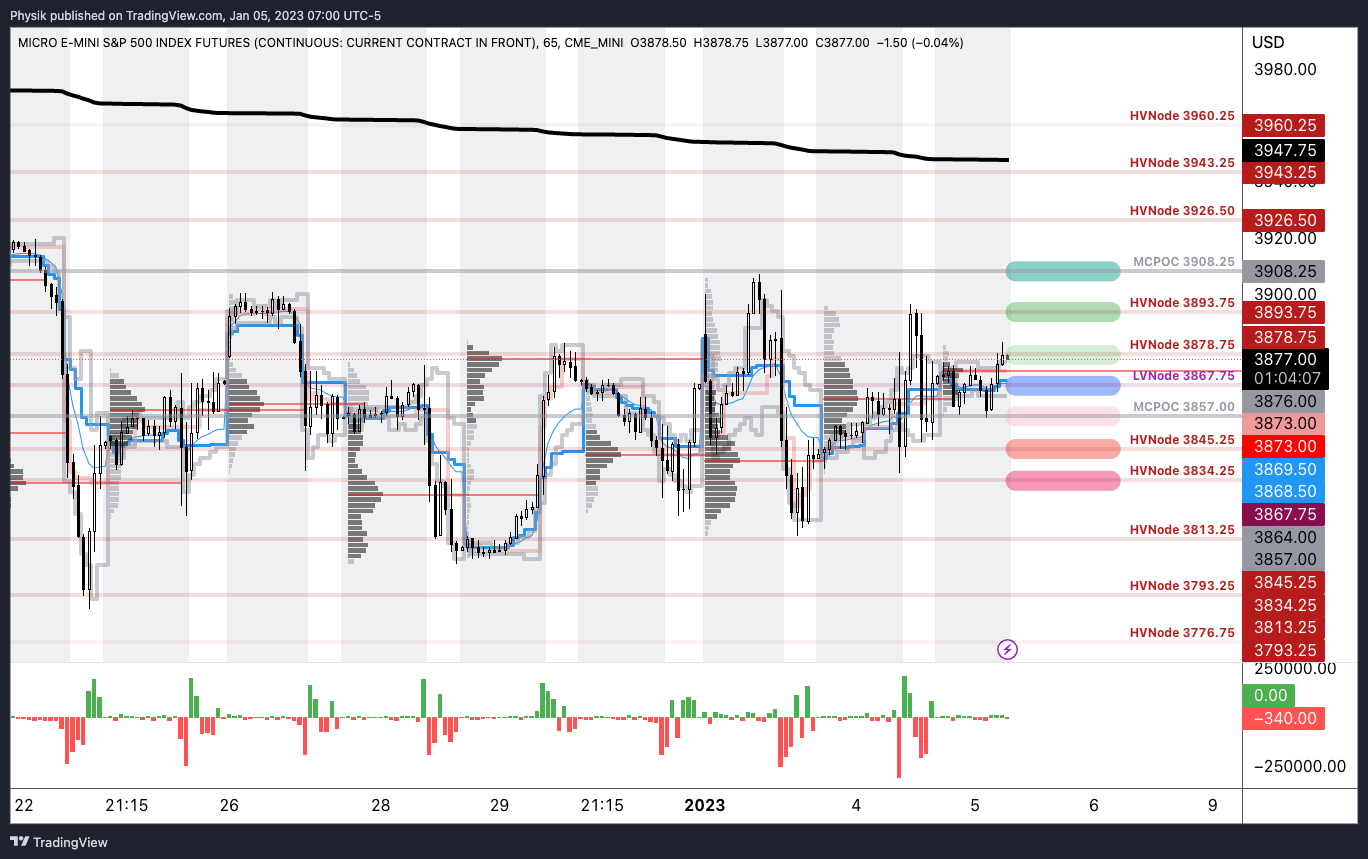
Our S&P 500 pivot for today is $3,893.75.
Key levels to the upside include $3,908.25, $3,926.50, and $3,943.25.
Key levels to the downside include $3,878.75, $3,867.75, and $3,857.00.
Click here to load today’s key levels into the web-based TradingView platform. All levels are derived using the 65-minute timeframe. New links are produced, daily.
Graphic: 65-minute profile chart of the Micro E-mini S&P 500 Futures.
Definitions
Volume Areas: Markets will build on areas of high-volume (HVNodes). Should the market trend for long periods of time, it will be identified by low-volume areas (LVNodes). LVNodes denote directional conviction and ought to offer support on any test.
If participants auction and find acceptance in an area of a prior LVNode, then future discovery ought to be volatile and quick as participants look to HVNodes for favorable entry or exit.
POCs: Denote areas where two-sided trade was most prevalent in a prior day session. Participants will respond to future tests of value as they offer favorable entry and exit.
MCPOCs: Denote areas where two-sided trade was most prevalent over numerous sessions. Participants will respond to future tests of value as they offer favorable entry and exit.
About
In short, an economics graduate working in finance and journalism.
Capelj spends most of his time as the founder of Physik Invest through which he invests and publishes daily analyses to subscribers, some of whom represent well-known institutions.
Separately, Capelj is an equity options analyst at SpotGamma and an accredited journalist interviewing global leaders in business, government, and finance.