
Physik Invest’s Daily Brief is read by thousands of subscribers. You, too, can join this community to learn about the fundamental and technical drivers of markets.
Administrative
Morning, everyone, and happy new year! Today’s letter will only provide updates to key levels. In the next few days, we will unpack the drivers of long-lasting inflation and end the week with some context on positioning (featuring exclusive comments as part of an interview your letter writer is conducting for a Benzinga article).
You can view the content calendar at this link.
Take care and watch your risk!
Technical
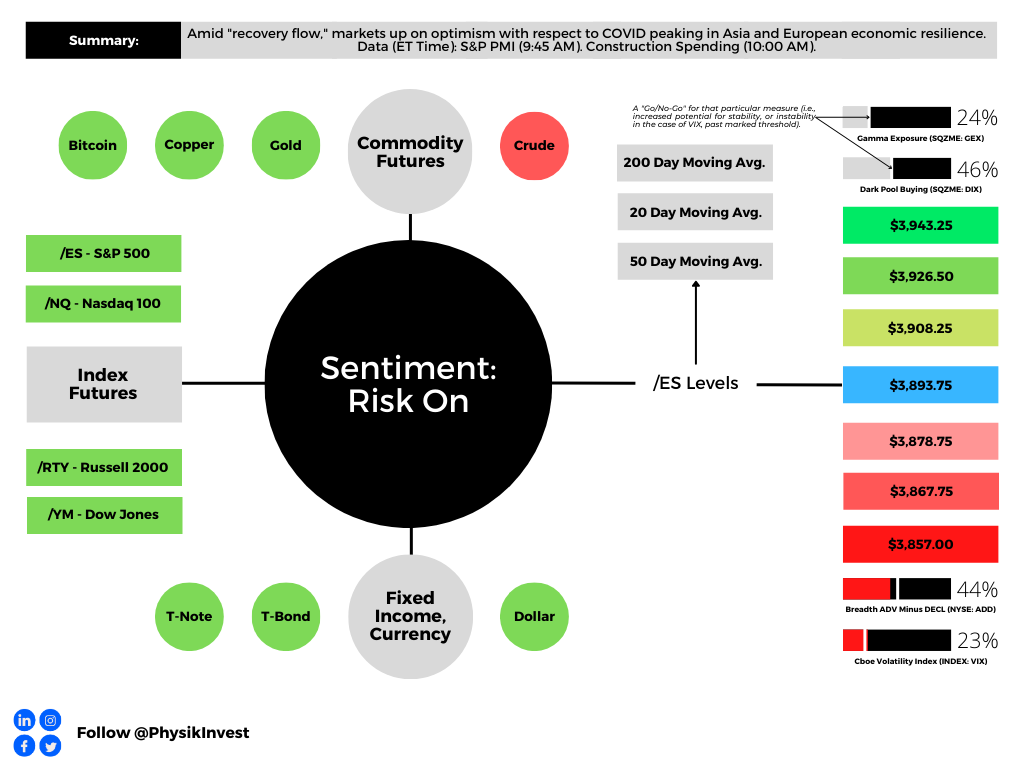
As of 6:30 AM ET, Tuesday’s regular session (9:30 AM – 4:00 PM ET), in the S&P 500, is likely to open in the upper part of a positively skewed overnight inventory, outside of prior-range and -value, suggesting a potential for immediate directional opportunity.
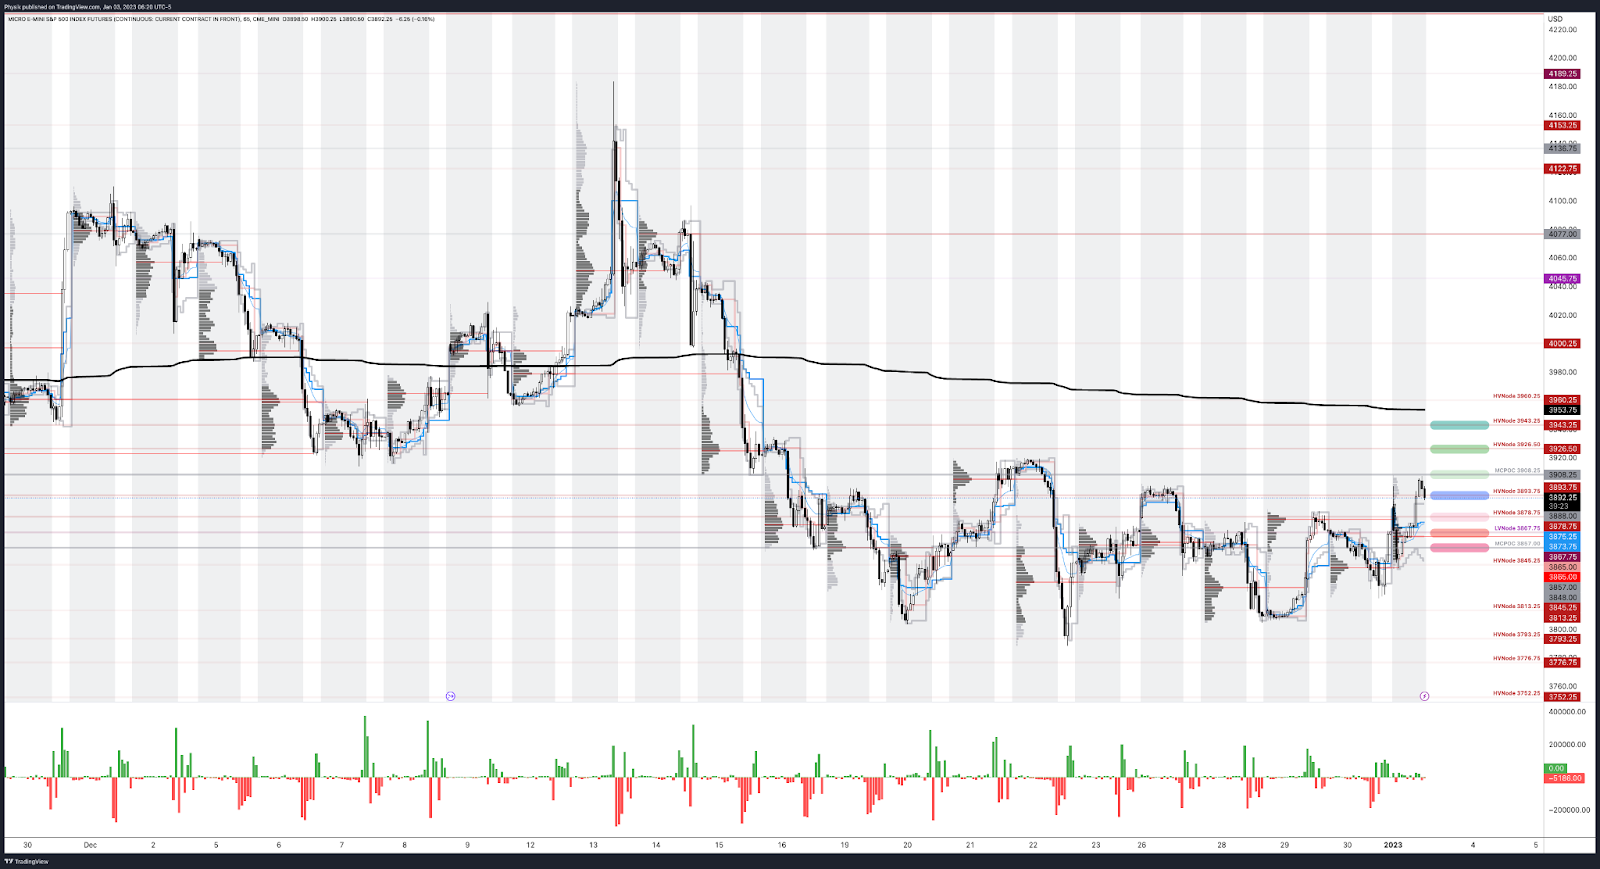
Our S&P 500 pivot for today is $3,893.75.
Key levels to the upside include $3,908.25, $3,926.50, and $3,943.25.
Key levels to the downside include $3,878.75, $3,867.75, and $3,857.00.
Click here to load today’s key levels into the web-based TradingView platform. All levels are derived using the 65-minute timeframe. New links are produced, daily.
Definitions
Volume Areas: Markets will build on areas of high-volume (HVNodes). Should the market trend for long periods of time, it will be identified by low-volume areas (LVNodes). LVNodes denote directional conviction and ought to offer support on any test.
If participants auction and find acceptance in an area of a prior LVNode, then future discovery ought to be volatile and quick as participants look to HVNodes for favorable entry or exit.
POCs: Denote areas where two-sided trade was most prevalent in a prior day session. Participants will respond to future tests of value as they offer favorable entry and exit.
MCPOCs: Denote areas where two-sided trade was most prevalent over numerous sessions. Participants will respond to future tests of value as they offer favorable entry and exit.
About
In short, an economics graduate working in finance and journalism.
Capelj spends most of his time as the founder of Physik Invest through which he invests and publishes daily analyses to subscribers, some of whom represent well-known institutions.
Separately, Capelj is an equity options analyst at SpotGamma and an accredited journalist interviewing global leaders in business, government, and finance.
Past works include conversations with investor Kevin O’Leary, ARK Invest’s Catherine Wood, FTX’s Sam Bankman-Fried, Lithuania’s Minister of Economy and Innovation Aušrinė Armonaitė, former Cisco chairman and CEO John Chambers, and persons at the Clinton Global Initiative.
Contact
Direct queries to renato@physikinvest.com or Renato Capelj#8625 on Discord.
Calendar
You may view this letter’s content calendar at this link.
Disclaimer
Do not construe this newsletter as advice. All content is for informational purposes.


