Market Commentary
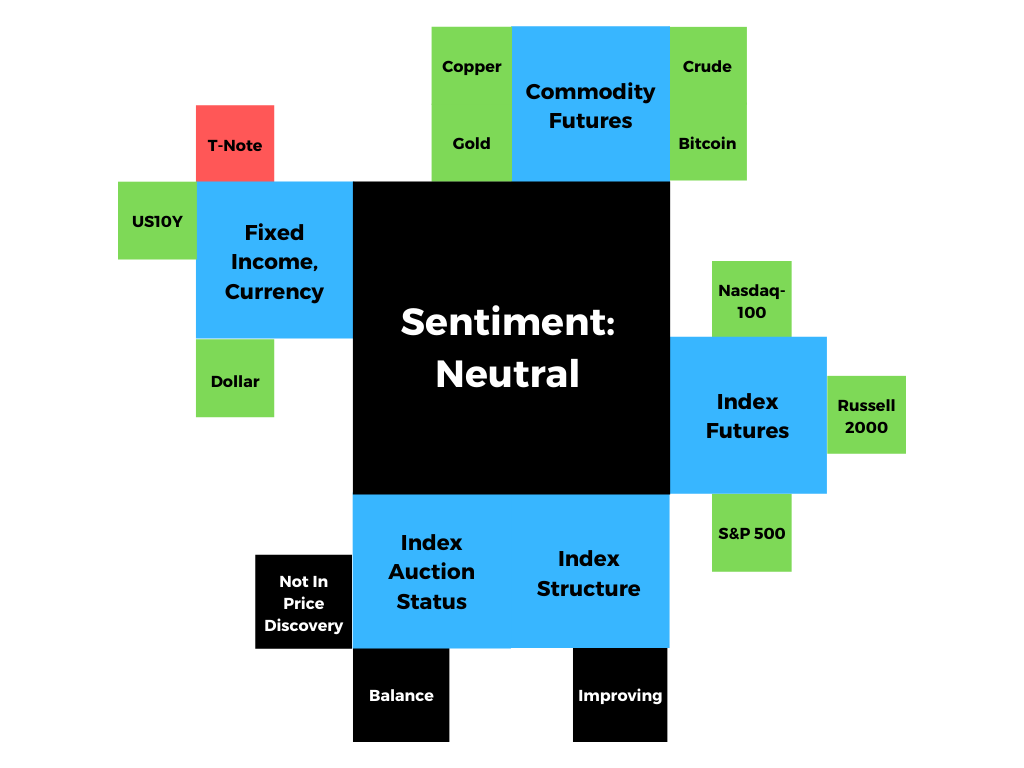
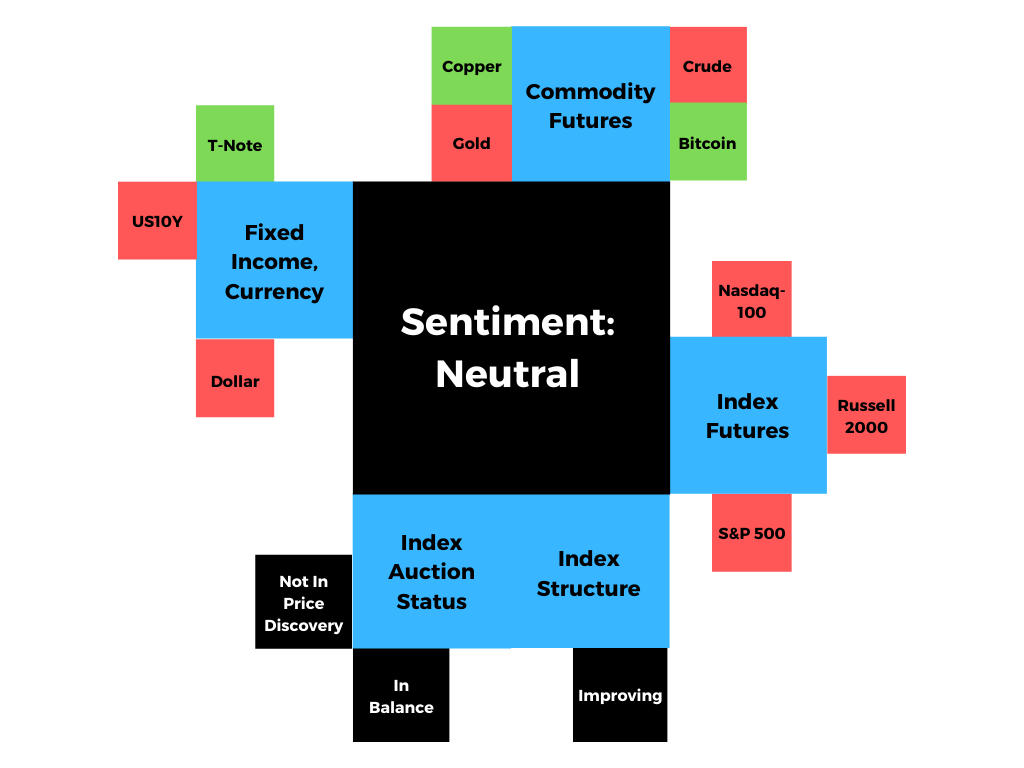
Index futures in balance.
What Happened: U.S. stock index futures auctioned within prior-range, overnight, ahead of fundamental releases such as the Philadelphia Fed Business Outlook and claims data.
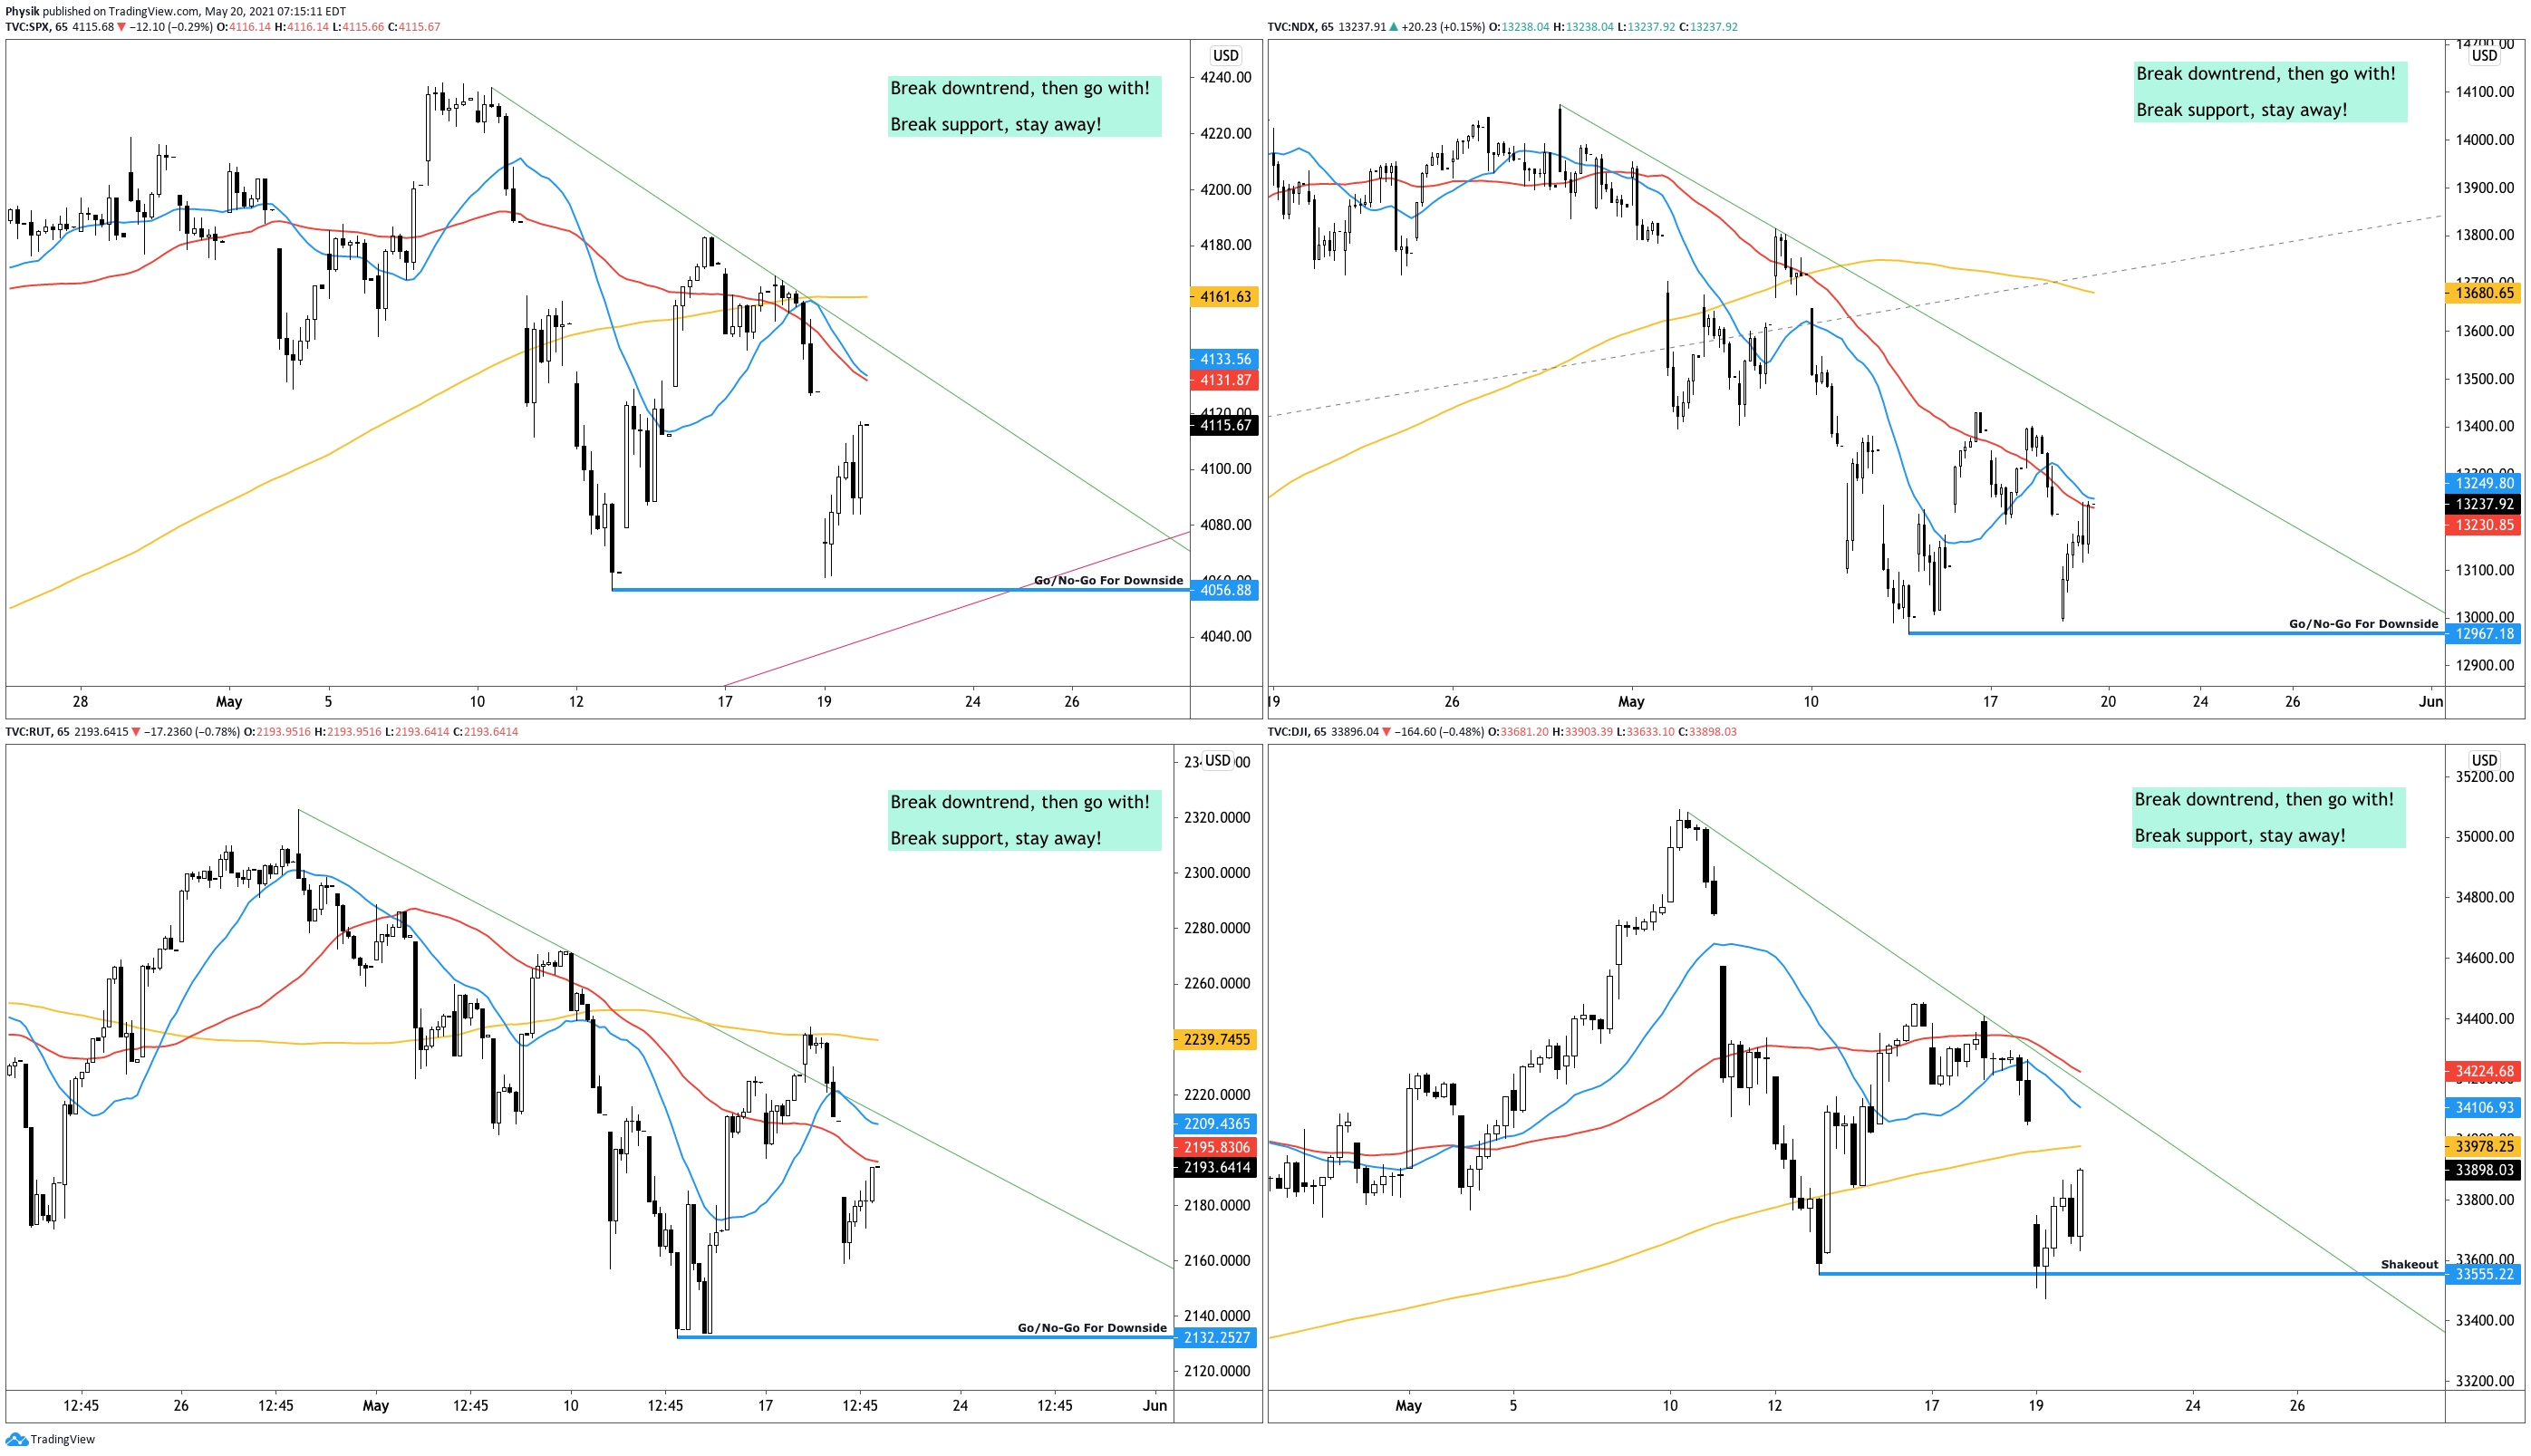
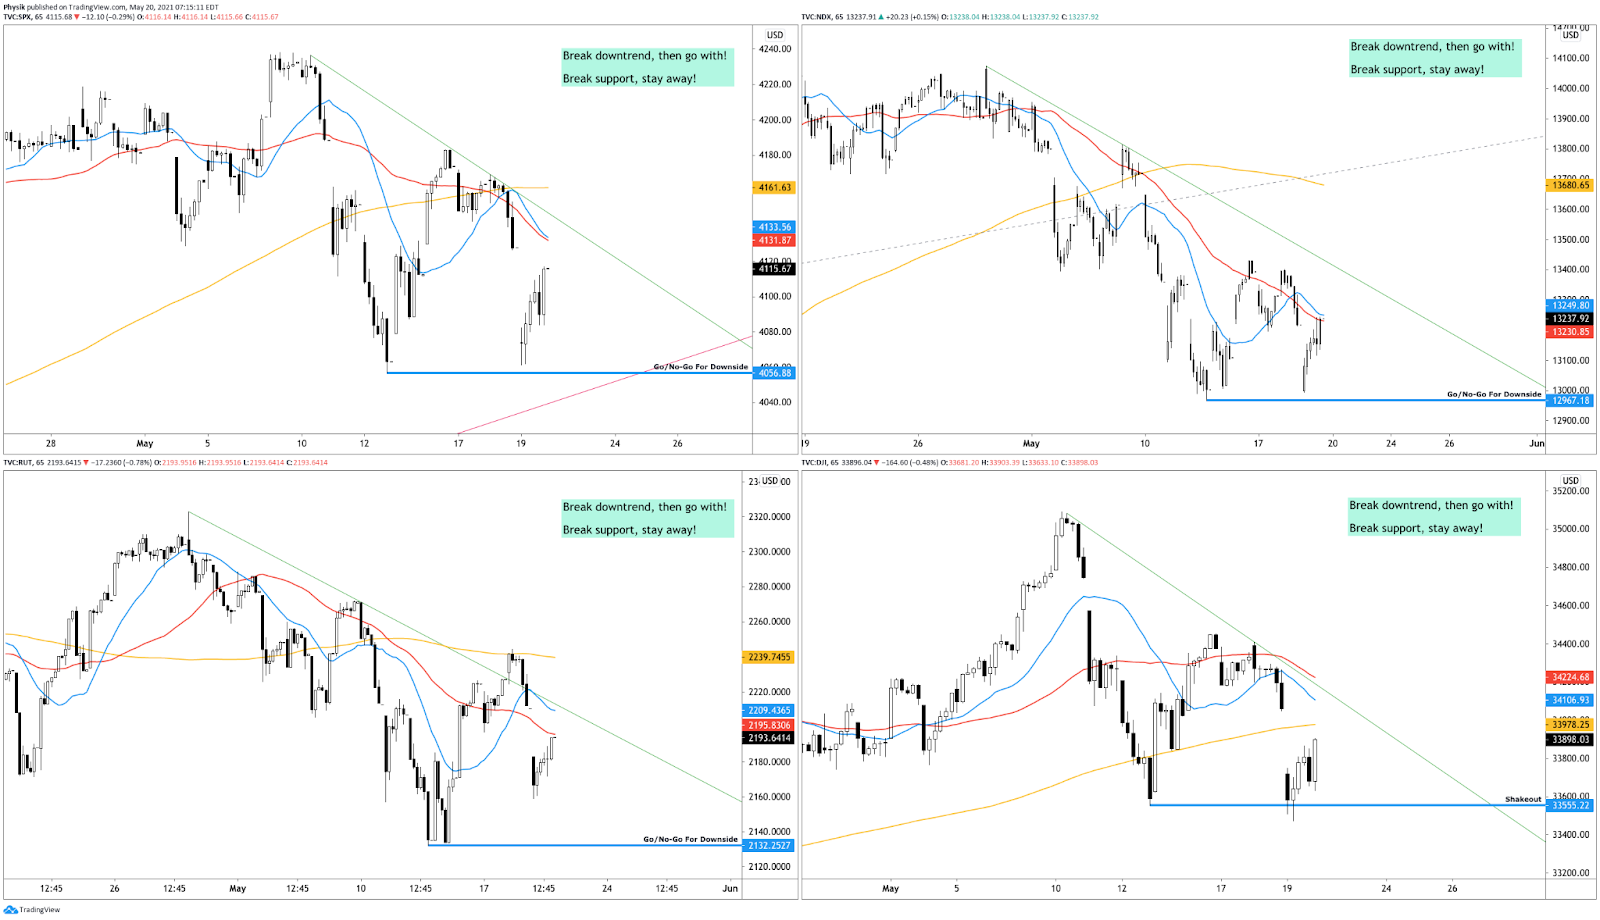
What To Expect: Thursday’s regular session (9:30 AM – 4:00 PM EST) in the S&P 500 will likely open inside of prior-range and -value, suggesting a limited potential for immediate directional opportunity.
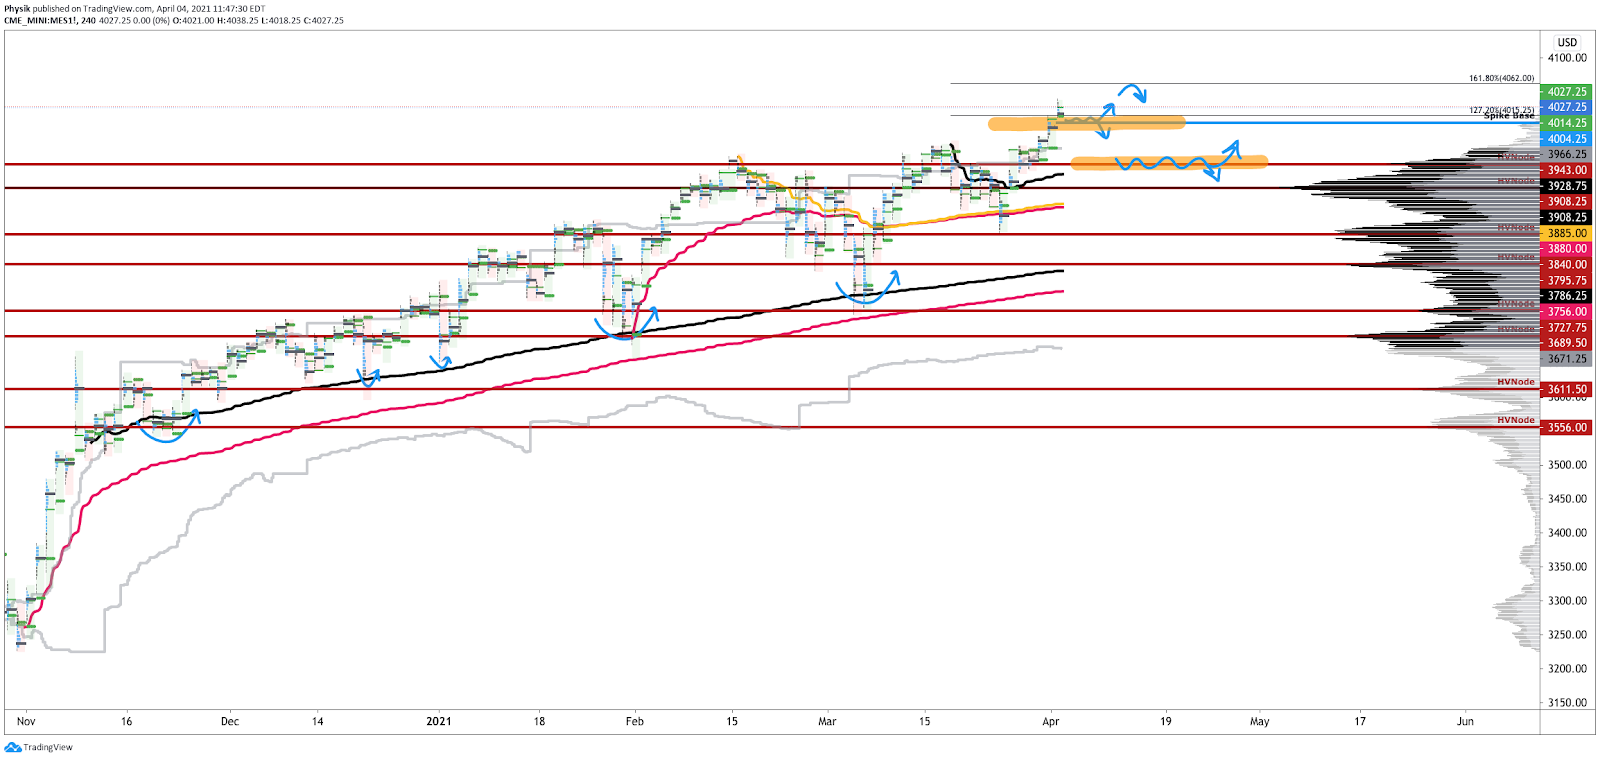
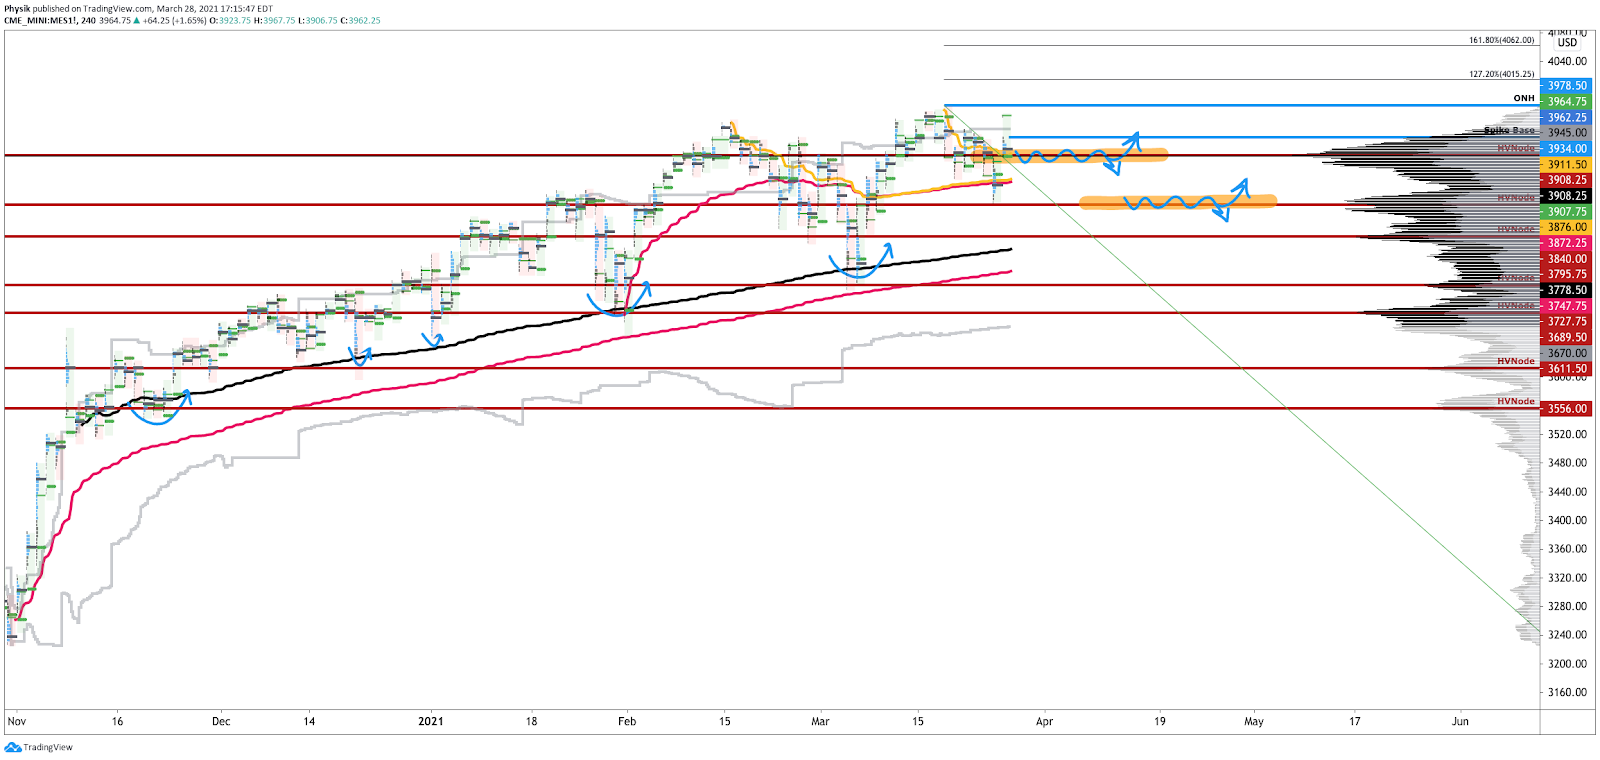
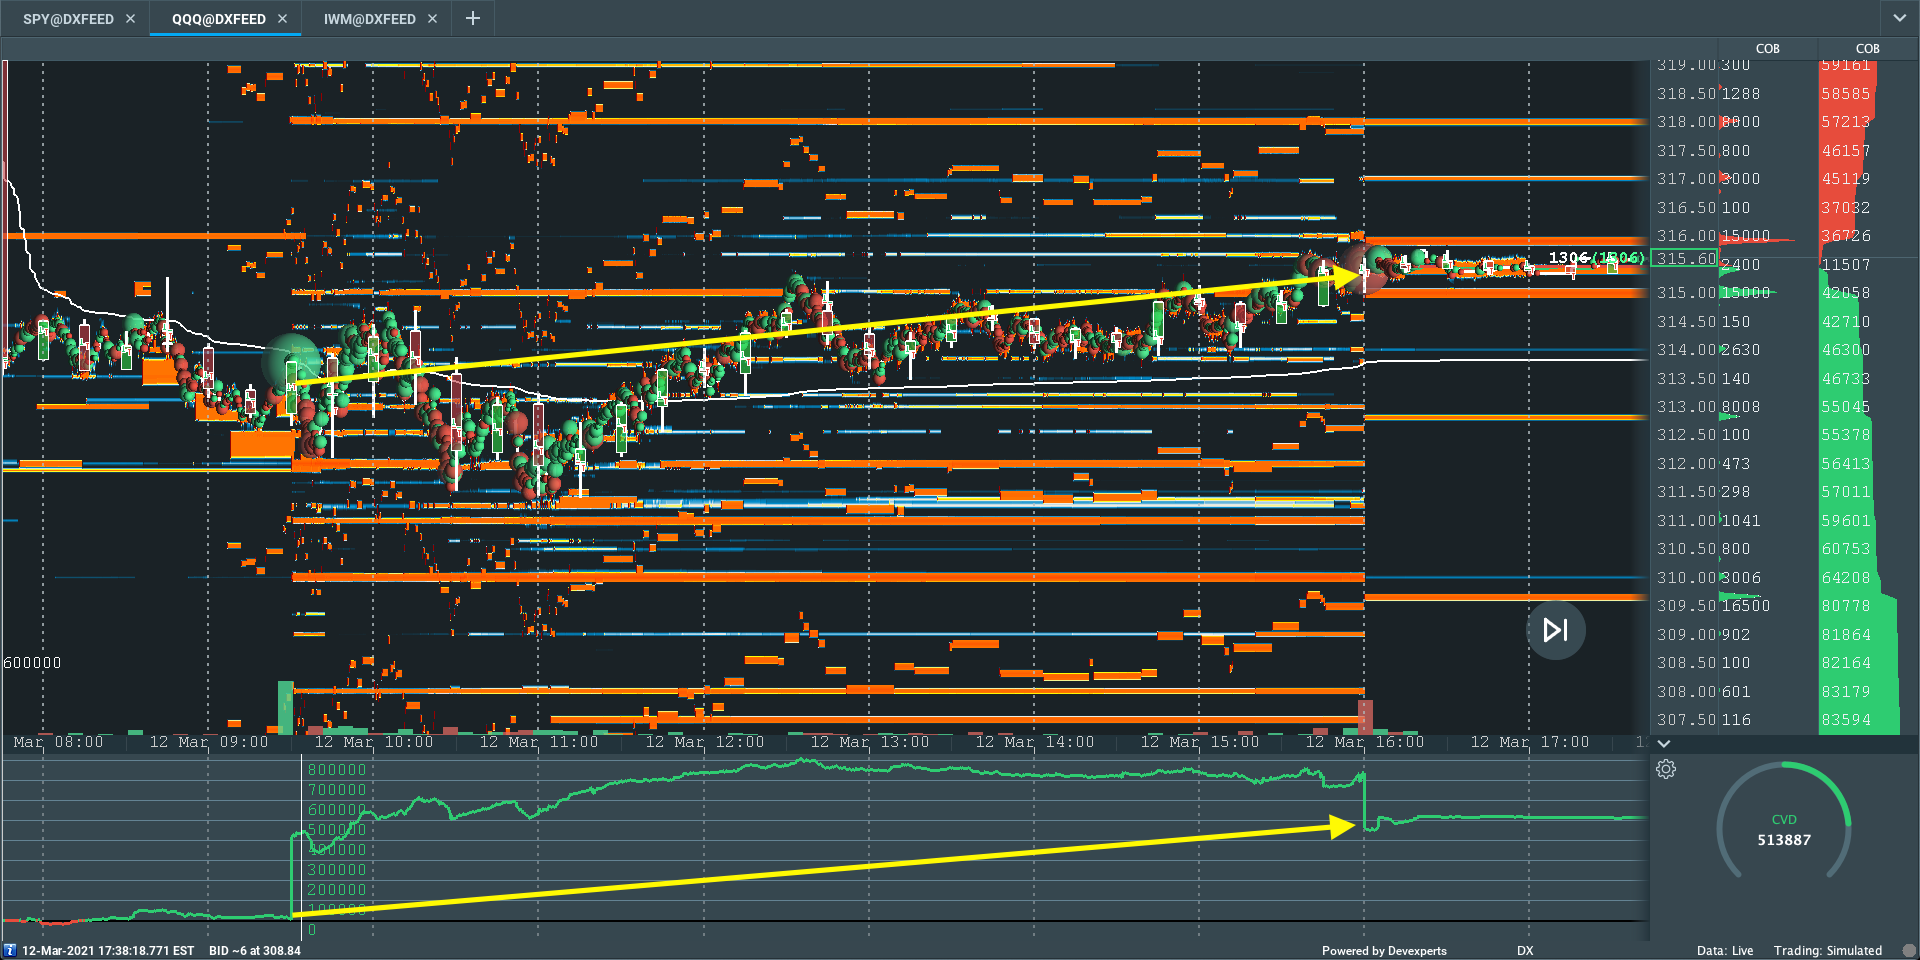
Adding, during the prior day’s regular trade, the best case outcome occurred, evidenced by responsive trade above the $4,069.25 high volume area (HVNode), which is significant because that value marked the other end of a micro-composite low volume area.
Volume Areas: A structurally sound market will build on past areas of high volume. Should the market trend for long periods of time, it will lack sound structure (identified as a low volume area which denotes directional conviction and ought to offer support on any test).

If participants were to auction and find acceptance into areas of prior low volume, then future discovery ought to be volatile and quick as participants look to areas of high volume for favorable entry or exit.

Responsive Buying (Selling): Buying (selling) in response to prices below (above) area of recent price acceptance.
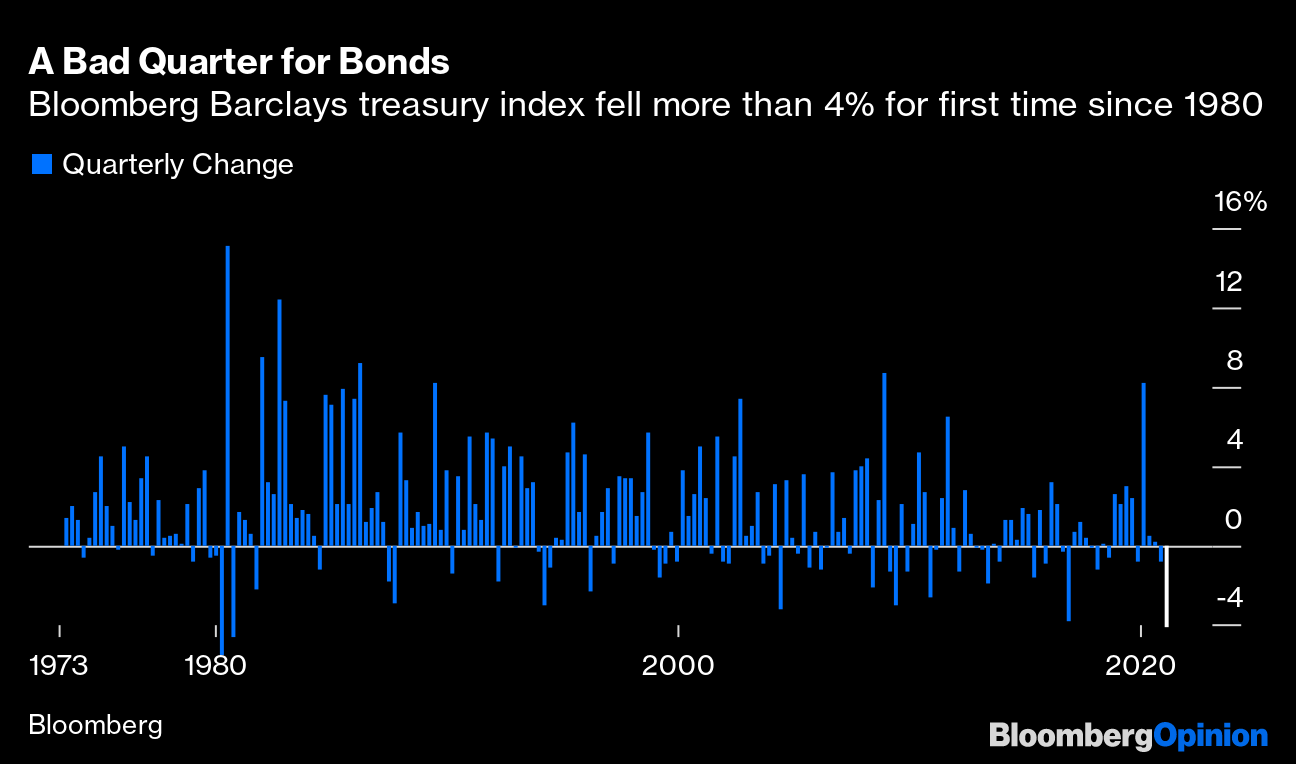
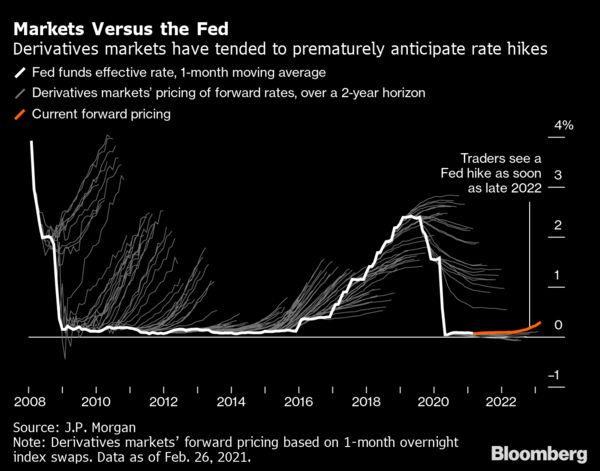
Further, this activity is happening in the context of concerns over rising inflation, which may prompt monetary authorities to ease back on stimulus. Yesterday, the Federal Reserve’s minutes showed that some on the committee were interested in tapering discussions.
“It was a surprise to hear the talk about Fed tapering,” Joyce Chang, JPMorgan’s chair of global research, said. “The market had been thinking there might be a couple of months before you really saw this particular issue come into focus.”
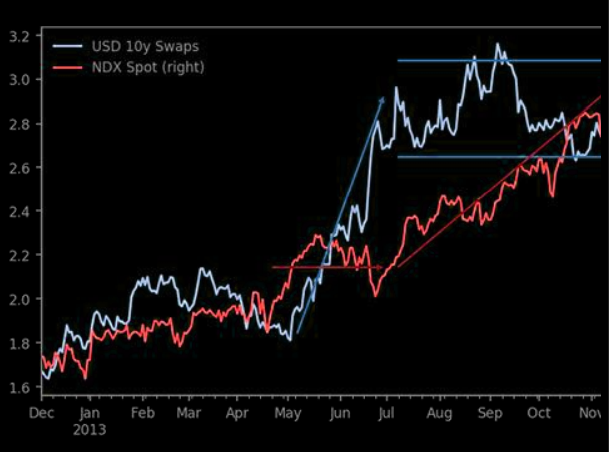
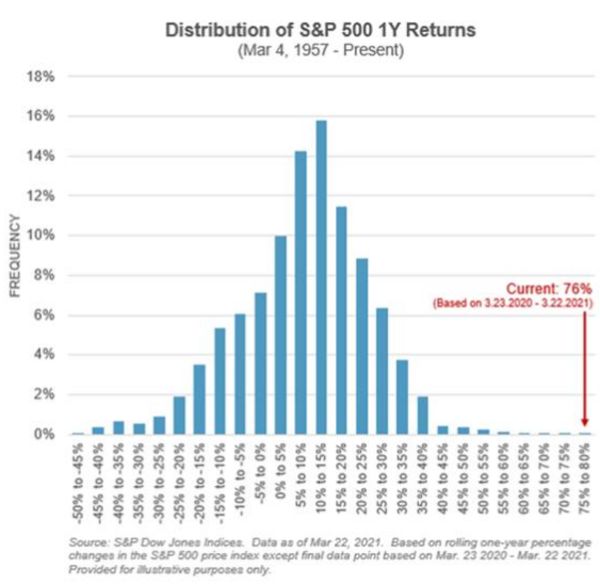
Why is this – inflation – a concern? Generally speaking, inflation and rates move inverse to each other. Low rates stimulate demand for loans (i.e., borrowing money more attractive). With the rapid recovery, though, market participants fear that rates will rise to protect the economy from overheating.
Higher rates have the potential to reduce the present value of future earnings, making stocks, especially those that are high growth, less attractive. To note, however, rates are still rangebound; rates on the 10 Year T-Note sit below their March high and are likely to continue higher, which the market will likely absorb.
For today, beyond fundamental context, participants can trade from the following frameworks.
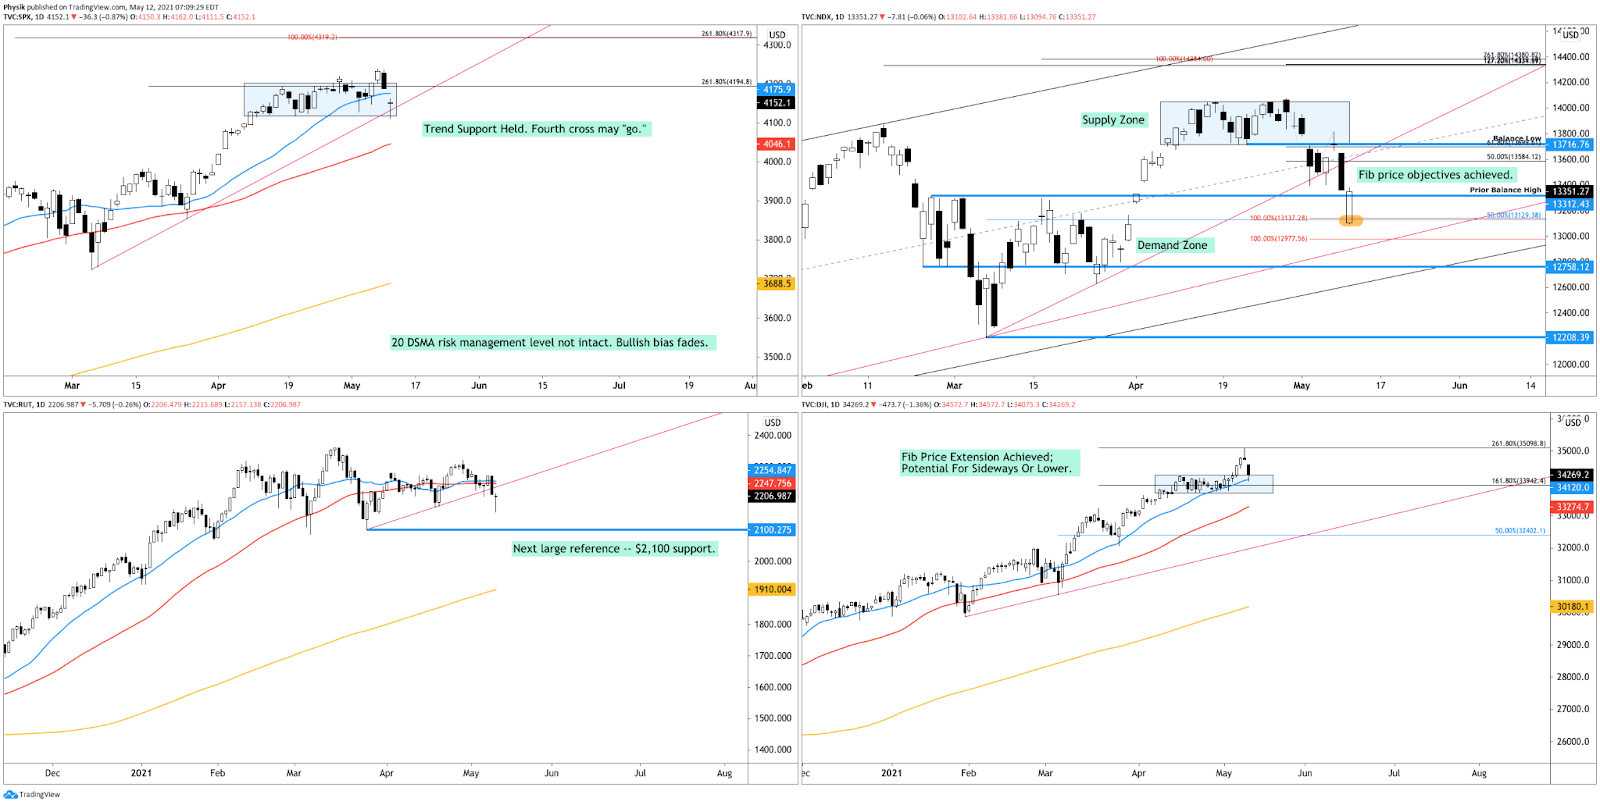
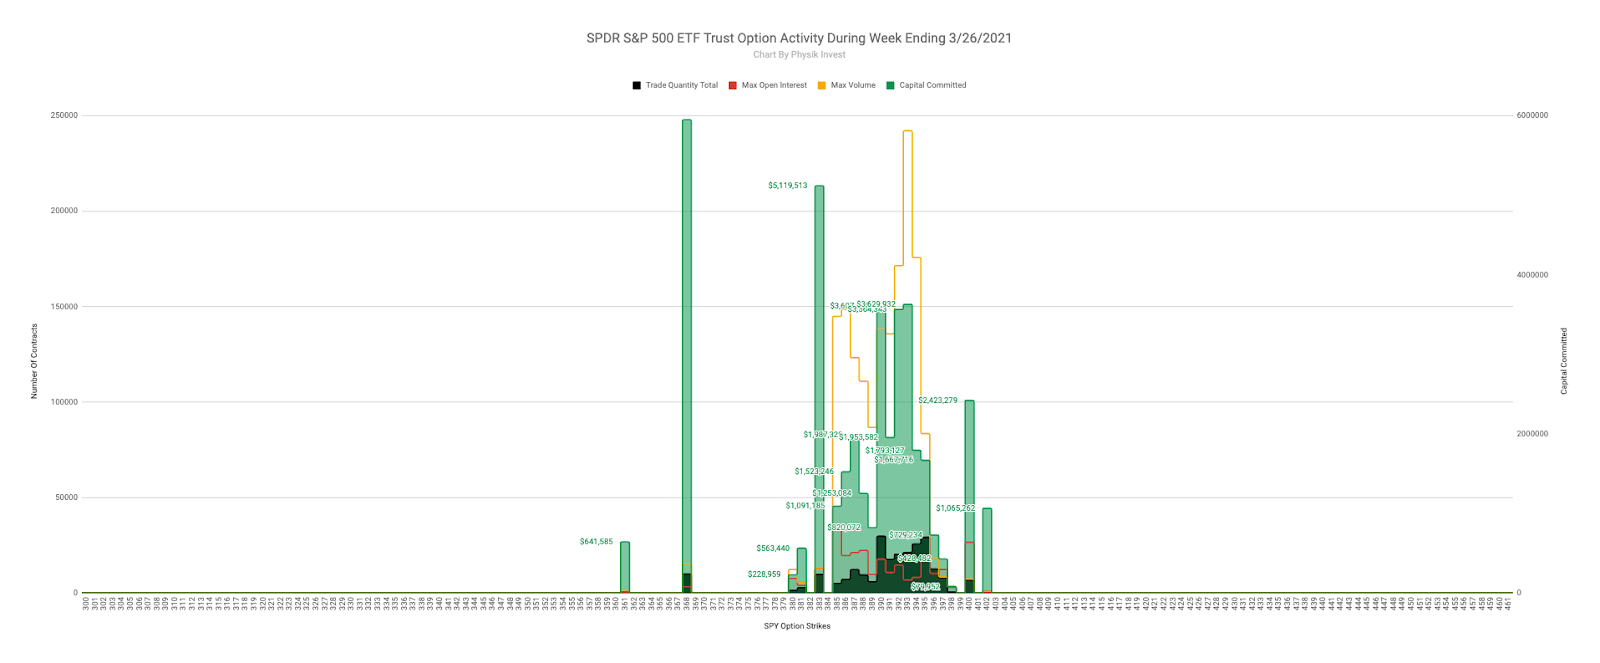
In the best case, the S&P 500 trades sideways or higher; activity above the $4,104.75 low volume area (LVNode) has the potential to reach up to the $4,122.25 HVNode. Initiative trade beyond the $4,122.25 HVNode could reach as high as the $4,134.00 spike base (a pivot on the composite profile; above = bullish, below = neutral-to-bearish).
Spikes: Spike’s mark the beginning of a break from value. Spikes higher (lower) are validated by trade at or above (below) the spike base (i.e., the origin of the spike).
In the worst case, the S&P 500 trades lower; activity below the $4,069.25 HVNode targets a repair of the minimal excess low at $4,055.75. Thereafter, on a failed response, prices may continue lower, below the $4,050.75 LVNode boundary. In such a situation, caution longs. The potential exists to trade to the POCs at $4,015.00 and $4,001.00, if not even lower.
POCs: POCs (like HVNodes described above) are valuable as they denote areas where two-sided trade was most prevalent. Participants will respond to future tests of value as they offer favorable entry and exit.

Excess: A proper end to price discovery; the market travels too far while advertising prices. Responsive, other-timeframe (OTF) participants aggressively enter the market, leaving tails or gaps which denote unfair prices.

News And Analysis
Recovery | New COVID-19 coronavirus cases fell by 20% in the last week. (Axios)
Economy | Central bank taper timelines are now starting to come into focus. (Axios)
Recovery | Vaccine boosters could be necessary as soon as September. (Axios)
Technology | Cisco says shortages will disrupt supply chains for rest of year. (FT)
Economy | Recovery funds increase investment but long-term gains uncertain. (Moody’s)
Energy | China’s industrial commodities slide after warning of crackdowns. (REU)
Travel | The U.S. is weighing changes to pandemic air travel restrictions. (REU)
Economy | Refinance volumes increase for the second week despite rate bump. (MND)
Economy | Inflation surveys, market pricing consistent with what Fed wants. (Barrons)
What People Are Saying
Innovation And Emerging Trends
FinTech | New digitial exchange offers gold exposure and funding for miners. (REU)
Crypto | Sh*t coin billionaire: tales from the fringe of the cryptocurrency craze. (BBG)
Crypto | China deepens its fintech dominance with new digital currency. (Diplomat)
Crypto | Central bank digital currencies could disrupt financial systems. (Fitch)
FinTech | OCC chief signals new direction on bank supervision and fintech. (AB)
FinTech | Stripe betting on creator economy powered by likes of Clubhouse. (BI)
About
Renato founded Physik Invest after going through years of self-education, strategy development, and trial-and-error. His work reporting in the finance and technology space, interviewing leaders such as John Chambers, founder, and CEO, JC2 Ventures, Kevin O’Leary, businessman and Shark Tank host, Catherine Wood, CEO and CIO, ARK Invest, among others, afforded him the perspective and know-how very few come by.
Having worked in engineering and majored in economics, Renato is very detailed and analytical. His approach to the markets isn’t built on hope or guessing. Instead, he leverages the unique dynamics of time and volatility to efficiently act on opportunity.
Disclaimer
At this time, Physik Invest does not manage outside capital and is not licensed. In no way should the materials herein be construed as advice. Derivatives carry a substantial risk of loss. All content is for informational purposes only.