Market Commentary
Equity index futures trade higher as volatility implodes. Yields, commodities are higher, too.
- President Biden played down inflation.
- Ahead: Claims, home sales, earnings.
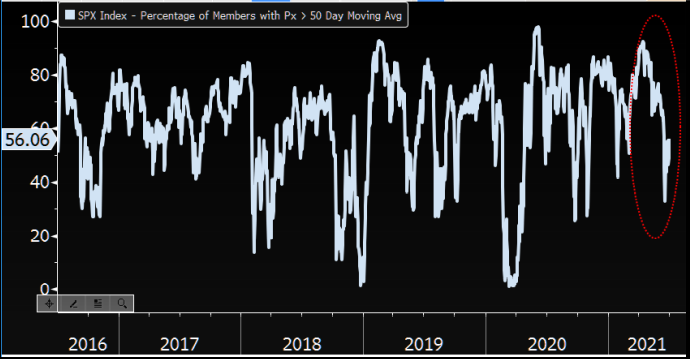
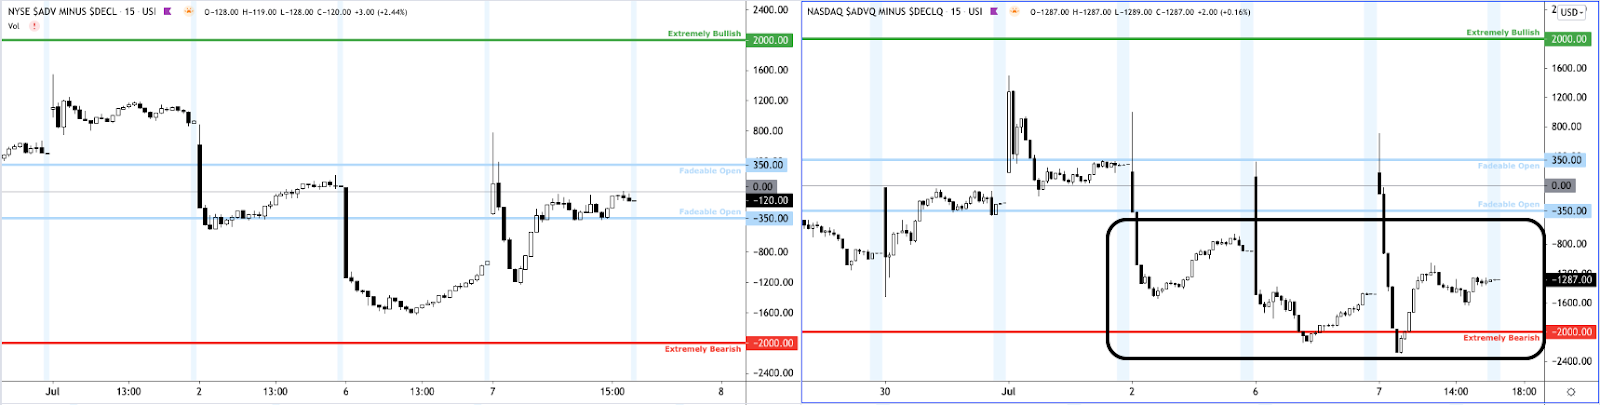
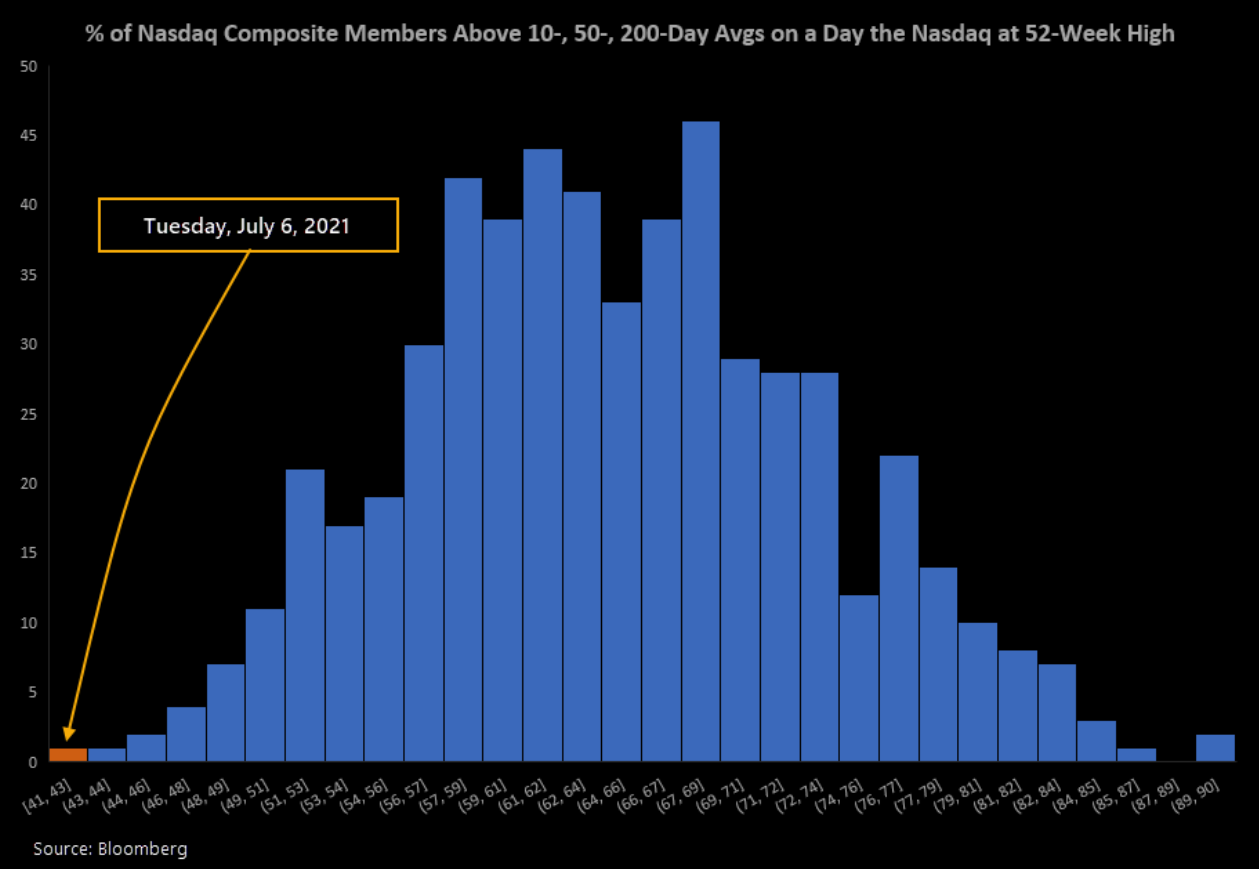
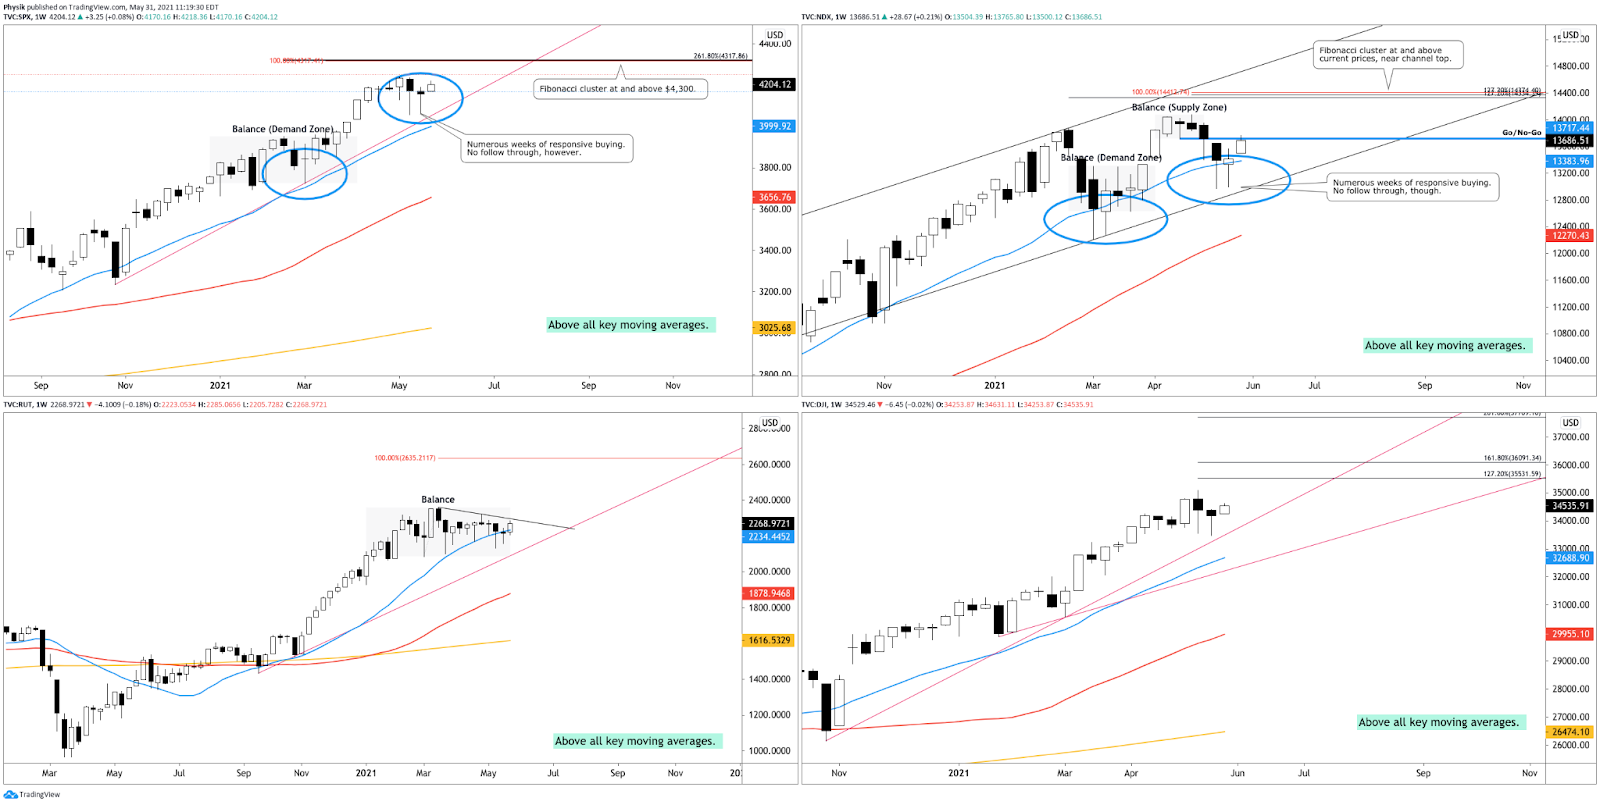
- Equity indices up on fantastic breadth.
What Happened: U.S. stock index futures auctioned higher alongside comments against inflation by President Joe Biden, yesterday. Virus fears ebbed as infections accelerated.
Bitcoin extended its advance after Elon Musk, Catherine Wood, and Jack Dorsey talked cryptocurrency at a virtual event.
Ahead is data on weekly jobless claims, existing home sales, and corporate earnings.
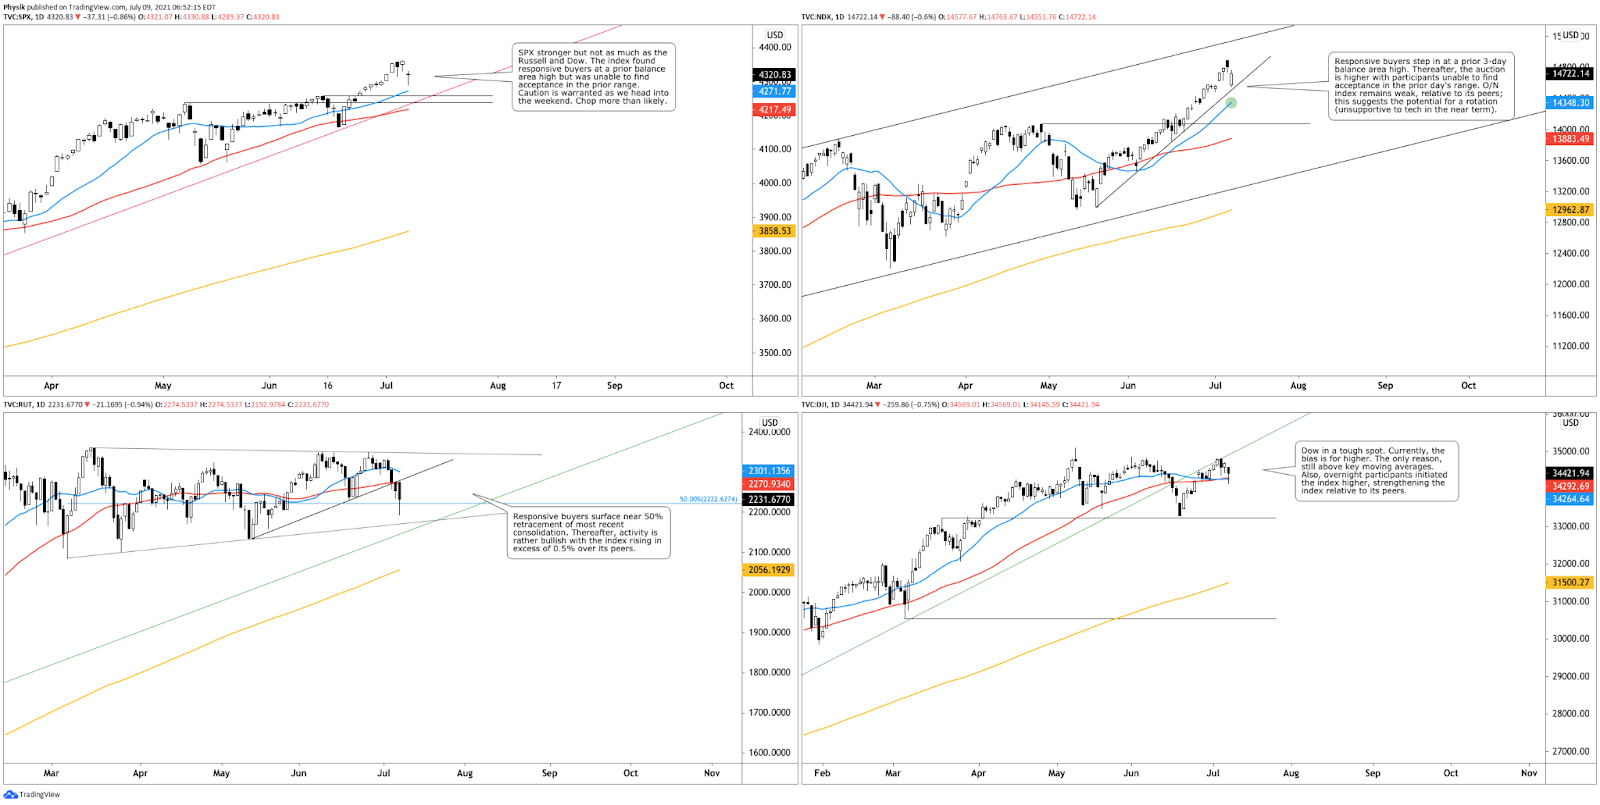
What To Expect: As of 6:30 AM ET, Thursday’s regular session (9:30 AM – 4:00 PM EST) in the S&P 500 will likely open on a small gap, just outside of prior-range and -value, suggesting a potential for immediate directional opportunity.
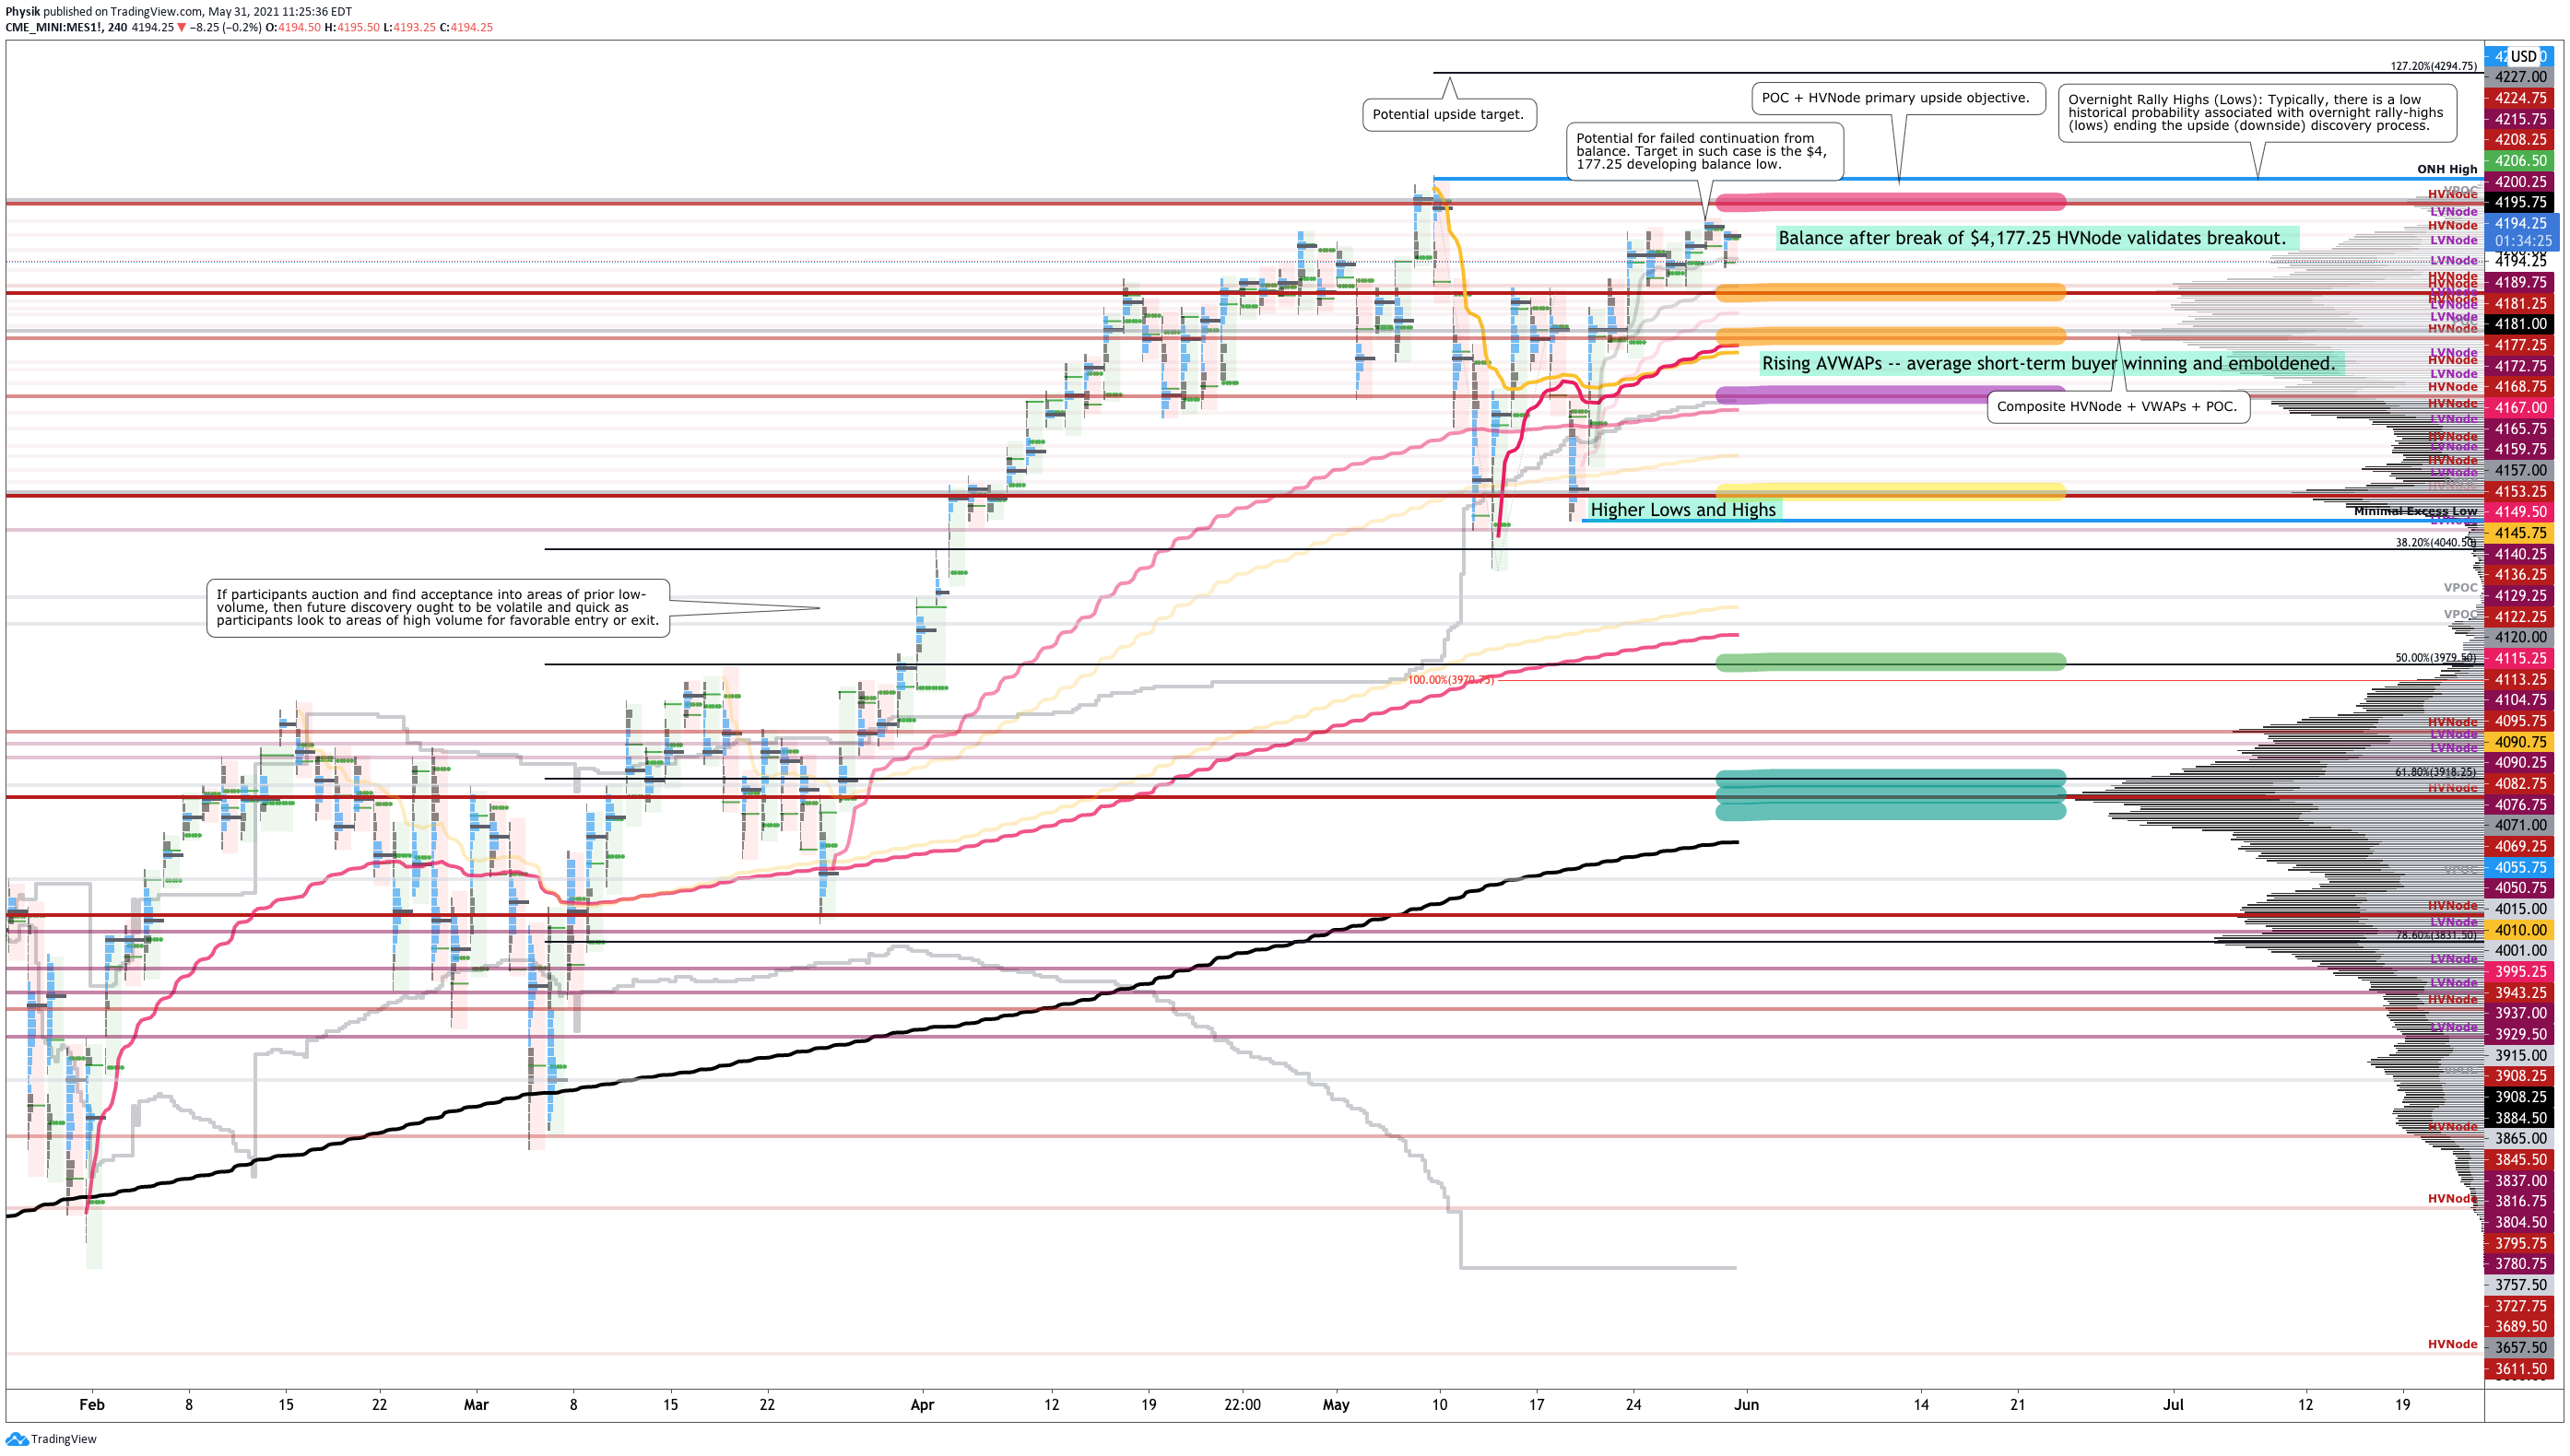
Balance-Break and/or Gap Scenarios: Monitor for acceptance (i.e., more than 1-hour of trade) outside of the balance area.

Gaps ought to fill quickly. Should they not, that’s a signal of strength; do not fade. Leaving value behind on a gap-fill or failing to fill a gap (i.e., remaining outside of the prior session’s range) is a go-with indicator.

Auctioning and spending at least 1-hour of trade back in the prior range suggests a lack of conviction; in such a case, do not follow the direction of the most recent initiative activity.
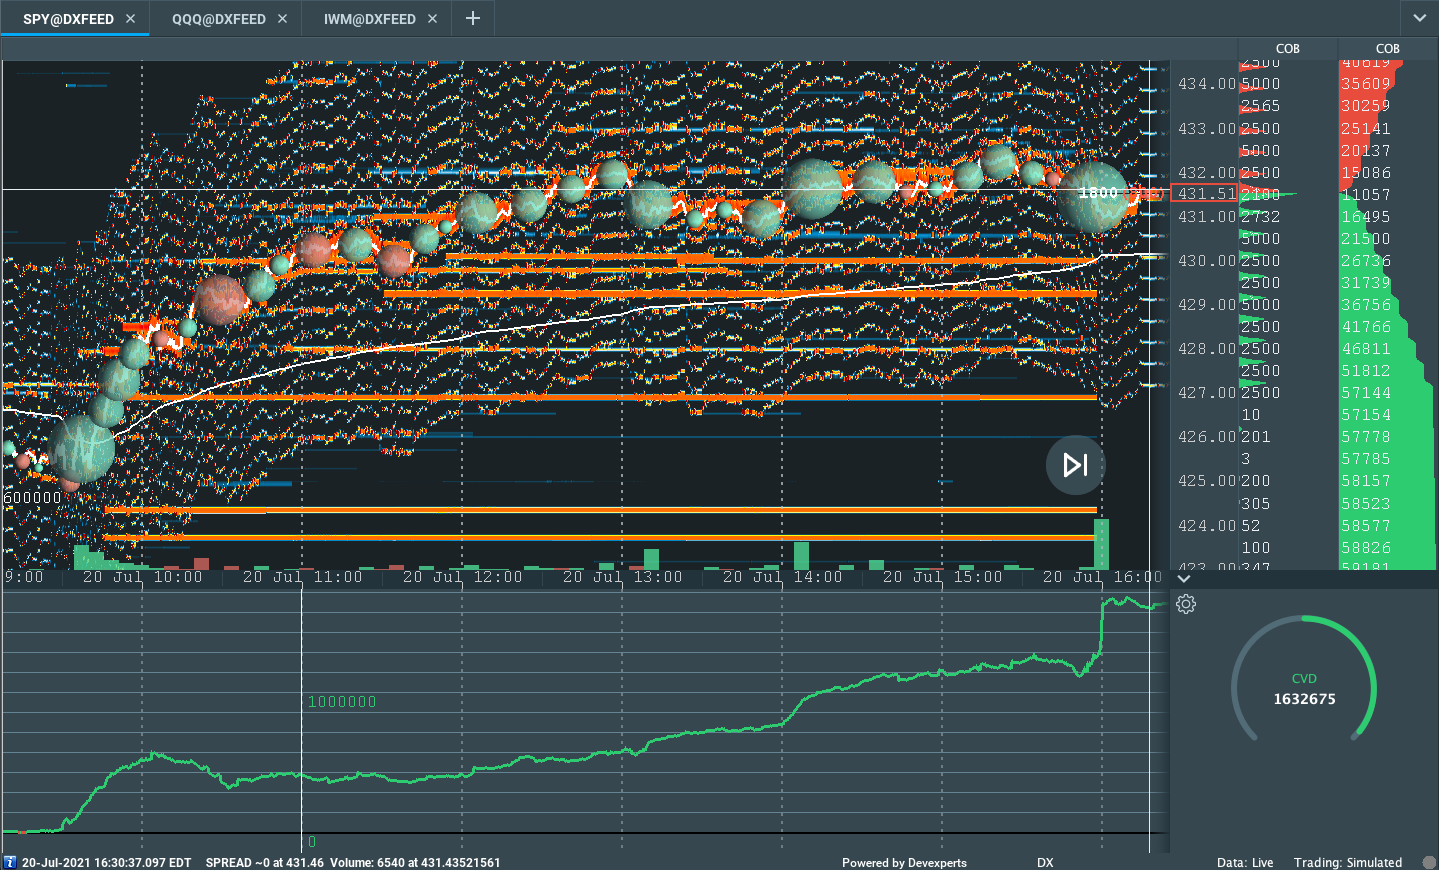
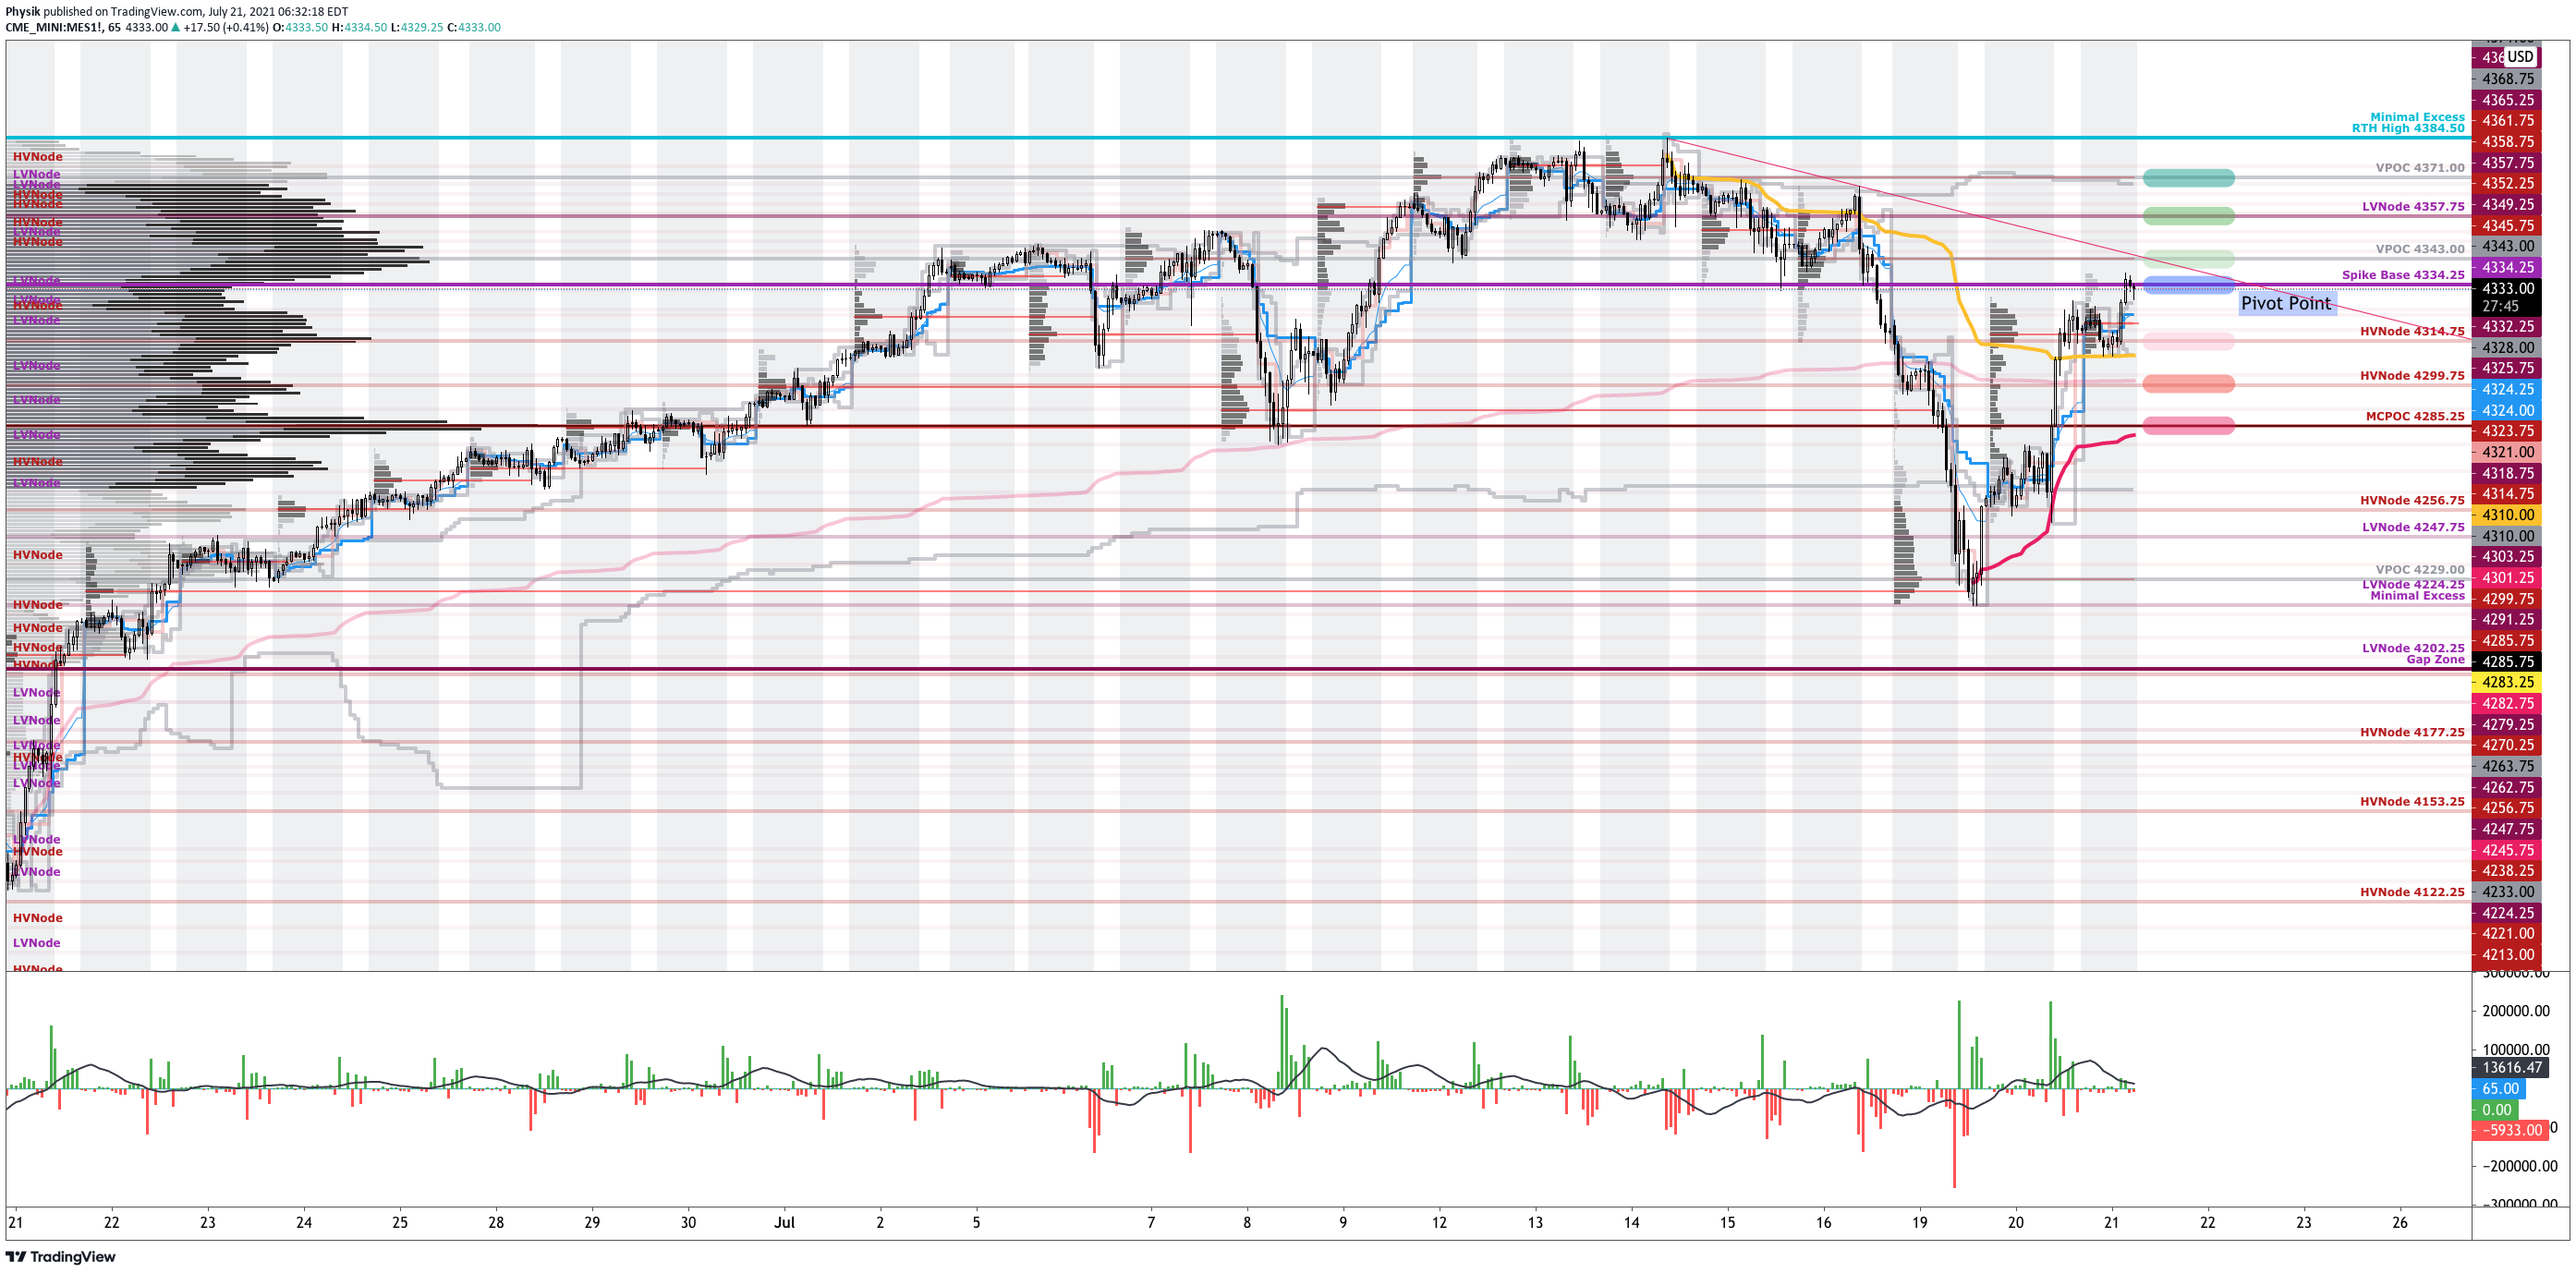
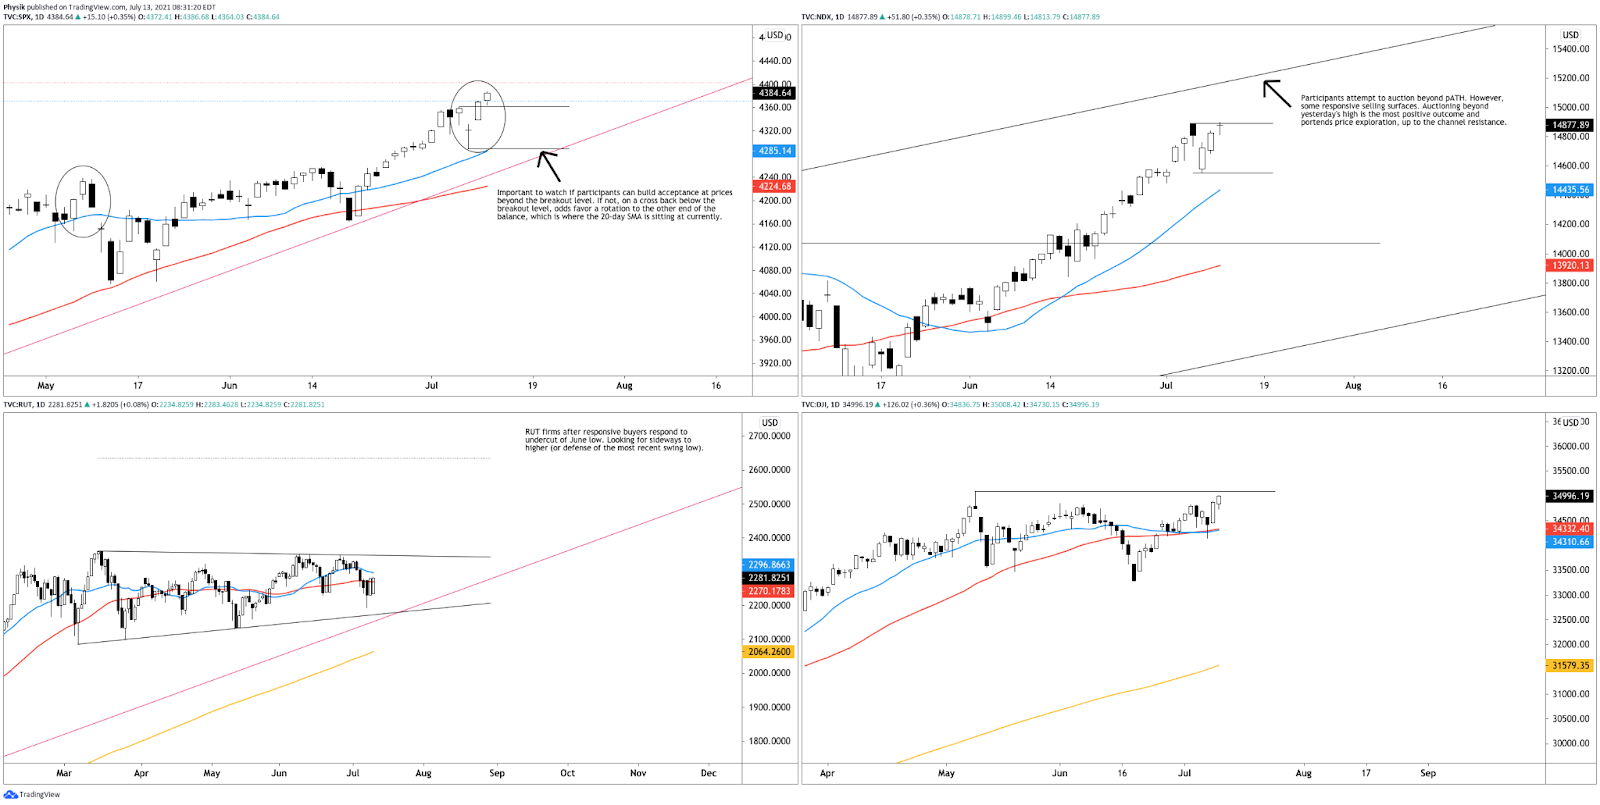
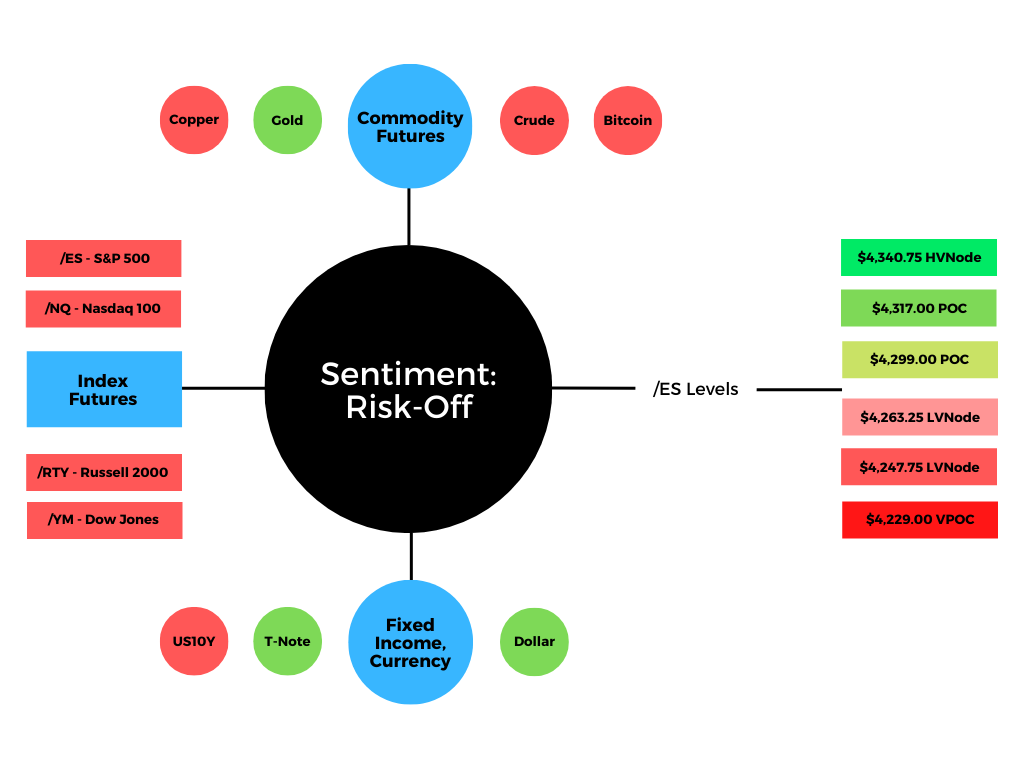
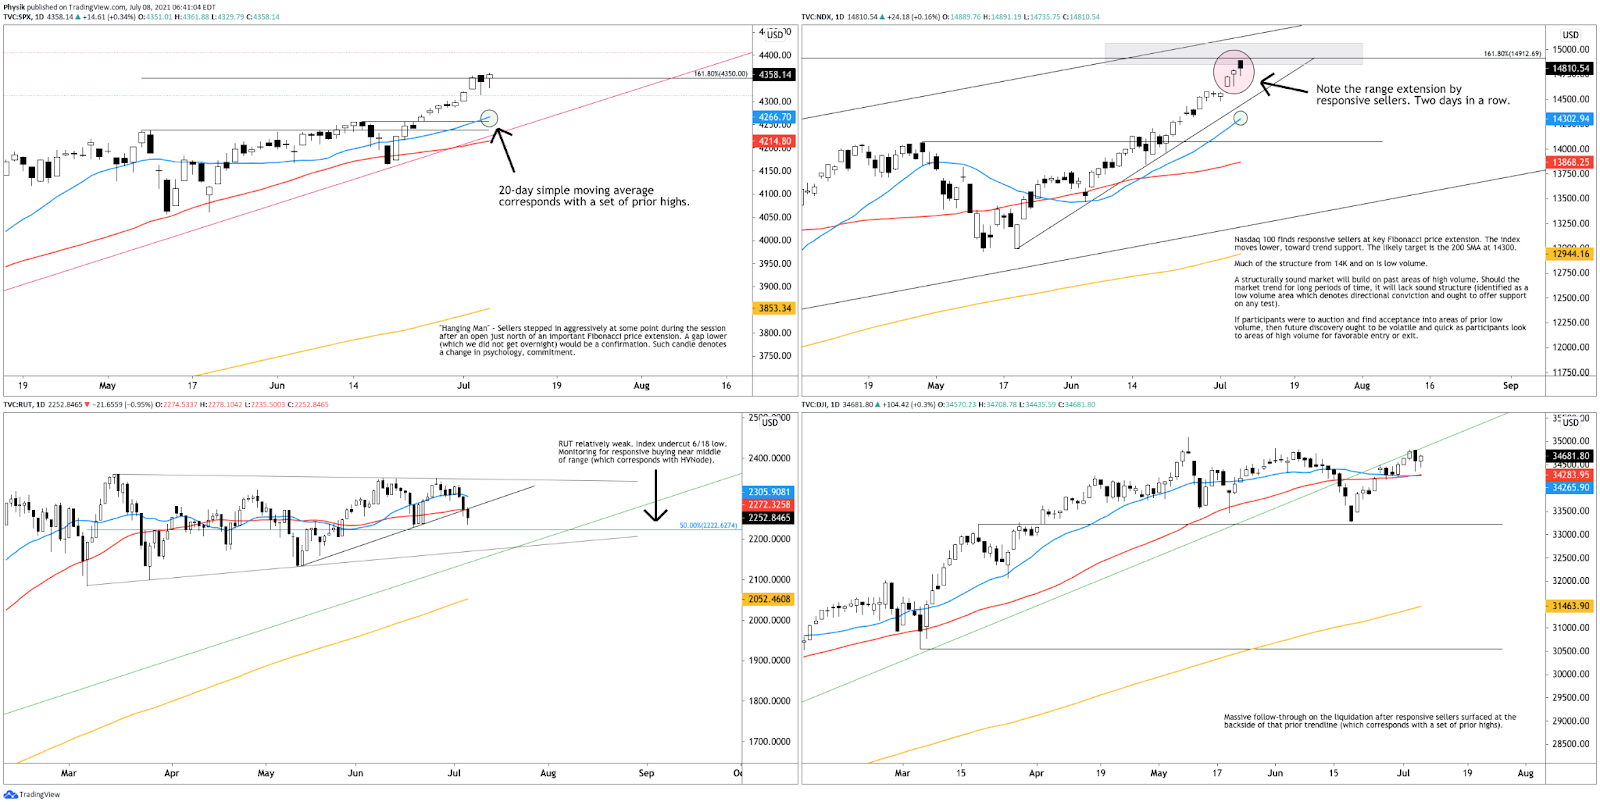
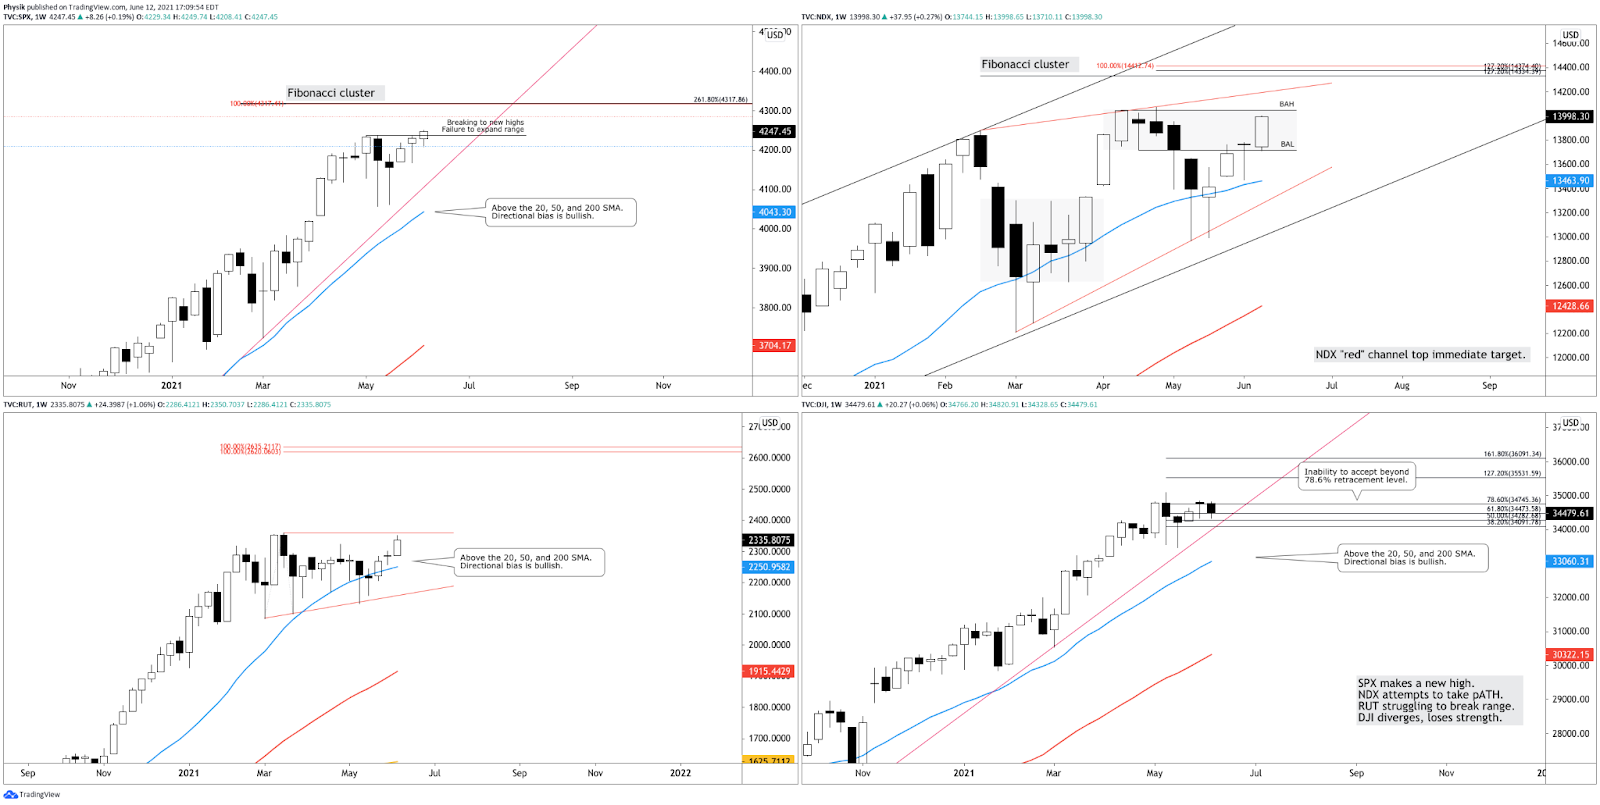
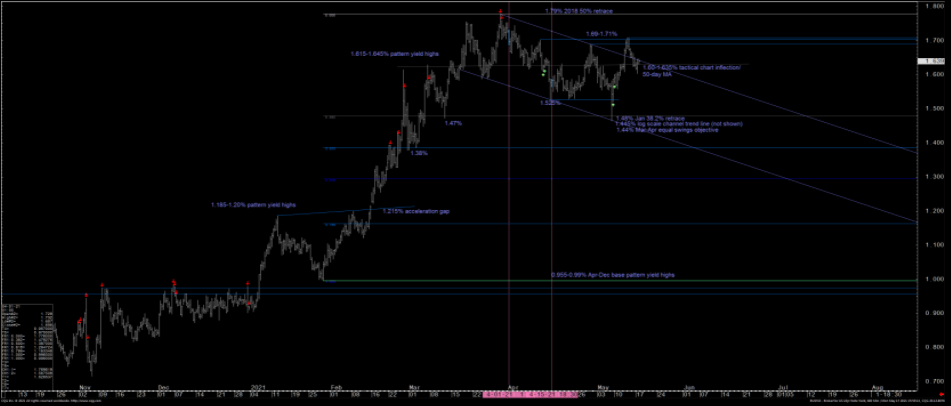
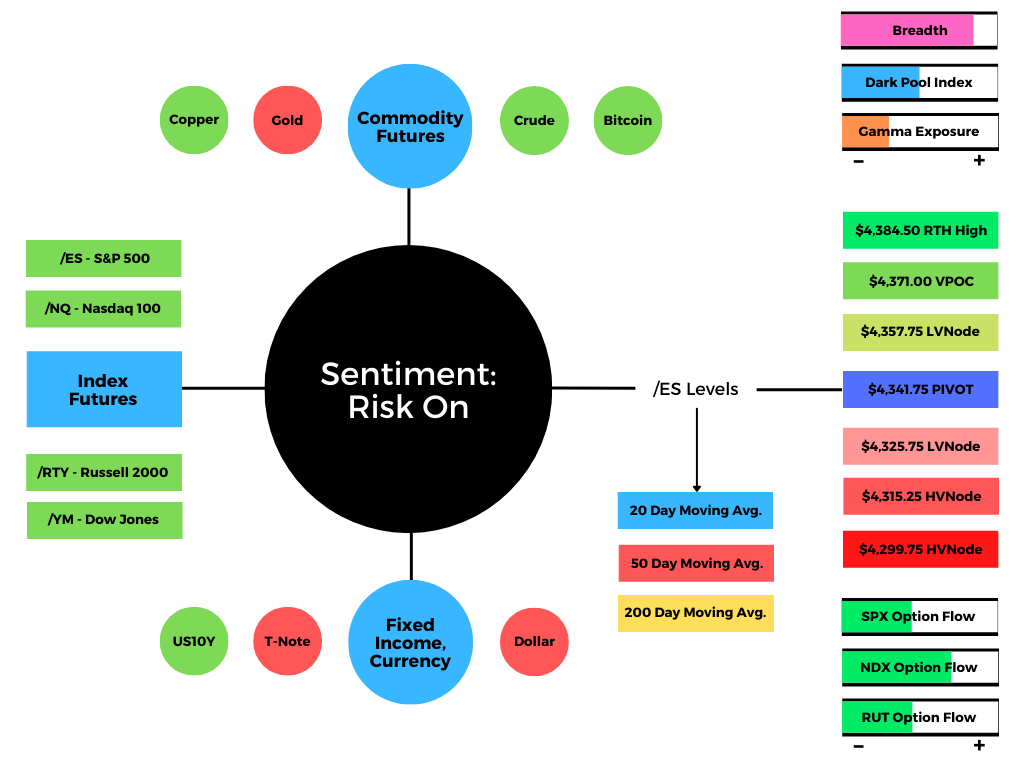
Adding, during the prior day’s regular trade, the best case outcome occurred, evidenced by trade above the $4,334.25 spike base. As that happened, participants found increased acceptance at higher prices, moving the micro-composite Point of Control (MCPOC) up to $4,341.75, a pivot point (i.e., above = bullish, below = bearish) for today’s trade. This is noteworthy since it suggests the fairest price to do business, on a larger timeframe, is higher.
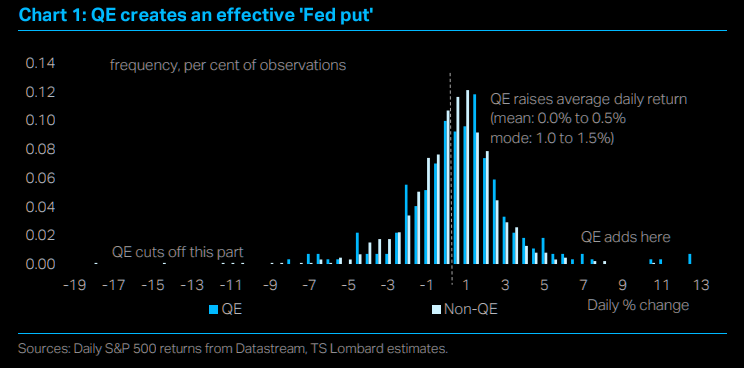
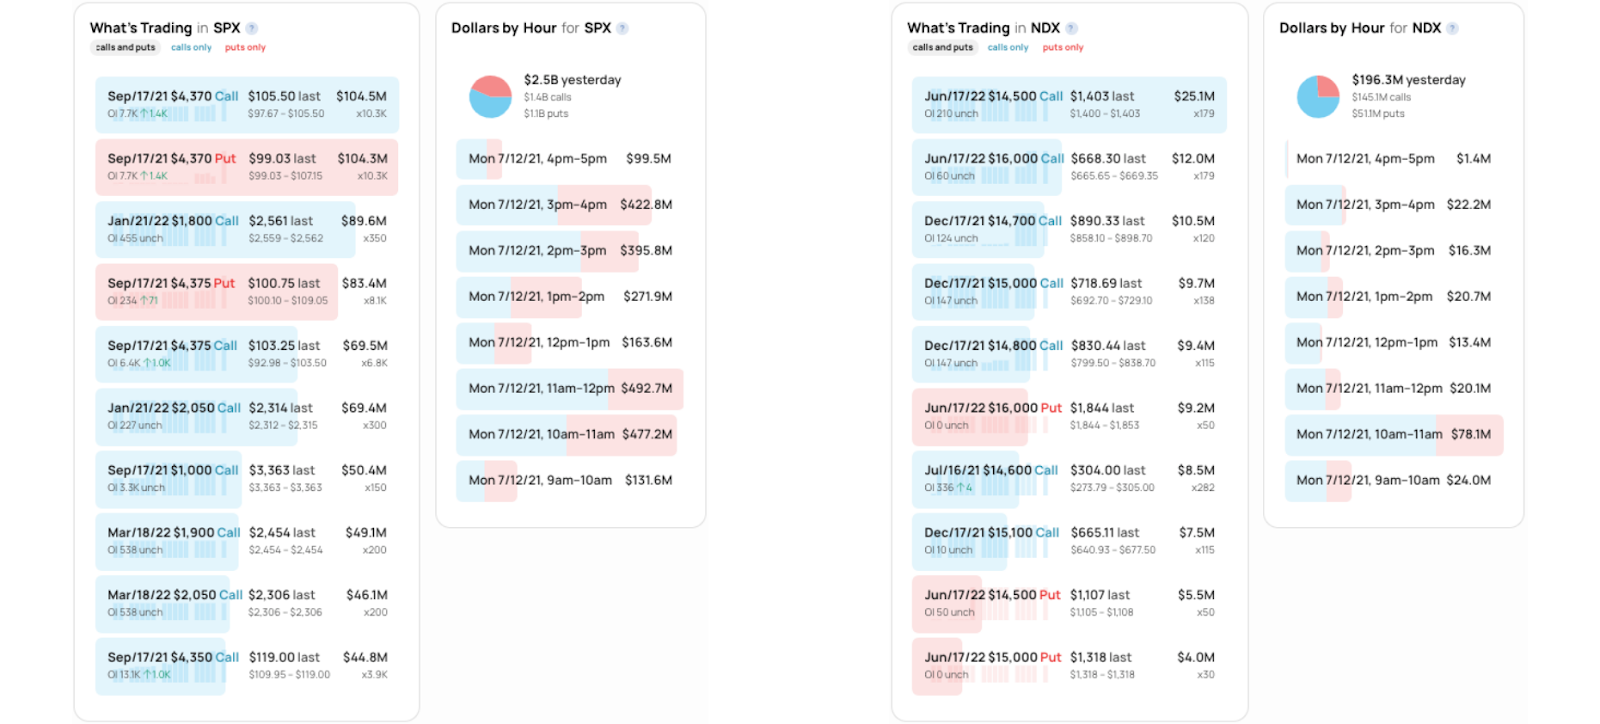
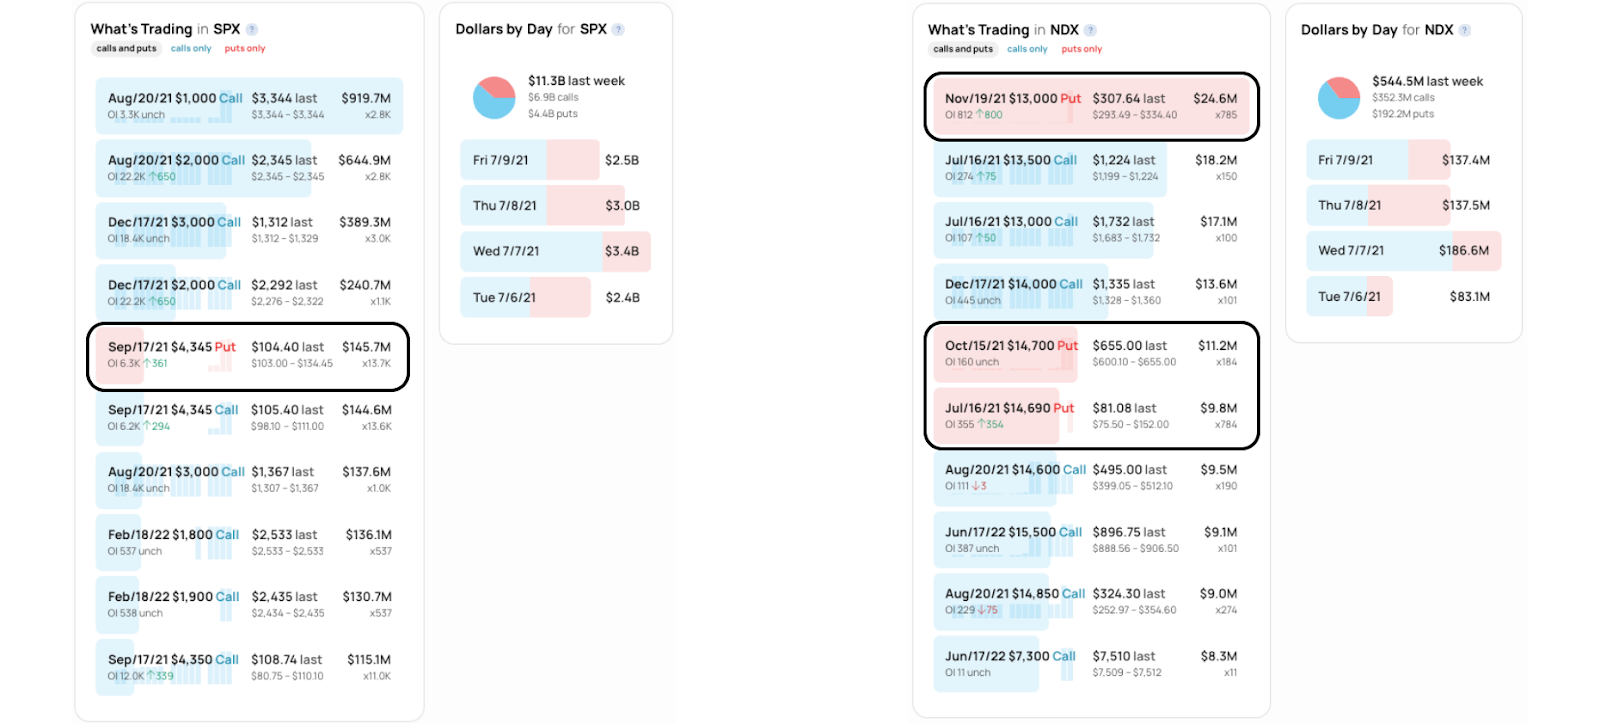
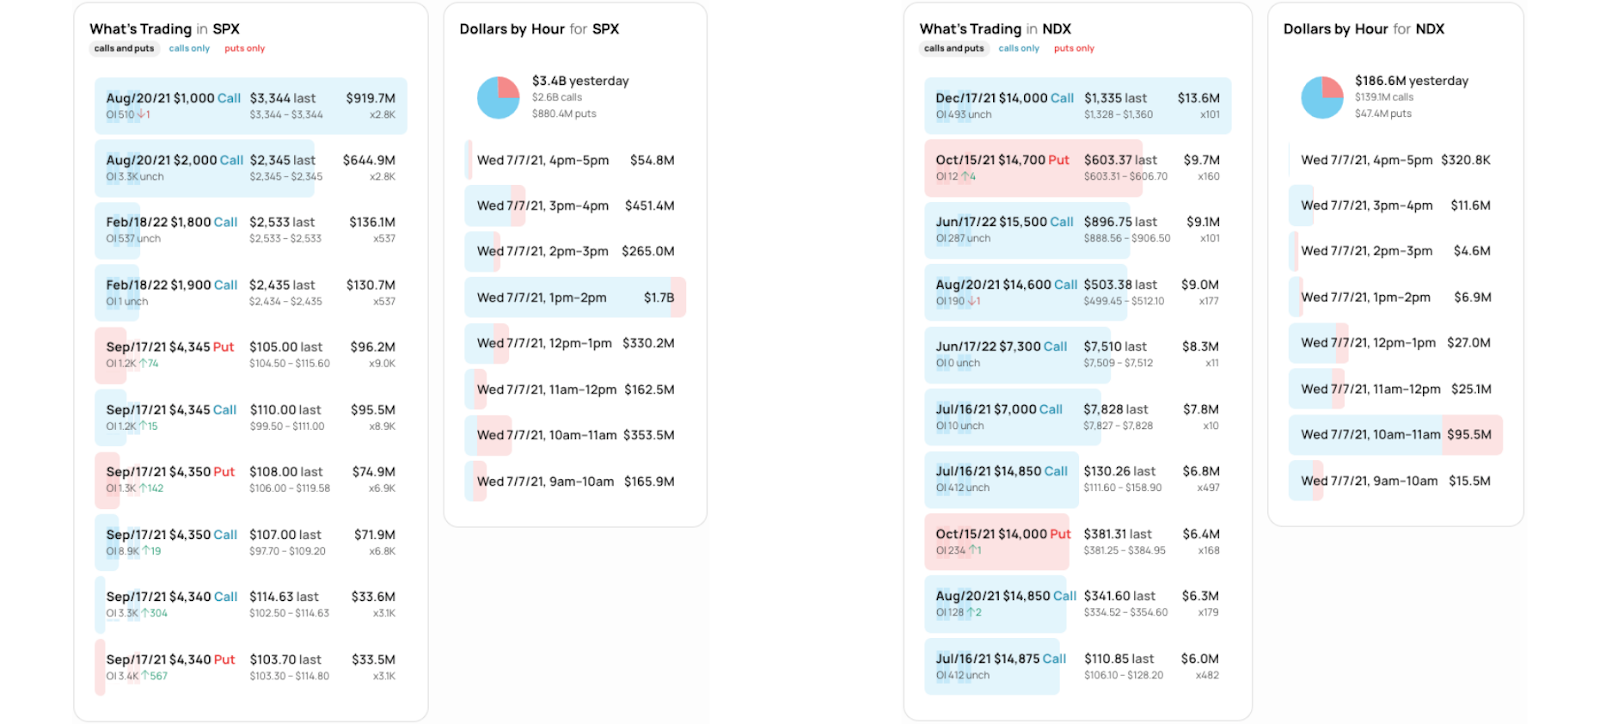
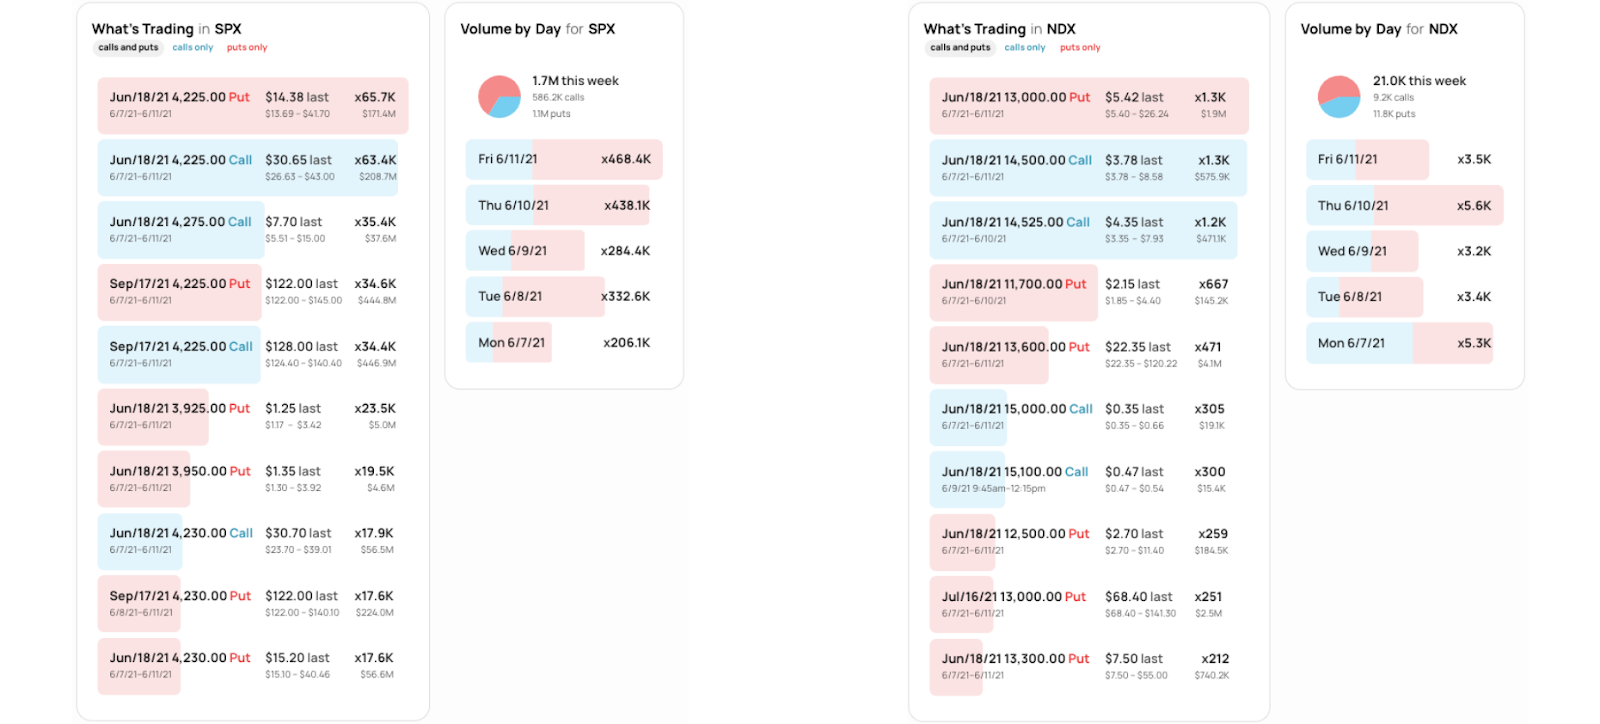
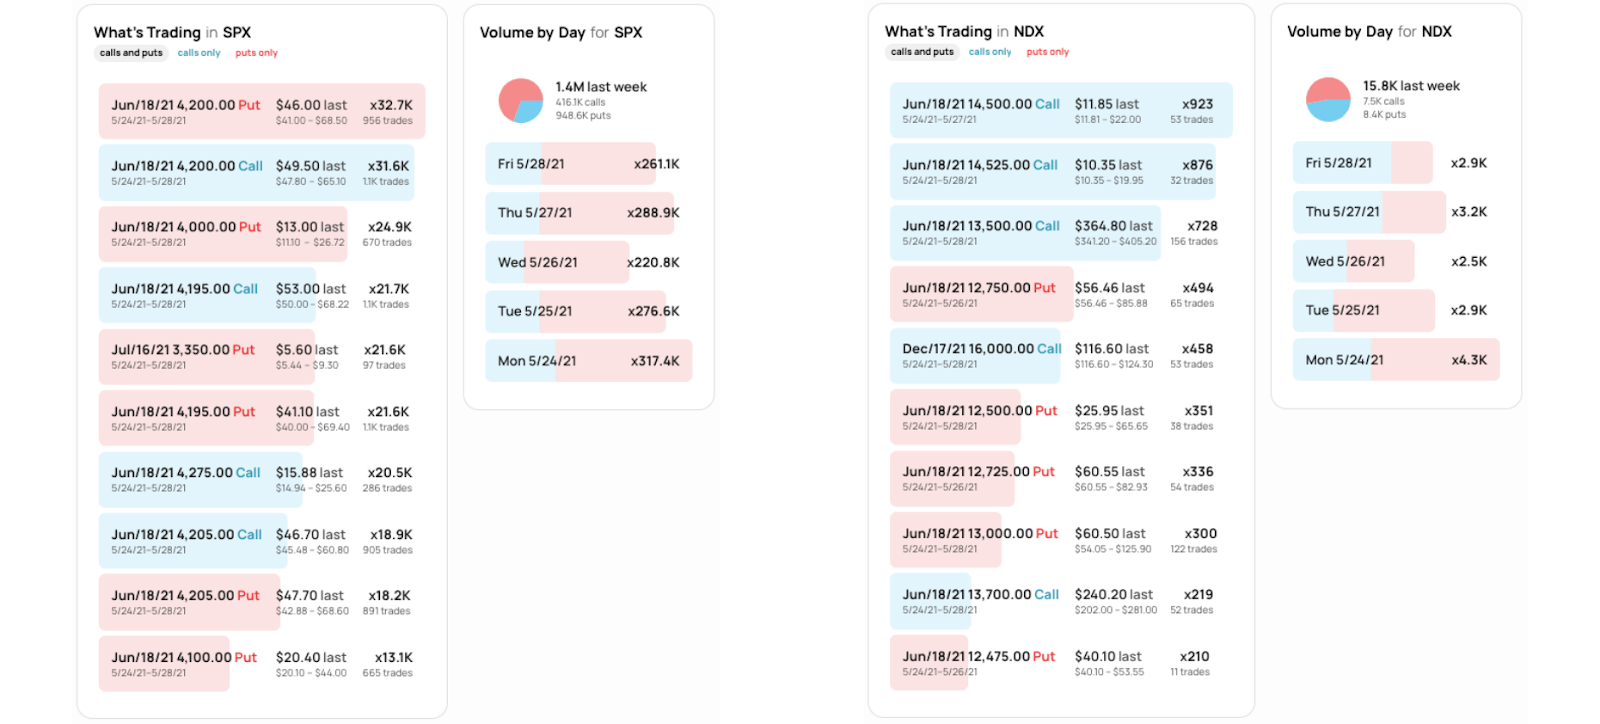
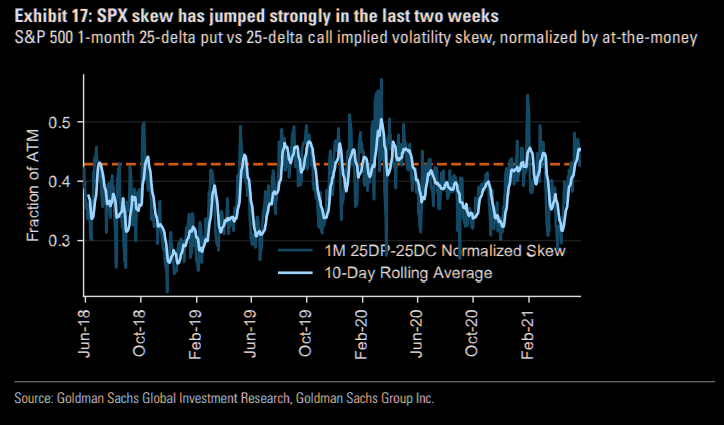
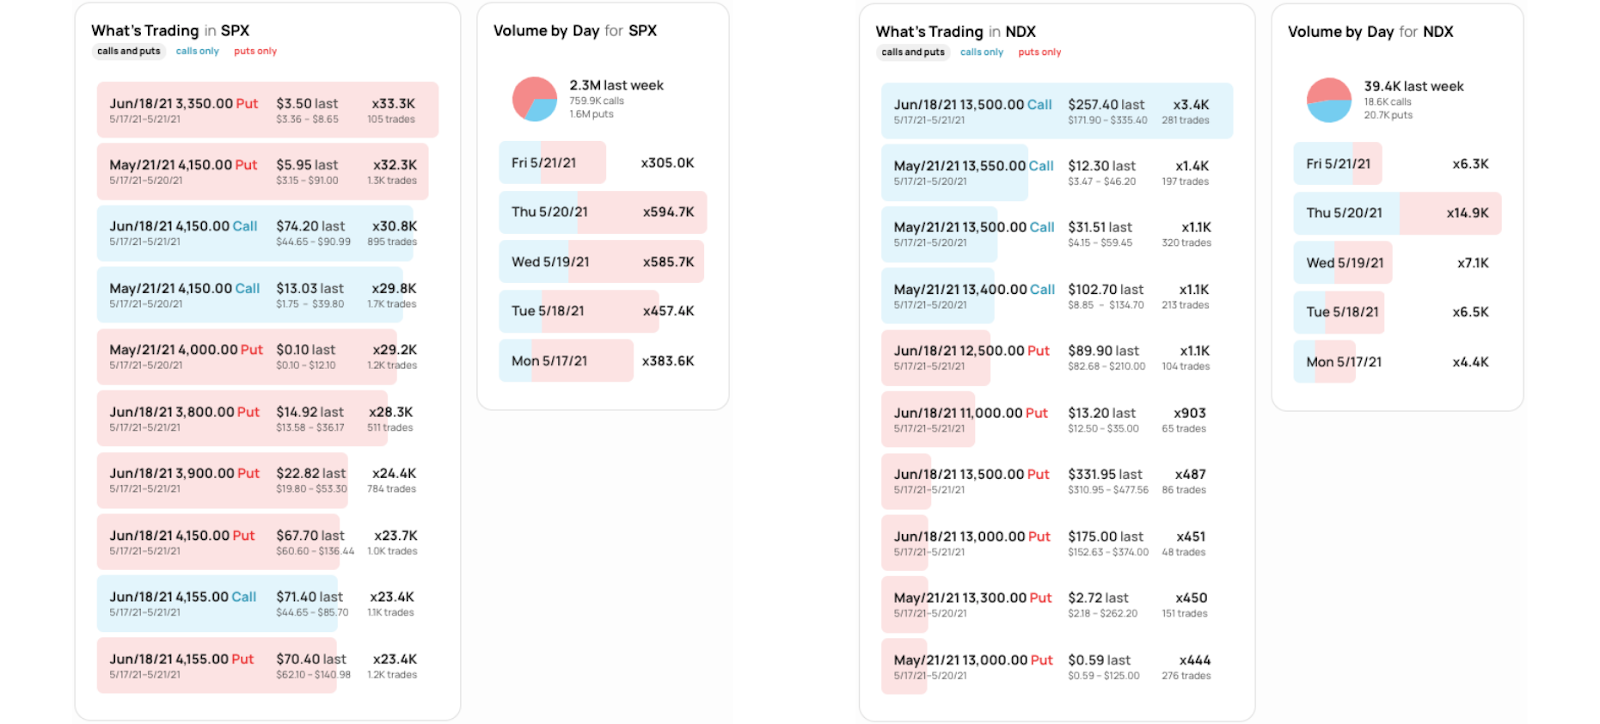
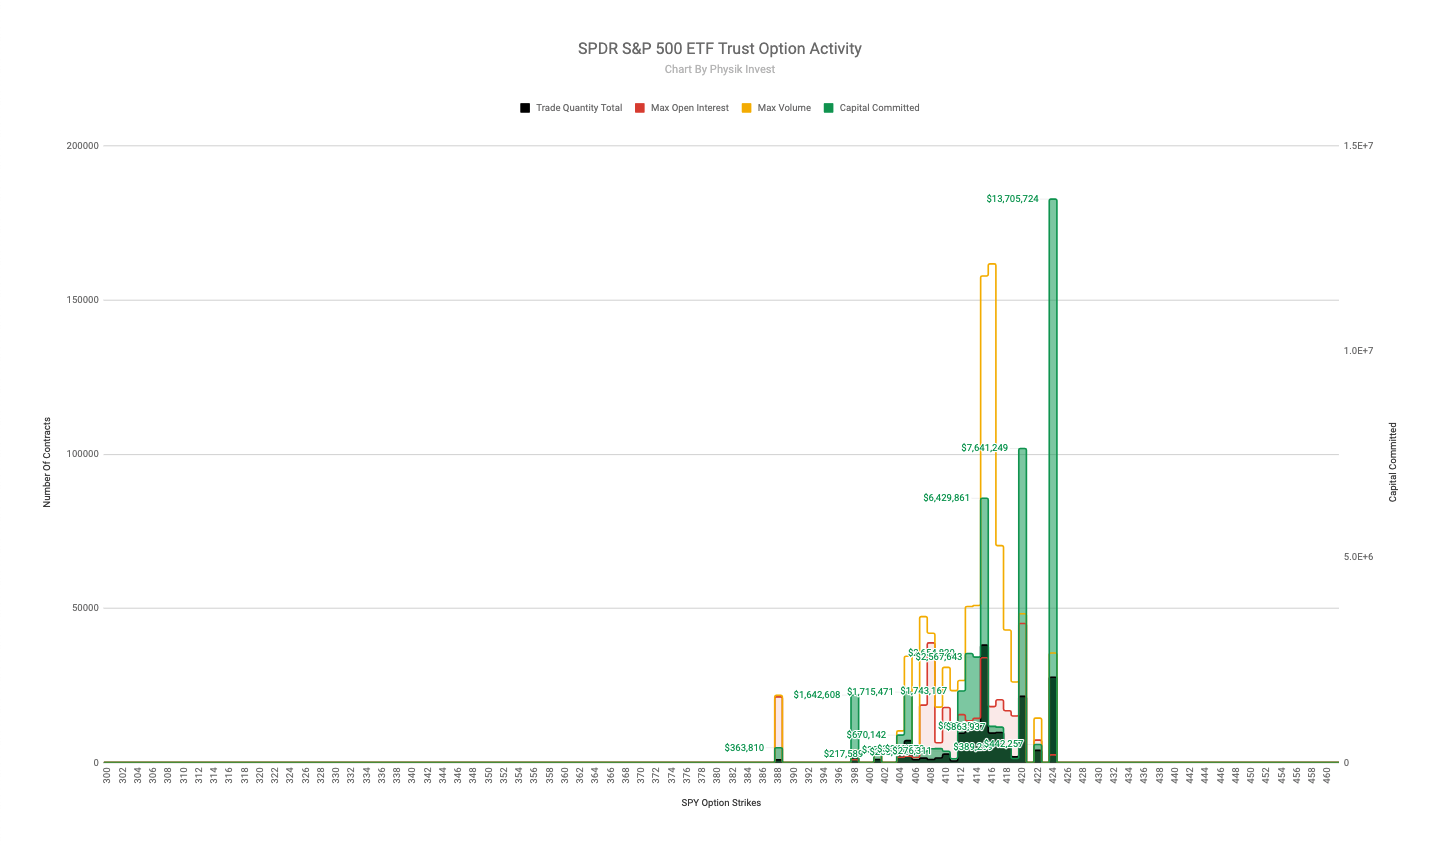
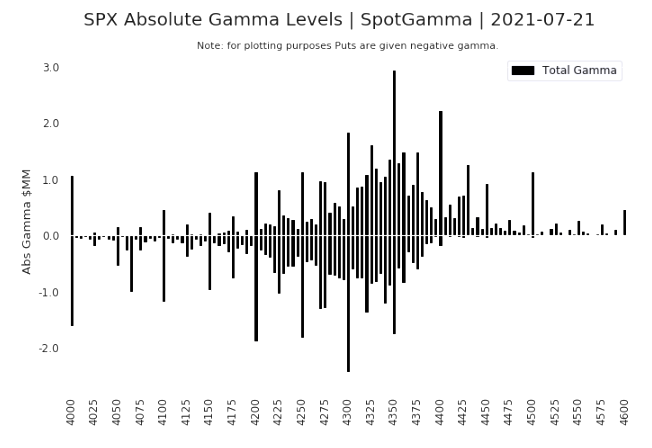
At the same time, in support of the price rise was fantastic breadth and dynamics with respect to the derivatives market; amidst a crash in volatility, associated hedging activities bolster the rally.
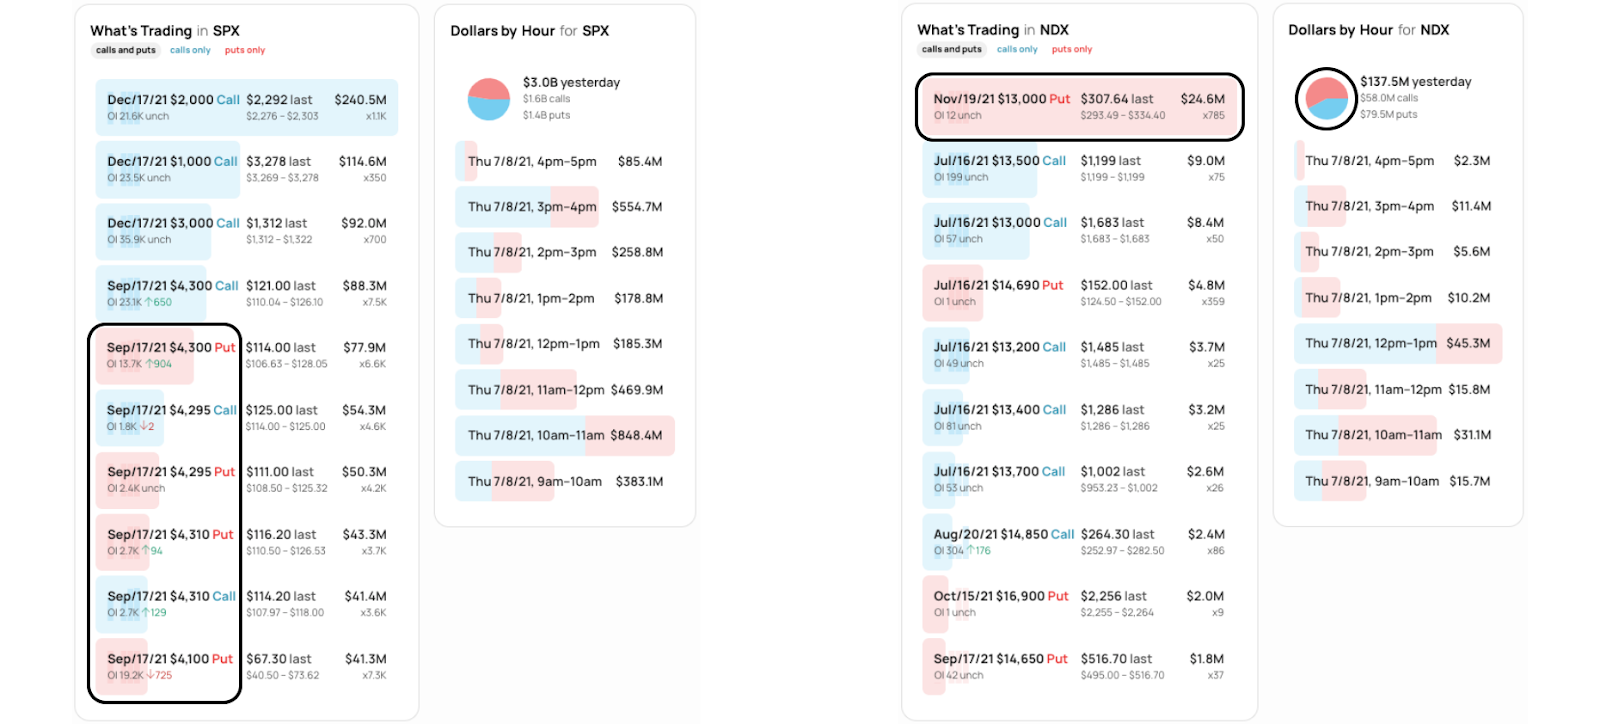
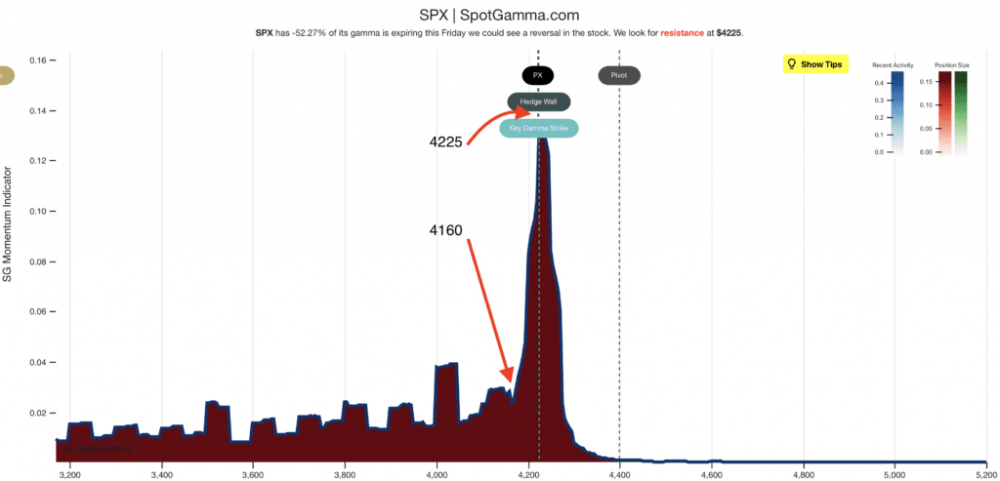
Coming into the balance-area sellers initiated from the weak prior, however, certain mechanics may quell the upside volatility, potentially leading to a stall or slower advance.
Moreover, for today, participants can trade from the following frameworks.
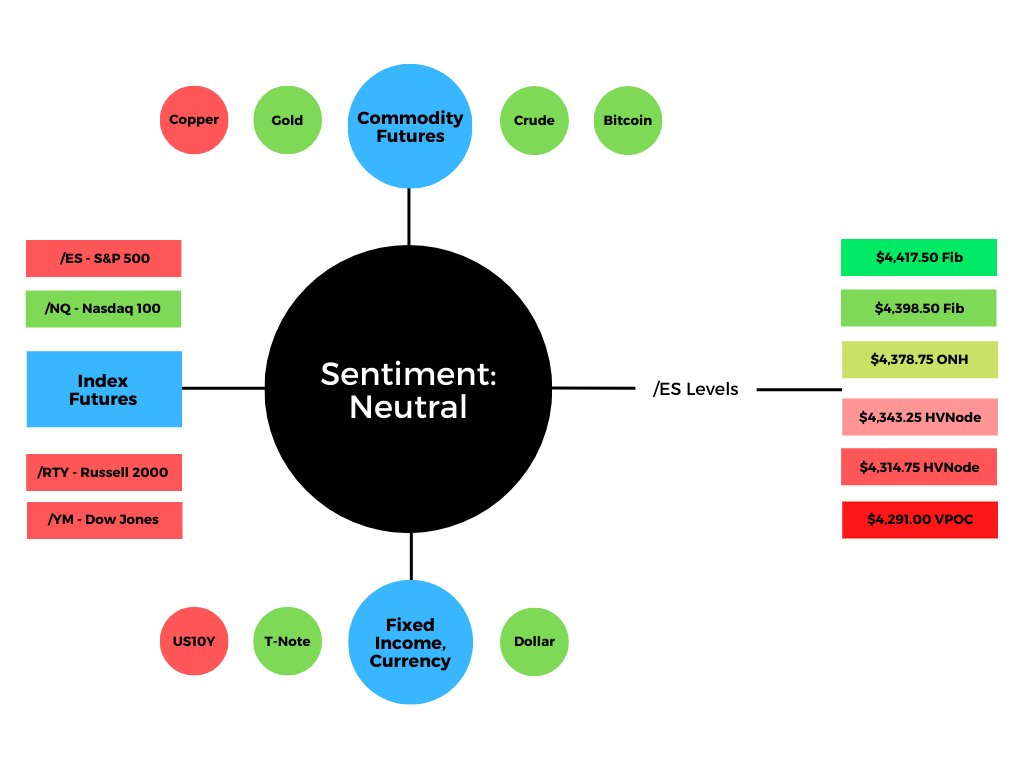
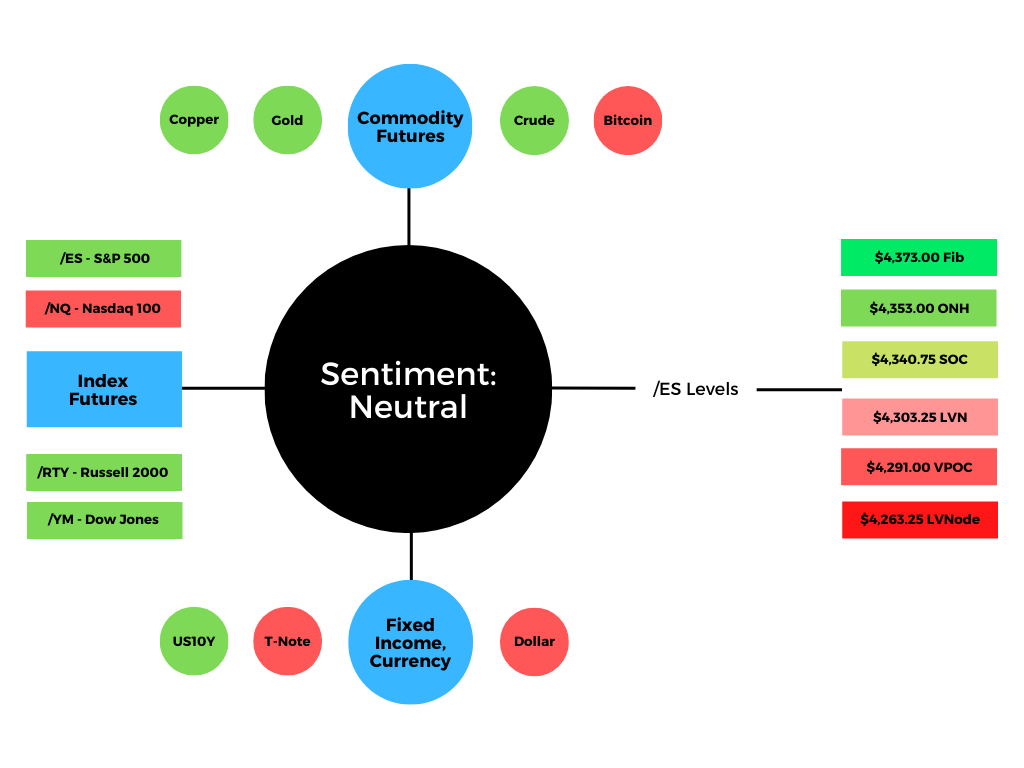
In the best case, the S&P 500 trades sideways or higher; activity above the $4,341.75 MCPOC puts participants just short of entry into a prior balance area, near the $4,357.75 low volume area (LVNode). Initiative trade beyond the $4,357.75 LVNode could reach as high as the $4,371.00 POC and $4,384.50 minimal excess regular trade high (RTH), the typical scenario on re-entry into balance.
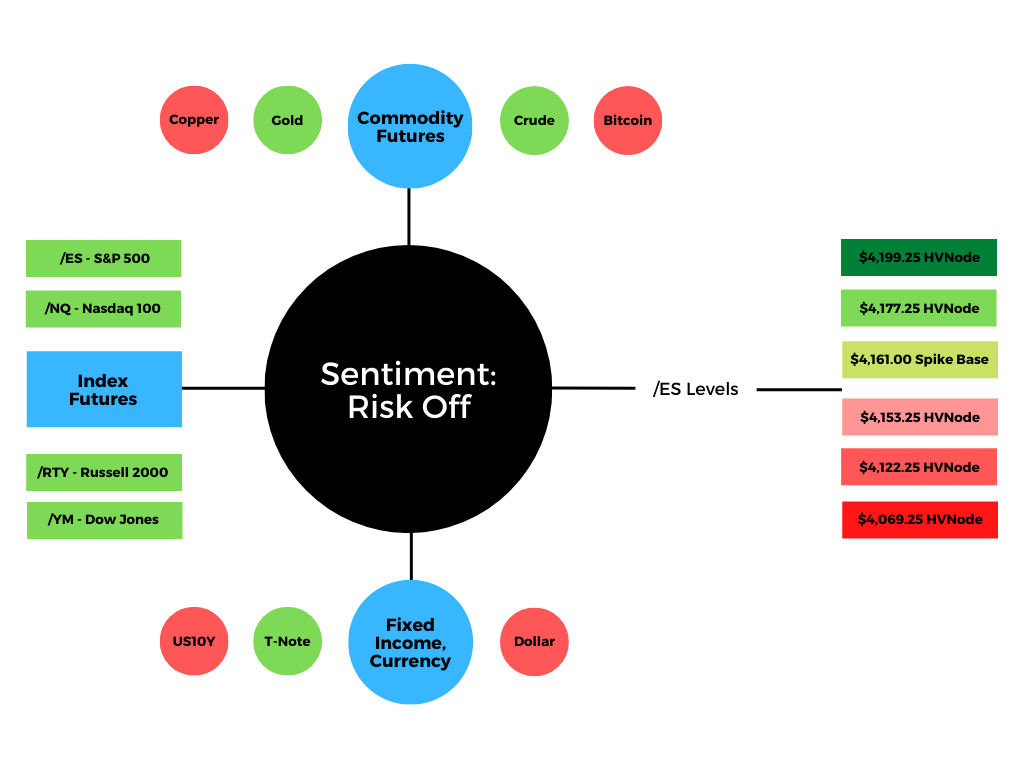
In the worst case, the S&P 500 trades lower; activity below the $4,341.75 MCPOC puts in play the $4,325.75 LVNode. Initiative trade beyond the $4,325.75 LVNode could reach as low as the $4,315.25 and $4,299.75 high volume areas (HVNodes).
It is important to note also that the prior two HVNodes correspond with key Volume Weighted Average Price (VWAP) levels, a metric highly regarded by chief investment officers, among other participants, for quality of trade. Additionally, liquidity algorithms are benchmarked and programmed to buy and sell around VWAPs.
Balance (Two-Timeframe Or Bracket): Rotational trade that denotes current prices offer favorable entry and exit. Balance-areas make it easy to spot a change in the market (i.e., the transition from two-time frame trade, or balance, to one-time frame trade, or trend).

POCs: POCs are valuable as they denote areas where two-sided trade was most prevalent. Participants will respond to future tests of value as they offer favorable entry and exit.

Volume Areas: A structurally sound market will build on past areas of high volume. Should the market trend for long periods of time, it will lack sound structure (identified as a low volume area which denotes directional conviction and ought to offer support on any test).

If participants were to auction and find acceptance into areas of prior low volume, then future discovery ought to be volatile and quick as participants look to areas of high volume for favorable entry or exit.

Excess: A proper end to price discovery; the market travels too far while advertising prices. Responsive, other-timeframe (OTF) participants aggressively enter the market, leaving tails or gaps which denote unfair prices.

News And Analysis
Strong job and real estate markets support credit. (Moody’s)
Federal Reserve ramps up debate on taper timing. (WSJ)
China offers oil reserves in a move to cool oil rally. (BBG)
Biden dismisses inflation worries, warns on hiring. (BBG)
U.S.-China goods trade booms amid virus, tariffs. (BBG)
Powell has broad support among top Biden aides. (BBG)
PG&E plans to bury power lines in fire-risk areas. (WSJ)
EMEA economies recovering faster than thought. (S&P)
Structured finance sees issuances rising to $1.4T. (S&P)
What People Are Saying
About
After years of self-education, strategy development, and trial-and-error, Renato Leonard Capelj began trading full-time and founded Physik Invest to detail his methods, research, and performance in the markets. Additionally, Capelj is a finance and technology reporter. Some of his biggest works include interviews with leaders such as John Chambers, founder and CEO, JC2 Ventures, Kevin O’Leary, businessman and Shark Tank host, Catherine Wood, CEO and CIO, ARK Invest, among others.
Disclaimer
At this time, Physik Invest does not manage outside capital and is not licensed. In no way should the materials herein be construed as advice. Derivatives carry a substantial risk of loss. All content is for informational purposes only.