Categories
Commentary

Daily Brief For March 7, 2022

Editor’s Note: The Daily Brief is a free glimpse into the prevailing fundamental and technical drivers of U.S. equity market products. Join the 200+ that read this report daily, below!

What Happened

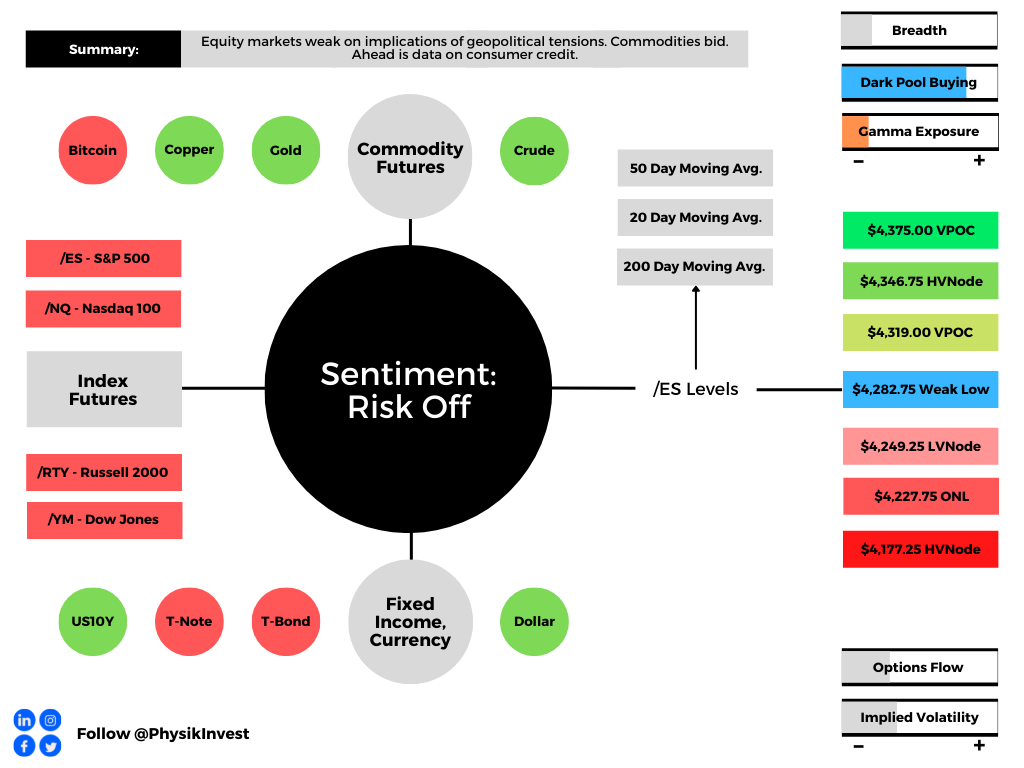
Overnight, equity index futures auctioned lower as participants looked to price in the implications of heightened inflation and risk of recession amidst geopolitical tensions.

Ahead is data on consumer credit (3:00 PM ET).

Graphic updated 5:45 AM ET. Sentiment Risk-Off if expected /ES open is below the prior day’s range. /ES levels are derived from the profile graphic at the bottom of the following section. Levels may have changed since initially quoted; click here for the latest levels. SqueezeMetrics Dark Pool Index (DIX) and Gamma (GEX) calculations are based on where the prior day’s reading falls with respect to the MAX and MIN of all occurrences available. A higher DIX is bullish. At the same time, the lower the GEX, the more (expected) volatility. Learn the implications of volatility, direction, and moneyness. SHIFT data used for S&P 500 (INDEX: SPX) options activity. Note that options flow is sorted by the call premium spent; if more positive, then more was spent on call options. Breadth reflects a reading of the prior day’s NYSE Advance/Decline indicator. VIX reflects a current reading of the CBOE Volatility Index (INDEX: VIX) from 0-100.

What To Expect

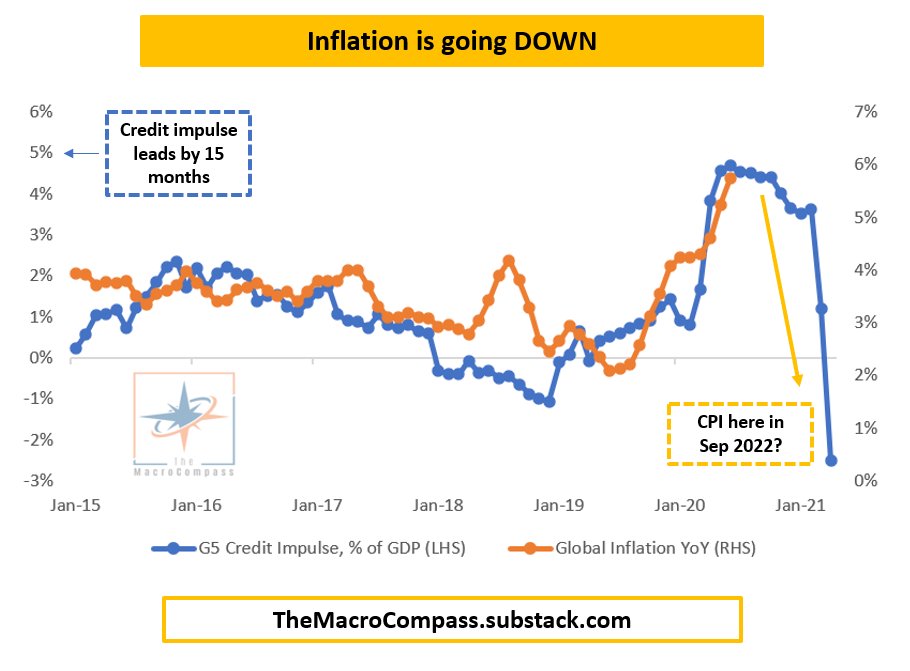
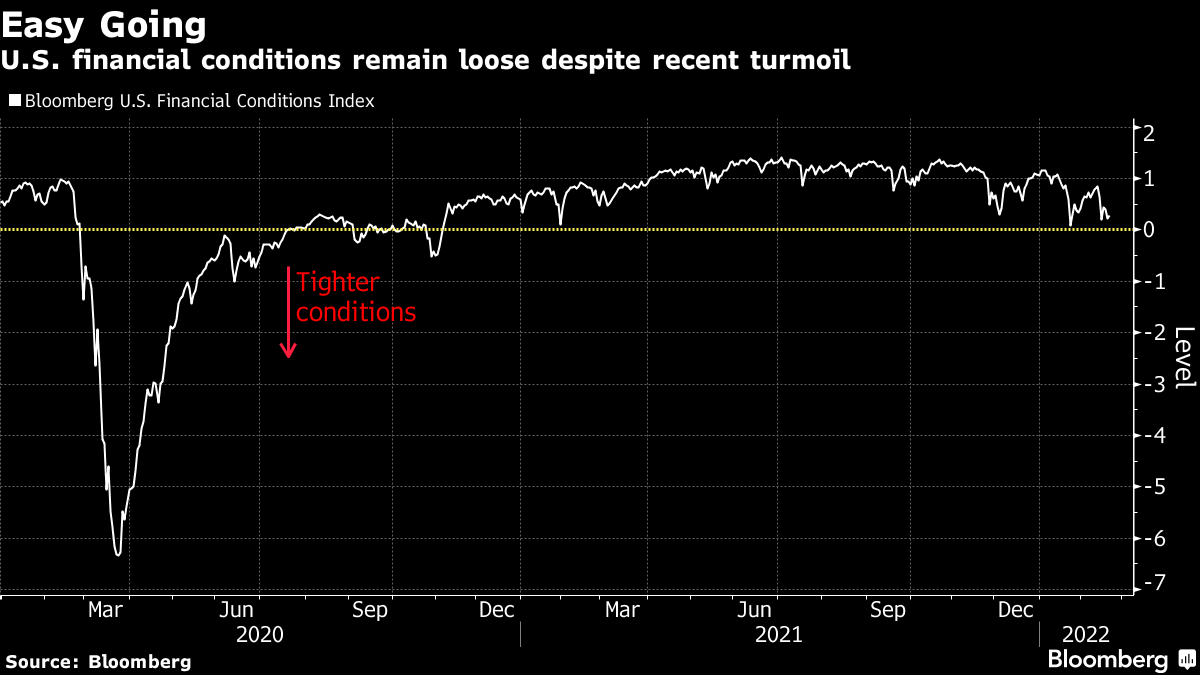
Fundamental: Hawkishness with respect to monetary policy, in the face of heightened inflation and slowing economic growth, is affecting global markets.

Graphic: Via Bloomberg. European markets trade weak relative to their U.S. peers.

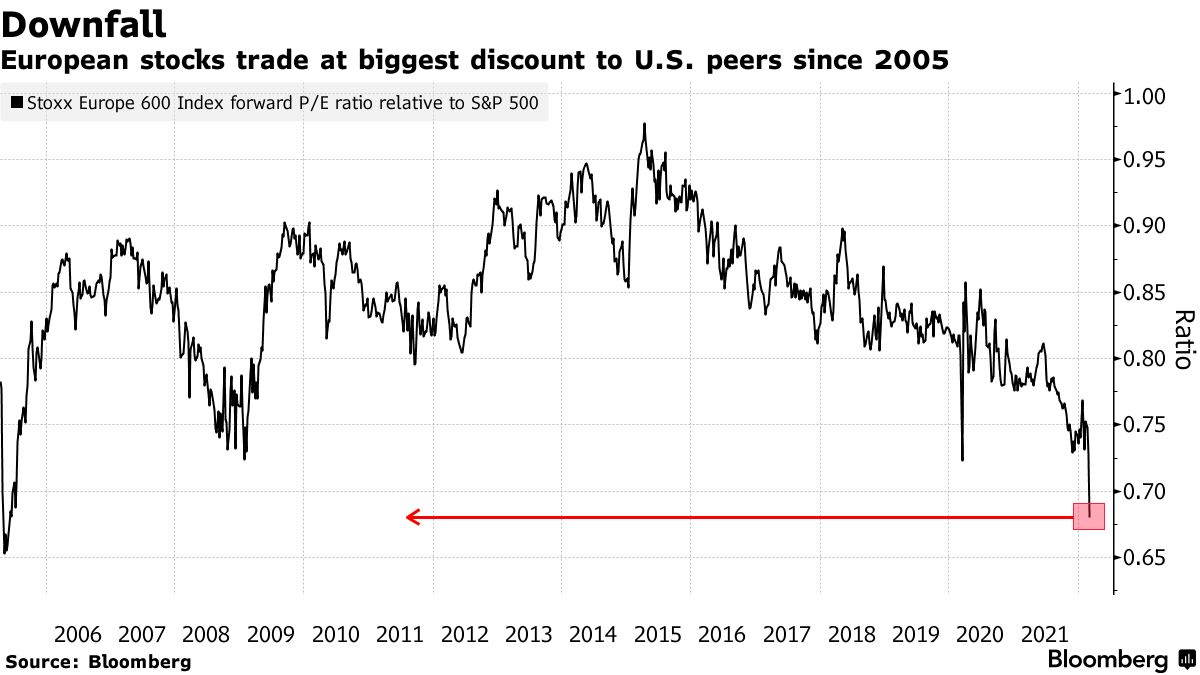
Overseas markets have sold more, relatively, and the pricing of equity market risk in Europe is far outpacing that in the U.S.

Graphic: Via Bloomberg. Divergences in the pricing of risk across markets.

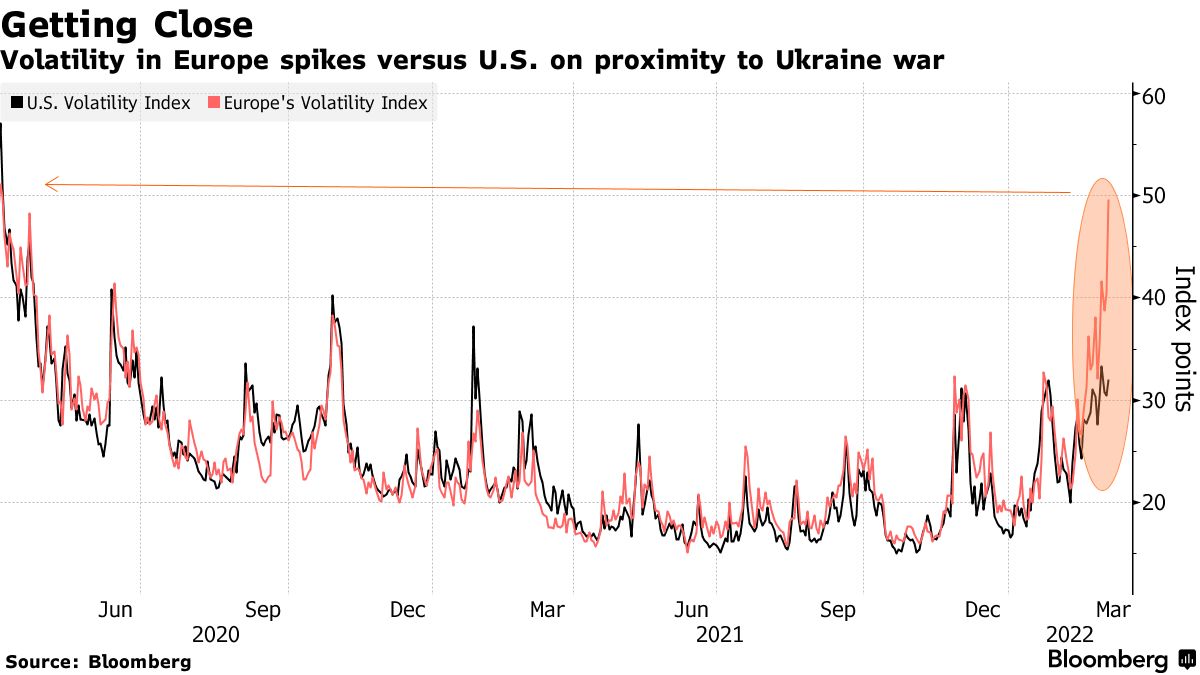
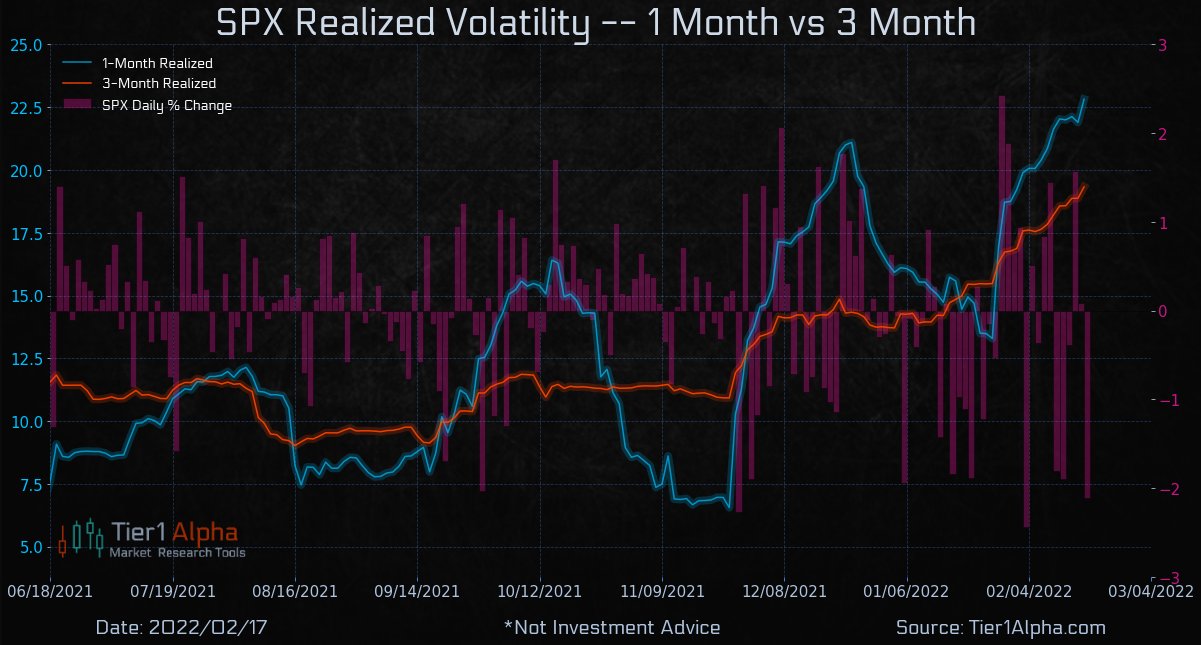
Last week, we unpacked the potential factors behind (and the implications of) divergences in cross-asset volatility. Mainly, the fear in one market tends to feed into the fear of another.

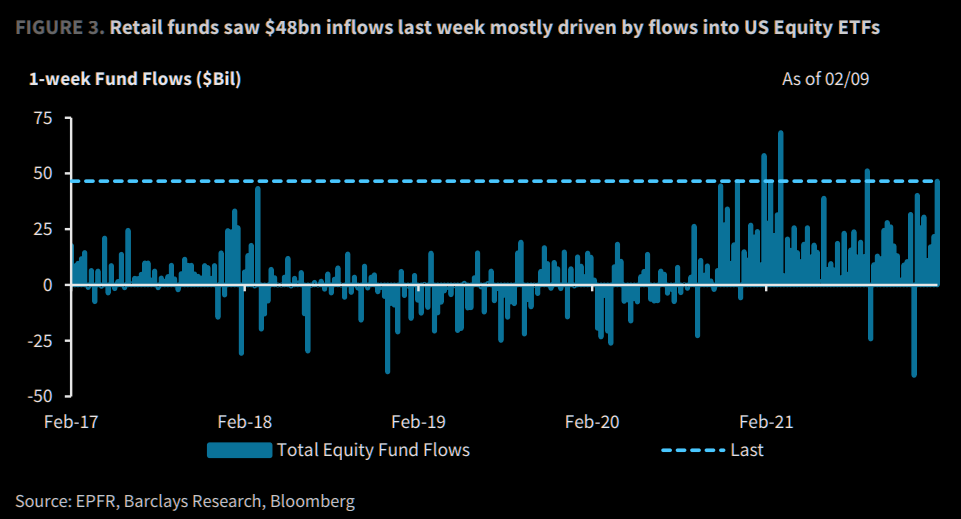
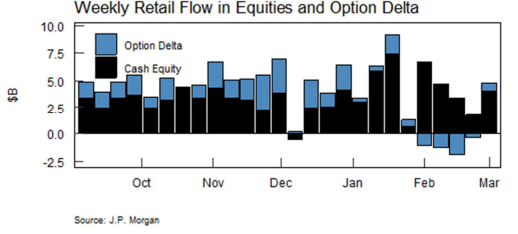
Pursuant to those remarks on this push-and-pull comes as Goldman Sachs Group Inc’s (NYSE: GS) prime brokerage saw hedge-fund clients unloading risk at the fastest rate in three months, while JPMorgan Chase & Co (NYSE: JPM) saw retail buying nearly $4.1 billion, “with money sent to S&P 500-linked ETFs more than 2 standard deviations above the 12-month average.”

Graphic: Via JPMorgan, from Bloomberg.

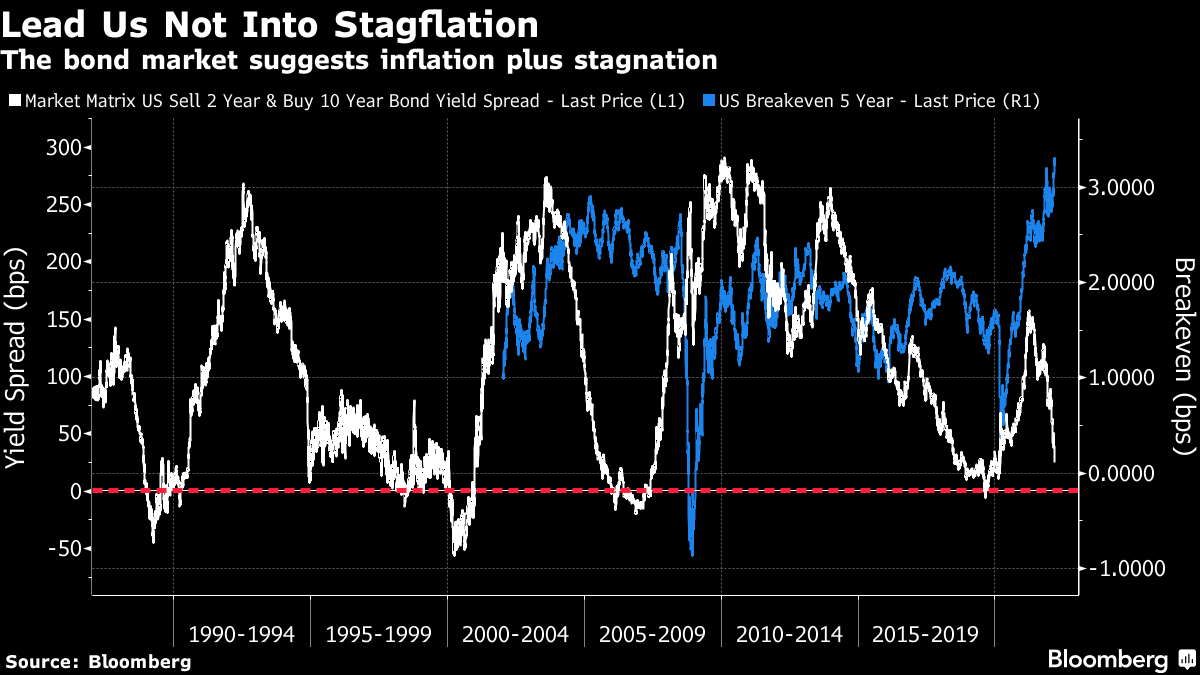
Per Bloomberg’s John Authers, market professionals likely view reactions to geopolitical tension “as increasing the risk of stagflation, a rare combination of high inflation and a recession.”

Graphic: Via JPMorgan, from The Market Ear.

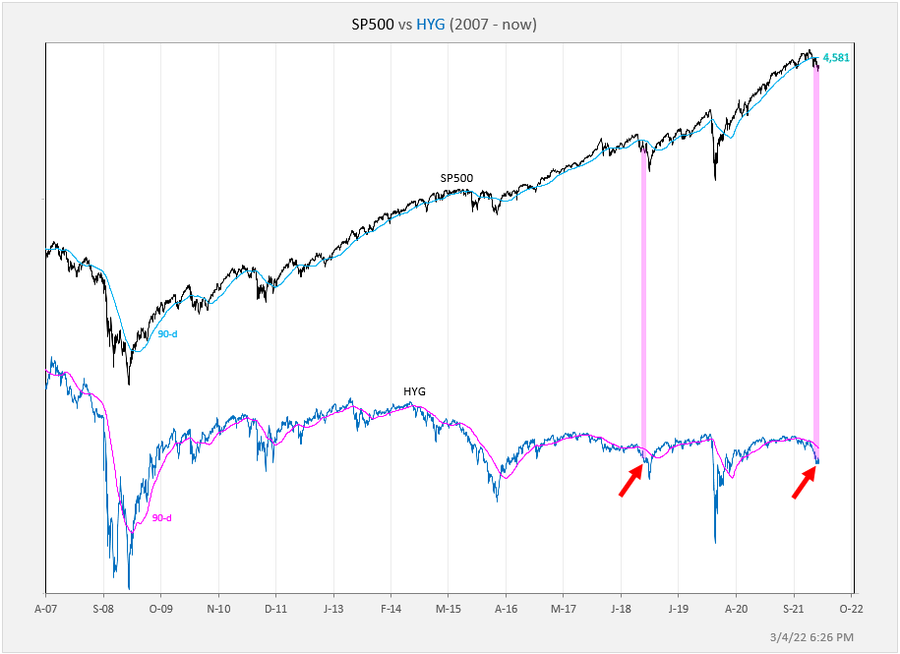
“This looks like 2007, on the eve of the Global Financial Crisis, with even higher inflation expectations and a yield curve that has not quite yet inverted.”

Graphic: Via Bloomberg. “[A]n outright inversion, which generally signals a recession a matter of months later, now seems an imminent possibility.”

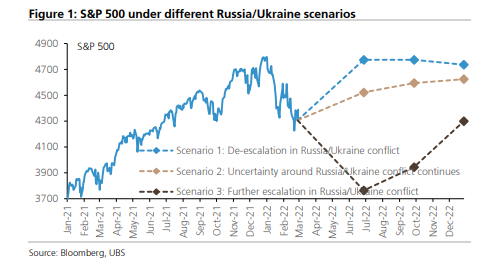
UBS Group AG (NYSE: UBS) ran a machine-learning analysis that “reckons the Russia/Ukraine conflict could send the S&P 500 anywhere from 3,800 to 4,800 – a 26% range – depending on how it resolves.”

Graphic: Via UBS, from Bloomberg.

Perspectives: “Every other market is consistent with the idea that the economy is in trouble and there’s stress in the markets,” said Jim Bianco, president of Bianco Research LLC in Chicago. 

“The stock market historically does this — it’s the last market to turn, it’s the slowest market to understand the problems. It’s the market driven by narratives and hope.”

Graphic: Via @exposurerisk from @Callum_Thomas. “Slowly at first, then all of a sudden.”

Alternatively, BCA Research Ltd suggests that “Even if World War III is ultimately averted, markets could experience a freak-out moment over the next few weeks, similar to what happened at the outset of the pandemic. Google searches for nuclear war are already spiking.”

“Despite the risk of nuclear war, it makes sense to stay constructive on stocks over the next 12 months. If an ICBM is heading your way, the size and composition of your portfolio becomes irrelevant. Thus, from a purely financial perspective, you should largely ignore existential risk, even if you do care about it greatly from a personal perspective.”

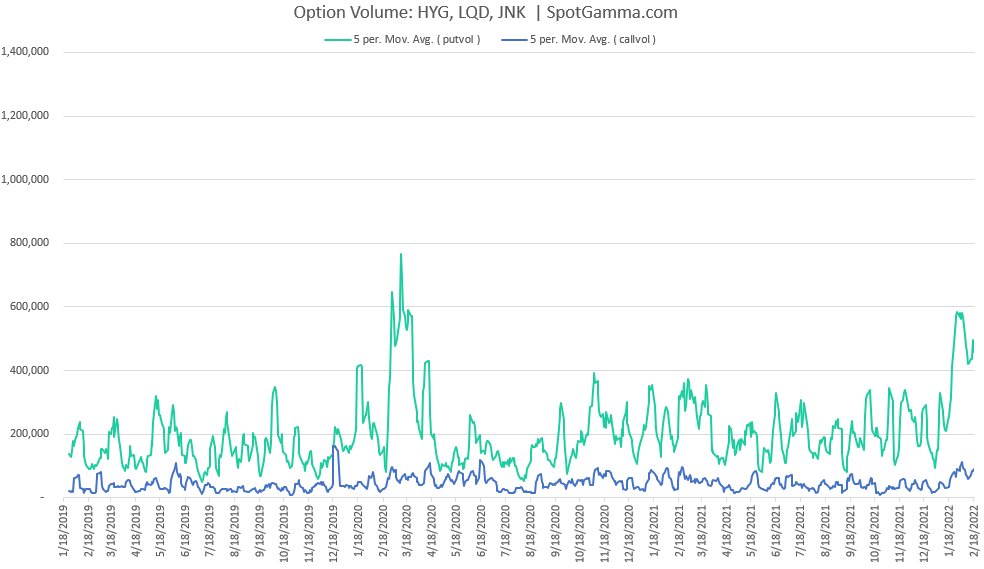
Positioning: The fundamental picture is clouded by the options market positioning.

At present, in the face of continued passive buying support, the overwhelming demand for downside (put) protection (a negative delta, positive gamma trade) results in counterparty hedging that may exacerbate weakness.

The reason why? The counterparty has exposure to positive delta and negative gamma. If underlying prices print lower and/or measures of implied volatility rise (given increased fear and demand for protection), short puts rise in value (and counterparty losses are multiplied).

To overcome these potential losses, counterparties sell the underlying to hedge. If nothing happens, the protection decays, and counterparties buy back their hedges potentially bolstering the underlying market’s calmness or attempts higher.

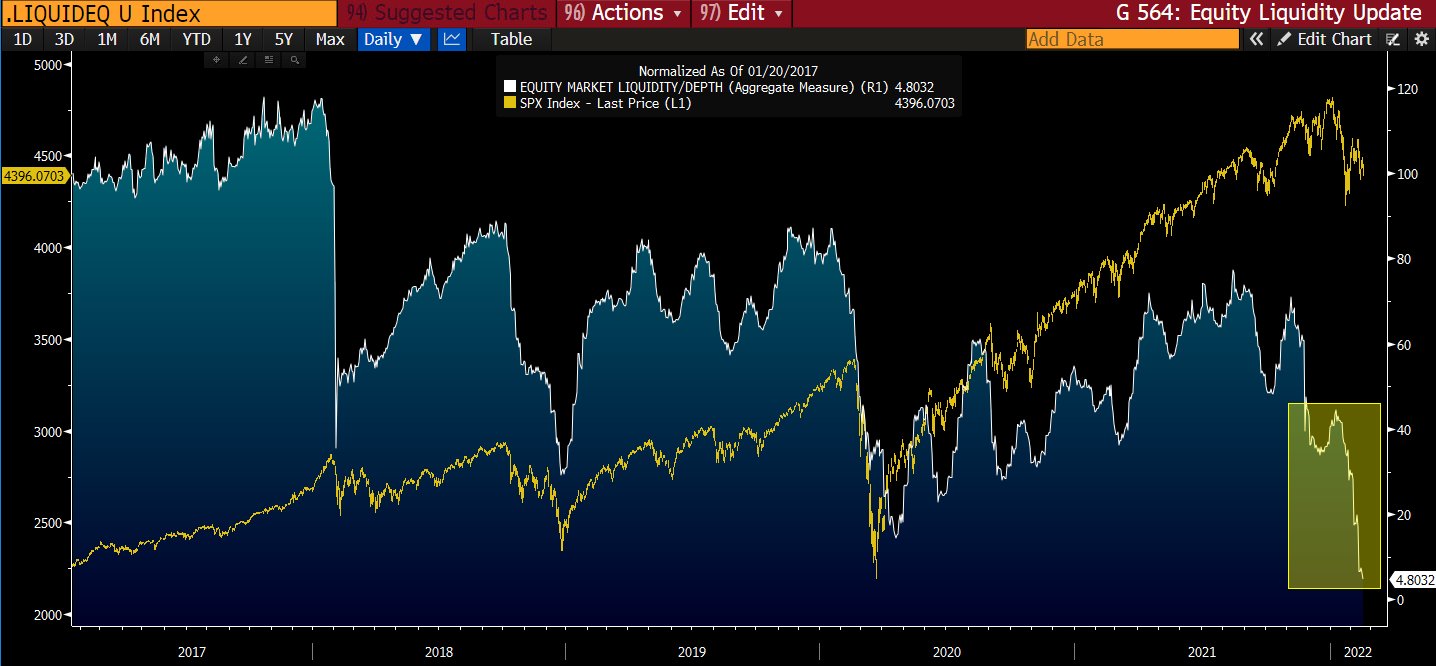
As noted earlier and explained in detail last week, the pricing of risk across markets has diverged and the S&P 500, among other U.S. indices, is relatively strong (unlike peers in Europe and Asia). 

Among other things, one dynamic balancing this pressure from puts is negative-delta trade, by customers, on the call side. In selling calls, dealers are long (a positive delta, positive gamma trade that makes money if the underlying rises). To hedge, dealers tend towards selling strength and buying weakness, adding liquidity to the market. 

Still, again, the news is bad, and returns into monthly options expirations (like the one coming up next week) are often weak.

Graphic: @pat_hennessy breaks down returns for the S&P 500, categorized by the week relative to OPEX. 

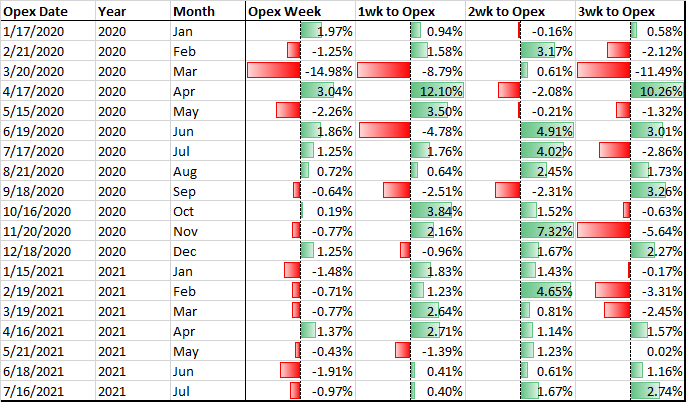
So, there is potential that weakness climaxes into the options expiration. Thereafter, the reduction in put-heavy positioning may coincide with less counterparty exposure to the positive delta.

Graphic: Via SpotGamma. “Netting call & put delta, you can see we’re near extremes in terms of put:call positions. Often large put positions are removed by expirations, which seems to coincide with market lows. Many of these are quarterly expirations which coincide w/FOMC meetings – such as next week.”

Still, the return distributions, based on where the implied volatility term structure is at, point to continued chop and expanded ranges.

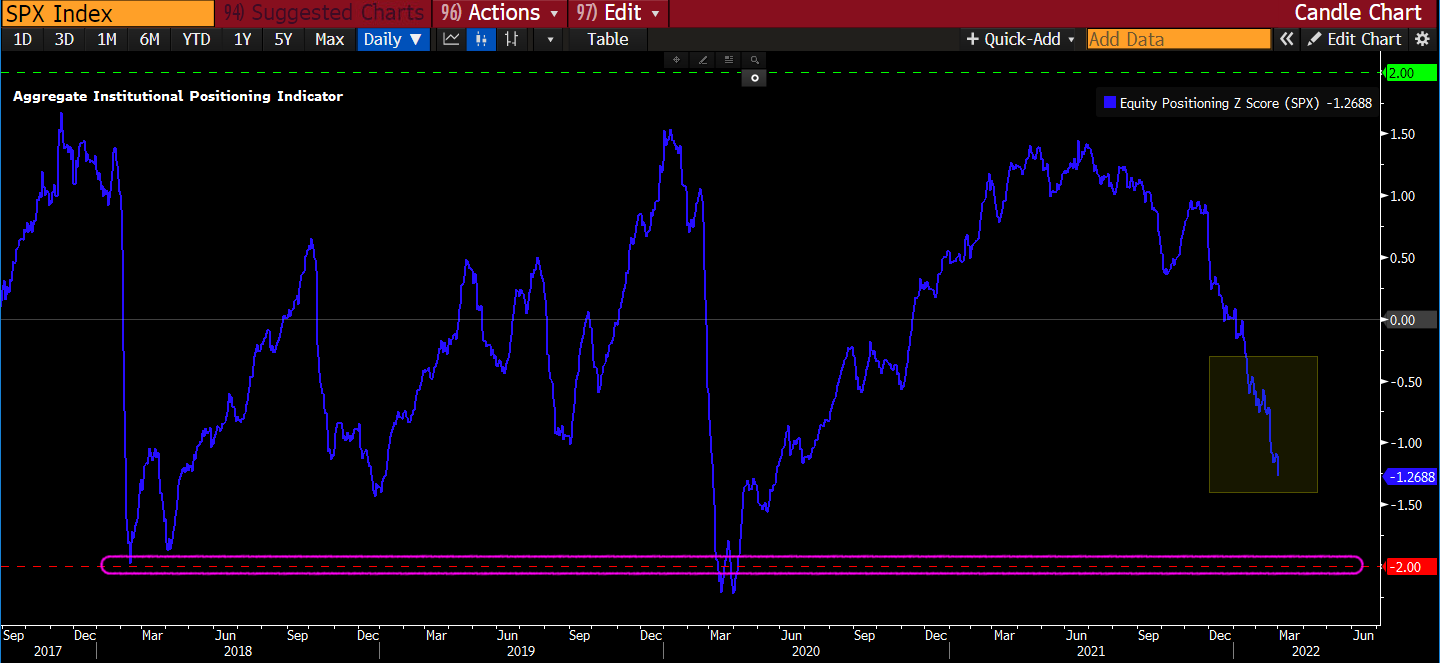
And, according to some, the “real deleveraging hasn’t hit yet.”

Graphic: Via @FadingRallies.

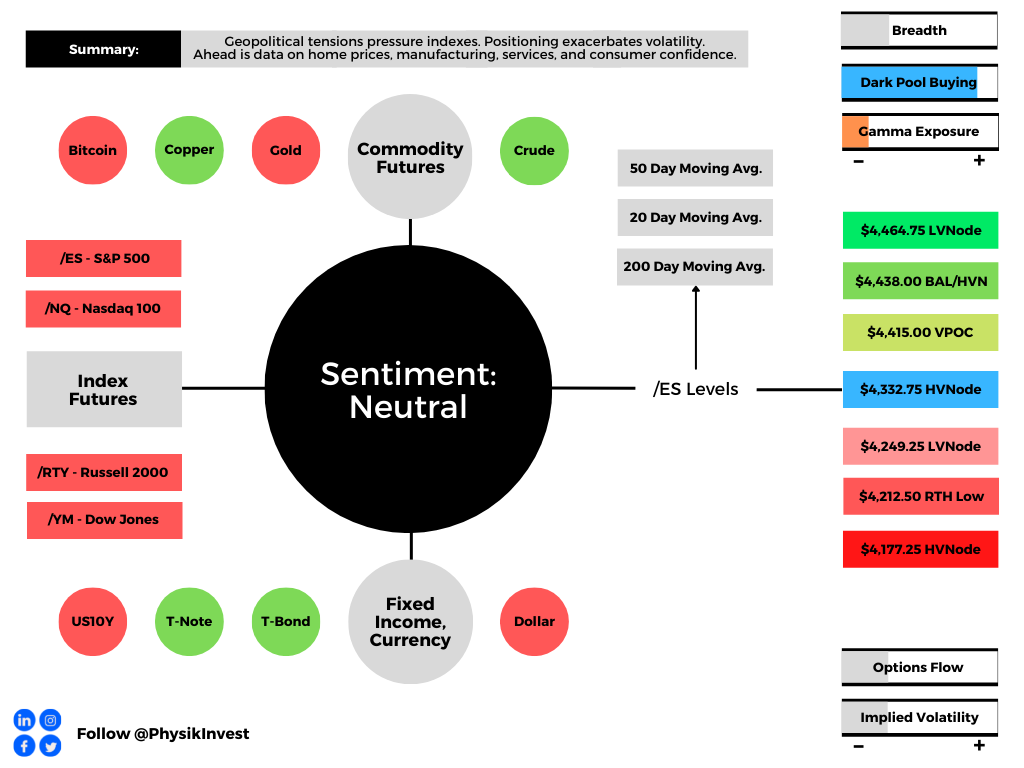
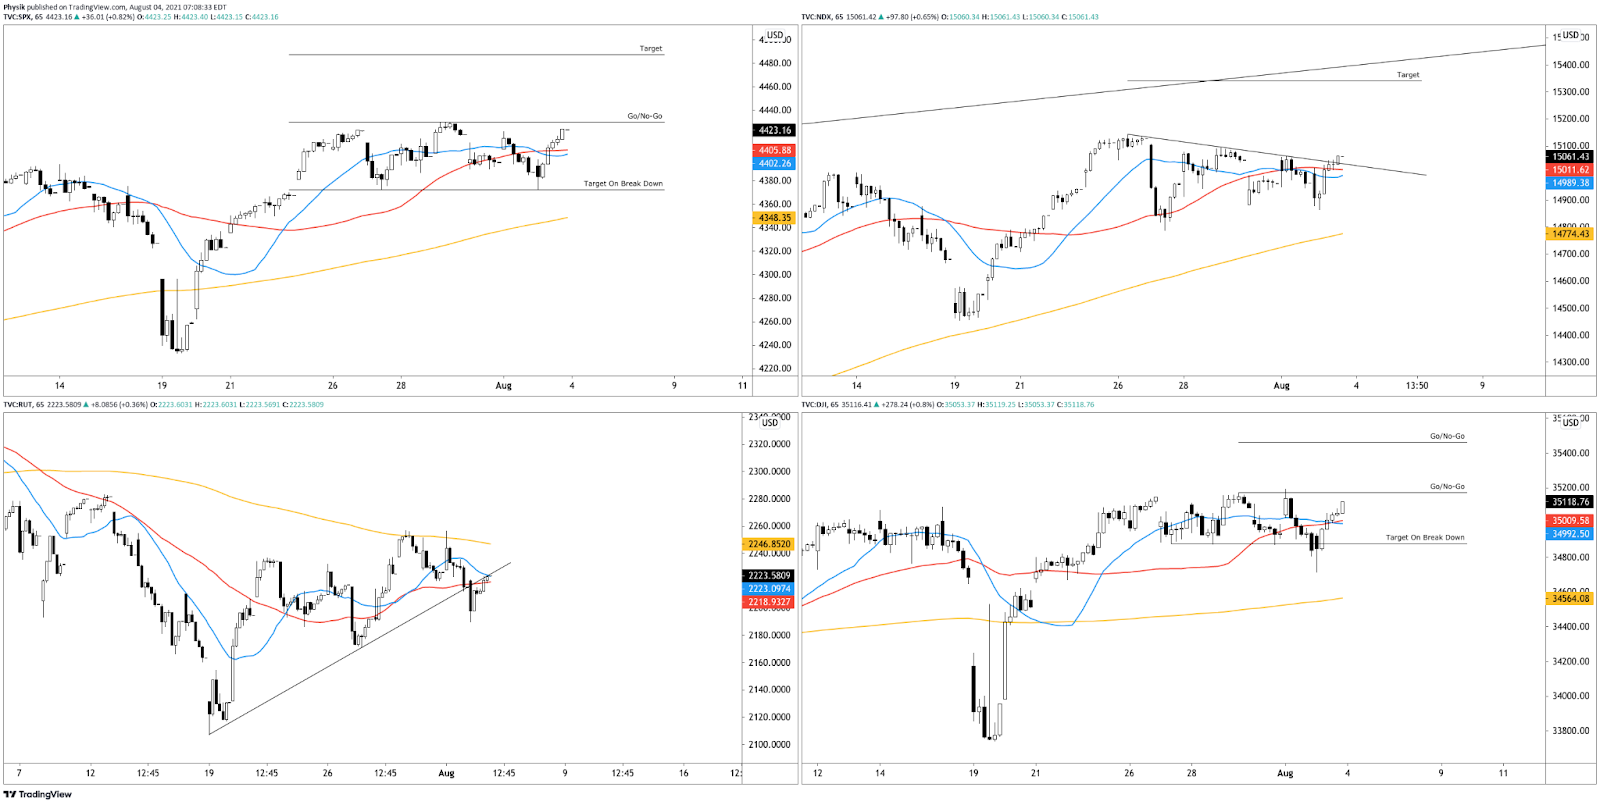
Technical: As of 5:45 AM ET, Monday’s regular session (9:30 AM – 4:00 PM ET), in the S&P 500, will likely open in the middle part of a negatively skewed overnight inventory, outside of prior-range and -value, suggesting a potential for immediate directional opportunity.

Balance-Break + Gap Scenarios: A change in the market (i.e., the transition from two-time frame trade, or balance, to one-time frame trade, or trend) is occurring.

Monitor for acceptance (i.e., more than 1-hour of trade) outside of the balance area. 

Leaving value behind on a gap-fill or failing to fill a gap (i.e., remaining outside of the prior session’s range) is a go-with indicator. 

Rejection (i.e., return inside of balance) portends a move to the opposite end of the balance.

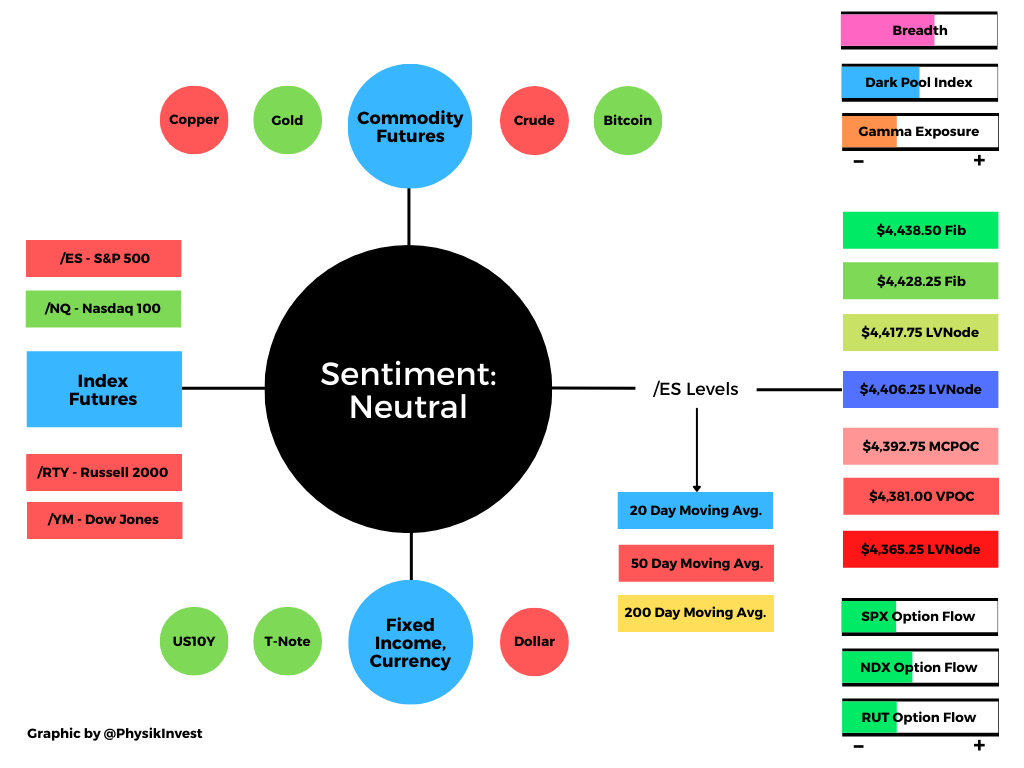
In the best case, the S&P 500 trades higher; activity above the visual $4,282.75 balance boundary puts in play the $4,319.00 untested point of control (VPOC). Initiative trade beyond the VPOC could reach as high as the $4,346.75 high volume area (HVNode) and $4,375.00 VPOC, or higher.

In the worst case, the S&P 500 trades lower; activity below the $4,282.75 balance boundary puts in play the $4,249.25 low volume area (LVNode). Initiative trade beyond the LVNode could reach as low as the $4,227.75 overnight low (ONL) and $4,177.25 HVNode, or lower.

Considerations: The $4,282.75 level has solicited mechanical responses over the past weeks.

Therefore it is considered to be a level at which short-term participants will lack the wherewithal (both emotional and financial) to respond to a successful break.

Click here to load today’s key levels into the web-based TradingView charting platform. Note that all levels are derived using the 65-minute timeframe. New links are produced, daily.
Graphic: 65-minute profile chart of the Micro E-mini S&P 500 Futures.

Definitions

Overnight Rally Highs (Lows): Typically, there is a low historical probability associated with overnight rally-highs (lows) ending the upside (downside) discovery process.

Volume Areas: A structurally sound market will build on areas of high volume (HVNodes). Should the market trend for long periods of time, it will lack sound structure, identified as low volume areas (LVNodes). LVNodes denote directional conviction and ought to offer support on any test. 

If participants were to auction and find acceptance into areas of prior low volume (LVNodes), then future discovery ought to be volatile and quick as participants look to HVNodes for favorable entry or exit.

POCs: POCs are valuable as they denote areas where two-sided trade was most prevalent in a prior day session. Participants will respond to future tests of value as they offer favorable entry and exit.

About

After years of self-education, strategy development, mentorship, and trial-and-error, Renato Leonard Capelj began trading full-time and founded Physik Invest to detail his methods, research, and performance in the markets.

Capelj is also a Benzinga finance and technology reporter interviewing the likes of Shark Tank’s Kevin O’Leary, JC2 Ventures’ John Chambers, FTX’s Sam Bankman-Fried, and ARK Invest’s Catherine Wood, as well as a SpotGamma contributor developing insights around impactful options market dynamics.

Disclaimer

Physik Invest does not carry the right to provide advice.

In no way should the materials herein be construed as advice. Derivatives carry a substantial risk of loss. All content is for informational purposes only.

Categories
Commentary

Daily Brief For February 22, 2022

Editor’s Note: The Daily Brief is a free glimpse into the prevailing fundamental and technical drivers of U.S. equity market products. Join the 200+ that read this report daily, below!

What Happened

During holiday and overnight trade, U.S. equity index futures probed below trading ranges established the week prior. Strong buying surfaced after a test of a key visual area.

Increased implied volatility (IV) to pressure markets as counterparties hedge directional risks. Present options positioning, combined with liquidity measures, suggest big moves up and down.

Ahead is data on the S&P Case-Shiller home price index and FHFA home price index (9:00 AM ET), Markit manufacturing and services PMI (9:45 AM ET), as well as the consumer confidence index (10:00 AM ET).

Graphic updated 6:40 AM ET. Sentiment Neutral if expected /ES open is inside of the prior day’s range. /ES levels are derived from the profile graphic at the bottom of the following section. Levels may have changed since initially quoted; click here for the latest levels. SqueezeMetrics Dark Pool Index (DIX) and Gamma (GEX) calculations are based on where the prior day’s reading falls with respect to the MAX and MIN of all occurrences available. A higher DIX is bullish. At the same time, the lower the GEX, the more (expected) volatility. Learn the implications of volatility, direction, and moneyness. SHIFT data used for S&P 500 (INDEX: SPX) options activity. Note that options flow is sorted by the call premium spent; if more positive, then more was spent on call options. Breadth reflects a reading of the prior day’s NYSE Advance/Decline indicator. VIX reflects a current reading of the CBOE Volatility Index (INDEX: VIX) from 0-100.

What To Expect

Fundamental: Are markets in turmoil?

Depends. Abroad, yes. At home, yes (but not as much).

Russian stocks, alongside Russia-Ukraine angst, sank the most since the 2008 financial crisis, pressuring markets in other parts of the world, as well. Russia’s MOEX Index plunged ~14% Monday.

The geopolitical disputes come alongside the threat of contractionary monetary policy. 

Graphic: Via SpotGamma. “There’s been a big pop in put volumes for the higher yield bond ETFs: JNK, HYG, and LQD. This syncs with the idea this sell-off is based mainly on rates with a side of geopolitics.”

Some, however, say the risk premium expansion driven by inflation and tightening fears has run its course. 

Graphic: G5 credit impulse suggests inflation ought to trend lower. This particular metric, per Alfonso Peccatiello of The Macro Compass, leads GDP, CPI, and market returns by quarters.

According to a note published by Andy Constan of Damped Spring Advisors, “We believe that risk premium expansion has peaked. A new low … will require more than frontrunning but Fed action that is not currently priced into markets.”

That is as Mark Haefele, chief investment officer at UBS Group AG’s (NYSE: UBS) Global Wealth Management arm says that “Despite the recent volatility, it’s important to remember that we are still in an environment of robust economic and earnings growth.”

“Our base case we expect upside for equity markets over the balance of the year.”

Graphic: Via Bloomberg. “If market dysfunction is reflected in tighter conditions, then this chart shows we’re nowhere near stressed levels — after all, central bank policy globally is historically loose.”

JPMorgan Chase & Co’s (NYSE: JPM) Mislav Matejka adds that stock pessimism is wrong and positioning for a recession would be too early given favorable financing conditions, strong labor, an underleveraged consumer, as well as strong cash flows and bank balance sheets. 

“We believe one should look through the widespread ‘slowdown’ calls that are currently in vogue, and stay bullish on banks, mining, energy, insurance, autos, travel and telecoms,” Matejka and his team wrote noting, too, that market internals are “bullish again.”

Does this mean that markets are positioned for a near-term bounce? Let’s see.

Positioning: As noted last week, passive buying flows continue to persist alongside a drop in bearish sentiment readings and bond market outflow readings which “have actually lined up closer to bottoms in the equity market.”

Graphic: Via EPFR, Barclays, and Bloomberg. Taken from The Market Ear.

This is as participants’ demand for protection (negative delta exposure) left dealers (on the other side and warehousing risk) adding negative delta exposure linearly (via stock and futures sales) to hedge.

To note, owning an option offers someone positive exposure to gamma or convexity (to have profits multiplied if the direction is correct, all else equal). On the other side, though, participants who are short gamma or convexity may have their losses multiplied if incorrect.

Making some naive assumptions on the build-in interest in options strikes at lower prices, we may surmise that dealers were exposed to increased negative gamma exposure. 

Graphic: Via Tier1Alpha. “Short Gamma Exposure -> Forces Option dealers to sell  -> Causes Higher realized volatility -> Triggering vol controlled funds to sell -> Forcing options dealers to de-risk/ and sell even more. rVol just keeps moving forcing vol control funds to sell even more.”

To hedge this, if volatility were to remain unchanged, dealers would sell (buy) into weakness (strength) to hedge increasing (decreasing) negative gamma exposure. 

If volatility rises (drops), then more stock and futures must be sold (bought/covered).

Graphic: Via Stretching Spreads. Customers indirectly taking liquidity through trading of options, in the face of a lower liquidity environment, results in more whipsaw, two-sided action. 

Moreover, Friday’s monthly options expiration (OPEX) coincided with the removal of lots of put-heavy exposures. This will decrease the dealers’ positive exposure to delta and make gamma exposures less negative.

Therefore, absent some exogenous event that increases demand for protection, again, there is the potential for strength, post-OPEX. Volatility compression would mark down dealer positive delta and therefore coincide with positive “vanna” flows that bolster attempts higher.

Technical: As of 6:30 AM ET, Monday’s regular session (9:30 AM – 4:00 PM ET), in the S&P 500, will likely open in the upper part of its overnight inventory, inside of prior-range and -value, suggesting a limited potential for immediate directional opportunity.

Gap Scenarios May Be In Play: Gaps ought to fill quickly. Should they not, that’s a signal of strength; do not fade. Leaving value behind on a gap-fill or failing to fill a gap (i.e., remaining outside of the prior session’s range) is a go-with indicator.

Auctioning and spending at least 1-hour of trade back in the prior range suggests a lack of conviction; in such a case, do not follow the direction of the most recent initiative activity.

In the best case, the S&P 500 trades higher; activity above the $4,332.75 high volume area (HVNode) puts in play the $4,415.00 untested point of control (VPOC). Initiative trade beyond the VPOC could reach as high as the $4,438.00 key response area and $4,464.00 low volume area (LVNode), or higher.

In the worst case, the S&P 500 trades lower; activity below the $4,332.75 HVNode puts in play the $4,249.00 LVNode. Initiative trade beyond the LVNode could reach as low as the $4,212.50 regular trade low (RTH Low) and $4,177.25 HVNode, or lower.

Click here to load today’s key levels into the web-based TradingView charting platform. Note that all levels are derived using the 65-minute timeframe. New links are produced, daily.
Graphic: 65-minute profile chart of the Micro E-mini S&P 500 Futures.

What People Are Saying

Definitions

Volume Areas: A structurally sound market will build on areas of high volume (HVNodes). Should the market trend for long periods of time, it will lack sound structure, identified as low volume areas (LVNodes). LVNodes denote directional conviction and ought to offer support on any test. 

If participants were to auction and find acceptance into areas of prior low volume (LVNodes), then future discovery ought to be volatile and quick as participants look to HVNodes for favorable entry or exit.

Liquidation Breaks: The profile shape suggests participants were “too” long and had poor 

Vanna: The rate at which the delta of an option changes with respect to volatility.

Charm: The rate at which the delta of an option changes with respect to time.

Options: If an option buyer was short (long) stock, he or she would buy a call (put) to hedge upside (downside) exposure. Option buyers can also use options as an efficient way to gain directional exposure.

POCs: POCs are valuable as they denote areas where two-sided trade was most prevalent in a prior day session. Participants will respond to future tests of value as they offer favorable entry and exit.

About

After years of self-education, strategy development, mentorship, and trial-and-error, Renato Leonard Capelj began trading full-time and founded Physik Invest to detail his methods, research, and performance in the markets.

Capelj is also a Benzinga finance and technology reporter interviewing the likes of Shark Tank’s Kevin O’Leary, JC2 Ventures’ John Chambers, FTX’s Sam Bankman-Fried, and ARK Invest’s Catherine Wood, as well as a SpotGamma contributor developing insights around impactful options market dynamics.

Disclaimer

Physik Invest does not carry the right to provide advice.

In no way should the materials herein be construed as advice. Derivatives carry a substantial risk of loss. All content is for informational purposes only.

Categories
Commentary

Daily Brief For August 4, 2021

Editor’s Note: On Thursday (8/5) and Friday (8/6) there will be no Daily Brief newsletter. Additionally, there will be no Weekly Brief Sunday (8/8), either. All commentaries to resume August 9, 2021.

Market Commentary

Equity index futures trade higher ahead of key fundamental events.

  • Worry dwindles and volatility ebbs.
  • Ahead: Data on jobs and services.
  • A mixed bag. Positioned for higher.

What Happened: U.S. stock index futures auctioned higher and sideways as participants discounted drivers like the COVID-19 coronavirus and China clampdown. 

At the same time, earnings are robust and stimulus remains in play; “Aside from the healthy earnings outlook, we also see equities being supported by continued monetary stimulus from the Federal Reserve and the attractiveness of stocks relative to low bond yields,” said Mark Haefele of UBS Group AG (NYSE: UBS). “Cyclicals are expected to benefit from the shift in consumer spending away from pandemic winners such as mega-cap tech.”

Ahead is data on ADP employment, Markit services PMI, and the ISM services index.

Graphic updated 6:30 AM ET. Sentiment Neutral if expected /ES open is inside of the prior day’s range. See here for more on the Dark Pool Index and Gamma. A positive Dark Pool Index reading is bullish. At the same time, the higher (lower) the gamma, the less (more) volatility. SHIFT Search data used for options activity. Note that options flow is sorted by the call premium spent; if green and more (less) positive then more (less) was spent on call options. Breadth reflects a reading of the prior day’s Advance/Decline indicator.

What To Expect: As of 6:30 AM ET, Wednesday’s regular session (9:30 AM – 4:00 PM EST) in the S&P 500 will likely open just inside of prior-range and -value, suggesting a limited potential for immediate directional opportunity.

Adding, during the prior day’s regular trade, the best case outcome occurred after a repair of the $4,370.50 minimal excess low; after testing the low (a level which corresponded with a volume-weighted average price or VWAP anchored from the July 19 swing low), responsive buyers initiated a rally that pushed prices to a higher close, away from value. 

Excess: A proper end to price discovery; the market travels too far while advertising prices. Responsive, other-timeframe (OTF) participants aggressively enter the market, leaving tails or gaps which denote unfair prices.

More On Volume-Weighted Average Prices (VWAPs): A metric highly regarded by chief investment officers, among other participants, for quality of trade. Additionally, liquidity algorithms are benchmarked and programmed to buy and sell around VWAPs.

In doing so, participants negated all of Monday’s selling which, as stated Tuesday, was not supported by value or strong metrics with respect to breadth and market liquidity

Coming into today’s session, opportunity resides in the S&P 500, Nasdaq 100, and Dow Jones Industrial Average; indices are trading at key go/no-go levels. 

Further up movement puts in play balance-area breakouts. In such a case, the modus operandi shifts from responsive trade (i.e., fade the edges) to initiative trade (i.e., play the break). Failure to expand range portends a rotation back into balance. 

Balance (Two-Timeframe Or Bracket): Rotational trade that denotes current prices offer favorable entry and exit. Balance-areas make it easy to spot a change in the market (i.e., the transition from two-time frame trade, or balance, to one-time frame trade, or trend).

Below are some rough levels to base expectations around. The width of the balance area, projected off the high end of the balance, is the typical target in such a breakout (e.g., $4,490 SPX cash).

Graphic: 65-minute candlestick charts of the cash-settled S&P 500 (INDEX: SPX), Nasdaq 100 (INDEX: NDX), Russell 2000 (INDEX: RUT), and Dow Jones Industrial Average (INDEX: DJI).

Moreover, for today, participants can trade from the following frameworks. 

In the best case, the S&P 500 trades sideways or higher; activity above the $4,406.25 low volume area (LVNode) pivot puts in play the $4,417.75 LVNode. Initiative trade beyond the $4,417.75 LVNode could reach as high as the $4,428.25 and $4,438.50 Fibonacci price extensions.

In the worst case, the S&P 500 trades lower; activity below the $4,406.25 LVNode puts in play the $4,392.75 micro-composite point of control (MCPOC). Initiative trade beyond the MCPOC could reach as low as the $4,381.75 untested point of control (VPOC) and $4,365.25 LVNode.

Volume Areas: A structurally sound market will build on past areas of high volume. Should the market trend for long periods of time, it will lack sound structure (identified as a low volume area which denotes directional conviction and ought to offer support on any test). 

If participants were to auction and find acceptance into areas of prior low volume, then future discovery ought to be volatile and quick as participants look to areas of high volume for favorable entry or exit.

POCs: POCs are valuable as they denote areas where two-sided trade was most prevalent. Participants will respond to future tests of value as they offer favorable entry and exit.
Graphic: 65-minute profile chart of the Micro E-mini S&P 500 Futures. Graphic updated 6:30 AM ET.

News And Analysis

Markets primed for Powell second term at risk from surprise pick.

China typhoons create latest supply-chain threat as ports close.

Economic data positive for risk but business cycle risks building.

New York City to require proof of vaccination for indoor activities.

Asia-Pacific on track for a strong rebound although scars will last.

What People Are Saying

About

After years of self-education, strategy development, and trial-and-error, Renato Leonard Capelj began trading full-time and founded Physik Invest to detail his methods, research, and performance in the markets. 

Additionally, Capelj is a finance and technology reporter. Some of his biggest works include interviews with leaders such as John Chambers, founder and CEO, JC2 Ventures, Kevin O’Leary, businessman and Shark Tank host, Catherine Wood, CEO and CIO, ARK Invest, among others.

Disclaimer

At this time, Physik Invest does not manage outside capital and is not licensed. In no way should the materials herein be construed as advice. Derivatives carry a substantial risk of loss. All content is for informational purposes only.