Categories
Commentary

Market Commentary For 2/11/2021

Notice: To view this week’s big picture outlook, click here.

What Happened: After a volatile Wednesday, U.S. stock index futures rose alongside fiscal stimulus and vaccine optimism, ahead of releases that would shine light on the labor market recovery.

What Does It Mean: After a gap open, participants sold stock indexes into prior value, yesterday.

This comes ahead of the large February monthly options expiration (OPEX), after which, the interest at the $3,900.00 S&P 500 option strike will roll-off. As a result, stickiness near the $3,900.00 high-volume area (HVNode) will likely cease in the absence of option hedging requirements.

More On Volume Areas: A structurally sound market will build on past areas of high-volume. Should the market trend for long periods of time, it will lack sound structure (identified as a low-volume area which denotes directional conviction and ought to offer support on any test).

If participants were to auction and find acceptance into areas of prior low-volume, then future discovery ought to be volatile and quick as participants look to areas of high-volume for favorable entry or exit. 
Pictured: Micro E-mini S&P 500 Future.

Further, we have numerous pieces of context to unpack prior to getting into today’s outlook on trade.

First, the v-pattern recovery after the recent de-risking event suggests room for higher. Second, the market is stuck in a long-gamma environment that favors less volatility (as witnessed during Wednesday’s muted intra-day sell-off and recovery). Third, the S&P 500 is trading just shy of $3,940.00, a primary upside target based on a multi-month balance-area projection.

More On The V-Pattern: A pattern that forms after a market establishes a high, retests some support, and then breaks above said high. In most cases, this pattern portends continuation. 

More On Gamma: Gamma is the sensitivity of an option to changes in underlying price. Dealers that take the other side of option trades hedge their exposure to risk by buying and selling the underlying. 

When dealers are short-gamma, they hedge by buying into strength and selling into weakness. When dealers are long-gamma, they hedge by selling into strength and buying into weakness. The former exacerbates volatility. The latter calms volatility.
Graphic 1: SpotGamma data suggests S&P 500 at or above “Long-Gamma” juncture.

What To Expect: Thursday’s regular session (9:30 AM – 4:00 PM ET) will likely open inside of prior-range, suggesting limited potential for immediate directional opportunity.

Adding, given dynamics discussed in the prior section, the odds of substantial change are low, so long as broad market indices, like the S&P 500, remain range bound. Also, trading in a prominent area of high-volume ($3,900.00) will likely make for a volatile session as such areas denote the market’s most recent perception of value and offer favorable entry and exit, hence the two-sided trade.

Going forward, participants will look to the overnight rally-high at $3,928.25, and low-volume structure beneath the $3,880.00 HVNode, which offered responsive buyers favorable entry during Wednesday’s intraday liquidation break.

More On Overnight Rally Highs: Typically, there is a low historical probability associated with overnight rally-highs ending the upside discovery process.

More On Liquidation Breaks: The profile shape in the S&P 500 suggests participants were “too” long and had poor location.

Knowing participants are doing a good job of defending their ~7% advance, a non-typical weekly trading range, after taking out the 127.20% price extension, a typical recovery target, and leaving minimal excess (i.e., a proper end to price discovery) at the high, odds point to the increased potential for higher trade or balance in the coming session(s).

That said, the following frameworks apply.

In the best case, the S&P 500 remains rotational, at or above the $3,900.00 HVNode. In the worst case, any break that finds increased involvement (i.e., supportive flows and delta) below the $3,880.00 HVNode, would favor continuation as low as the $3,830.75 HVNode.

Major change will be identified with trade above the $3,928.25 overnight rally-high, and below the $3,878.50 regular-trade low.

Levels Of Interest: $3,928.25 overnight rally-high, $3,900.00 HVNode, $3,878.50 regular-trade low.

Categories
Commentary

Market Commentary For 2/10/2021

Notice: To view this week’s big picture outlook, click here.

What Happened: Alongside optimism around an economic rebound, U.S. stock index futures established record all-time highs, overnight, before trading back into range.

What Does It Mean: On the heels of a de-risking event and v-pattern recovery, indices, like the S&P 500, maintained higher prices.

This price action occurred in the face of bearish undercurrents, highlighted in past commentary.

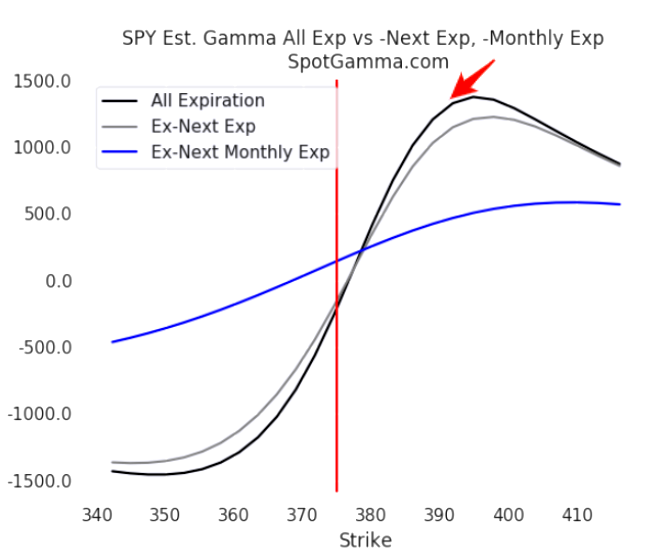
Important to note, however, is a pick up in call-side activity in the SPDR S&P 500 ETF Trust (NYSE: SPY), the largest ETF that tracks the S&P 500. This comes alongside the S&P 500’s re-entry into long-gamma (Graphic 1) and rotation near the $3,900 high-open interest strike.

Further, the addition of derivative exposure at higher strikes (Graphic 2), farther out in time, suggests an inclination by participants to maintain long exposure through February’s monthly options expiration (OPEX), a day that often marks an end to pinning (which we’ve seen over the past week).

More On The V-Pattern: A pattern that forms after a market establishes a high, retests some support, and then breaks above said high. In most cases, this pattern portends continuation. 

More On Gamma: Gamma is the sensitivity of an option to changes in underlying price. Dealers that take the other side of option trades hedge their exposure to risk by buying and selling the underlying. 

When dealers are short-gamma, they hedge by buying into strength and selling into weakness. When dealers are long-gamma, they hedge by selling into strength and buying into weakness. The former exacerbates volatility. The latter calms volatility.
Graphic 1: SpotGamma data suggests S&P 500 at or above “Long-Gamma” juncture.
Graphic 2: Option Order Flow.

What To Expect: Wednesday’s regular session (9:30 AM – 4:00 PM ET) will likely open outside of prior-balance and -range, suggesting the potential for immediate directional opportunity.

This comes after participants traversed over 7%, a non-typical weekly trading range, taking out the 127.20% price extension, a typical recovery target.

Given how far the discovery process has come, attention is drawn to the overnight high. Typically, there is a low historical probability associated with overnight rally-highs ending the upside discovery process. Add on the fact that Tuesday’s regular trade left minimal excess (i.e., a proper end to price discovery) at the high, odds point to the increased potential for higher trade or balance in the coming session(s).

Given that reference, the following frameworks apply.

In the best case, the S&P 500 does some backfilling to repair poor structures left in the wake of strong initiative buying overnight. In such a case, participants would look for responsive buying to surface at or above the $3,912.25 regular-trade high.

In the worst case, any break that finds increased involvement (i.e., supportive flows and delta) below the $3,908.75 high-volume area (HVNode), would favor continuation as low as the $3,900.00 and $3,880.00 HVNodes.

More On Volume Areas: A structurally sound market will build on past areas of high-volume. Should the market trend for long periods of time, it will lack sound structure (identified as a low-volume area which denotes directional conviction and ought to offer support on any test). 

If participants were to auction and find acceptance into areas of prior low-volume, then future discovery ought to be volatile and quick as participants look to areas of high-volume for favorable entry or exit.

Levels Of Interest: $3,908.75 HVNode.

Categories
Commentary

Market Commentary For 2/5/2021

Notice: To view this week’s big picture outlook, click here.

What Happened: Ahead of data on employment, alongside the passage of a budget plan to advance $1.9 trillion in COVID aid, U.S. stock index futures rose overnight.

What Does It Mean: Given a v-pattern recovery, U.S. stock indexes are positioned for further upside, as high as the 100% price projection, which happens to be near $4,000.00 in the S&P 500.

This positive price action is happening in the context of bearish undercurrents as evidenced by non-participatory speculative flows, delta (i.e., non-committed buying as measured by volume delta), and a divergence in DIX, a proxy for buying derived from short sales (i.e., liquidity provision on the market making side).

Since price pays, participants ought to discount these undertones and position themselves for further upside discovery.

What To Expect: Friday’s regular session (9:30 AM – 4:00 PM ET) will likely open outside of prior-balance and -range, suggesting the potential for immediate directional opportunity.

Currently, the S&P 500 is rotating below the $3,884.75 projection, a typical target on a break from balance. Below current price lies Thursday’s $3,855.00 Virgin Point Of Control, or VPOC (i.e., the fairest price to do business in a prior session).

Noting: POCs (like HVNodes described below) are valuable as they denote areas where two-sided trade was most prevalent. Participants will respond to future tests of value as they offer favorable entry and exit.

Further below is a the $3,840.25 HVNode. As stated in prior sessions, HVNodes can be thought of as building blocks — they also denote areas of supply and demand. The primary strategy is to respond to probes into these supply (i.e., selling responsively) and demand (i.e., buying responsively) areas as they offer favorable entry and exit.

In the coming session, participants will want to pay attention to Thursday’s end-of-day spike and overnight all-time high (ONH).

Spike’s mark the beginning of a break from value and, in this case, would support the bullish thesis as long as participants, during regular trade, spend time above the spike base ($3,857.75). Adding, there is a low historical probability that overnight rally-highs end the upside discovery process.

For today, the following frameworks ought to be applied.

In the best case, the market will remain above, or find acceptance at (in the form of rotational trade) the $3,857.75 spike base. In the worst case, responsive sellers appear and restart the downside discovery process.

A break above the $3,886.25 ONH, participants may see discovery as high as $3,900.00, a balance-area extension (i.e., another balance-break target). A break below the prior RTH Low ($3,830.25), participants may see prices as low as the $3,799.00 balance-area low.

Levels Of Interest: $3,886.25 ONH, $3,857.75 spike base, $3,830.25 RTH Low.

Categories
Commentary

Market Commentary For 2/3/2021

Notice: To view this week’s big picture outlook, click here.

What Happened: After strong earnings from Amazon.com Inc (NASDAQ: AMZN) and Alphabet Inc (NASDAQ: GOOGL), alongside stimulus optimism, market participants traded responsively in Tuesday’s regular trading range, suggesting an acceptance of higher prices.

What Does It Mean: Late last week, market’s were in a good position for downside discovery. Since then however, conditions have changed markedly.

Further, given the retracement, the S&P 500, in particular, is in a position to digest the recent advance. In other words, two-sided trade that repairs some of the poor structures (as evidenced by low-volume areas) left in the wake of initiative buying would be the most positive outcome.

In the simplest way, high-volume areas can be thought of as building blocks. A structurally sound market will build on past areas of high-volume. Should the market trend for long periods of time, it will lack sound structure. If participants were to auction and find acceptance into areas of prior low-volume, then future discovery ought to be volatile and quick as participants look to areas of value for favorable entry or exit.

What To Expect: Wednesday’s regular session (9:30 AM – 4:00 PM ET) will likely open inside of prior-balance and -range, suggesting limited potential for directional opportunity and high volatility.

Currently, the S&P 500 is rotating at the $3,842.00 high-volume area (HVNode).

As stated, HVNodes can be thought of as building blocks — they also denote areas of supply and demand. In this case, $3,842.00 can be thought of as an area of supply. The primary strategy is to respond to probes into these supply (i.e., selling responsively) and demand (i.e., buying responsively) areas as they offer favorable entry and exit.

Important to add is the presence of divergent speculative flows (Graphic 1) and the decline in a proxy for buying derived from short sales (i.e., liquidity provision on the market making side), per Graphic 2.

Graphic 1: Speculative derivatives activity for February 2, 2021.
Graphic 2: DIX by SqueezeMetrics suggests divergence between price and buying intact.

Given that the market will likely open in-range, participants should look to whether the advance holds (i.e., a market will transition from up and down, to sideways trade). Holding the gap would suggest initiative buyers are in control, near-term. Auctioning below Tuesday’s regular-trade low ($3,799.00) would be the most negative outcome.

In the best case, the market will initiate above, or find acceptance at (in the form of rotational trade) the $3,842.00 HVNode. In the worst case, responsive sellers appear and restart the downside discovery process. Any break that finds increased involvement below the $3,799.00 regular-trade low, would favor continuation as low as the $3,727.75 HVNode.

The go/no-go for upside is the $3,843.50 overnight-trade high. The go/no-go for downside is $3,799.00 regular-trade low. Anything in-between portends responsive, non-directional trade.

Levels Of Interest: $3,843.50 ONH, $3,799.00 regular-trade low.

Categories
Commentary

Market Commentary For 2/2/2021

Notice: To view this week’s big picture outlook, click here.

What Happened: Ahead of big earnings from Exxon Mobil Corporation (NYSE: XOM), Amazon.com Inc (NASDAQ: AMZN), Alphabet Inc (NASDAQ: GOOGL), alongside stimulus optimism, initiative buyers extended Monday’s broad market rally overnight.

What Does It Mean: Despite being in a good position for downside discovery due to deleveraging, inversion of the VIX term structure, a shift into short-gamma, and a rise in purchases of downside protection with time, market participants responded to probes into prior value.

As a result, stock indexes are at an interesting juncture. The S&P 500, in particular, took back all of Friday’s selling, and is now resting at the $3,794.75 high-volume node (HVNode).

What To Expect: Tuesday’s regular session (9:30 AM – 4:00 PM ET) will likely open on a gap, outside of prior-balance and -range, suggesting the potential for directional opportunity and high volatility.

Currently, the S&P 500 is rotating around the $3,794.75 HVNode.

As stated in the past, high-volume areas can be thought of as building blocks. A structurally sound market will build on past areas of high-volume. If participants were to auction and find acceptance into areas of prior low-volume (as they did Monday), then future discovery ought to be volatile and quick (as it was) as participants look to areas of high-volume for favorable entry or exit (where we are at now).

Given that the market will likely open on another gap, participants should look to whether the advance holds (i.e., a market will transition from up and down, to sideways trade). Holding the gap would suggest initiative buyers are in control, near-term. Auctioning below Monday’s regular-trade high ($3,777.00) would be the most negative outcome.

In the best case, the market will initiate and find acceptance (in the form of rotational trade) above the $3,794.75 HVNode.

In the worst case, responsive sellers appear and continue the downside discovery process. Any break that finds increased involvement below the $3,727.75 HVNode, would favor continuation as low as the $3,611.50 and $3,556.00 HVNodes.

The second to last HVNode corresponds with the $361 SPY put concentration, which may serve as a near-term target, or bottom, for this sell-off, given last week’s activity at that strike (below graphic).

Graphic: Physik Invest maps out the purchase of call and put options in the SPDR S&P 500 ETF Trust, for the week ending January 30, 2021.

The go/no-go for upside is the $3,804.00 overnight-trade high. The go/no-go for downside is $3,717.25 regular-trade low. Anything in-between portends responsive, non-directional trade.

Levels Of Interest: $3,804.00 ONH, $3,717.25 regular-trade low.

Categories
Commentary

Market Commentary For 2/1/2021

Notice: To view this week’s big picture outlook, click here.

What Happened: As investors looked to another round of earnings, amidst a popularized retail stock buying frenzy, U.S. index futures tested lower and returned violently into Friday’s regular trading range.

What Does It Mean: After signs of deleveraging, inversion of the VIX term structure, a shift into short-gamma, and a rise in purchases of downside protection with time, U.S. stock indexes are best positioned for downside discovery.

However, after the best case scenario — the S&P 500 taking back Friday’s liquidation and auctioning above the $3,727.75 high-volume area (HVNode) — was realized in overnight trade, participants can expect continued balance on supportive speculative flows and delta (e.g., committed buying as measured by volume delta).

What To Expect: Monday’s regular session (9:30 AM – 4:00 PM ET) will likely open inside of prior-balance and -range, suggesting limited directional opportunity and high volatility.

As a result, participants ought to zoom out, and look for valuable areas to transact, such as those highlighted zones in Graphic 1 which denote high-volume areas.

A structurally sound market will build on past areas of high-volume. Should the market trend for long periods of time, it will lack sound structure (identified as a low-volume area which denotes directional conviction and ought to offer support on any test). 

If participants were to auction and find acceptance into areas of prior low-volume, as they have in the week prior, then future discovery ought to be volatile and quick as participants look to areas of value for favorable entry or exit.

Graphic 1: 4-hour profile chart of the Micro E-mini S&P 500 Futures.

In the best case, the market will initiate and find acceptance (in the form of rotational trade) above the $3,767.75 high-volume node.

In the worst case, responsive sellers appear and continue the downside discovery process. Any break that finds increased involvement (i.e., supportive flows and delta) below the $3,689.50 HVNode, would favor continuation as low as the $3,611.50 and $3,556.00 HVNodes.

The second to last HVNode corresponds with the $361 SPY put concentration, which may serve as a near-term target, or bottom, for this sell-off, given last week’s activity at that strike (Graphic 2).

Graphic 2: Physik Invest maps out the purchase of call and put options in the SPDR S&P 500 ETF Trust, for the week ending January 30, 2021.

The go/no-go for upside is the $3,770.50 regular-trade high. The go/no-go for downside is $3,685.50 regular-trade low. Anything in-between portends responsive, non-directional trade.

Levels Of Interest: $3,770.50 regular-trade high, $3,767.75 HVNode, $3,685.50 regular-trade low.

Categories
Commentary

Market Commentary For 1/29/2021

Notice: To view this week’s big picture outlook, click here.

What Happened: After a slew of the earnings reports by heavily weighted index constituents, U.S. index futures further accepted lower prices.

What Does It Mean: Earlier in the week, the S&P 500 failed to drum up initiative buying after an upside break of the $3,852.50 ledge. Participants sold the break, introducing excess (which forms after an auction has traveled too far in a particular direction and portends sustained reversal) and acceptance below the $3,824.00 – $3,763.75 balance-area. This invalidated last week’s break-out to new highs.

Since then, market participants were witness to violent two-sided trade, a result of the market moving into a short-gamma environment (graphic 1); in such cases dealers hedge their derivatives exposure by buying into strength and selling into weakness. This, alongside the presence of short-term traders in U.S. equities (as evidenced by selling that transpired at yesterday’s high, since institutions tend not to transact at exact technical levels) will exacerbate volatility.

Graphic 1: SpotGamma data suggests S&P 500 has entered short-gamma environment

Adding, it’s important to bring back yesterday’s graphics that showed a proxy for buying derived from short sales (i.e., liquidity provision on the market making side) decline and a substantial change in tone in terms of speculative derivatives activity.

Since posting graphics 2 and 3, the bearish thesis is still intact. This is due to the divergent speculative flows and delta (e.g., presence of non-committed buying or selling as measured by volume delta) during Thursday’s session, as can be viewed in Graphic 4. This information means that the short-covering rally that lasted much of yesterday’s regular trade was not supported; increased capital was not committed into yesterday’s highs.

Graphic 2: Speculative derivatives activity for January 27, 2021
Graphic 3: DIX by Squeeze Metrics suggests large divergence between price and buying
Graphic 4: Divergent Delta in the SPDR S&P 500 ETF (NYSE: SPY), the largest ETF that tracks the S&P 500

What To Expect: Friday’s regular session (9:30 AM – 4:00 PM ET) will likely open inside of prior-balance and -range, suggesting limited directional opportunity.

Given today’s month-end derivatives expiry and yesterday’s acceptance inside of the $3,824.00 – $3,763.75 balance-area, the odds of substantial downside during Friday’s session is low. Instead, participants should position themselves for two-sided, responsive trade.

Still, because the market initiated out of balance, lower, responsive sellers have been emboldened. As a result, participants ought to respond to probes into value. Therefore, as long as the S&P 500 remains below the $3,794.75 high-volume node (HVNode), an area that offers favorable entry and exit, the bearish narrative remains intact.

The go/no-go for upside is the $3,823.75 regular-trade high. The go/no-go for downside is $3,721.00 overnight low. Anything in-between portends responsive, non-directional trade.

Above $3,823.75 puts in play the $3,842.00 HVNode. Below $3,721.00 , participants ought will look to respond to the $3,611.50 and $3,556.00 HVNodes, in the worst case.

Graphic 5: 4-hour profile chart of the Micro E-mini S&P 500 Futures

Levels Of Interest: $3,823.75 regular-trade high, $3,721.00 overnight low.

Categories
Commentary

Market Commentary For 1/26/2021

Notice: To view this week’s big picture outlook, click here.

What Happened: After a brief liquidation during Monday’s session, U.S. index futures traded flat overnight, with the S&P 500 rotating within an 8-session balance-area.

What Does It Mean: During Monday’s regular trade in the S&P 500, market participants were unable to break through to new highs; profile structures denoted a market that wasn’t paying longs that were late to the party.

Further, the Monday morning liquidation cleared the inventory of those participants that bought too much, repairing some poor structures left in the wake of last week’s upside discovery.

Given that the $3,824.25 balance-area high (BAH) was rejected, upside conviction remains intact (graphics 1 and 2 confirm this).

As a result, attention is drawn to the $3,852.50 ledge which has attracted responsive sellers numerous times over the past 8-sessions.

Graphic 1: Order flow in the SPDR S&P 500 ETF Trust (NYSE: SPY), the largest ETF that tracks the S&P 500
Graphic 2: Speculative derivatives activity for Monday, January 25

What To Expect: Tuesday’s regular session (9:30 AM – 4:00 PM ET) will likely open inside of prior-balance and -range, suggesting higher volatility and limited directional opportunity.

As stated earlier, participants have to contend with the $3,852.50 ledge. In today’s session, (1) a lack of upside continuation increases confidence among responsive sellers to transact below the ledge or (2) the level cracks, and initiative buying surfaces. In the latter case, the best outcome would include a test of the $3,859.75 overnight all-time high (there is a low probability that overnight all-time highs end the upside discovery process) and $3,884.75 price projection, or double the width of the balance-area, the typical target on a balance-area breakout.

The go/no-go for upside is the $3,852.50 ledge. The go/no-go for downside is $3.821.50 overnight low.

Levels Of Interest: $3,852.50 ledge, $3.821.50 overnight low.

Categories
Commentary

Market Commentary For The Week Ahead: ‘Follow The Flow’

Key Takeaways:

What Happened: After prices were advertised below balance in the week prior, responsive buyers in the S&P 500 began a rally that found acceptance back inside a larger balance-area, near the $3,800 high-open interest strike.

Thereafter, initiative buyers extended the S&P 500’s rally, breaking the index above its $3,824.25 balance-area high (BAH), before establishing acceptance near the $3,850.00 price extension, an upside target, and auctioning back into range, repairing poor structures left in the wake of discovery.

What Does It Mean: In light of a failed breakdown in the week prior, U.S. stock indexes were best positioned for further downside discovery. However, after what appears to be aggressive buying in response to prices below value, it was clear that was not the case.

This leads to the following question: why did selling stop on January 15? One answer, aside from a positive start to the earnings season and prospects for further stimulus, may be OPEX, the January 15 option expiry. On expiration days, delta and gamma exposures change — depending on how derivatives exposure is removed or rolled — which causes dealers to adjust hedges.

According to SpotGamma, the January 15 expiry “resulted in a ~50% reduction in single stock gamma … [which] creates volatility because, as large options positions expire[], are closed and/or rolled, dealers have large hedges they need to adjust. There is a trove of data to suggest that the bulk of single stock call activity is long calls, and based on that we believe dealers (who are short calls vs long stock) therefore have long stock positions to sell.”

Put more simply, the price action may have been attributable to the sale of long stock that hedged expiring short derivatives exposure above the market (i.e., call side).

Per the SpotGamma S&P 500 dealer hedging graphic for the January 15 expiry below, “The black line was the mark on Thursday evening, with the red line being the forecasted position on Tuesday. This red line being substantially lower than the black suggests that dealers had to reduce delta exposure as a result of expiration. Note there is a larger shift at overhead prices suggesting this was a ‘call heavy’ expiration.”

Graphic 1: SpotGamma S&P 500 dealer hedging graphic for the January 15 options expiry

After the VIX (i.e., CBOE’s Volatility Index) expiry on January 20, alongside the inauguration of President Joe Biden, the prospects for a rally improved as “event premium in IV dries up … [and] put values drop, which allows dealers (who are short puts) to buy back short hedges … [fueling] a quick rally up to the 3850SPX/385SPY level (green arrow).”

Graphic 2: SpotGamma S&P 500 Gamma Levels

Adding, the number of put options sold to open exceeded the number bought to open, per SpotGamma, suggesting increased confidence in higher prices as market participants look to options for income, and not insurance.

Historically, the returns after such developments are mixed — more often the appearance of strong initiative buying surfaces (e.g., August and January 2020) before a liquidation helps correct excess inventory, and bring sense back into the market.

Graphic 3: SpotGamma plots opening option positions.

What To Expect: During Friday’s session in the S&P 500, responsive buying surfaced after a test of the $3,818.25 High-Volume Node (HVNode), above the $3,813.50 ledge (below which is a pocket of low-volume).

In the simplest way, high-volume areas can be thought of as building blocks. A structurally sound market will build on past areas of high-volume. Should the market trend for long periods of time, it will lack sound structure (identified as a low-volume area which denotes directional conviction and ought to offer support on any test).

If participants were to auction and find acceptance into areas of prior low-volume, then future discovery ought to be volatile and quick as participants look to areas of value for favorable entry or exit.

After the S&P 500 found acceptance above the $3,813.50 ledge and $3,824.25 BAH, it encountered responsive selling near the $3,840.75 HVNode, the site of a downtrend line. Since the selling transpired at a visual level, market participants know that technically-driven, short-term traders in control. In other words, institutions (e.g, funds) tend not to transact at exact technical levels.

Given the aforementioned dynamics, participants will come into Monday’s session knowing the following:

  1. The S&P 500’s higher-time frame breakout remains intact, per graphics 7, 8, and 9.
  2. Late last year, JPMorgan Chase & Co. (NYSE: JPM) strategist Marko Kolanovic suggested equities would rally with the S&P 500 auctioning as high as $4,000 on the basis of low rates, improved fundamentals, buybacks, as well as systematic and hedge fund strategies. Since then, Kolanovic downgraded growth and expressed the limited potential for further upside.
  3. The earnings of heavily weighted index constituents suggests participants discount improved speculative flows and delta (e.g., presence of committed buying or selling as measured by volume delta). Please see graphics 4, 5, and 6.
Graphic 4: Supportive order flow in the SPDR S&P 500 ETF Trust (NYSE: SPY), the largest ETF that tracks the S&P 500, on January 20 trend day.
Graphic 5: Supportive order flow in the SPDR S&P 500 ETF Trust (NYSE: SPY), the largest ETF that tracks the S&P 500, on January 22.
Graphic 6: Speculative derivatives activity for the week ending January 23, 2021.
Graphic 7: Daily candlestick chart of the cash S&P 500 Index

Given the above dynamics, the following frameworks apply for next week’s trade.

In the best case, the S&P 500 takes back Friday’s liquidation and auctions above the $3,840.75 HVNode. Expectations thereafter include continued balance or initiative buying to take out the $3,859.75 overnight all-time high (there is a low probability that overnight all-time highs end the upside discovery process). Thereafter buying continues as high as the $3,884.75 price projection, or double the width of the balance-area, the typical target on a balance-area breakout.

In the worst case, any break that finds increased involvement (i.e., supportive flows and delta) below $3,824.25 BAH, would favor continuation as low as the $3,763.75 BAL.

Graphic 8: Profile overlays on a 15-minute candlestick chart of the Micro E-mini S&P 500 Futures

Conclusions: Despite broad-market indices being in a longer-term uptrend, the odds of substantial upside resolve are low. Participants ought to look for favorable areas to transact, such as those high-volume areas in the S&P 500 featured in graphic 8.

All in all, the risk and reward dynamics, at these price levels, are poor.

Graphic 9: 4-hour profile chart of the Micro E-mini S&P 500 Futures

Levels Of Interest: $3,884.75, $3,859.75, $3,840.75 HVNode, $3,824.25 BAH, $3,763.75 BAL.

Cover photo by Jayant Kulkarni from Pexels.

Categories
Commentary

Market Commentary For The Week Ahead: ‘Rally On Pause’

Key Takeaways:

What Happened:

Alongside mixed economic releases, plans for added fiscal stimulus, as well as a start to the Q4 earnings season, U.S. index futures broke balance and auctioned lower.

Given that Friday’s worst case scenario was realized, U.S. stock indexes are positioned for further downside discovery.

Graphic 1: Profile overlays on a 30-minute candlestick chart of the Micro E-mini S&P 500 Futures

What To Expect: Friday’s session in the S&P 500 found responsive buying surface after a test of the $3,741.25 Virgin Point of Control, or VPOC (i.e., the fairest price to do business in a prior session).

Noting: POCs are valuable as they denote areas where two-sided trade was most prevalent. Participants will respond to future tests of value as they offer favorable entry and exit.

In the simplest way, high-volume areas can be thought of as building blocks. A structurally sound market will build on past areas of high-volume. Should the market trend for long periods of time, it will lack sound structure. If participants were to auction and find acceptance into areas of prior low-volume, then future discovery ought to be volatile and quick as participants look to areas of value for favorable entry or exit.

Thereafter, buying pressure quickly disappeared, and the S&P 500 confirmed the balance-break. Now, in light of the market’s search for an area to establish balanced, two-sided trade, participants will come into Tuesday’s session knowing the following:

  1. Prior to a multi-session consolidation, profile structures denoted the presence of short-covering. This was the result of old, weak-handed business emotionally buying to cover short positions, causing swift movement, followed by a stalled advance, or two-sided trade.
  2. Unsupportive speculative flows and delta (e.g., non-presence of committed buying or selling) in some instances, as can be viewed by the order flow graphics 2 and 3 below.
  3. The multi-month upside breakout targeting S&P 500 prices as high as $4,000.00 remains intact, per graphic 4.
  4. After a v-pattern recovery, the S&P 500 consolidated near the $3,800 high-open interest strike, forming a balance-area. This structure was resolved with Friday’s balance-break. A break-out from balance is usually the start of a short-term auction. Therefore, placing trades in the direction of the break is the normal course of action. Trading back into the consolidation (above $3,763.75), thereby invalidating the break-out, may portend a move to the other end of balance ($3,824.25).
Graphic 2: Divergent delta in the iShares Russell 2000 ETF (NYSE: IWM), one of the largest ETFs that track the Russell 2000
Graphic 3: Order flow in the SPDR S&P 500 ETF Trust (NYSE: SPY), the largest ETF that tracks the S&P 500
Graphic 4: Daily candlestick chart of the cash S&P 500 Index

Given the above dynamics, the following frameworks apply for next week’s shortened holiday trade.

In the best case, the S&P 500 remains above its $3,763.75 balance-area low (BAL). Expectations thereafter include continued balance or initiative buying to take out the $3,824.25 balance-area high (BAH).

In the worst case, the S&P 500 remains below its $3,763.75 BAL. Expectations thereafter include a test of the low-volume node (LVNode) near $3,732.75. A break of the LVNode would portend a response near the $3,703.25 balance-break projection.

Conclusions: For now, despite a negative balance-break jeopardizing the bullish thesis, broad-market indices are in a longer-term uptrend. Participants ought to look for favorable areas to transact, such as those big-picture high-volume areas featured in graphic 5.

Graphic 5: 4-hour profile chart of the Micro E-mini S&P 500 Futures

Levels Of Interest: $3,763.75 BAL, $3,824.25 BAH, $3,732.75 LVNode, $3,703.25 balance-break projection.

Cover photo by Oleg Magni from Pexels.