Categories
Commentary

Daily Brief For August 16, 2021

Market Commentary

Equity index futures traded lower overnight.

  • Geopolitical tensions and growth fears.
  • Ahead is some data on manufacturing.

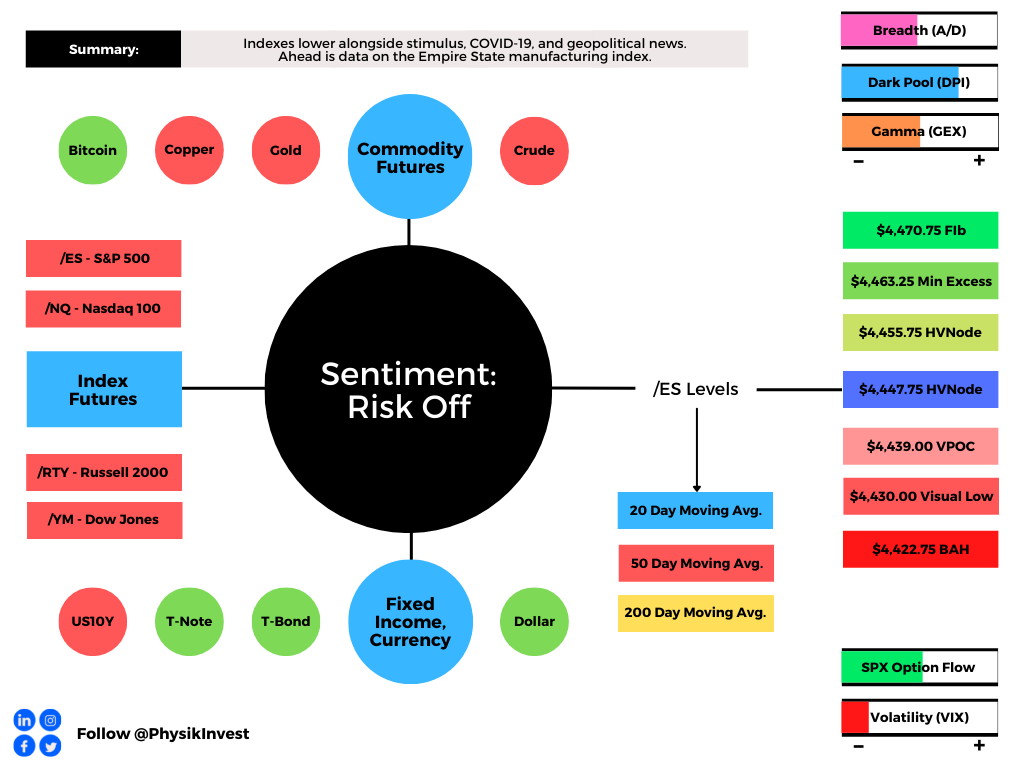
What Happened: U.S. stock index futures auctioned lower overnight alongside moderating growth and nervousness with respect to stimulus, COVID-19, and geopolitical developments.

Ahead is data on the Empire State manufacturing index (8:30 AM ET).

Graphic updated 6:30 AM ET. Sentiment Risk-Off if expected /ES open is below the prior day’s range. See here for more on the Dark Pool Index (DPI) and Gamma (GEX). A higher DPI approximation is bullish. At the same time, the lower the GEX approximation, the more volatility. SHIFT data used for options activity approximation. Note that options flow is sorted by the call premium spent; if green and more positive then more was spent on call options. Breadth reflects a reading of the prior day’s Advance/Decline indicator. VIX reflects a current reading of the CBOE Volatility Index from 0-100.

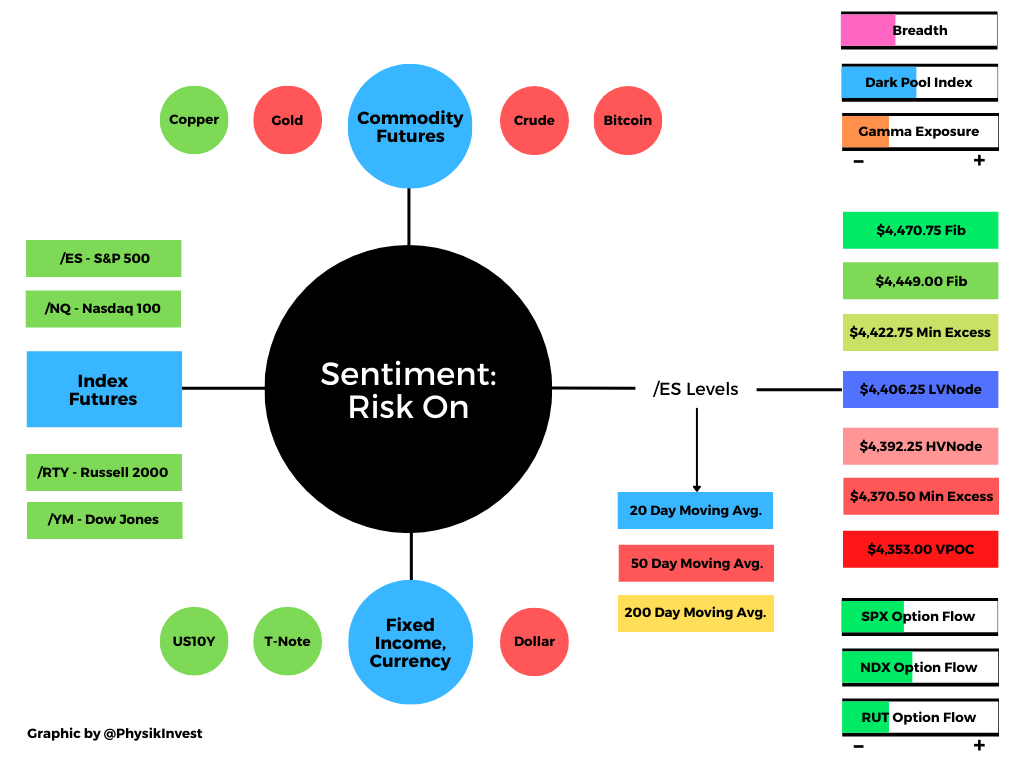
What To Expect: As of 6:30 AM ET, Monday’s regular session (9:30 AM – 4:00 PM EST) in the S&P 500 will likely open outside of prior-range and -value, suggesting a potential for immediate directional opportunity.

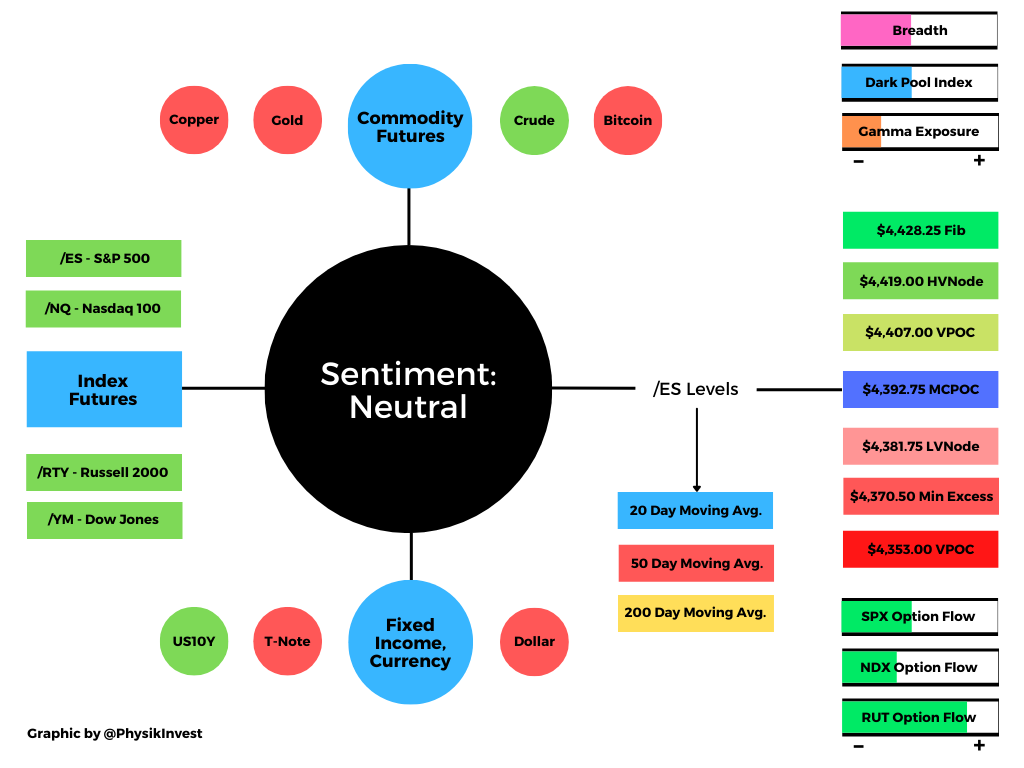
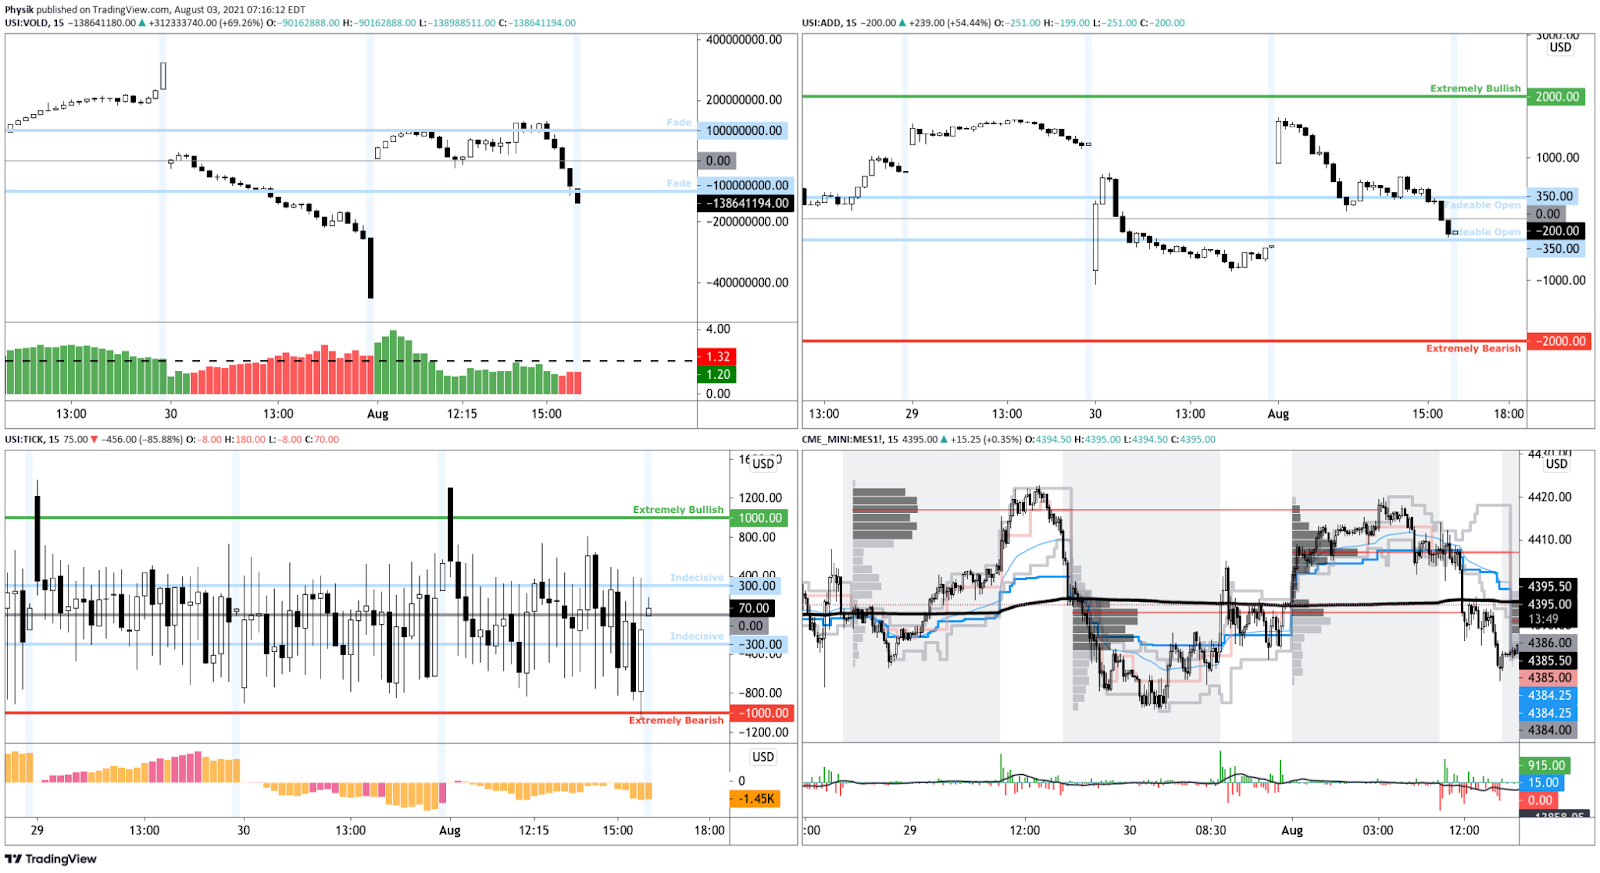
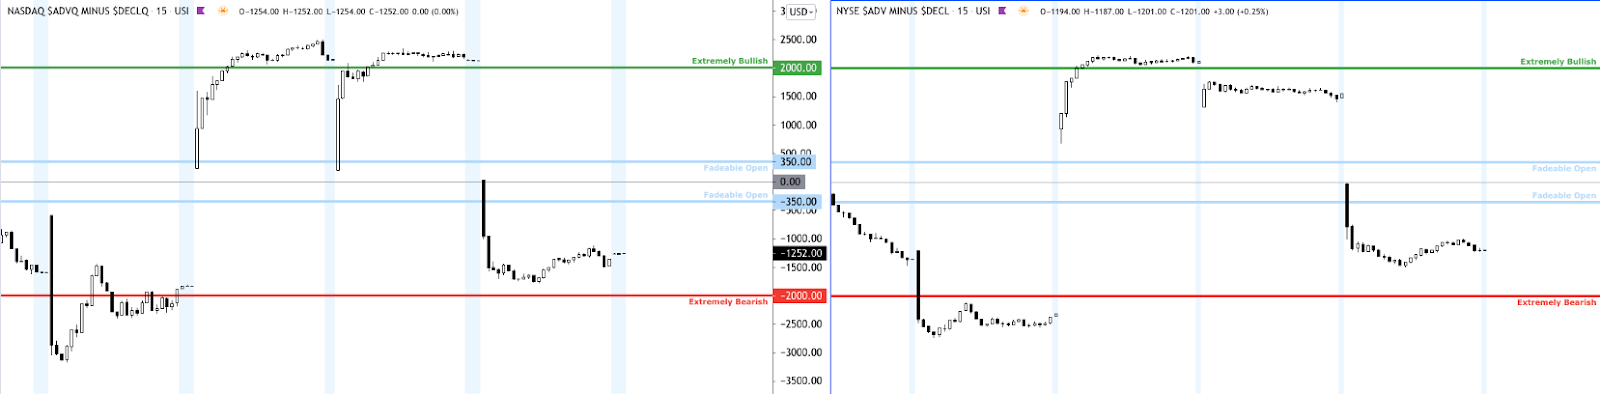
Adding, during the prior day’s regular trade, on weak intraday breadth and market liquidity metrics, the best case outcome occurred, evidenced by trade above the $4,453.75 high volume area (HVNode). This is significant because this trade validated a move up away from value, in the face of light volume, poor structure, and unsupportive breadth.

Gap Scenarios In Play: Gaps ought to fill quickly. Should they not, that’s a signal of strength; do not fade. Leaving value behind on a gap-fill or failing to fill a gap (i.e., remaining outside of the prior session’s range) is a go-with indicator.

Auctioning and spending at least 1-hour of trade back in the prior range suggests a lack of conviction; in such a case, do not follow the direction of the most recent initiative activity.

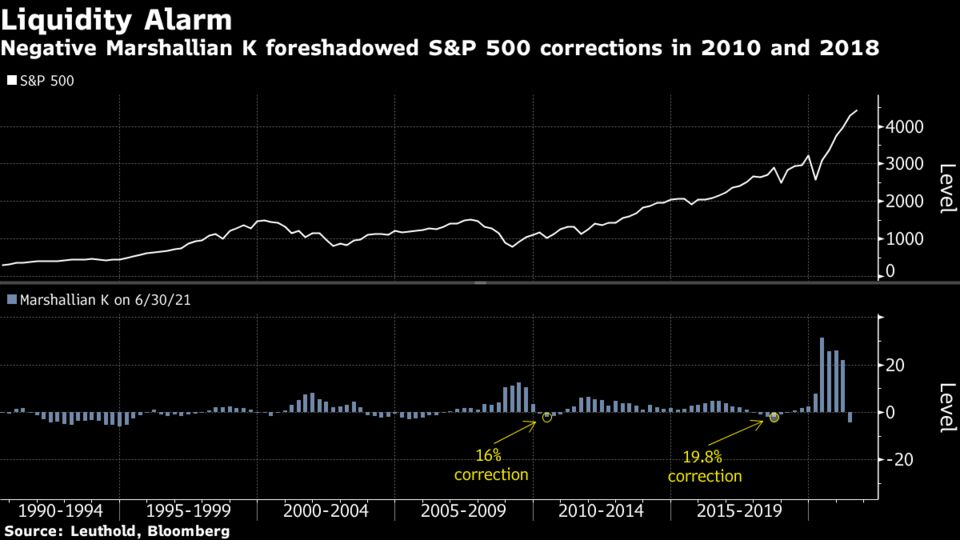
Further, the aforementioned trade is happening in the context of geopolitical concerns, peak growth, moderating inflation, renewed fiscal stimulus efforts, and increased odds of Fed tapering early next year. The implications of these themes on price are contradictory; to elaborate, as Nordea strategists note, “Profit margins could come under pressure given rising input/labour costs and decelerating economic growth. Also, excess liquidity has started to fall, which historically has meant a contraction in P/E ratios, at a time when the share of unprofitable companies in the Russell 2000 is the highest ever at 42%.”

Moreover, for today, given expectations of higher volatility and initiative trade, participants may make use of the following frameworks.

Initiative Buying (Selling): Buying (selling) within or above (below) the previous day’s value area.

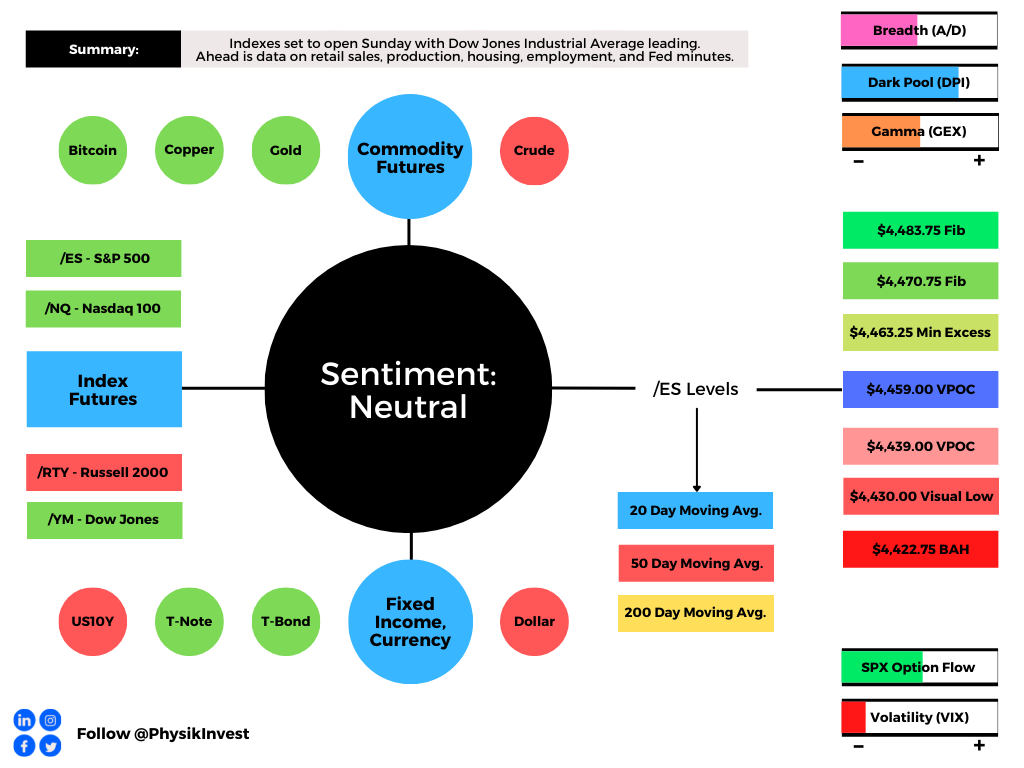
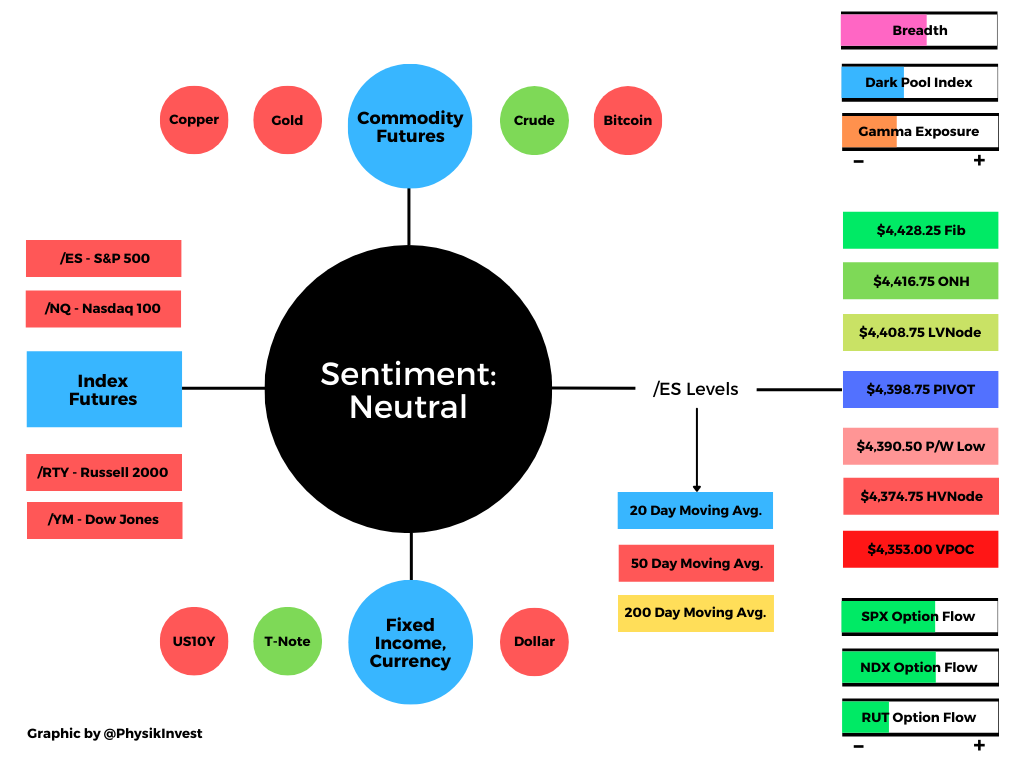
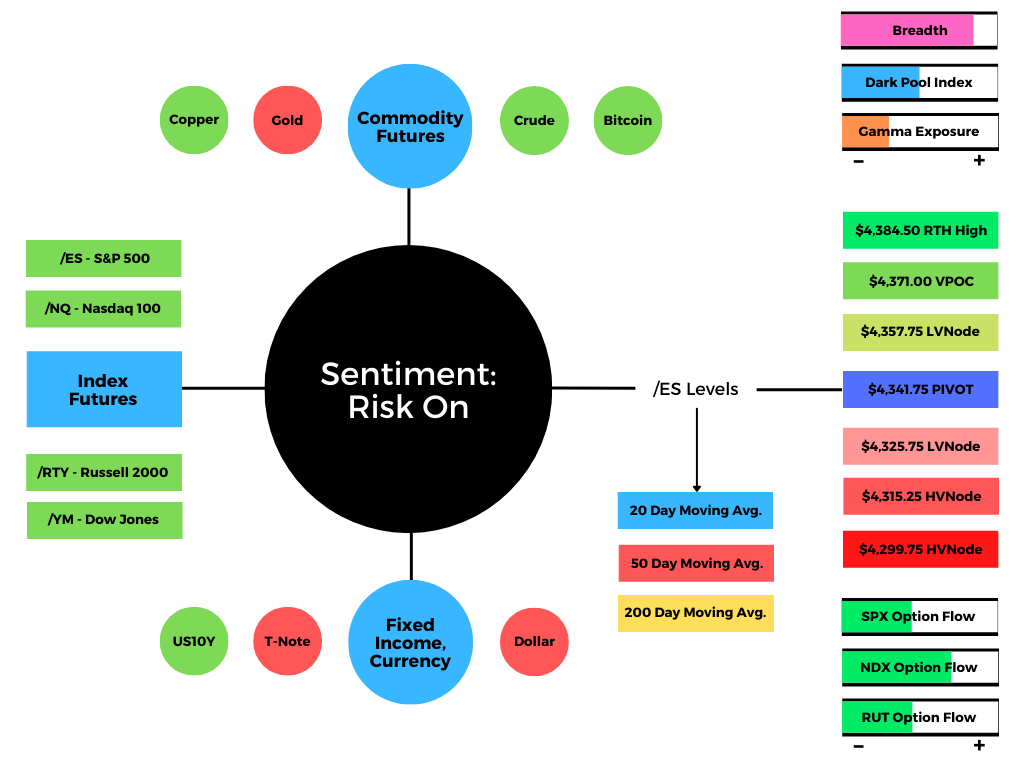
In the best case, the S&P 500 trades sideways or higher; activity above the $4,447.75 HVNode puts in play the $4,455.75 HVNode. Initiative trade beyond the $4,455.75 HVNode could reach as high as the $4,463.25 minimal excess high and $4,470.75 Fibonacci extension.

In the worst case, the S&P 500 trades lower; activity below the $4,447.75 HVNode puts in play the $4,439.00 untested point of control (VPOC). Initiative trade beyond the $4,439.00 VPOC could reach as low as $4,430.00 – a visual low likely generated by short-term (i.e., technically driven) participants who may be unable to defend retests – and the $4,422.75 balance area high (BAH).

Volume Areas: A structurally sound market will build on past areas of high volume. Should the market trend for long periods of time, it will lack sound structure (identified as a low volume area which denotes directional conviction and ought to offer support on any test). 

If participants were to auction and find acceptance into areas of prior low volume, then future discovery ought to be volatile and quick as participants look to areas of high volume for favorable entry or exit.

Excess: A proper end to price discovery; the market travels too far while advertising prices. Responsive, other-timeframe (OTF) participants aggressively enter the market, leaving tails or gaps which denote unfair prices.

POCs: POCs are valuable as they denote areas where two-sided trade was most prevalent. Participants will respond to future tests of value as they offer favorable entry and exit.

Balance (Two-Timeframe Or Bracket): Rotational trade that denotes current prices offer favorable entry and exit. Balance-areas make it easy to spot a change in the market (i.e., the transition from two-time frame trade, or balance, to one-time frame trade, or trend). 
Graphic: 65-minute profile chart of the Micro E-mini S&P 500 Futures updated 6:10 AM ET.

News And Analysis

The Taliban is once again the dominant force in Afghanistan.

Democrats’ debt dare risks shutdown fights with no easy out.

The world’s third-busiest port still remains partially shut down.

Spending packages would reduce social, environmental risks.

What People Are Saying

About

After years of self-education, strategy development, and trial-and-error, Renato Leonard Capelj began trading full-time and founded Physik Invest to detail his methods, research, and performance in the markets. 

Additionally, Capelj is a finance and technology reporter. Some of his biggest works include interviews with leaders such as John Chambers, founder and CEO, JC2 Ventures, Kevin O’Leary, businessman and Shark Tank host, Catherine Wood, CEO and CIO, ARK Invest, among others.

Disclaimer

At this time, Physik Invest does not manage outside capital and is not licensed. In no way should the materials herein be construed as advice. Derivatives carry a substantial risk of loss. All content is for informational purposes only.

Categories
Commentary

Weekly Brief For August 15, 2021

Market Commentary

Equity index futures are set to open sideways Sunday after a divergent advance on light volume and poor structure.

  • Fundamental context – the good and bad.
  • Ahead a heavy week in terms of releases.
  • A narrow rally on unsupportive dynamics.
  • A simple way to hedge off your downside.

What Happened: U.S. stock index futures auctioned sideways to higher last week as the baseline Dow Jones Industrial Average is forecast to have peaked, according to Moody’s.

Ahead is data on the Empire State manufacturing index (8/16), retail sales (8/17), industrial production (8/17), capacity utilization (8/17), business inventories (8/17), NAHB home builders’ index (8/17), building permits (8/18), housing starts (8/18), Federal Open Market Committee (FOMC) minutes (8/18), jobless claims (8/19), Philadelphia Fed manufacturing index (8/19), and the index of leading economic indicators (8/19).

Graphic updated 9:30 AM ET Sunday. Sentiment Neutral if expected /ES open is inside of the prior day’s range. See here for more on the Dark Pool Index (DPI) and Gamma (GEX). A higher DPI approximation is bullish. At the same time, the lower the GEX approximation, the more volatility. SHIFT data used for options activity approximation. Note that options flow is sorted by the call premium spent; if green and more positive then more was spent on call options. Breadth reflects a reading of the prior day’s Advance/Decline indicator. VIX reflects a current reading of the CBOE Volatility Index from 0-100.

What To Expect: During the prior week’s trade, on weak intraday breadth and market liquidity metrics, the best case outcome occurred, evidenced by trade above the $4,422.75 balance area high (BAH). This trade is significant because it validated a balance area breakout.

More On Balance-Break Scenarios: A change in the market (i.e., the transition from two-time frame trade, or balance, to one-time frame trade, or trend) is occurring.

Monitor for acceptance (i.e., more than 1-hour of trade) outside of the balance area. Rejection (i.e., return inside of balance) portends a move to the opposite end of the balance.

Further, the aforementioned trade is happening in the context of peak growth, moderating inflation, renewed fiscal stimulus efforts, and increased odds of Fed tapering early next year. 

The implications of this fundamental context on price are contradictory; to elaborate, as Michael Gayed of The Lead-Lag Report recently said, narrow high yield spreads offer little potential for capital growth, and “conditions that favor higher volatility – the Fed backing off stimulus measures, the upcoming battle over the debt ceiling, high current inflation and/or longer-term deflation – could be not far off into the future.”

As an aside, this leads us into the narrative on the so-called shift from monetary to fiscal; in a conversation for a Benzinga article, Kai Volatility’s Cem Karsan said the following: when liquidity is removed, as policymakers look to fiscal policy to address inequality, for instance, corporations may have to worry about making money, again.

“We’ve seen this throughout history,” Karsan said in reference to this thesis playing out over the next decade, at least. “These cycles are a lot shorter than the monetary supply-side cycles but they tend to be very bad for multiples and great for economic growth.”

Adding, in Friday’s note, the theme of liquidity was discussed. Simply put, the gap between the rates of growth in the supply of money and the gross domestic product turned negative for the first time since 2018.

“Put another way, the recovering economy is now drinking from a punch bowl that the stock market once had all to itself,” said Doug Ramsey, Leuthold Group’s chief investment officer.

Graphic: According to Bloomberg, “While stocks kept rising during frequent negative Marshallian K readings in the 1990s, the pattern since the 2008 global financial crisis — a period when the central bank was in what Ramsey calls a “perpetual crisis mode” — begs for caution.”

Moreover, for next week, given expectations of middling volatility and responsive trade, on factors like the upcoming August 20 monthly options expiration, participants may make use of the following frameworks.

Options Expiration (OPEX): Option expiries mark an end to pinning (i.e, the theory that market makers and institutions short options move stocks to the point where the greatest dollar value of contracts will expire worthless) and the reduction dealer gamma exposure.

In the best case, the S&P 500 trades sideways or higher; activity above the $4,459.00 untested point of control (VPOC) puts in play the $4,463.25 minimal excess high. Initiative trade beyond the minimal excess high could reach as high as the $4,470.75 and $4,483.75 Fibonacci-derived price targets.

In the worst case, the S&P 500 trades lower; activity below the $4,459.00 VPOC puts in play the $4,439.00 VPOC. Initiative trade beyond the $4,439.00 VPOC could reach as low as $4,430.00 – a visual low likely generated by short-term (i.e., technically driven) participants who may be unable to defend retests – and the previously discussed $4,422.75 BAH.

Volume Areas: A structurally sound market will build on past areas of high volume. Should the market trend for long periods of time, it will lack sound structure (identified as a low volume area which denotes directional conviction and ought to offer support on any test). 

If participants were to auction and find acceptance into areas of prior low volume, then future discovery ought to be volatile and quick as participants look to areas of high volume for favorable entry or exit.

Excess: A proper end to price discovery; the market travels too far while advertising prices. Responsive, other-timeframe (OTF) participants aggressively enter the market, leaving tails or gaps which denote unfair prices.

POCs: POCs are valuable as they denote areas where two-sided trade was most prevalent. Participants will respond to future tests of value as they offer favorable entry and exit.
Graphic: 65-minute profile chart of the Micro E-mini S&P 500 Futures updated 9:30 AM ET Sunday.

Weekly Trade Idea

Please Note: In no way is the below a trade recommendation. It’s a response to a solicitation for simple ways to hedge against a move lower, into the end of the month.

Options offer an efficient way to gain directional exposure. 

If an option buyer was short (long) stock, he or she could buy a call (put) to hedge upside (downside) exposure. Additionally, one can spread, or buy (+) and sell (-) options together, strategically.

Commonly discussed spreads include credit, debit, ratio, back, and calendar.

  • Credit: Sell -1 option closer to the money. Buy +1 option farther out of the money.
  • Debit: Buy +1 option closer to the money. Sell -1 option farther out of the money.
  • Ratio: Buy +1 option closer to the money. Sell -2 options farther out of the money. 
  • Back: Sell -1 option closer to the money. Buy +2 options farther out of the money.
  • Calendar: Sell -1 option. Buy +1 option farther out in time, at the same strike.

Typically, if bullish (bearish), sell at-the-money put (call) credit spread and/or buy a call (put) debit/ratio spread structured around target price. Alternatively, if the expected directional move is great (small), opt for a back spread (calendar spread). Also, if credit spread, capture 50-75% of the premium collected. If debit spread, capture 2-300% of the premium paid.

Be cognizant of risk exposure to direction (delta), time (theta), and volatility (vega). 

  • Negative (positive) delta = synthetic short (long). 
  • Negative (positive) theta = time decay hurts (helps).
  • Negative (positive) vega = volatility hurts (helps).

Trade Idea: BUY +1 BUTTERFLY SPX 100 (Weeklys) 31 AUG 21 4450/4400/4350 PUT @4.90 LMT.

Thesis: I’m neutral to bearish on the S&P 500 and I think the index may trade sideways to lower into the next month. I will structure a spread below the current index price, expiring in 15 days. I will buy the 4450 put option once (+1), sell the 4400 put option twice (-2), and buy the 4350 put option once (+1) for a $4.90 debit or so. Should the index not move to my target, I may lose the $490 debit. Should it move to $4,400.00, I could make $4,510.00 (i.e., the $5,000.00 payout less debit at entry) at expiry. Should the index move below $4,354.90, I may lose the entire $490 debit. My goal, with this spread, is to close for credit (e.g., $9.80-14.70) if the index moves lower. Note that this trade carries a positive theta at entry.

If necessary, I will hedge the position by either (A) buying S&P 500 futures, (B) narrowing strikes, (C) selling call credit to reduce cost, or (D) roll strikes up in price and out in time.

News And Analysis

Rates recovering; realtors see price moderating.

This turning point for markets merits a hard look.

Market disruptions as Fed balance sheet swells.

Job data eases fears of a slowdown in recovery.

U.S. high yield default rate lowest start in 14 yrs.

Delta variant will not impact Fed’s tapering plan.

What People Are Saying

About

After years of self-education, strategy development, and trial-and-error, Renato Leonard Capelj began trading full-time and founded Physik Invest to detail his methods, research, and performance in the markets. 

Additionally, Capelj is a finance and technology reporter. Some of his biggest works include interviews with leaders such as John Chambers, founder and CEO, JC2 Ventures, Kevin O’Leary, businessman and Shark Tank host, Catherine Wood, CEO and CIO, ARK Invest, among others.

Disclaimer

At this time, Physik Invest does not manage outside capital and is not licensed. In no way should the materials herein be construed as advice. Derivatives carry a substantial risk of loss. All content is for informational purposes only.

Categories
Commentary

Daily Brief For August 4, 2021

Editor’s Note: On Thursday (8/5) and Friday (8/6) there will be no Daily Brief newsletter. Additionally, there will be no Weekly Brief Sunday (8/8), either. All commentaries to resume August 9, 2021.

Market Commentary

Equity index futures trade higher ahead of key fundamental events.

  • Worry dwindles and volatility ebbs.
  • Ahead: Data on jobs and services.
  • A mixed bag. Positioned for higher.

What Happened: U.S. stock index futures auctioned higher and sideways as participants discounted drivers like the COVID-19 coronavirus and China clampdown. 

At the same time, earnings are robust and stimulus remains in play; “Aside from the healthy earnings outlook, we also see equities being supported by continued monetary stimulus from the Federal Reserve and the attractiveness of stocks relative to low bond yields,” said Mark Haefele of UBS Group AG (NYSE: UBS). “Cyclicals are expected to benefit from the shift in consumer spending away from pandemic winners such as mega-cap tech.”

Ahead is data on ADP employment, Markit services PMI, and the ISM services index.

Graphic updated 6:30 AM ET. Sentiment Neutral if expected /ES open is inside of the prior day’s range. See here for more on the Dark Pool Index and Gamma. A positive Dark Pool Index reading is bullish. At the same time, the higher (lower) the gamma, the less (more) volatility. SHIFT Search data used for options activity. Note that options flow is sorted by the call premium spent; if green and more (less) positive then more (less) was spent on call options. Breadth reflects a reading of the prior day’s Advance/Decline indicator.

What To Expect: As of 6:30 AM ET, Wednesday’s regular session (9:30 AM – 4:00 PM EST) in the S&P 500 will likely open just inside of prior-range and -value, suggesting a limited potential for immediate directional opportunity.

Adding, during the prior day’s regular trade, the best case outcome occurred after a repair of the $4,370.50 minimal excess low; after testing the low (a level which corresponded with a volume-weighted average price or VWAP anchored from the July 19 swing low), responsive buyers initiated a rally that pushed prices to a higher close, away from value. 

Excess: A proper end to price discovery; the market travels too far while advertising prices. Responsive, other-timeframe (OTF) participants aggressively enter the market, leaving tails or gaps which denote unfair prices.

More On Volume-Weighted Average Prices (VWAPs): A metric highly regarded by chief investment officers, among other participants, for quality of trade. Additionally, liquidity algorithms are benchmarked and programmed to buy and sell around VWAPs.

In doing so, participants negated all of Monday’s selling which, as stated Tuesday, was not supported by value or strong metrics with respect to breadth and market liquidity

Coming into today’s session, opportunity resides in the S&P 500, Nasdaq 100, and Dow Jones Industrial Average; indices are trading at key go/no-go levels. 

Further up movement puts in play balance-area breakouts. In such a case, the modus operandi shifts from responsive trade (i.e., fade the edges) to initiative trade (i.e., play the break). Failure to expand range portends a rotation back into balance. 

Balance (Two-Timeframe Or Bracket): Rotational trade that denotes current prices offer favorable entry and exit. Balance-areas make it easy to spot a change in the market (i.e., the transition from two-time frame trade, or balance, to one-time frame trade, or trend).

Below are some rough levels to base expectations around. The width of the balance area, projected off the high end of the balance, is the typical target in such a breakout (e.g., $4,490 SPX cash).

Graphic: 65-minute candlestick charts of the cash-settled S&P 500 (INDEX: SPX), Nasdaq 100 (INDEX: NDX), Russell 2000 (INDEX: RUT), and Dow Jones Industrial Average (INDEX: DJI).

Moreover, for today, participants can trade from the following frameworks. 

In the best case, the S&P 500 trades sideways or higher; activity above the $4,406.25 low volume area (LVNode) pivot puts in play the $4,417.75 LVNode. Initiative trade beyond the $4,417.75 LVNode could reach as high as the $4,428.25 and $4,438.50 Fibonacci price extensions.

In the worst case, the S&P 500 trades lower; activity below the $4,406.25 LVNode puts in play the $4,392.75 micro-composite point of control (MCPOC). Initiative trade beyond the MCPOC could reach as low as the $4,381.75 untested point of control (VPOC) and $4,365.25 LVNode.

Volume Areas: A structurally sound market will build on past areas of high volume. Should the market trend for long periods of time, it will lack sound structure (identified as a low volume area which denotes directional conviction and ought to offer support on any test). 

If participants were to auction and find acceptance into areas of prior low volume, then future discovery ought to be volatile and quick as participants look to areas of high volume for favorable entry or exit.

POCs: POCs are valuable as they denote areas where two-sided trade was most prevalent. Participants will respond to future tests of value as they offer favorable entry and exit.
Graphic: 65-minute profile chart of the Micro E-mini S&P 500 Futures. Graphic updated 6:30 AM ET.

News And Analysis

Markets primed for Powell second term at risk from surprise pick.

China typhoons create latest supply-chain threat as ports close.

Economic data positive for risk but business cycle risks building.

New York City to require proof of vaccination for indoor activities.

Asia-Pacific on track for a strong rebound although scars will last.

What People Are Saying

About

After years of self-education, strategy development, and trial-and-error, Renato Leonard Capelj began trading full-time and founded Physik Invest to detail his methods, research, and performance in the markets. 

Additionally, Capelj is a finance and technology reporter. Some of his biggest works include interviews with leaders such as John Chambers, founder and CEO, JC2 Ventures, Kevin O’Leary, businessman and Shark Tank host, Catherine Wood, CEO and CIO, ARK Invest, among others.

Disclaimer

At this time, Physik Invest does not manage outside capital and is not licensed. In no way should the materials herein be construed as advice. Derivatives carry a substantial risk of loss. All content is for informational purposes only.

Categories
Commentary

Daily Brief For August 3, 2021

Editor’s Note: On Thursday (8/5) and Friday (8/6) there will be no Daily Brief newsletter. Additionally, there will be no Weekly Brief Sunday (8/8), either. All commentaries to resume August 9, 2021.

Market Commentary

Equity index futures move higher, back into range. 

  • News: China, COVID-19, and crypto.
  • Ahead: Data on orders, vehicle sales.
  • Responsive trade remains dominant.

What Happened: U.S. stock index futures auctioned higher amid news surrounding China, COVID-19, and cryptocurrency regulation.

Adding, Goldman Sachs Group Inc (NYSE: GS) turned slightly bearish on U.S. growth; “[e]xpectations of higher interest rates and higher corporate tax rates by year-end are the primary reasons [to] forecast that the S&P 500 will trade sideways,” strategists noted recently.

Ahead is data on factory and core capital goods orders, as well as motor vehicle sales.

Graphic updated TIME 6:40 ET. Sentiment Neutral if expected /ES open is inside of the prior day’s range. See here for more on the Dark Pool Index and Gamma. A positive Dark Pool Index reading is bullish. At the same time, the higher (lower) the gamma, the less (more) volatility. SHIFT Search data used for options activity. Note that options flow is sorted by the call premium spent; if green and more (less) positive then more (less) was spent on call options. Breadth reflects a reading of the prior day’s Advance/Decline indicator.

What To Expect: As of 6:40 AM ET, Tuesday’s regular session (9:30 AM – 4:00 PM EST) in the S&P 500 will likely open on a small gap, inside of balance and prior-range, suggesting a low potential for immediate directional opportunity.

Balance (Two-Timeframe Or Bracket): Rotational trade that denotes current prices offer favorable entry and exit. Balance-areas make it easy to spot a change in the market (i.e., the transition from two-time frame trade, or balance, to one-time frame trade, or trend).

Adding, during the prior day’s regular trade, the worst case outcome occurred, evidenced by trade below the $4,392.75 micro composite point of control (MCPOC), to the $4,381.75. This is significant because the MCPOC (which corresponds with an important anchored volume-weighted average price or VWAP) denotes the fairest price to do business on a bigger timeframe. 

Volume Areas: A structurally sound market will build on past areas of high volume. Should the market trend for long periods of time, it will lack sound structure (identified as a low volume area which denotes directional conviction and ought to offer support on any test). 

If participants were to auction and find acceptance into areas of prior low volume, then future discovery ought to be volatile and quick as participants look to areas of high volume for favorable entry or exit.

POCs: POCs are valuable as they denote areas where two-sided trade was most prevalent. Participants will respond to future tests of value as they offer favorable entry and exit.

Adding, the move lower, into yesterday’s settlement, was not supported by value or strong metrics with respect to breadth and market liquidity. 

Breadth at the exchange level was neutral with a minuscule inflow into the stocks that were down, versus those that were up. Similarly, the cumulative volume delta – a measure of buying and selling power as calculated by the difference in volume traded at the bid and offer – diverged from price.

Graphic: Market Internals (Advance/Decline, Up-Volume/Down-Volume, Tick) displayed as Peter Reznicek at ShadowTrader teaches
Graphic: Market liquidity and cumulative volume delta (CVD) for the SPDR S&P 500 ETF Trust (NYSE: SPY), one of the largest ETFs that track the S&P 500 index.

To put it differently, the market is in balance, and the modus operandi in such case (as happened Monday) is responsive trade (i.e., fade the edges), rather than initiative trade (i.e., play the break).

Given the context, for today, participants may trade from the following frameworks. 

In the best case, the S&P 500 trades sideways or higher; activity above the $4,392.75 MCPOC puts in play the $4,407.00 POC. Initiative trade beyond the POC could reach as high as the $4,419.00 HVNode and $4,428.25 Fibonacci extension.

In the worst case, the S&P 500 trades lower; activity below the $4,392.75 MCPOC puts in play the $4,381.75 LVNode. Initiative trade beyond the LVNode could reach as low as the $4,370.50 minimal excess low and $4,353.00 POC.

Excess: A proper end to price discovery; the market travels too far while advertising prices. Responsive, other-timeframe (OTF) participants aggressively enter the market, leaving tails or gaps which denote unfair prices.
Graphic: 65-minute profile chart of the Micro E-mini S&P 500 Futures. Graphic updated 6:40 AM ET.

News And Analysis

‘China model’ eyeing prosperity without democracy.

Axios: Markets could be fine with the Fed tapering.

The new SEC boss looks to more crypto oversight.

Biden Fed pick pits Powell against regulatory push.

What People Are Saying

About

After years of self-education, strategy development, and trial-and-error, Renato Leonard Capelj began trading full-time and founded Physik Invest to detail his methods, research, and performance in the markets. Additionally, Capelj is a finance and technology reporter. Some of his biggest works include interviews with leaders such as John Chambers, founder and CEO, JC2 Ventures, Kevin O’Leary, businessman and Shark Tank host, Catherine Wood, CEO and CIO, ARK Invest, among others.

Disclaimer

At this time, Physik Invest does not manage outside capital and is not licensed. In no way should the materials herein be construed as advice. Derivatives carry a substantial risk of loss. All content is for informational purposes only.

Categories
Commentary

Daily Brief For August 2, 2021

Editor’s Note: On Thursday (8/5) and Friday (8/6) there will be no Daily Brief newsletter. Additionally, there will be no Weekly Brief Sunday (8/8), either. All commentaries to resume August 9, 2021.

Market Commentary

Equity index futures higher overnight.

  • Infrastructure bill gains in the Senate.
  • Ahead: PMI, ISM, construction spend.
  • Favoring sideways, responsive trade.

What Happened: U.S. stock index futures auctioned higher after a busy week of earnings and positive developments with respect to an infrastructure package.

Ahead is data on Markit manufacturing PMI, ISM manufacturing, and construction spending.

Graphic updated 6:40 AM ET. Sentiment Risk-On if expected /ES open is above the prior day’s range. See here for more on the Dark Pool Index and Gamma. A positive Dark Pool Index reading is bullish. At the same time, the higher (lower) the gamma, the less (more) volatility. SHIFT Search data used for options activity. Note that options flow is sorted by the call premium spent; if green and more (less) positive then more (less) was spent on call options. Breadth reflects a reading of the prior day’s Advance/Decline indicator.

What To Expect: As of 6:40 AM ET, Monday’s regular session (9:30 AM – 4:00 PM EST) in the S&P 500 will likely open on a small gap, outside of prior-range and -value, suggesting a potential for directional opportunity.

Gap Scenarios: Gaps ought to fill quickly. Should they not, that’s a signal of strength; do not fade. Leaving value behind on a gap-fill or failing to fill a gap (i.e., remaining outside of the prior session’s range) is a go-with indicator.

Auctioning and spending at least 1-hour of trade back in the prior range suggests a lack of conviction; in such a case, do not follow the direction of the most recent initiative activity.

Take the word potential lightly. Despite the gap higher, the S&P 500 is trading within a larger area of balance, the result of participants finding higher prices valuable as they position themselves for a directional move, given increased clarity on earnings, taper, and more. 

Balance (Two-Timeframe Or Bracket): Rotational trade that denotes current prices offer favorable entry and exit. Balance-areas make it easy to spot a change in the market (i.e., the transition from two-time frame trade, or balance, to one-time frame trade, or trend).

The modus operandi, in light of the above, is responsive trade (i.e., fade the edges), rather than initiative trade (i.e., play the break).

As a side note, this balancing activity comes as the market enters into the worst two-month period of the year. At the same time, the CBOE Volatility Index (INDEX: VIX), a measure of the market’s volatility expectation based on S&P 500 options, and high-yield spreads (which can signal a worsening in economic conditions) have become stickier at higher levels.

At a more micro level, in support of responsive trade are metrics with respect to breadth, market liquidity, and the options market. For instance, as stocks went sideways, Friday, breadth, at the exchange level, was negative with a steady, albeit soft inflow into the stocks that were down, versus those that were up.

Moreover, given the context, for today, participants can trade from the following frameworks. 

In the best case, the S&P 500 trades sideways or higher; activity above the $4,406.25 low volume area (LVNode) puts in play the $4,422.75 minimal excess high. Initiative trade beyond the minimal excess high could reach as high as the $4,428.25, $4,449.00, and $4,470.75 Fibonacci price extensions.

In the worst case, the S&P 500 trades lower; activity below the $4,406.25 LVNode puts in play the $4,392.25 high volume area (HVNode). Initiative trade beyond the HVNode could reach as low as the $4,370.50 minimal excess low and $4,353.00 untested point of control (VPOC).

Volume Areas: A structurally sound market will build on past areas of high volume. Should the market trend for long periods of time, it will lack sound structure (identified as a low volume area which denotes directional conviction and ought to offer support on any test). 

If participants were to auction and find acceptance into areas of prior low volume, then future discovery ought to be volatile and quick as participants look to areas of high volume for favorable entry or exit.

Excess: A proper end to price discovery; the market travels too far while advertising prices. Responsive, other-timeframe (OTF) participants aggressively enter the market, leaving tails or gaps which denote unfair prices.

POCs: POCs are valuable as they denote areas where two-sided trade was most prevalent. Participants will respond to future tests of value as they offer favorable entry and exit.
Graphic: 65-minute profile chart of the Micro E-mini S&P 500 Futures. Graphic updated 6:30 AM ET.

News And Analysis

World’s biggest pension fund slashes U.S. bond weighting. 

Real GDP expands above pre-pandemic levels, BEA said.

Goldman Sachs’ flow desk – earnings beats not rewarded.

Senate plans to deliver infrastructure win for Biden agenda.

The broadest China outbreak since Wuhan; COVID update.

‘Buy Now, Pay Later,’ plans are having their moment again.

Nordea: Bullard is likely a muppet, but he is probably right.

What People Are Saying

About

After years of self-education, strategy development, and trial-and-error, Renato Leonard Capelj began trading full-time and founded Physik Invest to detail his methods, research, and performance in the markets. 

Additionally, Capelj is a finance and technology reporter. Some of his biggest works include interviews with leaders such as John Chambers, founder and CEO, JC2 Ventures, Kevin O’Leary, businessman and Shark Tank host, Catherine Wood, CEO and CIO, ARK Invest, among others.

Disclaimer

At this time, Physik Invest does not manage outside capital and is not licensed. In no way should the materials herein be construed as advice. Derivatives carry a substantial risk of loss. All content is for informational purposes only.

Categories
Commentary

Weekly Brief For August 1, 2021

Editor’s Note: On Thursday (8/5) and Friday (8/6) there will be no Daily Brief newsletter. Additionally, there will be no Weekly Brief Sunday (8/8), either. All commentaries to resume August 9, 2021.

If in the Miami, Florida area please contact renato@physikinvest.com if interested in connecting over markets, fintech, and the like.

PS: Added a new “Weekly Trade Ideas” section. Hope it provides added value!

Regards,

Renato Leonard Capelj

Market Commentary

Key Takeaways: Equity index futures to start the week off neutral, in prior-range and -value.

  • Debt limit, China, fiscal policy cloud outlook.
  • Expecting a heavy week for economic data.
  • Responsive trade until key levels are taken.
  • Amazon Inc (NASDAQ: AMZN) trade ideas.

What Happened: With respect to hot topic market risks, the week prior offered a ton of information to add to our narrative. We list for clarity.

  • Debt Limit: The August 1 reinstatement of the U.S. debt limit may have severe consequences, increasing the odds of a rating downgrade on government debt.
  • Monetary: Come September, participants will likely receive increased clarity over taper timelines with an official start early next year. Adding, Chairman Jerome Powell expressed inflation as temporary and the committee announced the creation of a pair of standing facilities to strengthen its ability to be the lender of last resort in the repo market.
  • China: Cross-asset volatility in China worsened, prompting talk of a yuan devaluation. A devaluation is something to fear; to note, The People’s Bank of China (PBOC) roiled global equity markets after its 2015 yuan devaluation.
  • Growth: U.S. economic data came in weaker suggesting growth likely peaked. Notwithstanding, consumer confidence improved markedly with sentiment recovering fully. Moody’s strategists look for real GDP to rise 6.7% this year, a downward revision on some fiscal policy assumptions.
  • Fiscal: Lawmakers debate another round of stimulus to ensure the strong long-term growth of lower- and middle-income households. The proposed legislation is receiving pushback with respect to its impact on inflation and taxes. Moody’s strategists note “higher taxes will weigh on economic growth, but the impact on the economy from the higher proposed taxes will be small.”
  • Pandemic: COVID-19 variants are a cause for concern – especially with respect to the Federal Reserve’s tapering of quantitative easing – but hospitalization ratios and mobility metrics suggest the crisis is likely over. In other areas, the CDC’s rental eviction moratorium and FHFA’s foreclosure moratorium expired with forbearance on government-backed mortgages and student loans ending September, also.
  • Yields: Technical factors – issuance, short coverings, a fading reflation trade, and peak growth – are to blame for lower Treasury yields. A longer-term deviation from the implied “economic fair value” of 1.6% and 1.65% for the 10-year yield would suggest other forces are driving long-term interest rates.
  • Earnings: Year-over-year profit growth of S&P 500 constituents stands at 85% with 88% of companies beating estimates for revenue and profit, according to Business Insider
  • Positioning: According to one Bank of America Corporation (NYSE: BAC) comment, highlighted by The Market Ear, “The average recovery time following 2-sigma one-day S&P declines has shortened significantly post-GFC, reaching an all-time low this year.” This has a lot to do with the inventory positioning of participants; volatility is oversupplied and associated heading forces make it so there is more liquidity and less movement. Should the market unpin, there’s “not enough liquidity” to absorb leverage on the tails.

Putting it all together, Goldman Sachs Group Inc (NYSE: GS) believes “[e]xpectations of higher interest rates and higher corporate tax rates by year-end are the primary reasons [to] forecast that the S&P 500 will trade sideways,” into end-of-year.

In support of that view is seasonality, also.

Graphic: Seasonality metrics via the Capital Market Outlook by Merrill.

What To Expect: The S&P 500, Nasdaq 100, and Dow Jones Industrial Average are above their key 20-, 50-, and 200-week moving averages while the Russell 2000 is stuck inside a multi-month trading range, between its 20- and 50-week moving averages.

Given the higher long-term trend, traders of the S&P 500, in particular, must contend with a week-long balance area, the result of participants finding higher prices valuable as they position themselves for a directional move, given increased clarity on earnings, taper, and more. 

Balance (Two-Timeframe Or Bracket): Rotational trade that denotes current prices offer favorable entry and exit. Balance-areas make it easy to spot a change in the market (i.e., the transition from two-time frame trade, or balance, to one-time frame trade, or trend).

In the coming sessions, given that the modus operandi is responsive trade (i.e., fade the edges), rather than initiative trade (i.e., play the break), participants will want to focus their attention on where the S&P 500 trades in relation to the $4,392.25 high volume area (HVNode) pivot.

In the best case, the S&P 500 trades sideways or higher; activity above the $4,392.25 HVNode pivot puts in play the $4,406.25 low volume area (LVNode) and $4,419.00 untested point of control (VPOC). Initiative trade beyond the VPOC portends a potential breakout above the $4,422.75 minimal excess high, up to the $4,428.25 Fibonacci extension.

In the worst case, the S&P 500 trades lower; activity below the $4,392.25 HVNode pivot puts in play the $4,381.75 LVNode. Initiative trade beyond the LVNode portends a potential breakdown below the $4,370.50 minimal excess low, down to the $4,353.00 VPOC and $4,341.75 micro-composite point of control (MCPOC).

Volume Areas: A structurally sound market will build on past areas of high volume. Should the market trend for long periods of time, it will lack sound structure (identified as a low volume area which denotes directional conviction and ought to offer support on any test). 

If participants were to auction and find acceptance into areas of prior low volume, then future discovery ought to be volatile and quick as participants look to areas of high volume for favorable entry or exit.

POCs: POCs are valuable as they denote areas where two-sided trade was most prevalent. Participants will respond to future tests of value as they offer favorable entry and exit.

Excess: A proper end to price discovery; the market travels too far while advertising prices. Responsive, other-timeframe (OTF) participants aggressively enter the market, leaving tails or gaps which denote unfair prices.
Graphic: 65-minute profile chart of the Micro E-mini S&P 500 Futures. Note the blue anchored Volume Weighted Average Price (VWAP) which suggests the average buyer, since FOMC, is underwater. To note, VWAP is a metric highly regarded by chief investment officers, among other participants, for quality of trade. Additionally, liquidity algorithms are benchmarked and programmed to buy and sell around VWAPs.

Weekly Trade Idea

Please Note: In no way is the below a trade recommendation. It is a peek into the thought process here at Physik Invest. To cover my butt, so to speak, I say DO NOT take this trade. Also, if you would like to see this section included in future commentaries, email me at renato@physikinvest.com with the subject line “Please Include Weekly Trade Ideas”.

Options offer an efficient way to gain directional exposure. 

If an option buyer was short (long) stock, he or she could buy a call (put) to hedge upside (downside) exposure. Additionally, one can spread, or buy (+) and sell (-) options together, strategically.

Commonly discussed spreads include credit, debit, ratio, back, and calendar.

  • Credit: Sell -1 option closer to the money. Buy +1 option farther out of the money.
  • Debit: Buy +1 option closer to the money. Sell -1 option farther out of the money.
  • Ratio: Buy +1 option closer to the money. Sell -2 options farther out of the money. 
  • Back: Sell -1 option closer to the money. Buy +2 options farther out of the money.
  • Calendar: Sell -1 option. Buy +1 option farther out in time, at the same strike.

Typically, if bullish (bearish), sell at-the-money put (call) credit spread and/or buy a call (put) debit/ratio spread structured around target price. Alternatively, if the expected directional move is great (small), opt for a back spread (calendar spread). Also, if credit spread, capture 50-75% of the premium collected. If debit spread, capture 2-300% of the premium paid.

Be cognizant of risk exposure to direction (delta), time (theta), and volatility (vega). 

  • Negative (positive) delta = synthetic short (long). 
  • Negative (positive) theta = time decay hurts (helps).
  • Negative (positive) vega = volatility hurts (helps).

Trade Idea: SELL -1 1/2 BACKRATIO AMZN 100 (Weeklys) 6 AUG 21 3600/3700 CALL @.50 LMT

I’m bullish on Amazon and I think the stock may climb over the next week, toward $3,600. I will structure a spread above the current stock price, expiring in 1 week. I will buy the 3600 call option once (+1) and sell the 3700 call option twice (-2) for a $0.50 credit. Should the stock not move to my target, I keep the $50 credit. Should it move to $3,700, I could make $10,050.00 at expiry. Should the stock move past $3,850.00, I may incur unlimited losses. My goal, with this spread, is to capture the initial credit and close for additional credit if the stock moves higher. 

If necessary, I will hedge the position by either (A) buying long stock, (B) widening strikes, (C) buying a far out-of-the-money call option to cap upside in case of an unpredictable move higher, or (D) roll strikes up in price and out in time.

What People Are Saying

About

After years of self-education, strategy development, and trial-and-error, Renato Leonard Capelj began trading full-time and founded Physik Invest to detail his methods, research, and performance in the markets. 

Additionally, Capelj is a finance and technology reporter. Some of his biggest works include interviews with leaders such as John Chambers, founder, and CEO, JC2 Ventures, Kevin O’Leary, businessman and Shark Tank host, Catherine Wood, CEO and CIO, ARK Invest, among others.

Disclaimer

At this time, Physik Invest does not manage outside capital and is not licensed. In no way should the materials herein be construed as advice. Derivatives carry a substantial risk of loss. All content is for informational purposes only.

Categories
Commentary

Daily Brief For July 27, 2021

Market Commentary

Led by the Russell 2000, U.S. equity index futures explored lower overnight.

  • Risk-off everything China-related.
  • Ahead: Data dump and earnings.
  • S&P stuck in range, VWAP pinch.

What Happened: U.S. stock index futures auctioned sideways to lower as equity weakness in China deepened. Chinese government bonds and the yuan fell also, alongside fears that U.S. funds are selling Hong Kong and China assets aggressively.

In light of the volatility, Crescat Capital portfolio manager Otavio Costa tweeted: “A yuan devaluation is one of the main deflationary risks today. I know you heard this over and over again… but something is indeed unraveling. Chinese banks and ADRs are in big trouble. PBOC will be forced to act.”

A devaluation is indeed something to fear. The People’s Bank of China (PBOC) roiled global equity markets after its 2015 yuan devaluation.

In addition to this context, ahead, participants will receive data on durable and nondefense capital good orders, the S&P Case-Shiller home price index, consumer confidence, housing vacancies, as well as Apple Inc (NASDAQ: AAPL), Microsoft Corporation (NASDAQ: MSFT), and Alphabet Inc (NASDAQ: GOOGL) earnings.

Graphic updated 6:40 AM ET. Sentiment Neutral if expected /ES open is inside of the prior day’s range. See here for more on the Dark Pool Index and Gamma. A positive Dark Pool Index reading is bullish. At the same time, the higher (lower) the gamma, the less (more) volatility. SHIFT Search data used for options activity. Note that options flow is sorted by the call premium spent; if green and more (less) positive then more (less) was spent on call options. Breadth reflects a reading of the prior day’s Advance/Decline indicator.

What To Expect: As of 6:40 AM ET, Tuesday’s regular session (9:30 AM – 4:00 PM EST) in the S&P 500 will likely open inside of prior-range and -value, suggesting a limited potential for immediate directional opportunity.

After establishing a new high – $4,416.75 – overnight, weakness in China spilled over; U.S. equity index futures, led by the Russell 2000, traded lower in conjunction with yields, a boost to the tech- and growth-heavy Nasdaq 100.

Rates: Low rates have to potential to increase the present value of future earnings making stocks, especially those that are high growth, more attractive. To note, inflation and rates move inversely to each other. Low rates stimulate demand for loans (i.e., borrowing money is more attractive). In conjunction with the rapid recovery, lower rates may solicit hawkish commentary as policymakers look to inhibit inflation.

To note, Monday’s trade happened on positive, albeit weak breadth, similar to Friday’s session. At the same time, a Volume Weighted Average Price pinch developed.

Volume Weighted Average Price (VWAP): A metric highly regarded by chief investment officers, among other participants, for quality of trade. Additionally, liquidity algorithms are benchmarked and programmed to buy and sell around VWAPs. ​​

Look to buy above a flat/rising VWAP pinch. Sell below a flat/declining VWAP pinch.

All that said, similar to Monday, a key thing to watch for is an auction failure and subsequent liquidation break, confirmed by trade below the $4,372.50 regular trade low (RTH Low).

Liquidation Breaks: The profile shape suggests participants were “too” long and had poor location.

Moreover, for today, participants can trade from the following frameworks. 

In the best case, the S&P 500 trades sideways or higher; activity above the $4,398.75 high volume area (HVNode) pivot puts in play the $4,408.75 low volume area (LVNode). Initiative trade beyond the LVNode could reach as high as the $4,416.75 overnight high (ONH) and $4,428.25 Fibonacci extension.

In the worst case, the S&P 500 trades lower; activity below the $4,398.75 HVNode pivot puts in play the $4,390.50 minimal excess low. Initiative trade beyond the $4,390.50 low could reach as low as the $4,374.25 HVNode and $4,353.00 untested Point of Control (VPOC).

Volume Areas: A structurally sound market will build on past areas of high volume. Should the market trend for long periods of time, it will lack sound structure (identified as a low volume area which denotes directional conviction and ought to offer support on any test). 

If participants were to auction and find acceptance into areas of prior low volume, then future discovery ought to be volatile and quick as participants look to areas of high volume for favorable entry or exit.

Overnight Rally Highs (Lows): Typically, there is a low historical probability associated with overnight rally-highs (lows) ending the upside (downside) discovery process.

Excess: A proper end to price discovery; the market travels too far while advertising prices. Responsive, other-timeframe (OTF) participants aggressively enter the market, leaving tails or gaps which denote unfair prices.

POCs: POCs are valuable as they denote areas where two-sided trade was most prevalent. Participants will respond to future tests of value as they offer favorable entry and exit.
Graphic: 65-minute profile chart of the Micro E-mini S&P 500 Futures. Graphic updated 6:40 AM ET.

News And Analysis

China’s yuan, bonds tank amid fears of foreign selling.

U.S. infrastructure talks are encountering some snags.

Bitcoin steady below $40,000 on Amazon speculation.

Hypothetical look at 35 years of SPX option strategies.

The Federal Reserve meeting starts today. Watch this.

What People Are Saying

About

After years of self-education, strategy development, and trial-and-error, Renato Leonard Capelj began trading full-time and founded Physik Invest to detail his methods, research, and performance in the markets. Additionally, Capelj is a finance and technology reporter. Some of his biggest works include interviews with leaders such as John Chambers, founder and CEO, JC2 Ventures, Kevin O’Leary, businessman and Shark Tank host, Catherine Wood, CEO and CIO, ARK Invest, among others.

Disclaimer

At this time, Physik Invest does not manage outside capital and is not licensed. In no way should the materials herein be construed as advice. Derivatives carry a substantial risk of loss. All content is for informational purposes only.

Categories
Commentary

Daily Brief For July 23, 2021

Market Commentary

Equity index futures trade higher as breadth weakens. Commodities are mixed and yields are higher, also.

  • Earnings balance COVID danger.
  • Ahead is PMI and some earnings.
  • Participants look to all-time highs.

What Happened: U.S. stock index futures auctioned higher overnight alongside positive developments with respect to earnings offsetting the negatives of a COVID-19 coronavirus resurgence. 

“One of the most under-appreciated things about the equity markets right now is just how much these earnings have risen, and how much analysts have had to revise their earnings estimates up,” said Tracie McMillion, head of global asset allocation strategy at Wells Fargo Investment Institute.

Ahead is PMI for services and manufacturing as well as few earnings releases. 

Graphic updated 6:45 AM ET. Sentiment Risk-On if expected /ES open is above the prior day’s range. See here for more on the Dark Pool Index and Gamma. A positive Dark Pool Index reading is bullish. At the same time, the higher (lower) the gamma, the less (more) volatility. SHIFT Search data used for options activity. Note that options flow is sorted by the call premium spent; if green and more (less) positive then more (less) was spent on call options. Breadth reflects a reading of the prior day’s Advance/Decline indicator.

What To Expect: As of 6:45 AM ET, Friday’s regular session (9:30 AM – 4:00 PM EST) in the S&P 500 will likely open outside of prior-range and -value, suggesting a potential for immediate directional opportunity.

Gap Scenario: Gaps ought to fill quickly. Should they not, that’s a signal of strength; do not fade. Leaving value behind on a gap-fill or failing to fill a gap (i.e., remaining outside of the prior session’s range) is a go-with indicator.

Auctioning and spending at least 1-hour of trade back in the prior range suggests a lack of conviction; in such a case, do not follow the direction of the most recent initiative activity.

Adding, during the prior day’s regular trade, the best case outcome occurred, evidenced by trade that later moved participants into a balance area, above the $4,357.75 low volume area (LVNode). This is significant because the initial breakdown, from that area, signaled a clear transition from two-time frame trade, or balance, to one-time frame trade, or trend.

Volume Areas: A structurally sound market will build on past areas of high volume. Should the market trend for long periods of time, it will lack sound structure (identified as a low volume area which denotes directional conviction and ought to offer support on any test). 

If participants were to auction and find acceptance into areas of prior low volume, then future discovery ought to be volatile and quick as participants look to areas of high volume for favorable entry or exit.

Coming into Thursday’s session, markets were positioned for higher. Increased acceptance at higher prices moved the micro-composite Point of Control (MCPOC) up to $4,341.75, breadth was fantastic, and dynamics with respect to market liquidity, and the derivatives market, were confirmations. 

POCs: POCs are valuable as they denote areas where two-sided trade was most prevalent. Participants will respond to future tests of value as they offer favorable entry and exit.

Coming into Friday’s session, conditions are less favorable.

Yesterday, the so-called other timeframes (OTFs) – those larger participants that have the wherewithal to move price – were not far apart in their views. The S&P 500 was rangebound between the $4,341.75 MCPOC and $4,357.75 LVNode – key levels highlighted in the morning commentary – as participants worked off the near-vertical price from day’s prior, positioning themselves for new information. 

In the face of that balancing activity, the market was not supported, internally; among other factors, breadth, measured by the Advance/Decline indicator, was divergent. 

Graphic: Equity index leaders rose in price as internal divergences – like the ratio of advancers to decliners – grew. Noting a bigger divergence in internals tracking Nasdaq issues. 

So, with that, despite the path of least resistance being higher, participants are to limit their expectations for future trade. Certain mechanics are likely to quell upside volatility, leading to a stall or slower advance. 

For today, participants can trade from the following frameworks. 

In the best case, the S&P 500 trades sideways or higher; activity above the $4,317.25 high volume area (HVNode) puts in play the $4,384.50 minimal excess, regular trade high (RTH High). Initiative trade beyond the RTH High could reach as high as the Fibonacci-derived price targets at $4,393.75 and $4,413.75.

Excess: A proper end to price discovery; the market travels too far while advertising prices. Responsive, other-timeframe (OTF) participants aggressively enter the market, leaving tails or gaps which denote unfair prices.

In the worst case, the S&P 500 trades lower; activity below the $4,371.25 HVNode puts in play the low end of the balance or the $4,357.75 LVNode. Initiative trade beyond the LVNode could reach as low as the $4,341.75 MCPOC and $4,315.25 HVNode.

It is important to note also that the last two key levels correspond with key Volume Weighted Average Price (VWAP) levels, a metric highly regarded by chief investment officers, among other participants, for quality of trade. Additionally, liquidity algorithms are benchmarked and programmed to buy and sell around VWAPs.

Graphic: 65-minute profile chart of the Micro E-mini S&P 500 Futures. Graphic updated 6:45 AM ET.

News And Analysis

Pfizer shot halts severe illness, allows infection in Israel. (BBG)

Delinquencies fall below the pre-great recession average. (MND)

Analysis: Case for stablecoins being new shadow banks. (BBG)

Study: Sharp dip in antibody levels after first Pfizer dose. (REU)

Fed seen speeding taper of MBS in early-2022 pullback. (BBG)

Digital euro poses disintermediation risks to Euro banks. (Moody’s)

Car chip shortage to abate, smartphones probably next. (REU)

U.K.’s growth slows sharply in July amid COVID’s return. (REU)

What People Are Saying

About

After years of self-education, strategy development, and trial-and-error, Renato Leonard Capelj began trading full-time and founded Physik Invest to detail his methods, research, and performance in the markets. Additionally, Capelj is a finance and technology reporter. Some of his biggest works include interviews with leaders such as John Chambers, founder and CEO, JC2 Ventures, Kevin O’Leary, businessman and Shark Tank host, Catherine Wood, CEO and CIO, ARK Invest, among others.

Disclaimer

At this time, Physik Invest does not manage outside capital and is not licensed. In no way should the materials herein be construed as advice. Derivatives carry a substantial risk of loss. All content is for informational purposes only.

Categories
Commentary

Daily Brief For July 22, 2021

Market Commentary

Equity index futures trade higher as volatility implodes. Yields, commodities are higher, too. 

  • President Biden played down inflation.
  • Ahead: Claims, home sales, earnings.
  • Equity indices up on fantastic breadth.

What Happened: U.S. stock index futures auctioned higher alongside comments against inflation by President Joe Biden, yesterday. Virus fears ebbed as infections accelerated. 

Bitcoin extended its advance after Elon Musk, Catherine Wood, and Jack Dorsey talked cryptocurrency at a virtual event.

Ahead is data on weekly jobless claims, existing home sales, and corporate earnings. 

Graphic updated 6:30 AM ET. Sentiment Risk-On if expected /ES open is above the prior day’s range. See here for more on the Dark Pool Index and Gamma. A positive Dark Pool Index reading is bullish. At the same time, the higher (lower) the gamma, the less (more) volatility. SHIFT Search data used for options activity. Note that options flow is sorted by the call premium spent; if green and more (less) positive then more (less) was spent on call options. Breadth reflects a reading of the prior day’s Advance/Decline indicator.

What To Expect: As of 6:30 AM ET, Thursday’s regular session (9:30 AM – 4:00 PM EST) in the S&P 500 will likely open on a small gap, just outside of prior-range and -value, suggesting a potential for immediate directional opportunity.

Balance-Break and/or Gap Scenarios: Monitor for acceptance (i.e., more than 1-hour of trade) outside of the balance area.

Gaps ought to fill quickly. Should they not, that’s a signal of strength; do not fade. Leaving value behind on a gap-fill or failing to fill a gap (i.e., remaining outside of the prior session’s range) is a go-with indicator.

Auctioning and spending at least 1-hour of trade back in the prior range suggests a lack of conviction; in such a case, do not follow the direction of the most recent initiative activity.

Adding, during the prior day’s regular trade, the best case outcome occurred, evidenced by trade above the $4,334.25 spike base. As that happened, participants found increased acceptance at higher prices, moving the micro-composite Point of Control (MCPOC) up to $4,341.75, a pivot point (i.e., above = bullish, below = bearish) for today’s trade. This is noteworthy since it suggests the fairest price to do business, on a larger timeframe, is higher. 

At the same time, in support of the price rise was fantastic breadth and dynamics with respect to the derivatives market; amidst a crash in volatility, associated hedging activities bolster the rally. 

Coming into the balance-area sellers initiated from the weak prior, however, certain mechanics may quell the upside volatility, potentially leading to a stall or slower advance. 

Graphic: SpotGamma data suggests the S&P 500 is back in so-called “long-gamma” territory. Gamma is the sensitivity of an option to changes in the underlying price. Dealers that take the other side of options trades hedge their exposure to risk by buying and selling the underlying. When dealers are short-gamma, they hedge by buying into strength and selling into weakness. When dealers are long-gamma, they hedge by selling into strength and buying into weakness. The former exacerbates volatility. The latter calms volatility.

Moreover, for today, participants can trade from the following frameworks. 

In the best case, the S&P 500 trades sideways or higher; activity above the $4,341.75 MCPOC puts participants just short of entry into a prior balance area, near the $4,357.75 low volume area (LVNode). Initiative trade beyond the $4,357.75 LVNode could reach as high as the $4,371.00 POC and $4,384.50 minimal excess regular trade high (RTH), the typical scenario on re-entry into balance. 

In the worst case, the S&P 500 trades lower; activity below the $4,341.75 MCPOC puts in play the $4,325.75 LVNode. Initiative trade beyond the $4,325.75 LVNode could reach as low as the $4,315.25 and $4,299.75 high volume areas (HVNodes). 

It is important to note also that the prior two HVNodes correspond with key Volume Weighted Average Price (VWAP) levels, a metric highly regarded by chief investment officers, among other participants, for quality of trade. Additionally, liquidity algorithms are benchmarked and programmed to buy and sell around VWAPs.

Balance (Two-Timeframe Or Bracket): Rotational trade that denotes current prices offer favorable entry and exit. Balance-areas make it easy to spot a change in the market (i.e., the transition from two-time frame trade, or balance, to one-time frame trade, or trend).

POCs: POCs are valuable as they denote areas where two-sided trade was most prevalent. Participants will respond to future tests of value as they offer favorable entry and exit.

Volume Areas: A structurally sound market will build on past areas of high volume. Should the market trend for long periods of time, it will lack sound structure (identified as a low volume area which denotes directional conviction and ought to offer support on any test). 

If participants were to auction and find acceptance into areas of prior low volume, then future discovery ought to be volatile and quick as participants look to areas of high volume for favorable entry or exit.

Excess: A proper end to price discovery; the market travels too far while advertising prices. Responsive, other-timeframe (OTF) participants aggressively enter the market, leaving tails or gaps which denote unfair prices.
Graphic: 65-minute profile chart of the Micro E-mini S&P 500 Futures. Updated 6:30 AM ET.

News And Analysis

Strong job and real estate markets support credit. (Moody’s)

Federal Reserve ramps up debate on taper timing. (WSJ)

China offers oil reserves in a move to cool oil rally. (BBG)

Biden dismisses inflation worries, warns on hiring. (BBG)

U.S.-China goods trade booms amid virus, tariffs. (BBG)

Powell has broad support among top Biden aides. (BBG)

PG&E plans to bury power lines in fire-risk areas. (WSJ)

EMEA economies recovering faster than thought. (S&P)

Structured finance sees issuances rising to $1.4T. (S&P)

What People Are Saying

About

After years of self-education, strategy development, and trial-and-error, Renato Leonard Capelj began trading full-time and founded Physik Invest to detail his methods, research, and performance in the markets. Additionally, Capelj is a finance and technology reporter. Some of his biggest works include interviews with leaders such as John Chambers, founder and CEO, JC2 Ventures, Kevin O’Leary, businessman and Shark Tank host, Catherine Wood, CEO and CIO, ARK Invest, among others.

Disclaimer

At this time, Physik Invest does not manage outside capital and is not licensed. In no way should the materials herein be construed as advice. Derivatives carry a substantial risk of loss. All content is for informational purposes only.

Categories
Commentary

Daily Brief For July 20, 2021

Market Commentary

Equity index futures trade higher. Volatility ebbs. 

  • Pandemic, U.S.-China tensions frighten.
  • Ahead: Building permits, housing starts.
  • Stocks, bonds stabilize. Crypto free-falls. 

What Happened: U.S. stock index futures auctioned higher overnight after violent trade the day prior. The volatility comes alongside renewed pandemic fears and geopolitical tensions.

Ahead, participants are looking forward to data on building permits, housing starts, and earnings.

Graphic updated 7:00 AM ET. Sentiment Neutral if expected /ES open is inside of the prior day’s range. See here for more on the Dark Pool Index and Gamma. A positive Dark Pool Index reading is bullish. At the same time, the higher (lower) the gamma, the less (more) volatility. SHIFT Search data used for options activity. Note that options flow is sorted by the call premium spent; if green and more (less) positive then more (less) was spent on call options. Breadth reflects a reading of the prior day’s Advance/Decline indicator.

What To Expect: As of 7:00 AM ET, Tuesday’s regular session (9:30 AM – 4:00 PM EST) in the S&P 500 will likely open inside of prior range, suggesting a limited potential for immediate directional opportunity.

Adding, during the prior day’s regular trade, the worst case outcome occurred, evidenced by initiative trade below the $4,285.25 composite Point of Control (POC). This is significant because it denotes movement below the fairest price to do business since the June 20 swing low. Now, initiative buyers have a clear line in the sand – $4,285.25 – when it comes to making headway into overhead supply.

POCs: POCs are valuable as they denote areas where two-sided trade was most prevalent. Participants will respond to future tests of value as they offer favorable entry and exit.

Further, participants observed a rush into Treasuries pushing yields as low as 1.17% on the 10-year note, as well as a bid in the dollar. According to some outlets, there’s evidence the reflation trade is getting unwound. At the same time, coming into the equity market decline, the number of put options sold-to-open saw heightened levels, a potentially destabilizing force as associated hedging forces promote volatility.

With that, yesterday, participants bought calls and sold puts suggesting confidence in the low. 

Nonetheless, the reversal happened at a key technical level leaving behind minimal excess. Cognizant of the aforementioned, participants can trade from the following frameworks. 

Excess: A proper end to price discovery; the market travels too far while advertising prices. Responsive, other-timeframe (OTF) participants aggressively enter the market, leaving tails or gaps which denote unfair prices.

In the best case, the S&P 500 trades sideways or higher; activity above the $4,285.25 MCPOC puts in play the $4,299.75 HVNode. Trade beyond the $4,299.75 HVNode could reach as high as the $4,334.25 spike base.

In the worst case, the S&P 500 trades lower; activity below the $4,285.25 MCPOC likely puts in play the $4,247.75 LVNode. Trade beyond the $4,247.75 LVNode could reach as low as the $4,229.00 VPOC and $4,224.25 low volume area (LVNode), the location of a minimal excess low.

Volume Areas: A structurally sound market will build on past areas of high volume. Should the market trend for long periods of time, it will lack sound structure (identified as a low volume area which denotes directional conviction and ought to offer support on any test). 

If participants were to auction and find acceptance into areas of prior low volume, then future discovery ought to be volatile and quick as participants look to areas of high volume for favorable entry or exit.

Spikes: Spike’s mark the beginning of a break from value. Spikes higher (lower) are validated by trade at or above (below) the spike base (i.e., the origin of the spike).
Graphic: 65-minute profile chart of the Micro E-mini S&P 500 Futures.

News And Analysis

Europe the first region to cross 50M COVID cases. (REU)

Companies could be afraid to give bullish outlooks. (CNBC)

Tokyo 2020 chief doesn’t rule out late cancellation. (CNBC)

Port Chief sees U.S. import surge lasting into 2022. (BBG)

Crypto slides with Yellen leading regulatory scrutiny. (FT)

China rejects hacking, accusing the U.S. of spying. (CNBC)

Brussels warns of threat posed by states’ defiance. (FT)

What People Are Saying

About

After years of self-education, strategy development, and trial-and-error, Renato Leonard Capelj began trading full-time and founded Physik Invest to detail his methods, research, and performance in the markets. Additionally, Capelj is a finance and technology reporter. Some of his biggest works include interviews with leaders such as John Chambers, founder and CEO, JC2 Ventures, Kevin O’Leary, businessman and Shark Tank host, Catherine Wood, CEO and CIO, ARK Invest, among others.

Disclaimer

At this time, Physik Invest does not manage outside capital and is not licensed. In no way should the materials herein be construed as advice. Derivatives carry a substantial risk of loss. All content is for informational purposes only.