Market Commentary
Equity index futures recover from a violent liquidation.
- Push-pull on contradicting narratives.
- Ahead: Housing data, FOMC minutes.
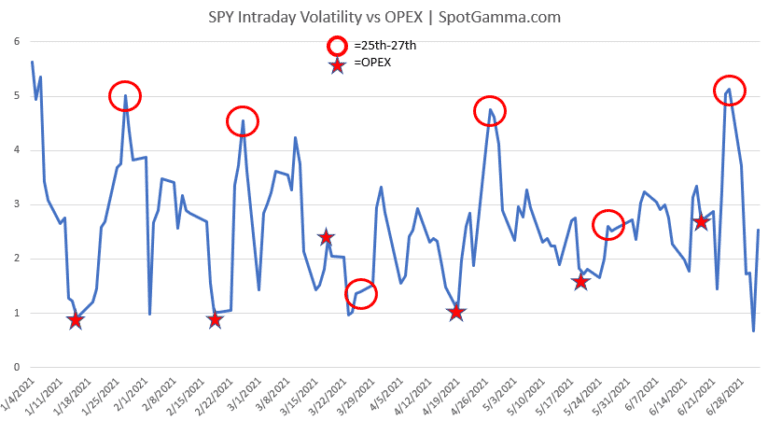
- Volatility rises ahead of a large OPEX.
What Happened: U.S. stock index futures auctioned sideways to higher, overnight, ahead of key releases including the latest Federal Reserve minutes.
“Unless Fed minutes ‘reveal something substantively different from recent source stories, the market is unlikely to react significantly, and choppy trading may continue,’” Mizuho International Plc strategists including Peter Chatwell said in a note featured by Bloomberg.
Ahead is data on building permits and housing starts (8:30 AM ET), Fed speak by James Bullard (12:00 PM ET), and FOMC minutes (2:00 PM ET).

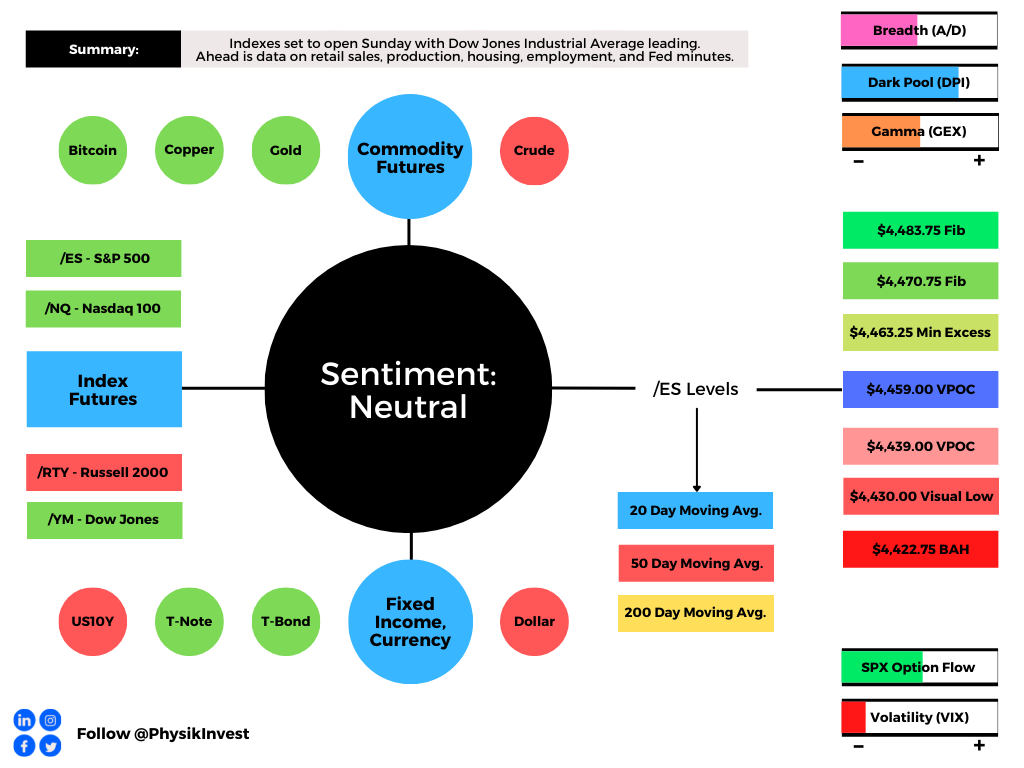
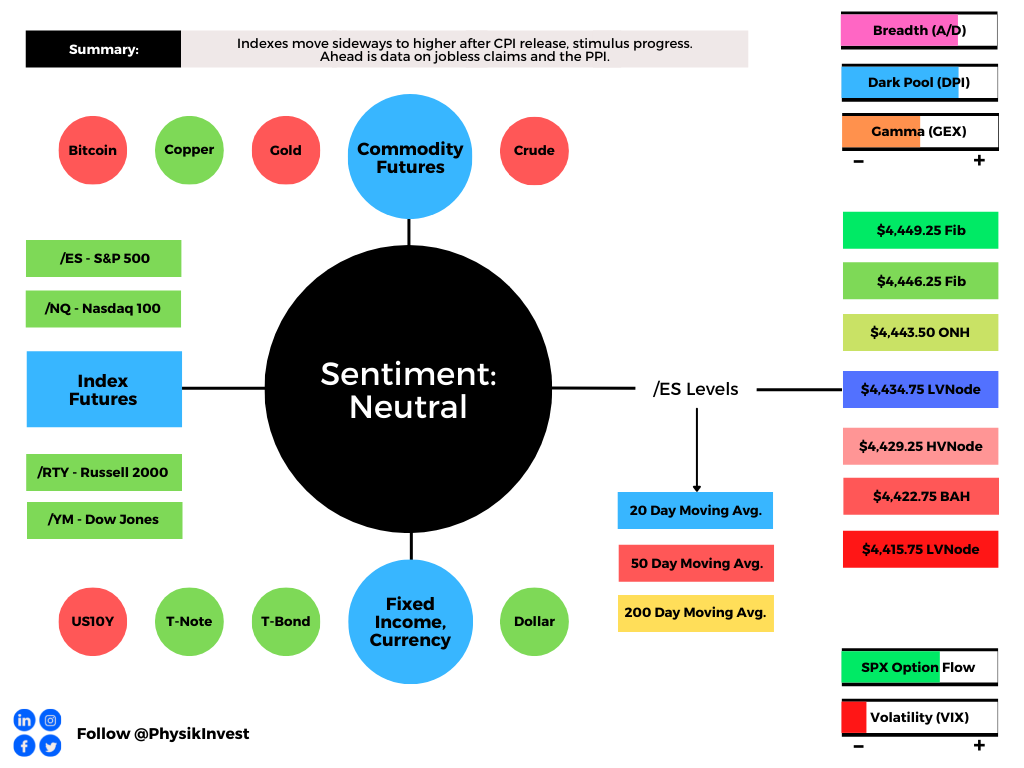
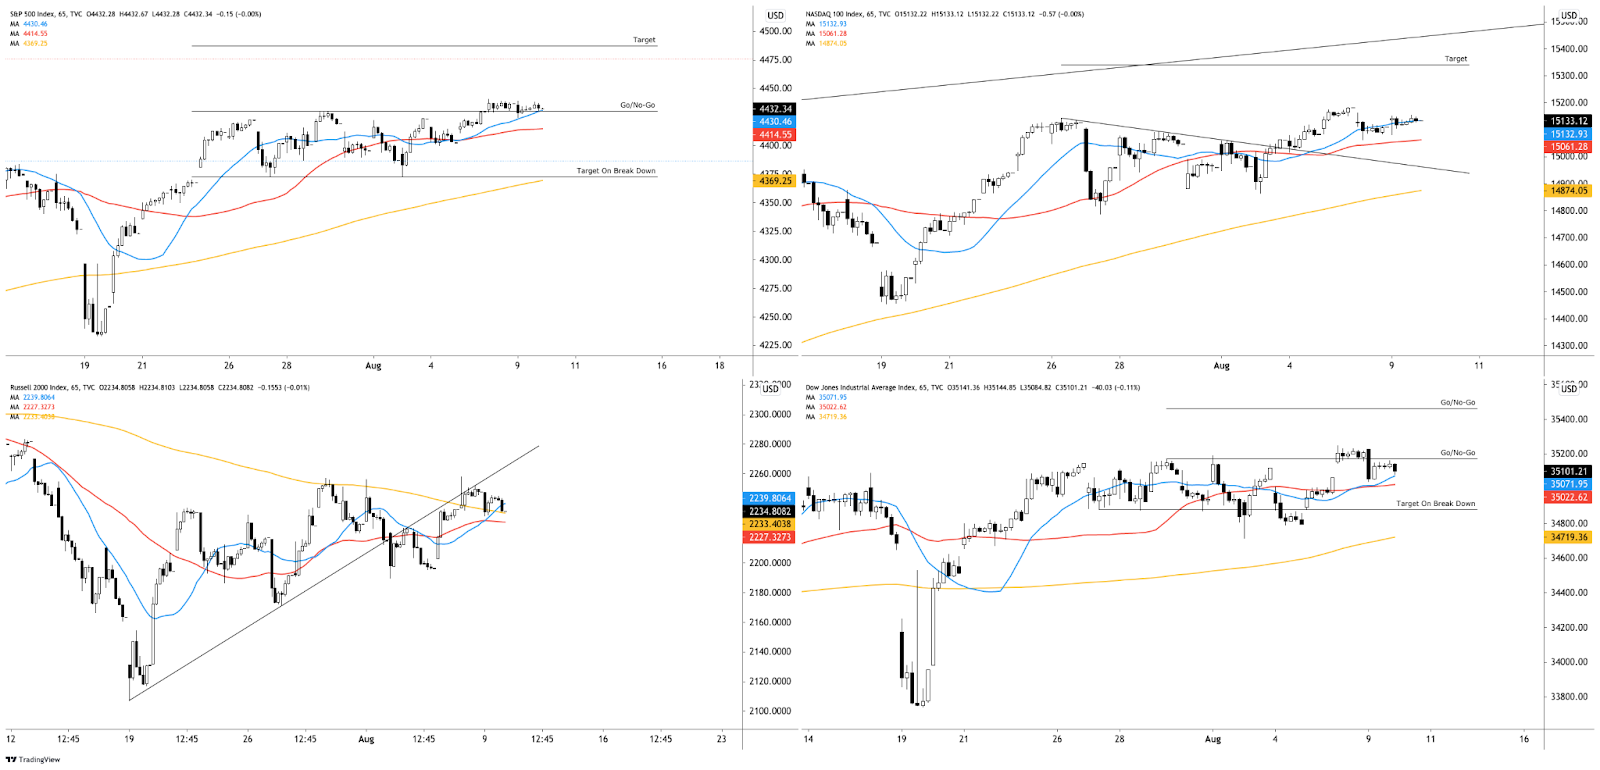
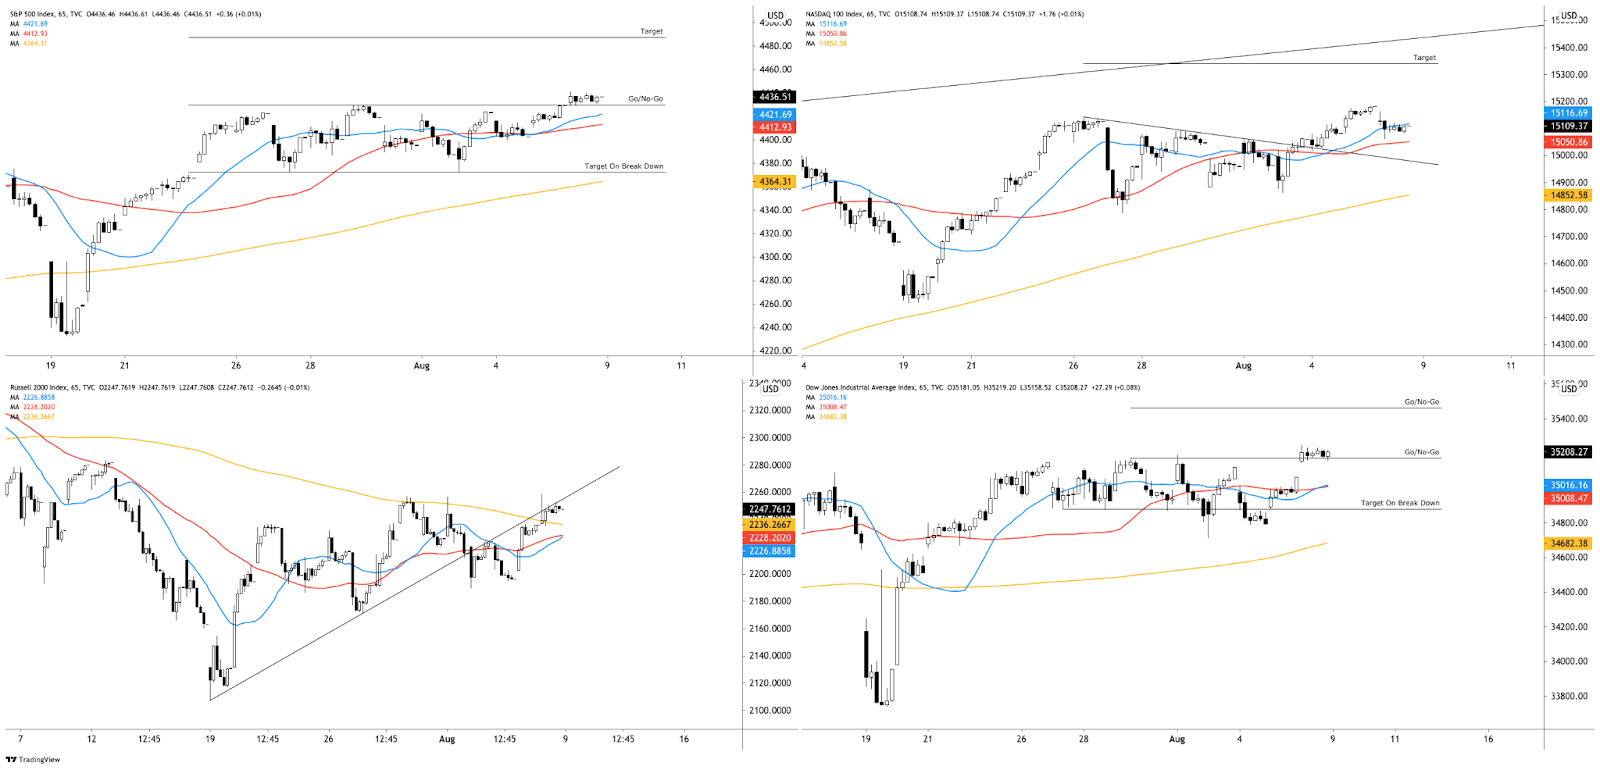
What To Expect: As of 6:45 AM ET, Wednesday’s regular session (9:30 AM – 4:00 PM EST) in the S&P 500 will likely open inside of prior-range and -value, suggesting a limited potential for immediate directional opportunity.
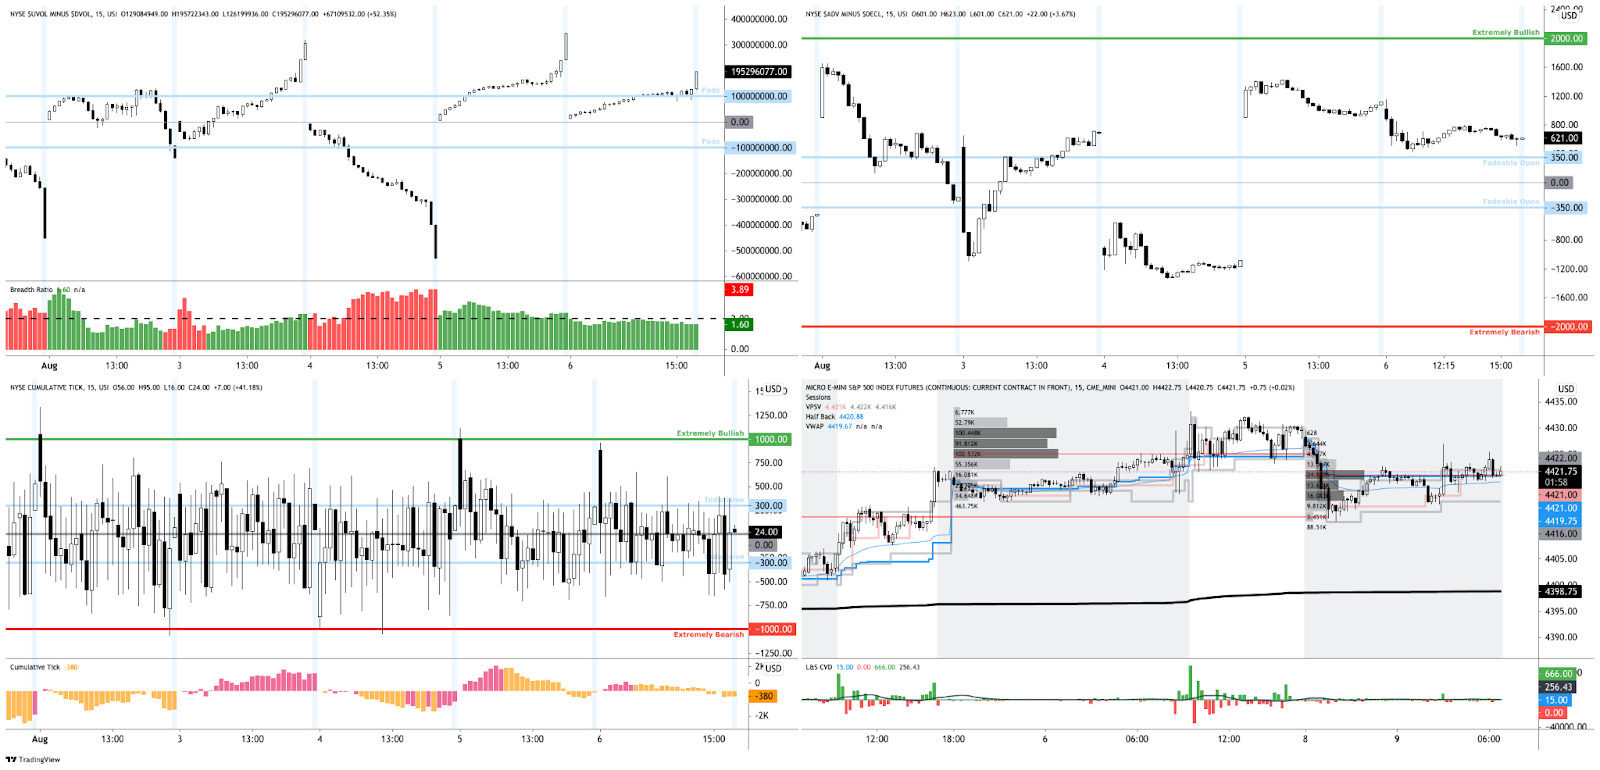
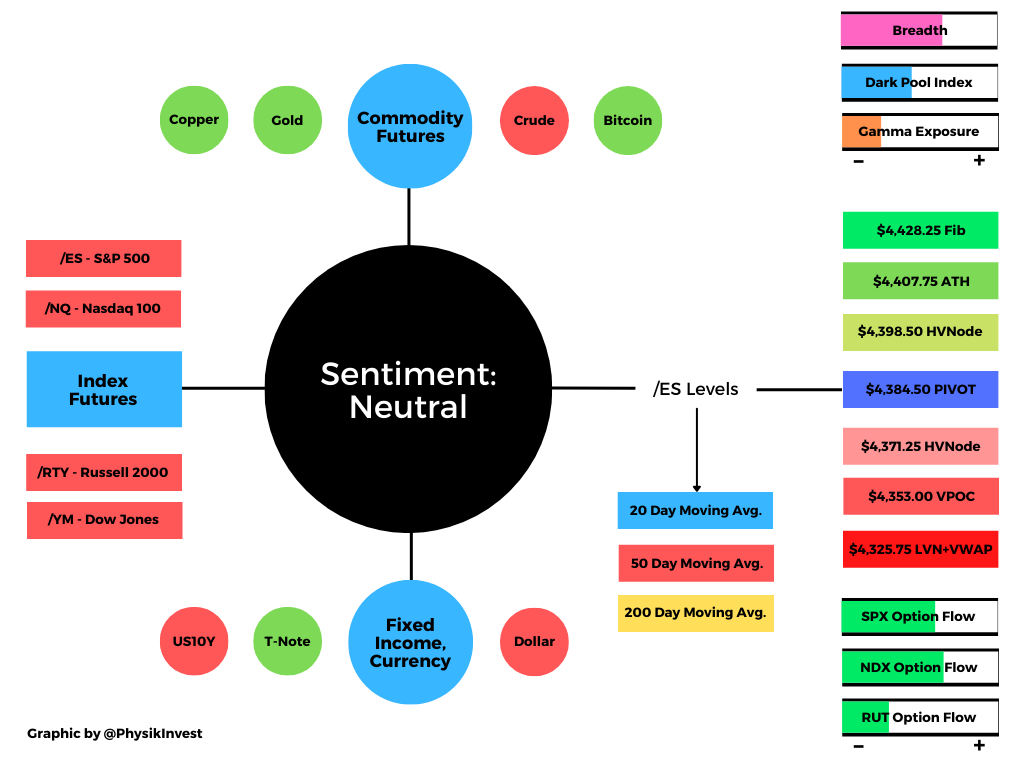
Adding, during the prior day’s regular trade, on weak intraday breadth and market liquidity metrics, the worst-case outcome occurred, evidenced by trade below the $4,456.75 low volume area (LVNode) pivot.
This is significant because the initiative trade resulted in a test of the $4,422.75 balance area high (BAH) – a go/no-go level on a prior breakout – as well as the 20-day simple moving average, a metric that ought to solicit a response by short-term (i.e., technically driven) participants who may be unable to defend retests.
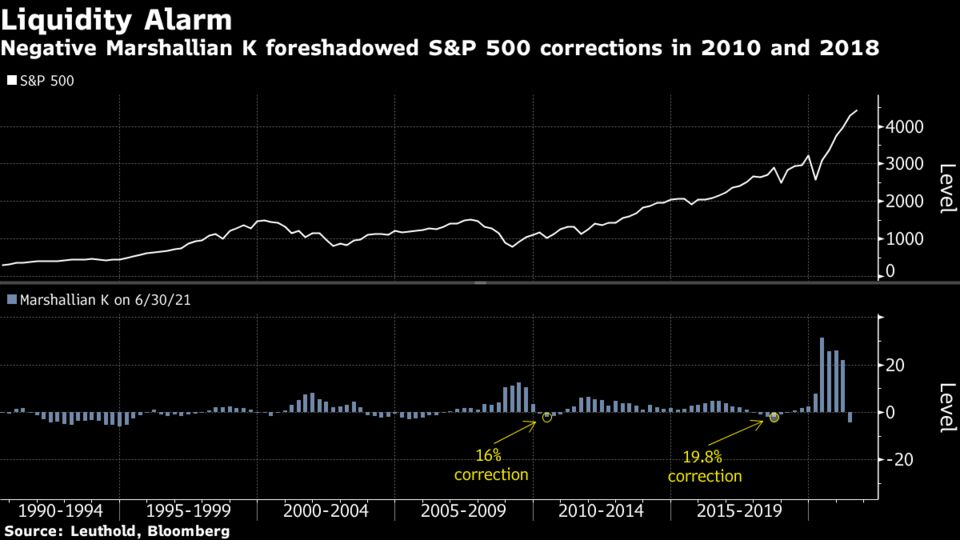
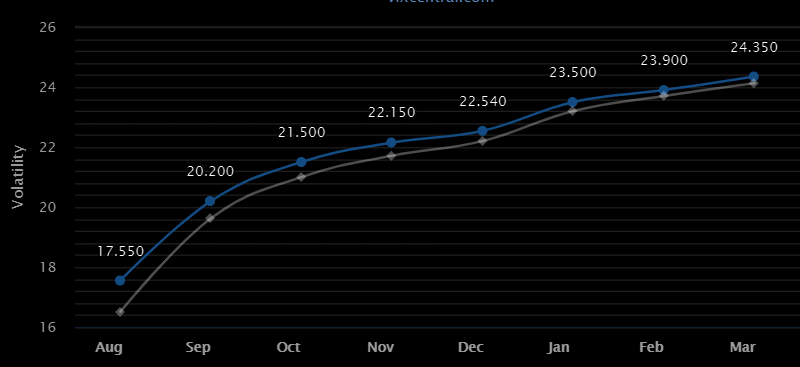
Further, the aforementioned trade is happening in the context of a rollover in macro expectations, peak long equity positioning, breadth divergences, a monthly options expiry (OPEX), as well as a shift higher in the VIX futures term structure.
The implications of these themes on price are contradictory; to elaborate, extended positioning – which alone suggests risks are asymmetric – coupled with a large OPEX and pronounced shift in shorter-dated VIX expiries, warns of elevated near-term risks for equity market stability.
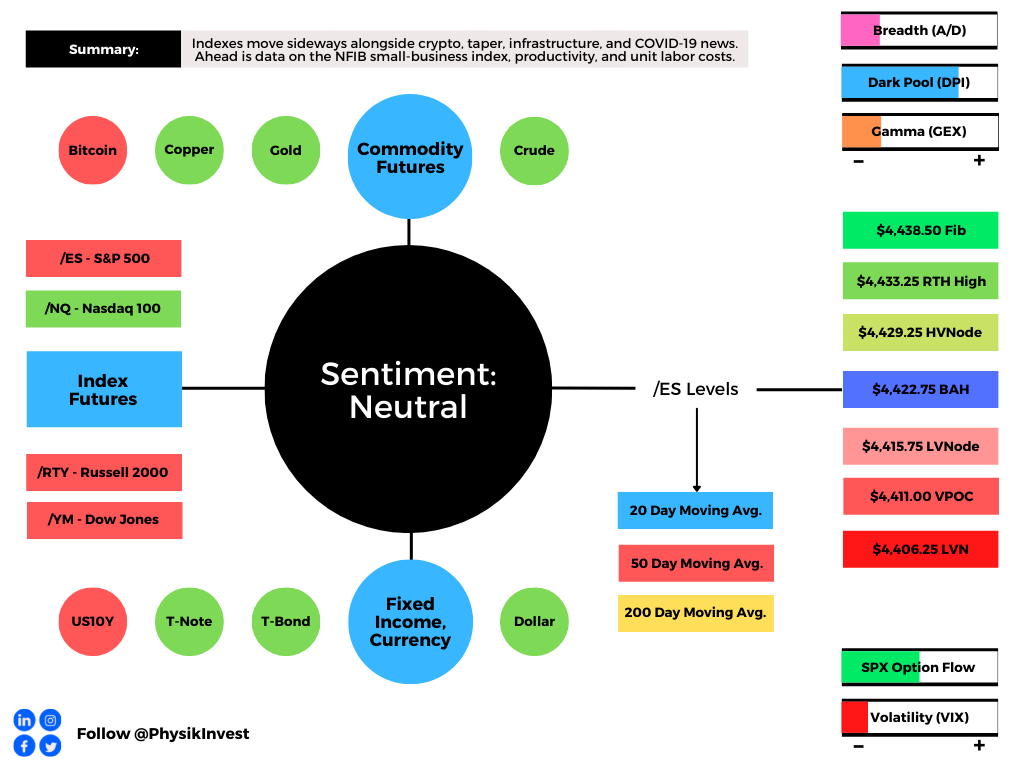
Moreover, for today, given expectations of middling volatility and responsive trade, participants may make use of the following frameworks.
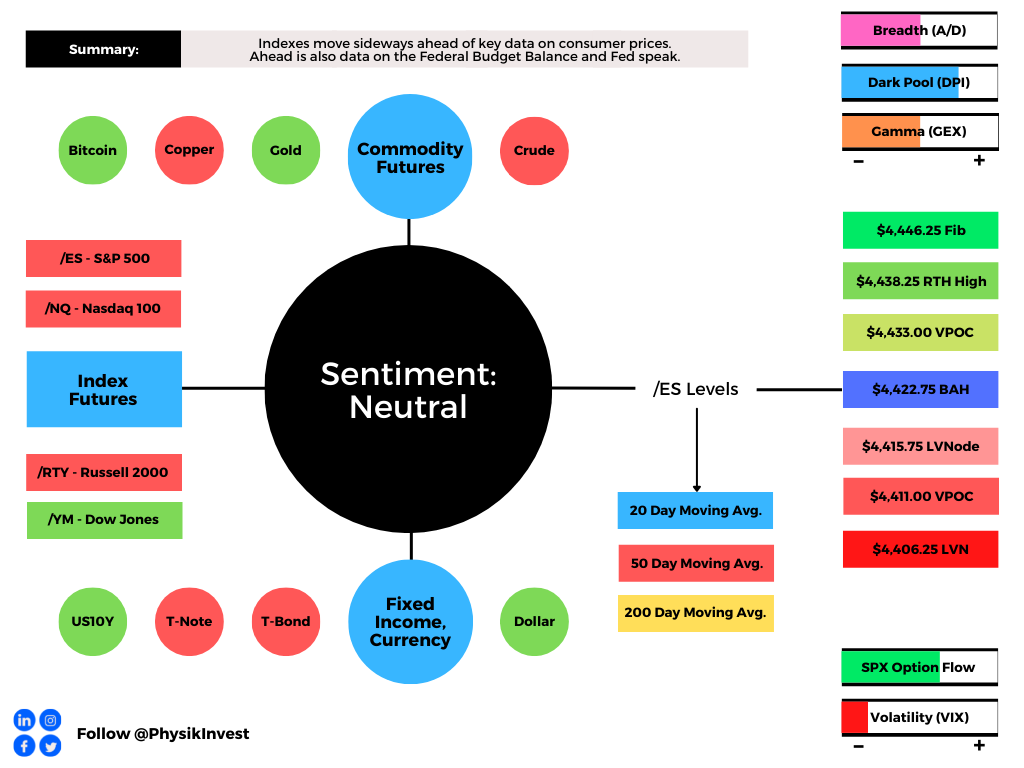
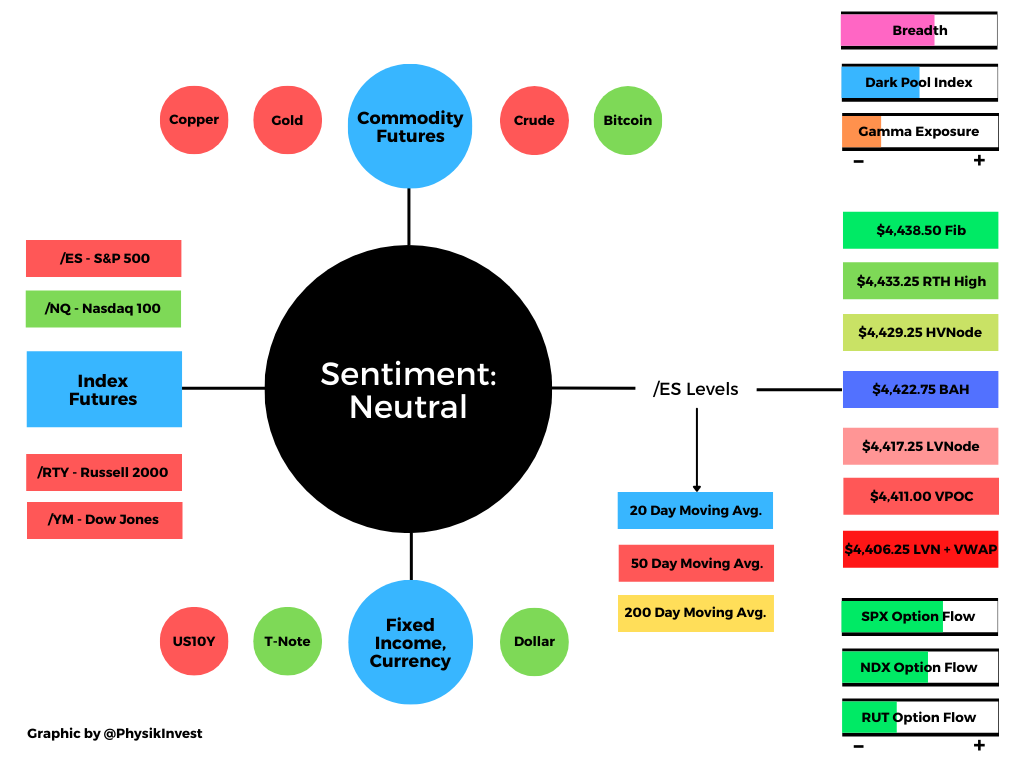
In the best case, the S&P 500 trades sideways or higher; activity above the $4,447.25 high volume area (HVNode) pivot puts in play the $4,456.75 low volume area (LVNode). Initiative trade beyond the $4,456.75 LVNode could reach as high as the $4,463.75 LVNode and $4,476.50 overnight high (ONH).
In the worst case, the S&P 500 trades lower; activity below the $4,447.25 HVNode puts in play the $4,434.25 LVNode. Initiative trade beyond the $4,434.25 LVNode could reach as low as the aforementioned $4,422.75 BAH and $4,411.00 VPOC, which is a tick or so below the minimal excess low Tuesday’s liquidation produced.
Volume Areas: A structurally sound market will build on past areas of high volume. Should the market trend for long periods of time, it will lack sound structure (identified as a low volume area which denotes directional conviction and ought to offer support on any test).

If participants were to auction and find acceptance into areas of prior low volume, then future discovery ought to be volatile and quick as participants look to areas of high volume for favorable entry or exit.

Overnight Rally Highs (Lows): Typically, there is a low historical probability associated with overnight rally-highs (lows) ending the upside (downside) discovery process.

Excess: A proper end to price discovery; the market travels too far while advertising prices. Responsive, other-timeframe (OTF) participants aggressively enter the market, leaving tails or gaps which denote unfair prices.

POCs: POCs are valuable as they denote areas where two-sided trade was most prevalent. Participants will respond to future tests of value as they offer favorable entry and exit.

News And Analysis
Mixed messages in new home purchase applications.
China quietly defuses hidden government debt bomb.
Consumers are wary of COVID return amid recovery.
ARK Invest’s Cathie Wood hits back at Michael Burry.
President Biden plans to urge COVID-19 booster shot.
U.S. freezes nearly $9.5B in Afghanistan bank assets.
The stage is set for the next leg up in cyclicals, value.
JPMorgan and Lloyds look to spur more fintech deals.
Developments in Afghanistan may threaten neighbors.
What People Are Saying
About
After years of self-education, strategy development, and trial-and-error, Renato Leonard Capelj began trading full-time and founded Physik Invest to detail his methods, research, and performance in the markets.
Additionally, Capelj is a finance and technology reporter. Some of his biggest works include interviews with leaders such as John Chambers, founder and CEO, JC2 Ventures, Kevin O’Leary, businessman and Shark Tank host, Catherine Wood, CEO and CIO, ARK Invest, among others.
Disclaimer
At this time, Physik Invest does not manage outside capital and is not licensed. In no way should the materials herein be construed as advice. Derivatives carry a substantial risk of loss. All content is for informational purposes only.