
Market Commentary
Equity index futures are sideways and divergent.
- Taper talk, COVID-19 fears, infrastructure news.
- Ahead: NFIB, productivity, unit labor, Fed speak.
What Happened: U.S. stock index futures auctioned sideways alongside COVID-19 fears, infrastructure, crypto regulation, and taper talk.
This comes as core inflation is expected to come in around 4.8%, “likely unhinging Powell and expediting the talk about talking about tapering as early as in September,” according to Nordea.
Ahead is data on the NFIB small-business index, productivity, unit labor costs, and earnings. Cleveland Fed President Loretta Mester speaks at 10:00 AM ET.
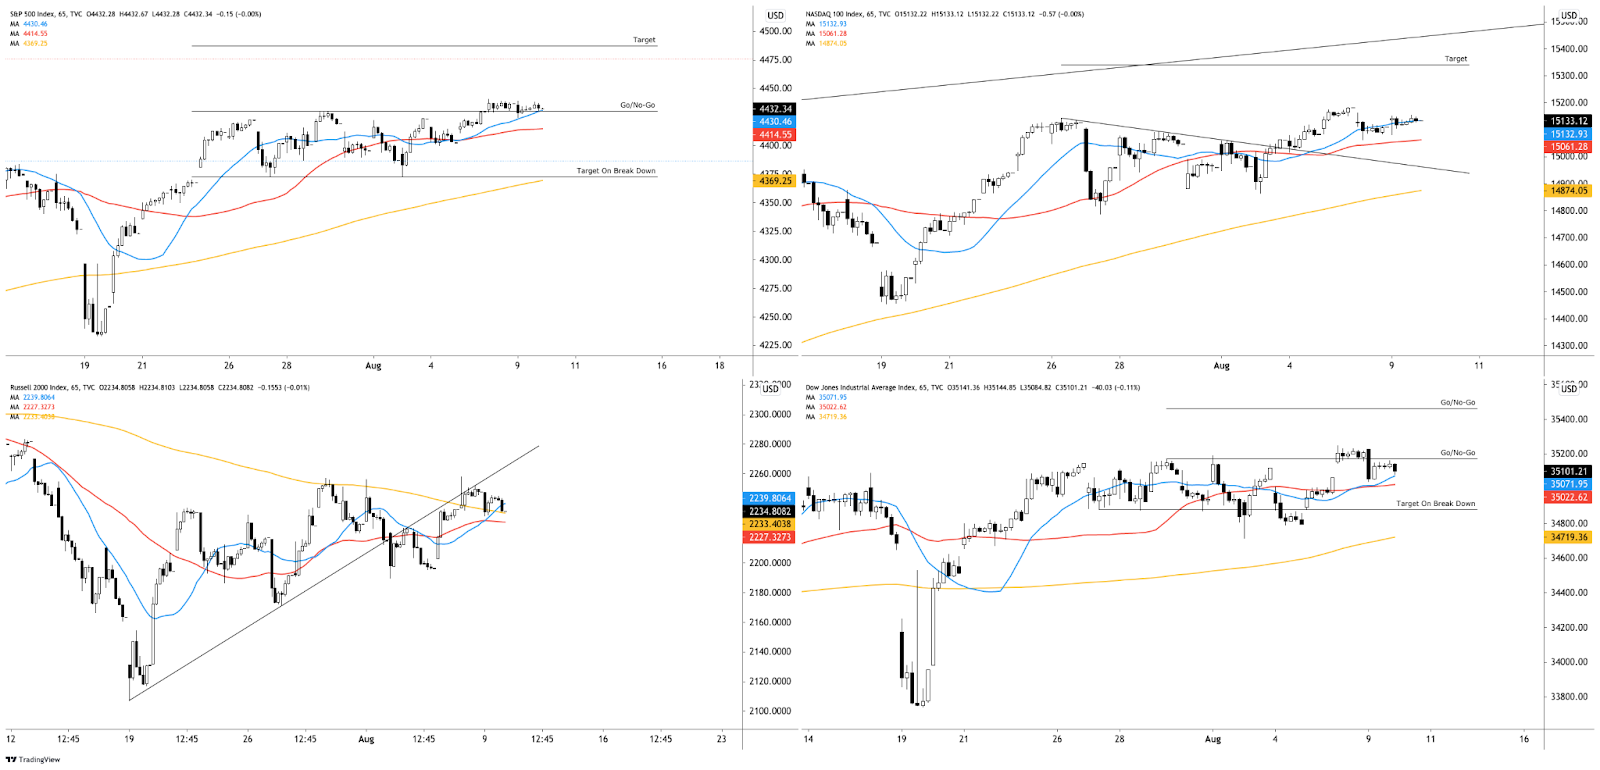
What To Expect: As of 6:30 AM ET, Tuesday’s regular session (9:30 AM – 4:00 PM EST) in the S&P 500 will likely open inside of prior-range and -value, suggesting a limited potential for immediate directional opportunity.
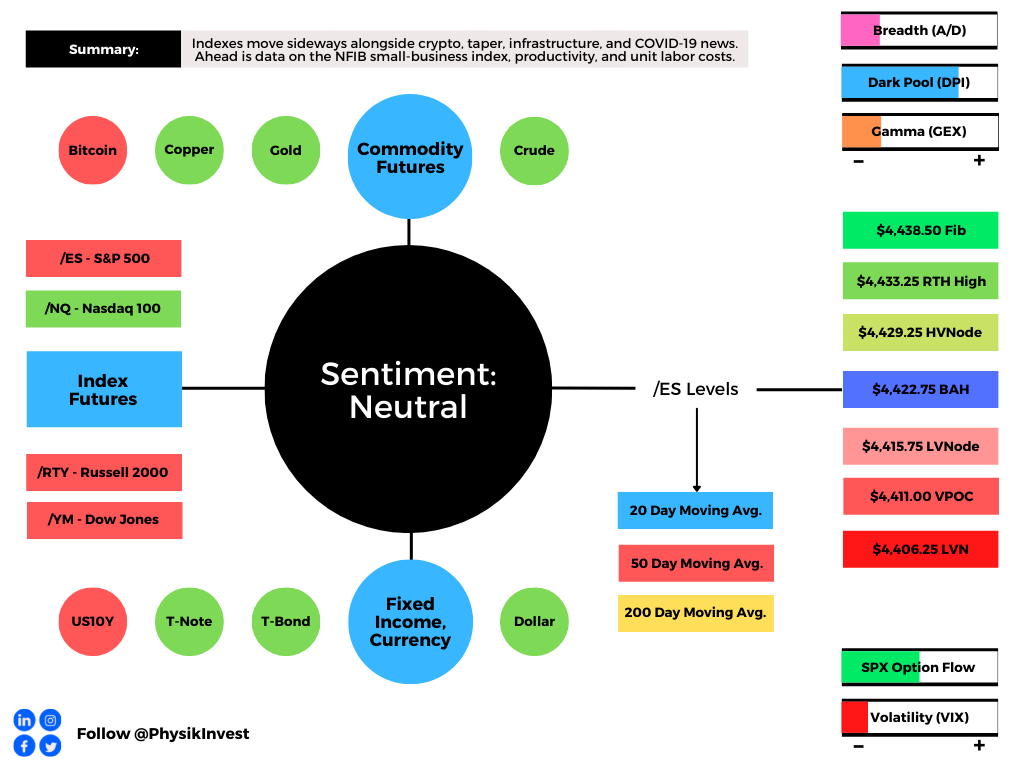
Adding, during the prior day’s regular trade, the best case outcome occurred, evidenced by sideways trade at the $4,422.75 balance area high (BAH). This is significant because the BAH marked a shift in tone (i.e., a transition from two-time frame trade, or balance, to one-time frame trade, or trend).
Given that the BAH was not lost, the default balance break scenarios remain in play (i.e., play the break rather than fade the edges). As a result, we monitor for rejection (i.e., a return inside of balance). This would portend a move to the opposite end of balance, or the $4,365.25 low volume area (LVNode) in the S&P 500 future.
To note, briefly, yesterday’s rangebound trade came alongside divergences with respect to price, market liquidity, and market internals.
For instance, breadth at the exchange level was negative with a minuscule inflow into stocks that were down, versus those that were up. The cumulative volume delta – a measure of buying and selling power as calculated by the difference in volume traded at the bid and offer – diverged from mid-afternoon prices inspiring confidence in responsive trade.
Responsive Buying (Selling): Buying (selling) in response to prices below (above) an area of recent price acceptance.
Moreover, for today, participants can trade from the following frameworks.
In the best case, the S&P 500 trades sideways or higher; activity above the $4,422.75 BAH puts in play the $4,429.25 high volume area (HVNode). Initiative trade beyond the HVNode could reach as high as the $4,433.25 regular trade high (RTH High) and $4,438.50 Fibonacci extension.
In the worst case, the S&P 500 trades lower; activity below the $4,422.75 BAH puts in play the $4,415.76 LVNode. Initiative trade beyond the LVNode could reach as low as the $4,411.00 untested point of control (VPOC) and $4,406.25 LVNode.
Initiative Buying (Selling): Buying (selling) within or above (below) the previous day’s value area.

Volume Areas: A structurally sound market will build on past areas of high volume. Should the market trend for long periods of time, it will lack sound structure (identified as a low volume area which denotes directional conviction and ought to offer support on any test).

If participants were to auction and find acceptance into areas of prior low volume, then future discovery ought to be volatile and quick as participants look to areas of high volume for favorable entry or exit.

POCs: POCs are valuable as they denote areas where two-sided trade was most prevalent. Participants will respond to future tests of value as they offer favorable entry and exit.

Significance Of Prior ATHs, ATLs: Prices often encounter resistance (support) at prior highs (lows) due to the supply (demand) of old business. These areas take time to resolve. Breaking and establishing value (i.e., trading more than 30-minutes beyond this level) portends continuation.

News And Analysis
China’s top oil refiner said to cut run as delta hits.
Biden’s agenda teed up for Senate endorsement.
SoftBank cut China investments until more clarity.
Major shocks see a divergence in rating migration.
The fully vaccinated are still catching COVID-19.
Analysts are warning on buy now, pay later trend.
What People Are Saying
About
After years of self-education, strategy development, and trial-and-error, Renato Leonard Capelj began trading full-time and founded Physik Invest to detail his methods, research, and performance in the markets.
Additionally, Capelj is a finance and technology reporter. Some of his biggest works include interviews with leaders such as John Chambers, founder and CEO, JC2 Ventures, Kevin O’Leary, businessman and Shark Tank host, Catherine Wood, CEO and CIO, ARK Invest, among others.
Disclaimer
At this time, Physik Invest does not manage outside capital and is not licensed. In no way should the materials herein be construed as advice. Derivatives carry a substantial risk of loss. All content is for informational purposes only.