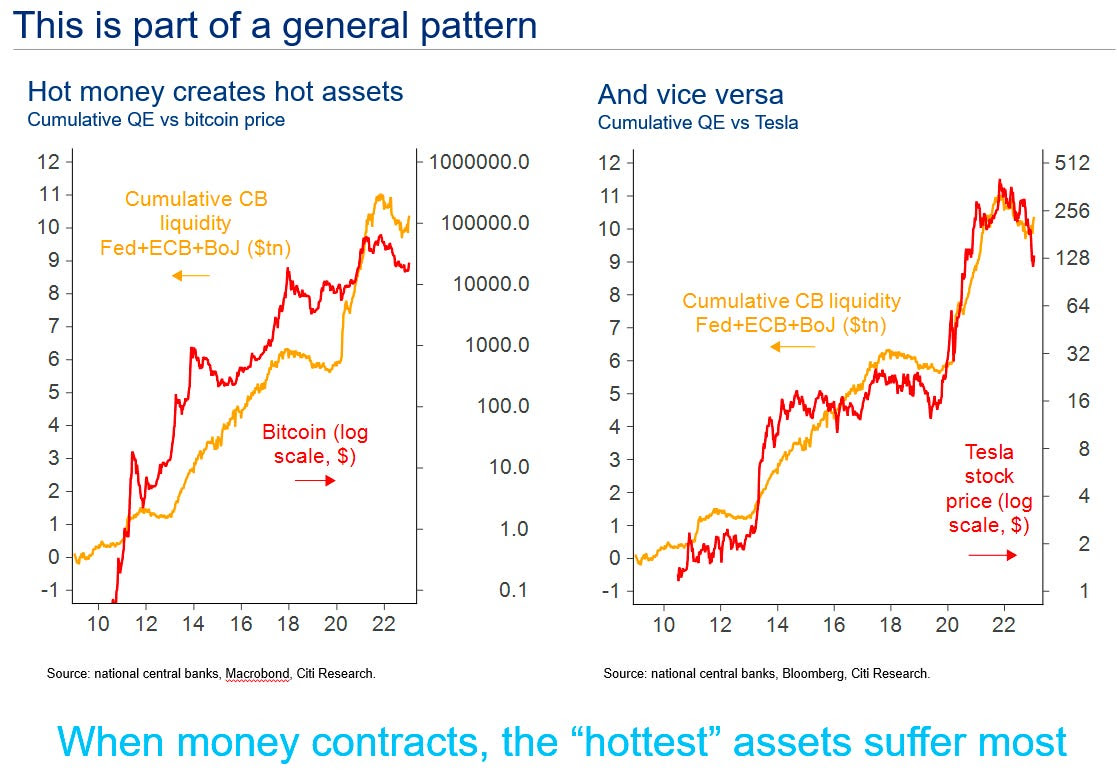
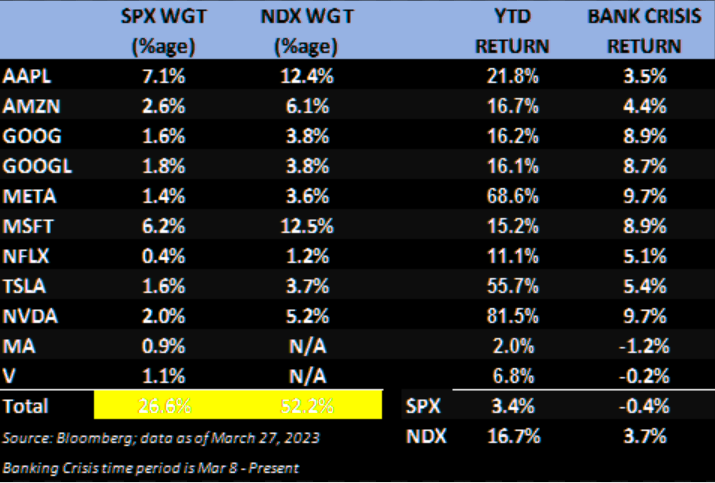
We’re excited to announce that we will be publishing ultra-detailed notes with context on fundamentals, positioning, and specific trades. Notes will be nearly 3,000 words or more, and will not be in the traditional newsletter format. Though this newsletter will continue to be published, it will not maintain previously long lengths because of time constraints. Notwithstanding, there will be occasional longer issues, we promise! We aim for quality rather than quantity. Stay tuned for future money-making updates.
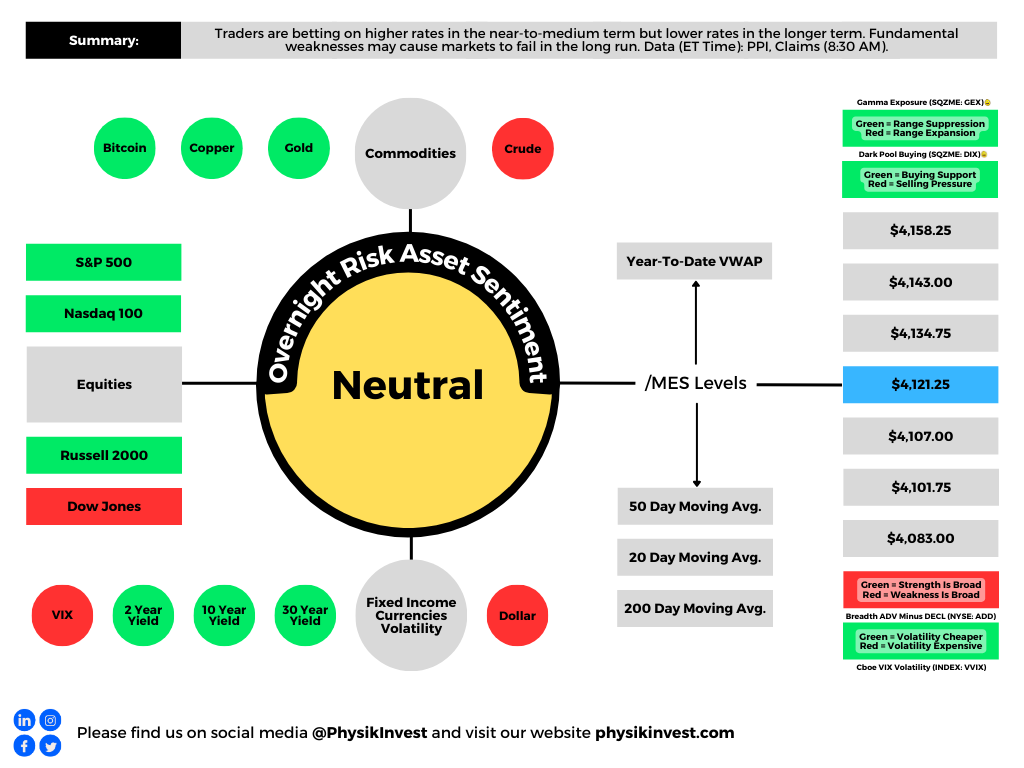
Market indicators suggest an interest rate hike in May is more likely. This is backed by inflation data and Federal Reserve meeting minutes.
To be more specific, the indicators show traders are betting on higher rates in the near-to-medium term, and lower rates in the longer term. Adding, while inflation has moderated and there have been recent turbulences in the banking sector, monetary policymakers think higher rates for just a bit more are valid. However, they are also aware that a reduction in lending could potentially lead to defaults, recession, and a credit crunch in the worst-case scenario.
Fed President John Williams agreed that bringing down inflation requires more work. Williams suggested that the Fed should consider one more interest-rate hike before pausing, but the actual trajectory of rates will be based on analysis of newer data.
Per Cem Karsan from Kai Volatility, the negative effects of policy decisions will take time to reflect in the market.
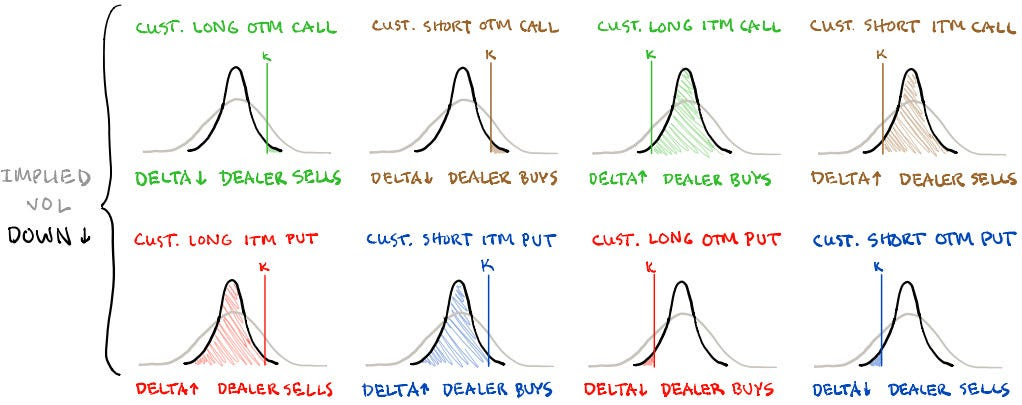
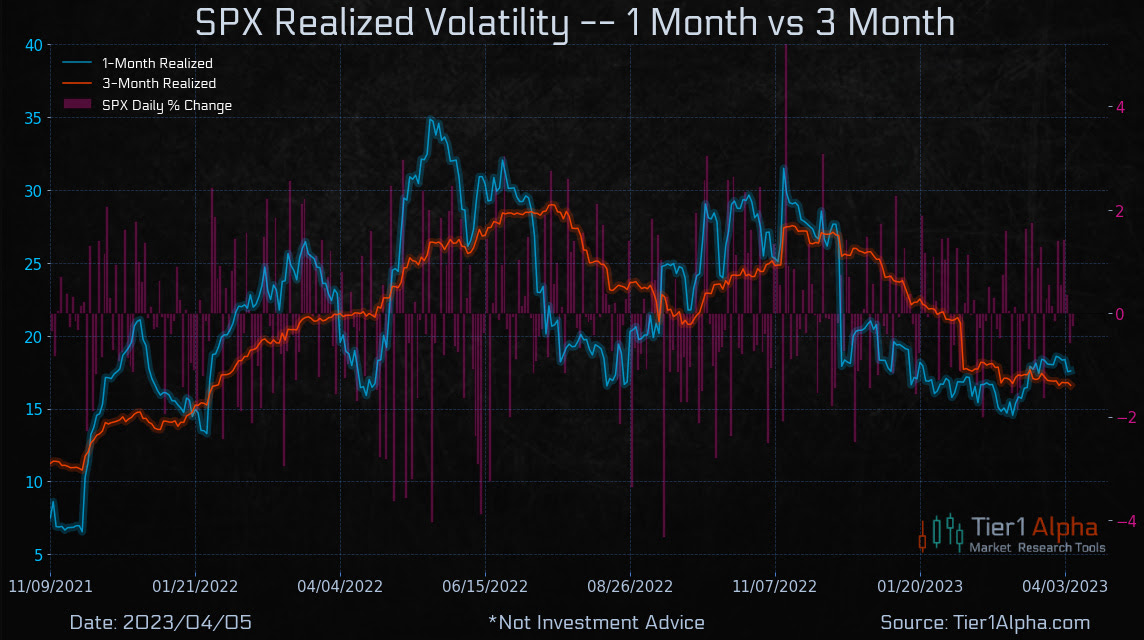
He said investors are mostly bullish with a +1 Put, +100 Stock, -1 Call position, while dealers hold the opposite with a -1 Put, -100 Stock, +1 Call position. As the volatility trends lower (e.g., S&P 500 realized volatility or RVOL is ~10), options lose value, and dealers must buy back their short stock to re-hedge. This supports the market.
Thus, Karsan said the markets will be contained in the short to medium term, but fundamental weaknesses, such as the Fed hiking long-end yields, may cause them to fail in the long run. We maintain medium-term strength is monetizable via call spread structures discussed in prior newsletters. Rotating profits into longer-dated bets on markets or rates falling is attractive as well.
About
Welcome to the Daily Brief by Physik Invest, a soon-to-launch research, consulting, trading, and asset management solutions provider. Learn about our origin story here, and consider subscribing for daily updates on the critical contexts that could lend to future market movement.
Separately, please don’t use this free letter as advice; all content is for informational purposes, and derivatives carry a substantial risk of loss. At this time, Capelj and Physik Invest, non-professional advisors, will never solicit others for capital or collect fees and disbursements. Separately, you may view this letter’s content calendar at this link.
Short, low-alpha letter. We are working on an in-depth write-up detailing what trades to take and why they are optimal. Enjoy your day, and keep risk in check.
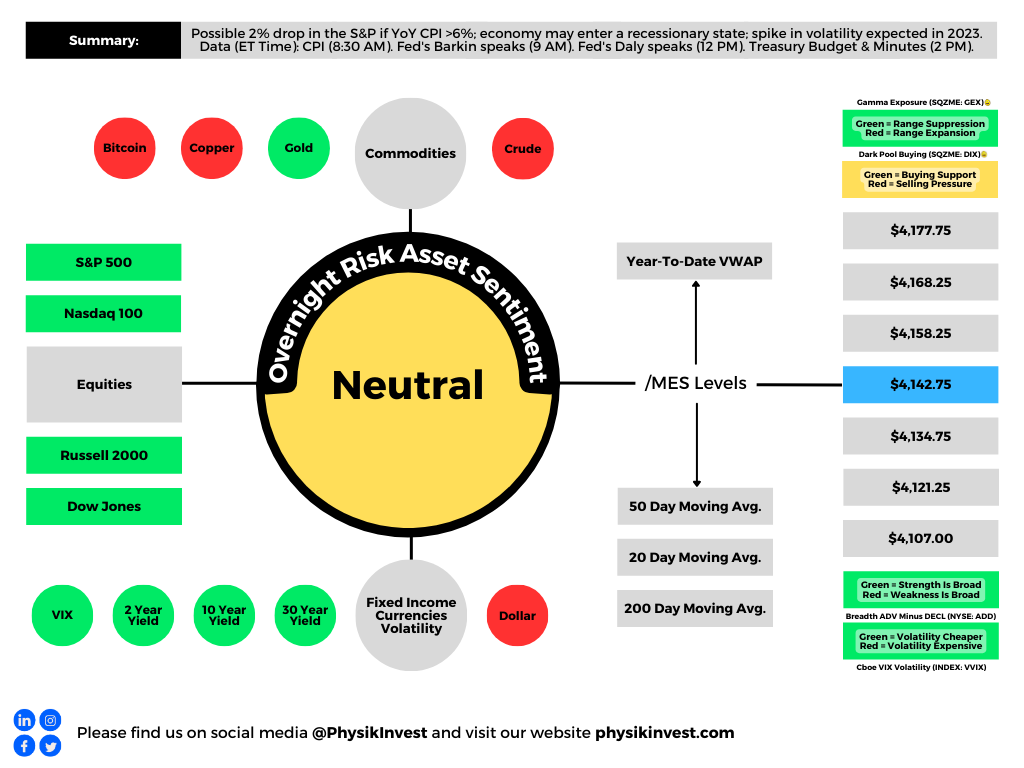
Goldman Sachs Group Inc (NYSE: GS) warns the S&P 500 (INDEX: SPX) could drop upwards of 2% if the consumer price index (CPI) comes in hot.
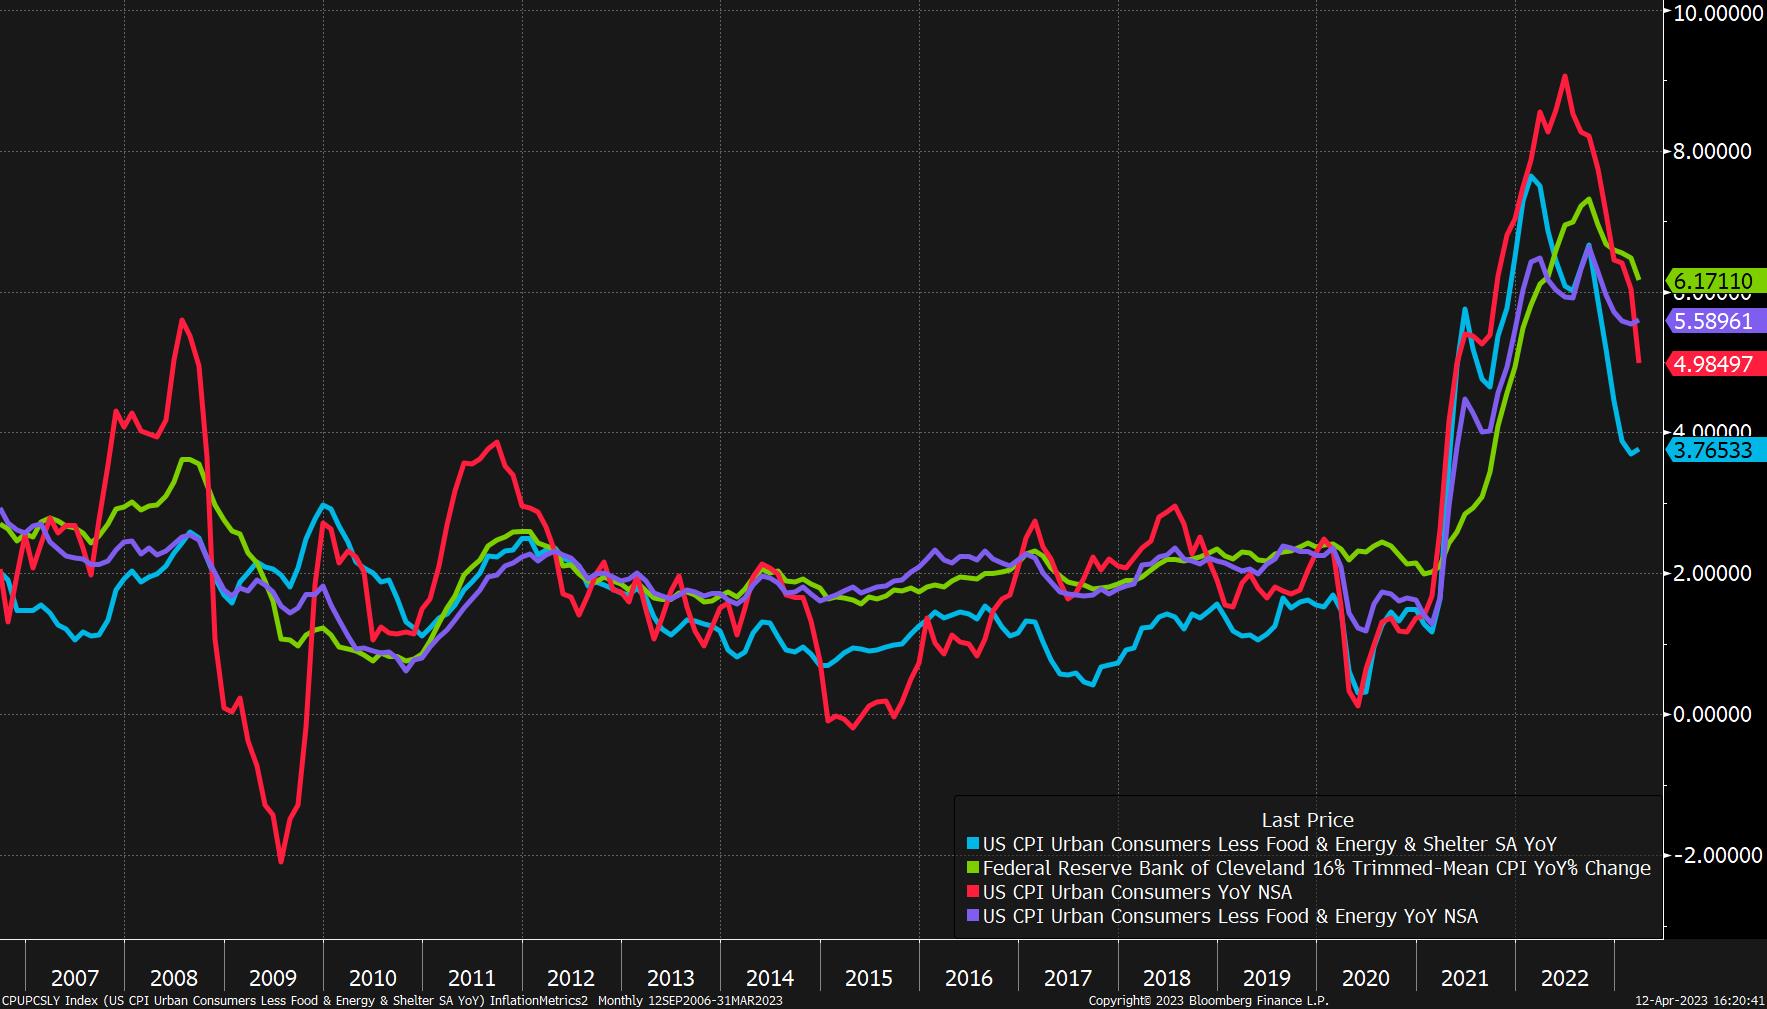
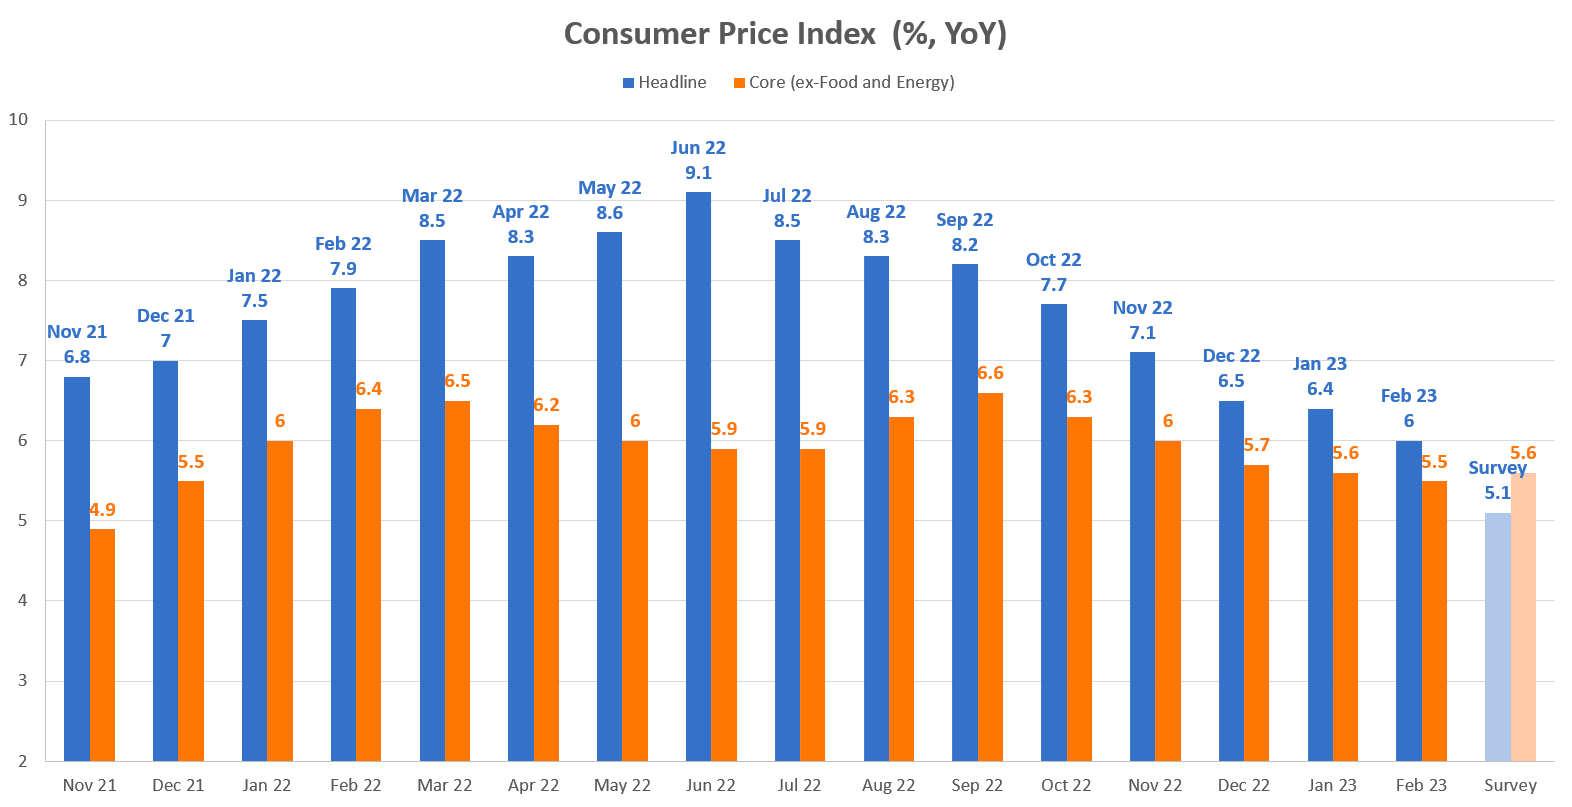
If year-over-year inflation exceeds the previous reading of 6.00%, stocks will likely fall ~2%; Tier1Alpha suggests “we could see between $4 to $7 billion of equities sold off, as … funds will have to de-risk their portfolio.”
If year-over-year inflation meets the consensus of 5.10%, stocks will likely rise; from an options positioning perspective, if fears are assuaged, and traders supply their bets on or hedges against the market direction (i.e., vol falls), this may indirectly add support.
Graphic: Retrieved from SqueezeMetrics. Dealer hedges with the underlying (i.e., stock or future).
CPI and Federal Reserve meeting minutes could clarify how much more policymakers have to go to rein inflation.
Based on the data and policy response, the consensus is that the economy is already entering a recession; GS warns that recession may manifest a spike in volatility during the rest of 2023, Bloomberg reports, noting they prefer hedging equity declines with put spreads (i.e., buy put, sell put below it) and collars (i.e., own stock and sell call to finance put spread). We wonder who has been saying the same thing for weeks.
About
Welcome to the Daily Brief by Physik Invest, a soon-to-launch research, consulting, trading, and asset management solutions provider. You can learn about our origin story here, and consider subscribing for daily updates on the critical contexts that could lend to future market movement.
Separately, please don’t use this free letter as advice; all content is for informational purposes, and derivatives carry a substantial risk of loss. At this time, Capelj and Physik Invest, non-professional advisors, will never solicit others for capital or collect fees and disbursements. Separately, you may view the content calendar at this link.
A big deal was made surrounding some data that shows investors increasing their bets on US equities falling; net short positions in the E-mini S&P 500 (FUTURE: /ES) are the highest since 2011, Bloomberg reports. JPMorgan Chase & Co (NYSE: JPM) and Goldman Sachs Group Inc (NYSE: GS) concur as their data showsclients betting on stocks falling or reducing stock exposure quickly.
This is happening in the context of some mixed, albeit still robust-leaning, data; payrolls upped bets that the Federal Reserve or Fed would move its target rate to 5.00-5.25%. GS’ Bobby Molavi adds, “the prevalent view seems to be that more things will break on the back of rapid rise in cost of capital.”
In light of the rate expectations, the Nasdaq 100 (INDEX: NDX) appears to be handing over the leadership baton to the S&P 500 (INDEX: SPX), though both indexes remain primarily intact and coiling; the fundamental-type pressures are balanced by follow-on support from those actors that base their decisions on such things as the amount a market moves (i.e., realized volatility or RVOL), says Tier1Alpha and SpotGamma.
The two providers of market insights see falling implied (IVOL) and RVOL as catalysts for buying stocks. This, coupled with the hedging of soon-to-expire large options open interest, particularly on the put side, in a lower liquidity environment, supports the indexes while underlying breadth and correlations are underwhelming.
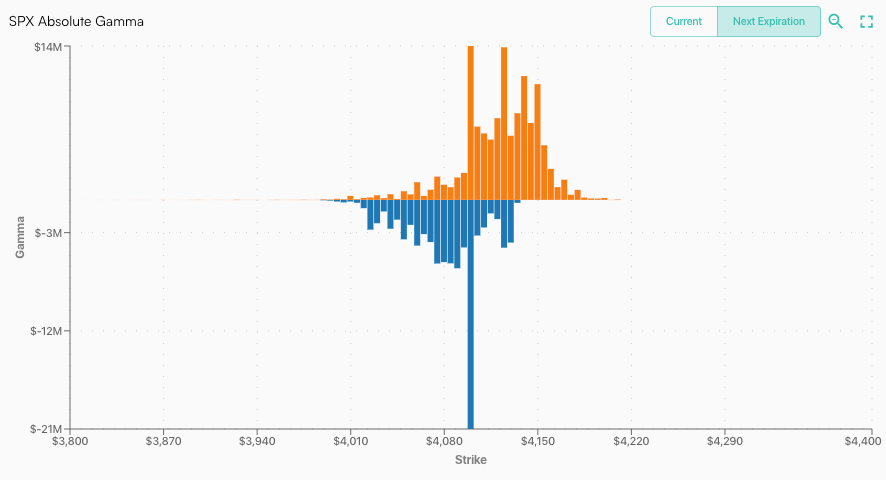
A large concentration of put open interest near current prices is pictured just below. The eventual removal of this put-heavy positioning will reduce some directional risks to options counterparts; as puts disappear or decline in value, their delta or exposure to direction does too. If a counterparty is short a put and has less positive delta to hedge, they may buy back some of their short-delta exposure in the underlying index, a catalyst for higher S&P 500 prices.
Graphic: Retrieved from SpotGamma.
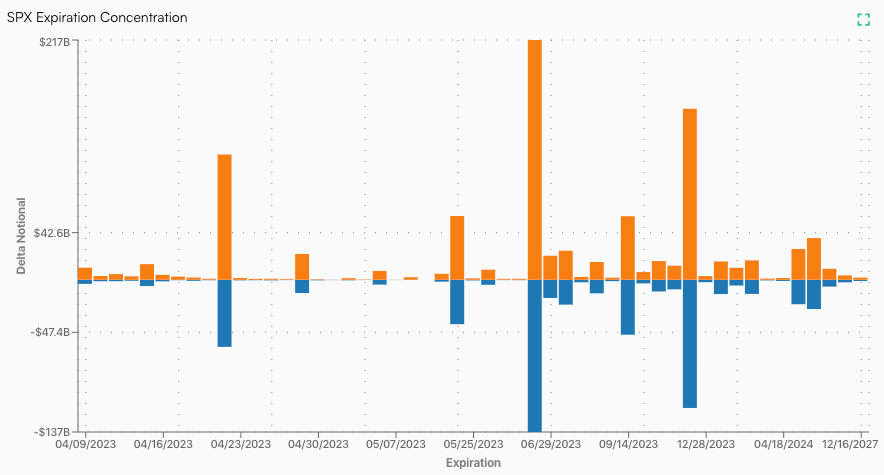
A large open interest concentration set to roll off this April is pictured just below.
Retrieved from SpotGamma.
This has happened before. Newfound Research explains it best in their paper titled “Liquidity Cascades: The Coordinated Risk of Uncoordinated Market Participants.”
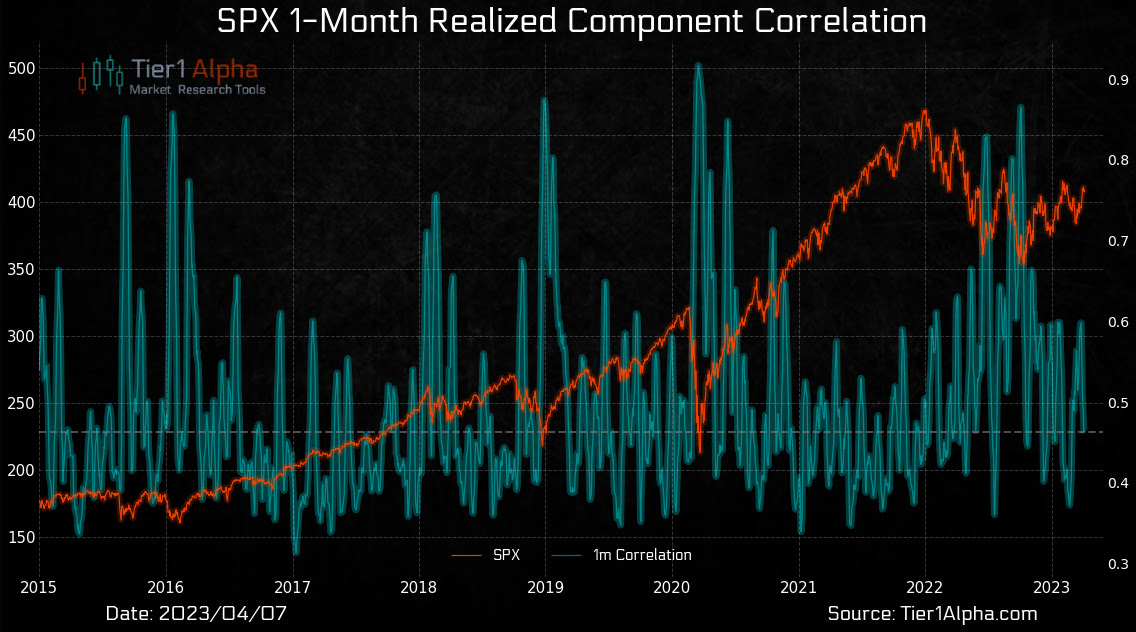
In keeping the indexes and their underlying idiosyncratic baskets in line via arbitrage constraints, while there is a build-up of suppressive and supportive dealer hedging at the index level, “then the only reconciliation is a decline in correlation.”
In this context, Tier1Alpha explains, “lower correlations tend to lead to lower volatility … giv[ing] volatility control funds the go-ahead to augment their risk exposure, with an estimated $14 billion in equities purchases … to be spread out in blocks.”
Consequently, in line with our thesis that positioning and technical contexts support near-term strength, it still makes sense to take the profits of very wide, albeit low- or zero-cost, call ratio spread structures discussed in past letters to cut the cost of our bets on the equity market downside and lower rates with more time to expiry. Should the indexes trade higher, SpotGamma agrees with Kai Volatility’s Cem Karsan that volatility could be sticky.
Hence, call structures could keep their value better and enable us to lower the cost of our bets on the market downside. If the fundamental context supporting the rotation of call option profits into puts is no longer valid, then the losses on such trades are limited; the money is made in not losing it.
Graphic: Retrieved from SpotGamma’s Weekend Note.
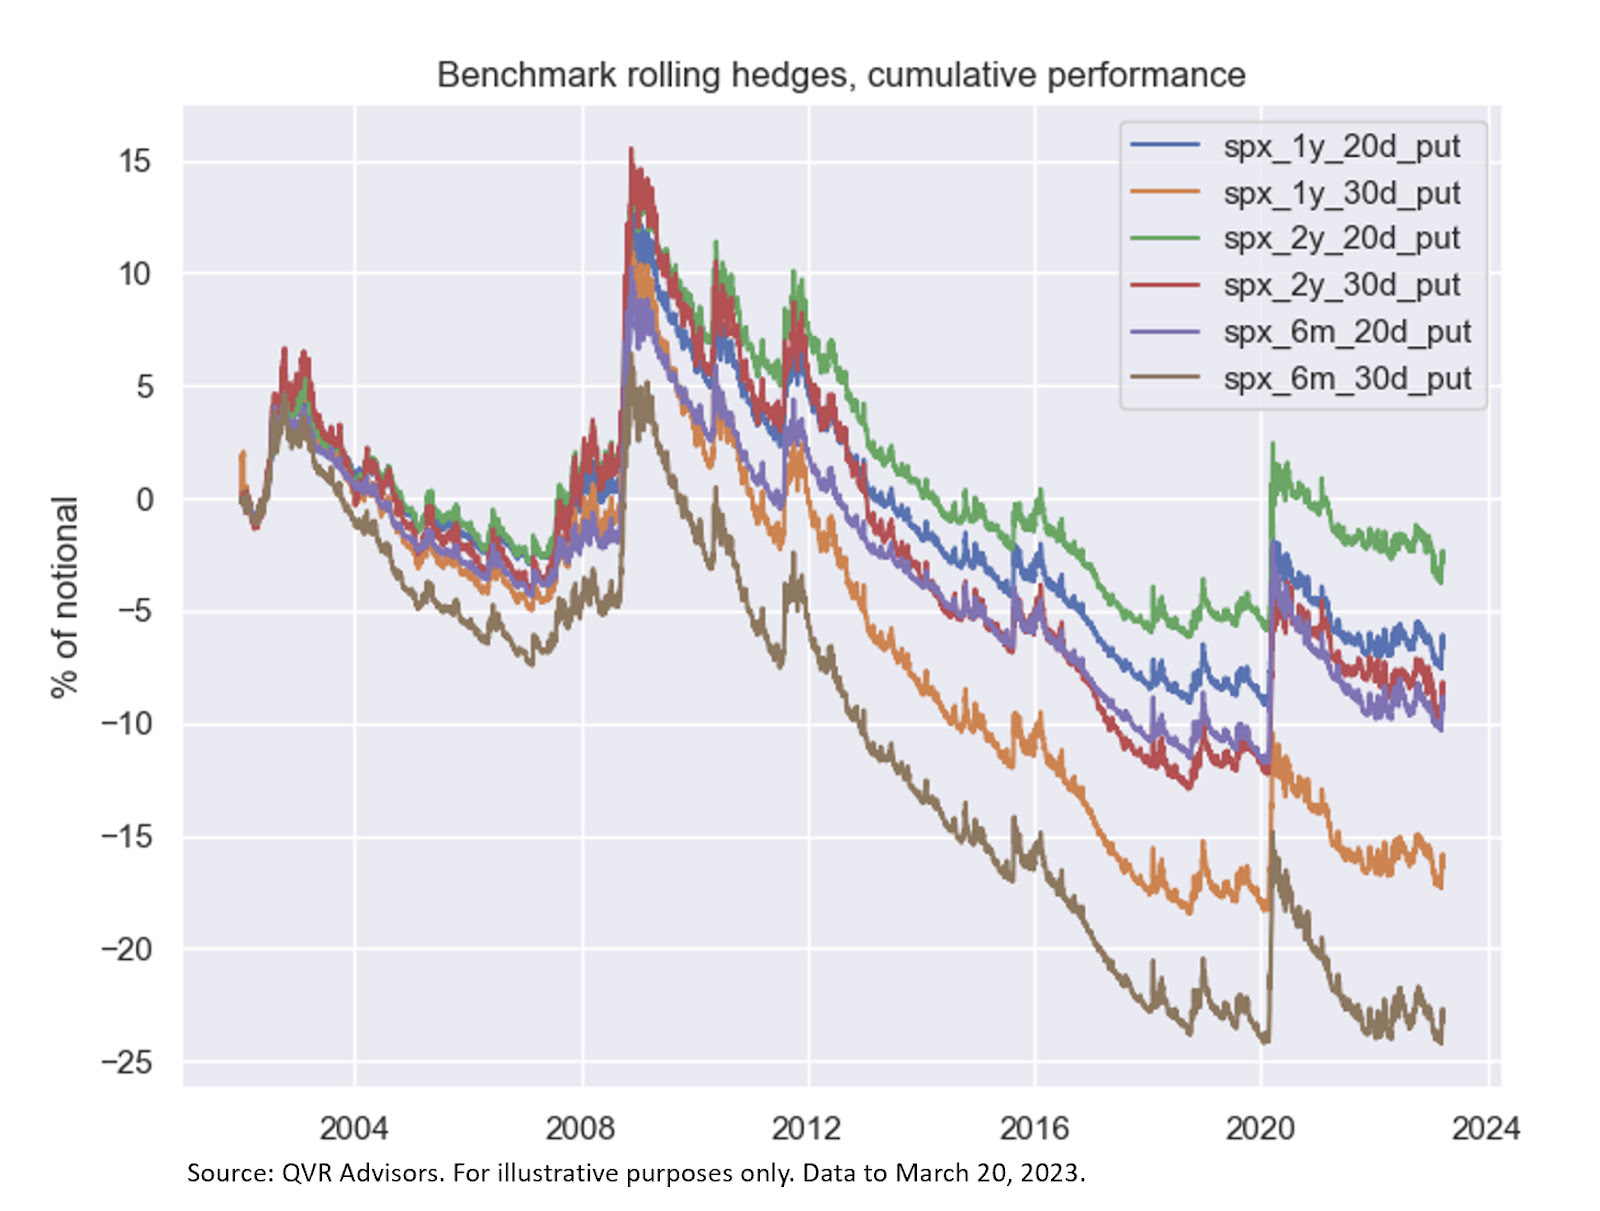
Not doing as outlined and blindly buying put options to protect long equity exposure is generally a poor-performing strategy, despite the performance claims of some funds specializing in that practice.
Graphic: Retrieved from QVR Advisors via Bloomberg. “Buying puts is a money-losing proposition when considered in isolation. Chart shows the performance of hedges rolled every quarter with delta hedging, as a percentage of notional amount protected.”
About
Welcome to the Daily Brief by Physik Invest, a soon-to-launch research, consulting, trading, and asset management solutions provider. Learn about our origin story here, and consider subscribing for daily updates on the critical contexts that could lend to future market movement.
Separately, please don’t use this free letter as advice; all content is for informational purposes, and derivatives carry a substantial risk of loss. At this time, Capelj and Physik Invest, non-professional advisors, will never solicit others for capital or collect fees and disbursements. Separately, you may view this letter’s content calendar at this link.
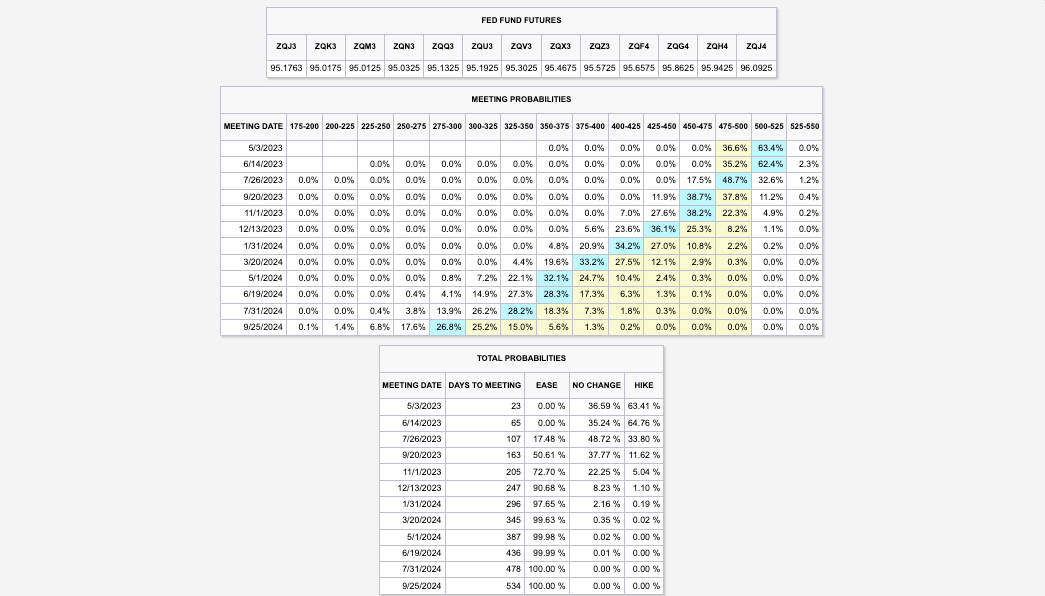
US payroll data has increased the possibility of a rate hike by the Federal Reserve or Fed in early May, leading to higher rates and affecting those who expected a pause or pivot through poorly performing yield curve steepener trades. The market expects the Fed to raise its target rate to 5.00-5.25% and keep it there through mid-year.
Graphic: Retrieved from CME Group Inc’s (NASDAQ: CME) FedWatch Tool.
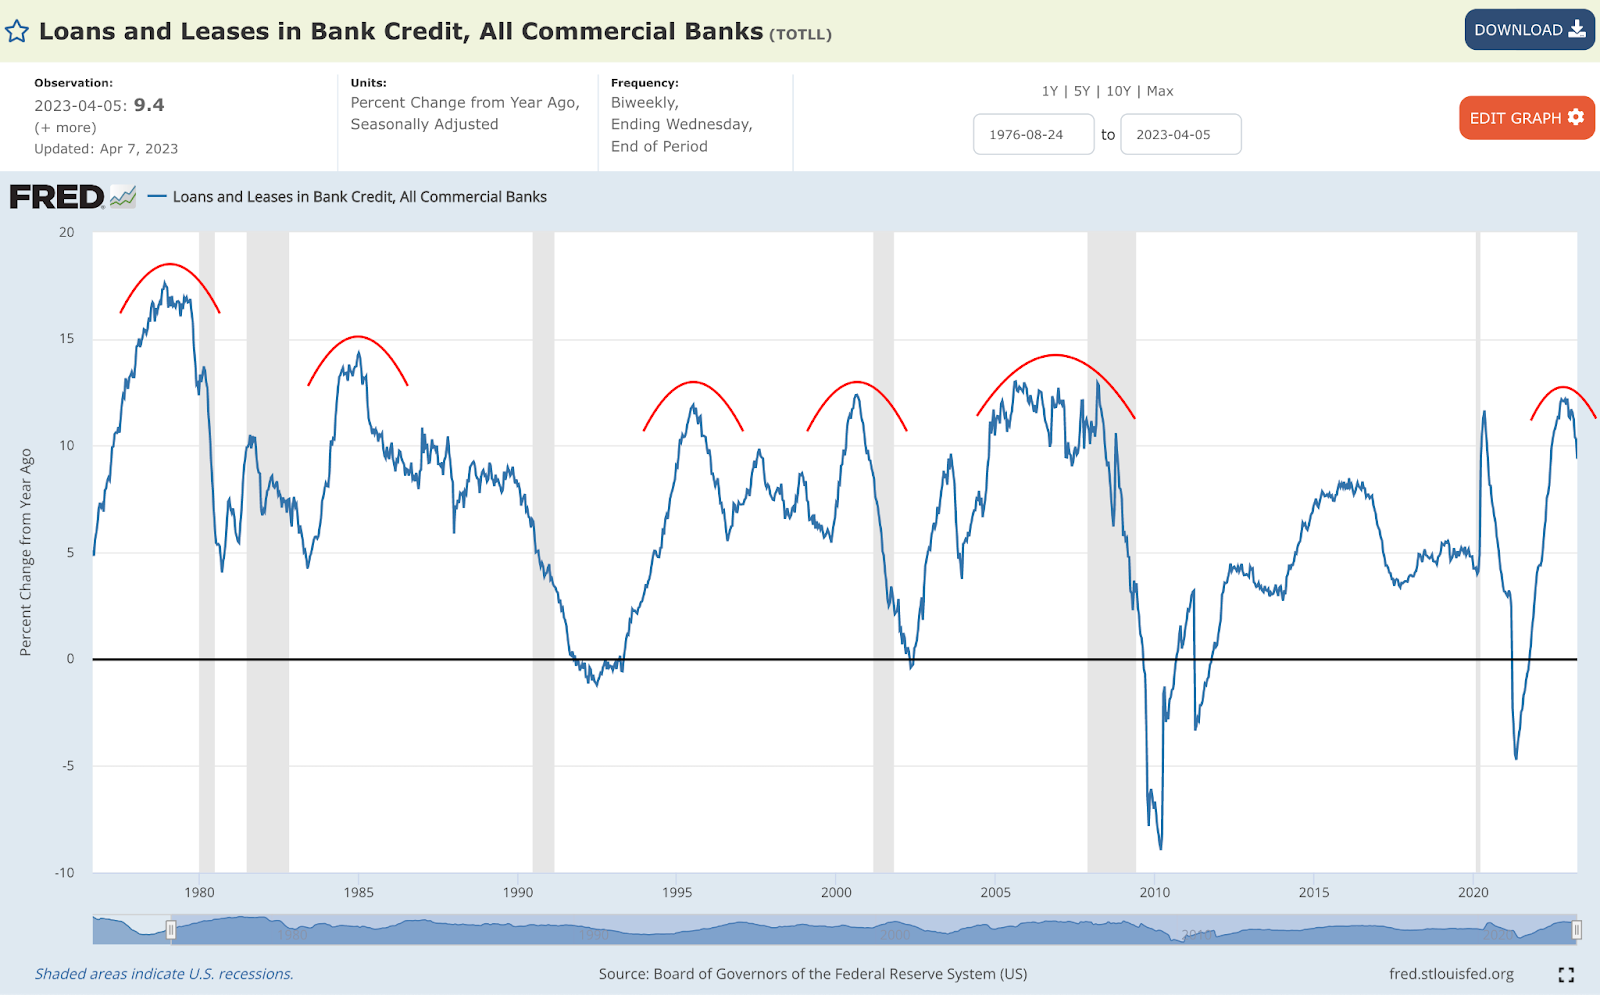
There is more to the pressure than just yields. Surveys indicate a drop in profits for sensitive areas of the equity market, such as technology and banks; as soon as the labor market starts softening, a credit crunch is expected to accelerate by some.
Graphic: Retrieved from the St. Louis Fed via Cubic Analytics.
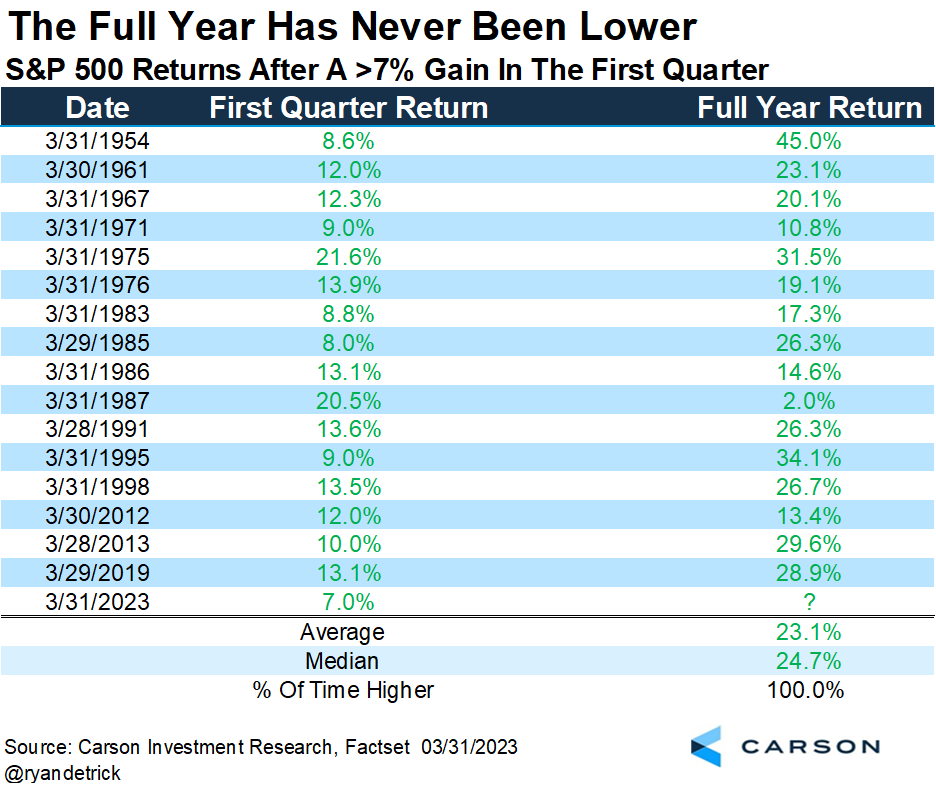
Despite the turbulence from earnings, data suggests the S&P 500 (INDEX: SPX) may perform well through year-end. Historically, the full-year return was always positive when the S&P 500 had a positive first quarter. However, there have been exceptions, says Callum Thomas, quoting data gathered by Ryan Detrick.
Graphic: Retrieved from Ryan Detrick via Callum Thomas’ Weekly S&P 500 ChartStorm.
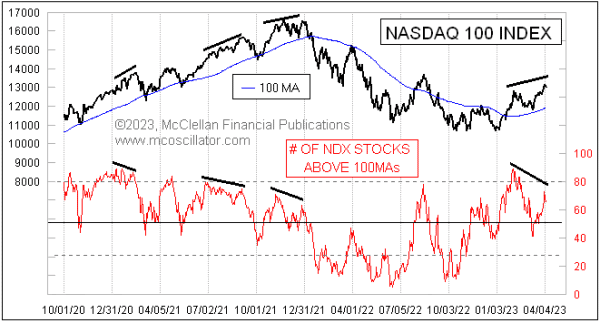
Peeking beneath the hood, only a few (primarily rate-sensitive) stocks have bolstered recent index strength; many components are not participating in the rally, which could be a harbinger of potential post-earnings weaknesses.
Graphic: Retrieved from McClellan Financial Publications.
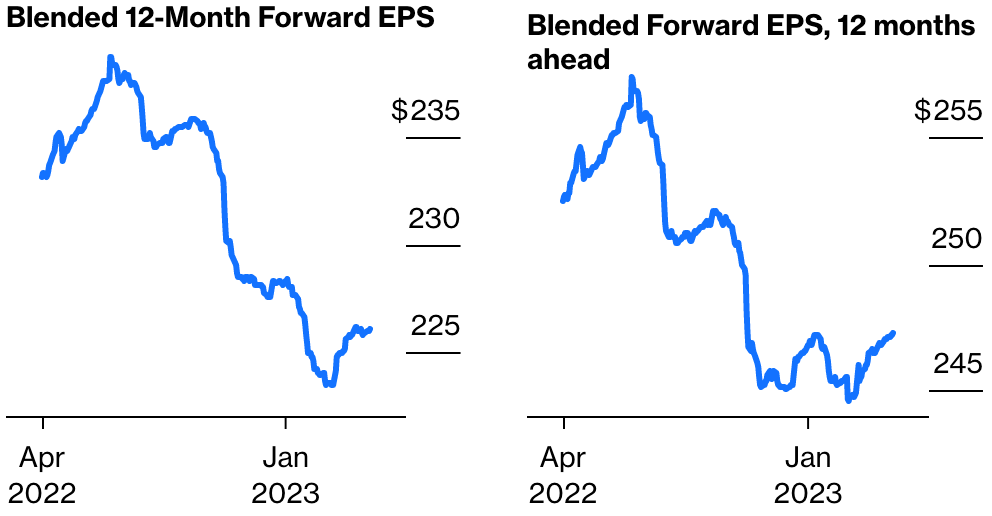
Notwithstanding, if rates continue to fall, so do borrowing costs; falling inflation cuts pressures on input cost; rising unemployment helps keep labor costs under control, Bloomberg reports. The forecasts (not surveys) actually show earnings holding up better than the narrative suggests.
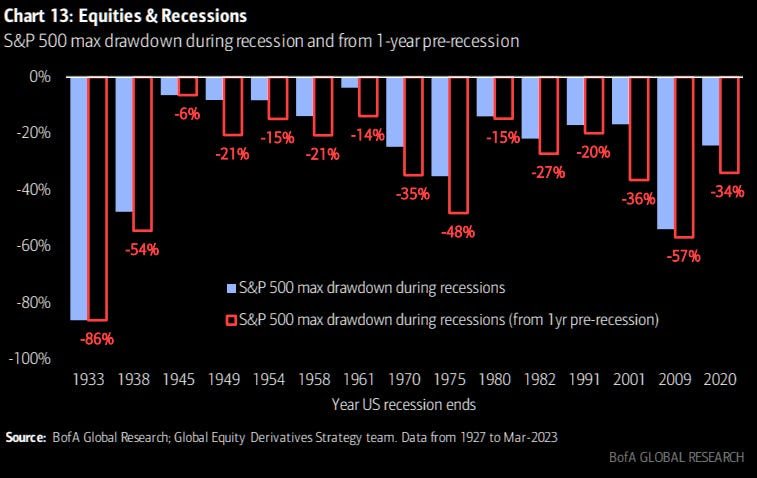
So what, then? In an annual report, JPMorgan Chase & Co (NYSE: JPM) concludes that if “we have higher inflation for longer, the Fed may be forced to increase rates higher than people expect despite the recent bank crisis.” Compounding the rate hikes is quantitative tightening or QT, the process of a central bank reducing the amount of money it has injected into an economy by selling bonds or other financial assets, which “may have ongoing impacts that might, over time, be another force, pushing longer-term rates higher than currently envisioned.” The net effect, though insights gleaned from the curve may be muddied due to the scale of recent interventions, is an “inverted yield curve [implying] we are going into a recession” and lower credit creation because, as Sergei Perfiliev well puts it, “if capital ends with the Fed, it is dead – it has left the economy and the banking system.”
Graphic: Retrieved from Bank of America Corporation (NYSE: BAC) via TheMarketEar.
How do we position ourselves, given all these narratives? Equity volatility implied (IVOL) and realized (RVOL) decreased. This may continue to be a booster. In fact, “if markets remain within a +/-1.5% range, a drop in volatility could trigger significant buying activity from the vol-control space, with up to $14 billion in notional flows hitting the tape, creating a favorable environment for equities,” says Tier1Alpha.
So, positioning-wise, stocks could trade up into a “more combustible” state where “volatility is sticky into a rally,” as Kai Volatility’s Cem Karsan said would happen.
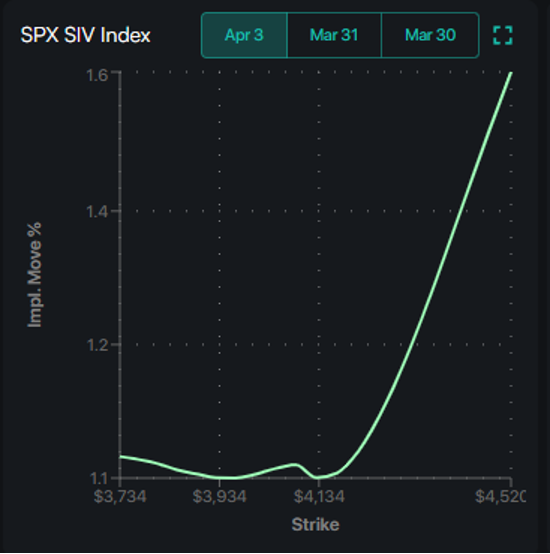
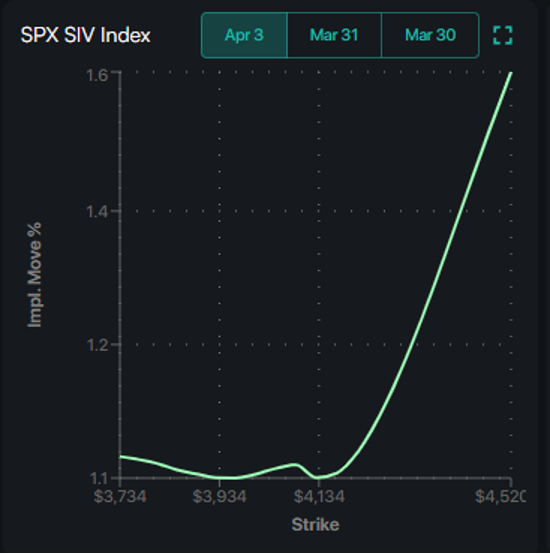
SpotGamma confirms that, based on current positioning, SPX IVOL is projected to move up as the underlying index moves up; there are likely many people chasing the rally with long calls, “creating a swelling of call skew.”
In this environment, very wide call ratio spread structures discussed in past letters may continue to do well. We can use the profits from those call structures to cut the cost of our bets on the equity market downside and lower interest rates.
Graphic: Retrieved from SpotGamma’s Weekend Note.
About
Welcome to the Daily Brief by Physik Invest, a soon-to-launch research, consulting, trading, and asset management solutions provider. Learn about our origin story here, and consider subscribing for daily updates on the critical contexts that could lend to future market movement.
Separately, please don’t use this free letter as advice; all content is for informational purposes, and derivatives carry a substantial risk of loss. At this time, Capelj and Physik Invest, non-professional advisors, will never solicit others for capital or collect fees and disbursements. Separately, you may view this letter’s content calendar at this link.
Welcome to the Daily Brief by Physik Invest, a soon-to-launch research, consulting, trading, and asset management solutions provider. Learn about our origin story here, and consider subscribing for daily updates on the critical contexts that could lend to future market movement.
Tomorrow’s Good Friday, and some markets, including the US’s equity market, will be closed. The Treasury market will remain open, albeit for less time, and may enable traders to price the impacts of coming releases, including non-farm payrolls (NFP). The consensus is that the US added 235,000 jobs in March, with the unemployment rate expected to remain steady at 3.50%. Higher for longer, then? We shall see.
Moreover, the big news is that the trend in mortgage rates, followed closely in the US, continues to be down. US 30-year fixed mortgage rates fell for a fourth-straight week, though applications to buy and refinance a home declined for the first time in a month. However, borrowing costs remain generally high and housing inventory low, keeping a cap on homebuying activity.
Notwithstanding, as explained by Akash Kanojia, for the housing market to “clear” on today’s affordability, home prices need to fall by about 20.00%.
To explain, typically, banks use a debt-to-income ratio to determine how much they will lend to a borrower to buy a house. Adding, they could enforce a limit of 80% on the purchase price of the house, and the remaining 20.00% is paid in cash by the borrower as a down payment.
Mortgage rates comprise the short-term risk-free rate, term premium, the Treasury-MBS spread, the primary-secondary spread, and a credit spread based on the borrower’s creditworthiness. Any of these numbers changing can influence a borrower’s final payment to the lender.
Graphic: Retrieved from Negative Convexity.
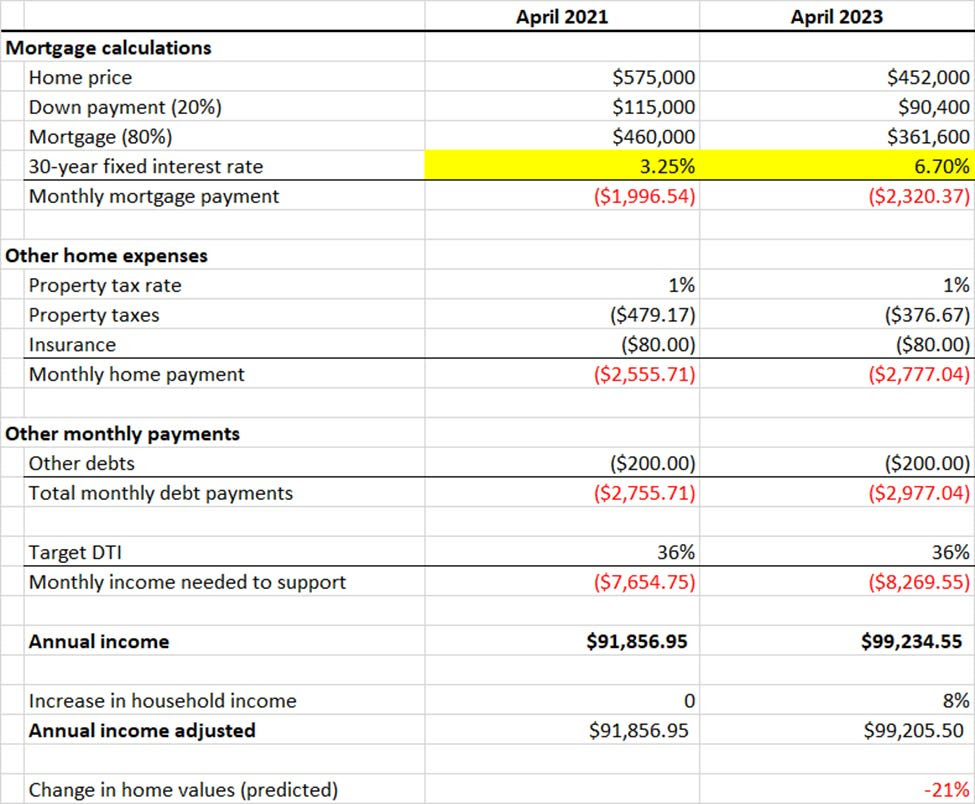
An analysis starting with a home price in 2021 of $575,000.00 and a borrower whose income was $92,000.00, and adjusting all for inflation and movements in rates, the decrease in home values to boost affordability is 21.00%.
Graphic: Retrieved from Negative Convexity. “To do this analysis, I started with a home price in April 2021[1]($575,000) and figured out how much annual income a borrower would have needed at that time to buy the house (~$92,000). I then adjusted the annual income up by 8% for 2023, extrapolating from this, resulting in a person that would have earned ~$92,000 earning $99,205 today. Then I calculated how much house a person earning $99,205 can afford today at a mortgage rate of 6.70% ($452,000). Divide the two, and you get a decrease of 21%.”
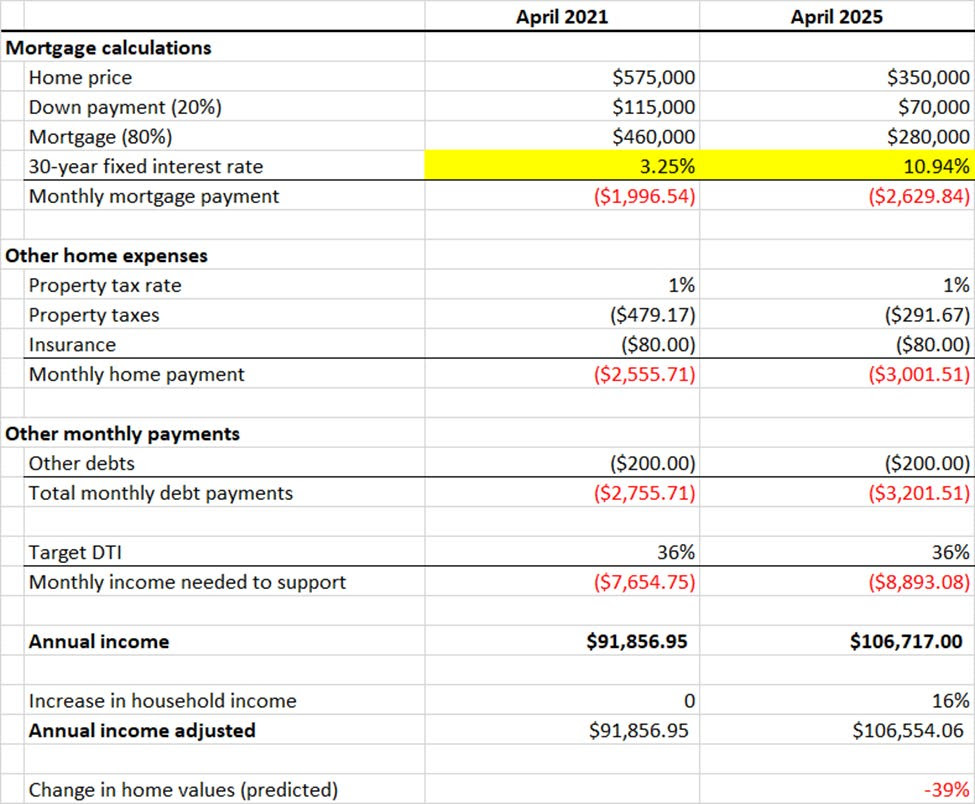
A worst-case scenario is that the fed funds rate rises further to quell inflation. If the fed funds rate were to rise to 6.00-6.25%, matching the latest annualized CPI print, and “the market realizes the Fed is not going to cut, and the curve (e.g., 3m-7y UST) steepens to historical norms (~150 basis points long-term average), barring changes in the MBS spread, primary-secondary spread, and credit charges, this produces a ~40.00% decline in home prices.
Graphic: Retrieved from Negative Convexity.
Consequently, as the economy slows and layoffs increase, as we’re starting to see, it will negatively affect housing demand and affordability due to income stability and growth. On the bright side, inflation destroys the nominal value of debt, Kanojia says. Assuming wages keep up, buyers in hot markets may be spared if they can withhold from selling at market-clearing prices, Kanojia ends.
On a note about the doom and gloom (i.e., economy slowing and layoffs increasing, as well as yield curve steepening), JPMorgan Chase & Co’s (NYSE: JPM) Jamie Dimon says the following:
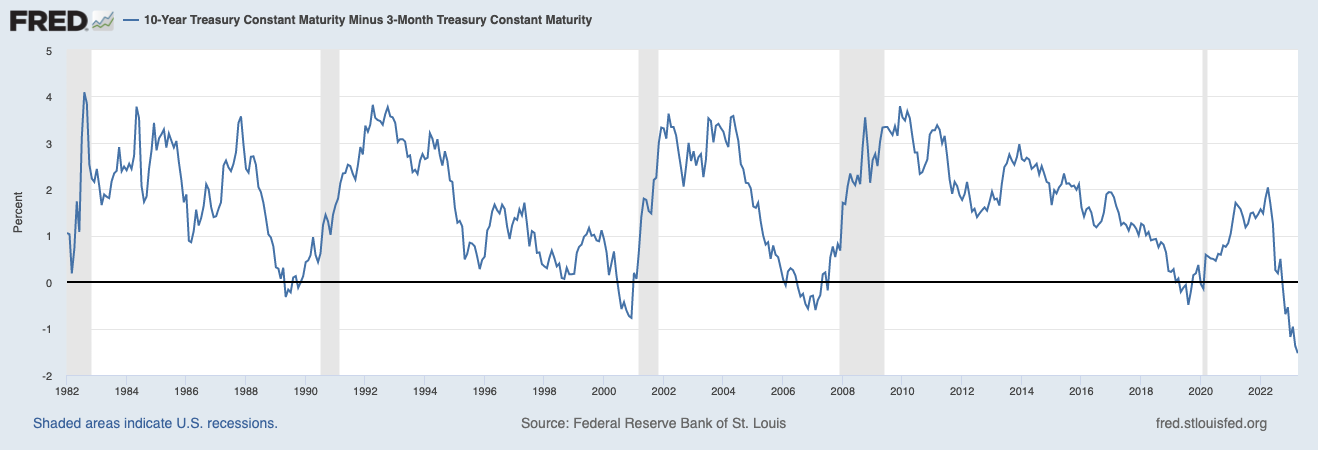
Today’s inverted yield curve implies that we are going into a recession. As someone once said, an inverted yield curve like this is ‘eight for eight’ in predicting a recession in the next 12 months. However, it may not be true this time because of the enormous effect of QT. As previously stated, longer-term rates are not necessarily controlled by central banks, and it is possible that the inversion we see today is still driven by prior QE and not the dramatic change in supply and demand that is going to take place in the future.
Dimon, the CEO of JPM, says that a graph showing the yields on bonds of different maturities is inverted, meaning that the yields on shorter-term bonds are higher than the yields on longer-term bonds. An inverted yield curve has often been a reliable indicator of an upcoming recession; it reflects investor demands for higher returns on short-term investments and expectations that short-term rates will fall in the future, which happens when the central bank cuts rates in response to a weak economy.
In other words, the conditions around the yield curve inversion are different this time.
Graphic: Retrieved from the Federal Reserve Bank of St. Louis. A normal yield curve is upward-sloping, meaning long-term interest rates are higher than short-term rates; investors demand a higher return for tying up their money for a longer period; the spread between the 10-year and 3-month treasury yield is positive.
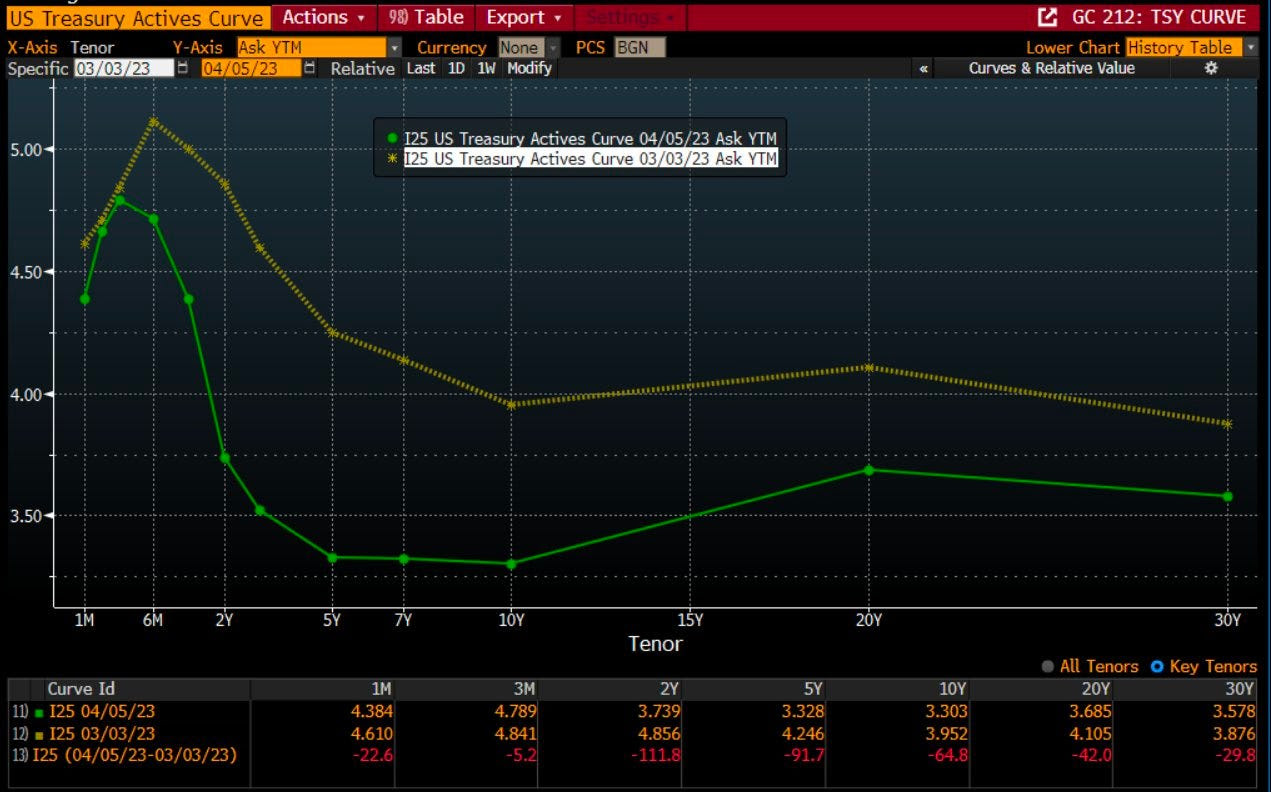
Further, a peek at the bond market shows cuts priced within six months.
Graphic: Retrieved from Bloomberg via @TheBondFreak.
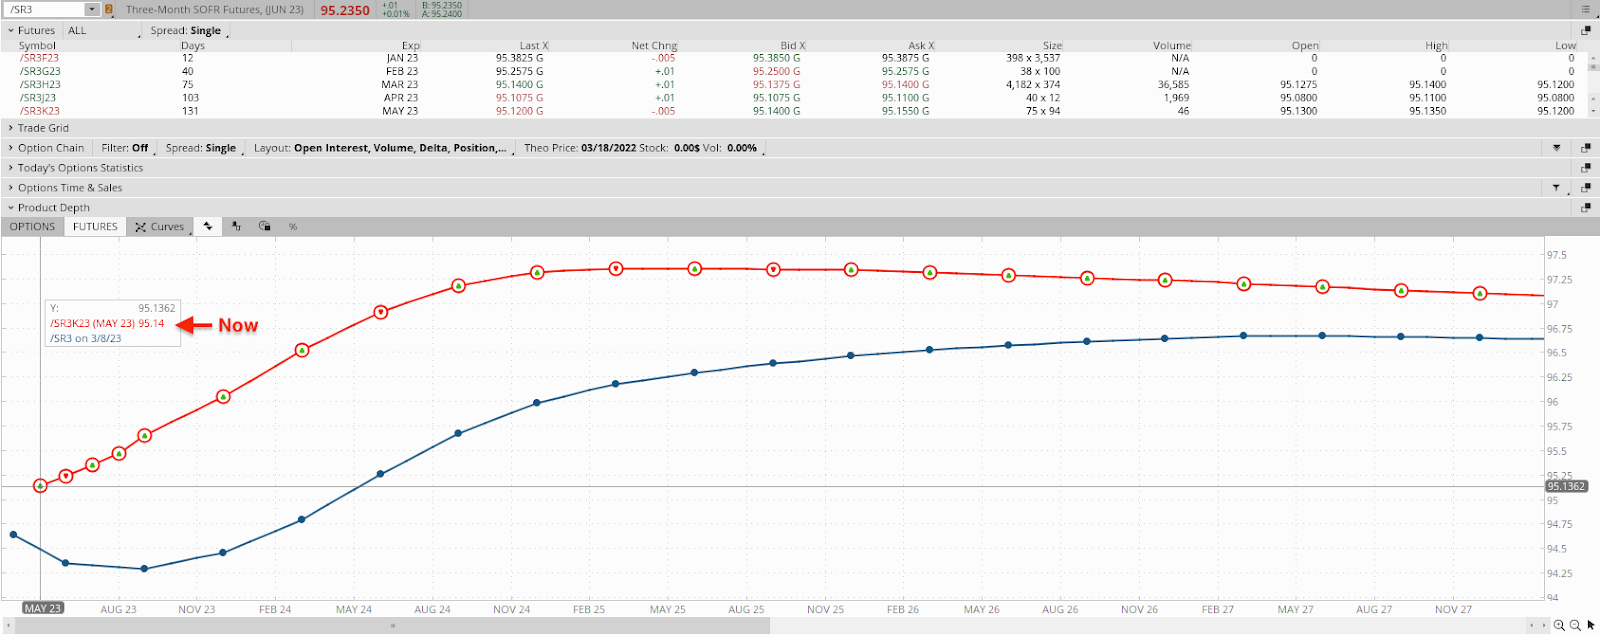
Same thing with the Secured Overnight Financing Rate (SOFR) market, developed by the Federal Reserve to replace LIBOR, which was phased out due to manipulation concerns, among other things, as a benchmark interest rate.
Unlike LIBOR, which is based on unsecured lending transactions between banks, SOFR is based on actual transactions in the overnight repurchase agreement (repo) market, which makes it a more reliable benchmark. Consequently, the shift from the Eurodollar (FUTURE: /GE), used to intervene in support of the dollar and other currencies and allow lenders to lock in rates, to SOFR has accelerated, too.
As stated yesterday, options activity in the SOFR market was centered around the 95.00 strikes. To calculate the implied interest rate using the value of the 3-month SOFR future, we can use the following formula:
Implied interest rate = 100 – future price; the implied interest rate calculated using the 3-month SOFR future is an annualized rate.
For example, if the current value of the 3-month SOFR future is 95.00, the implied interest rate would be 100.00 – 95.00 = 5.00%.
Graphic: Via Charles Schwab Corporation’s (NYSE: SCHW) thinkorswim platform. The three-month SOFR (FUTURE: /SR3) curve implies a 4.86% terminal rate today, followed by easing into year-end.
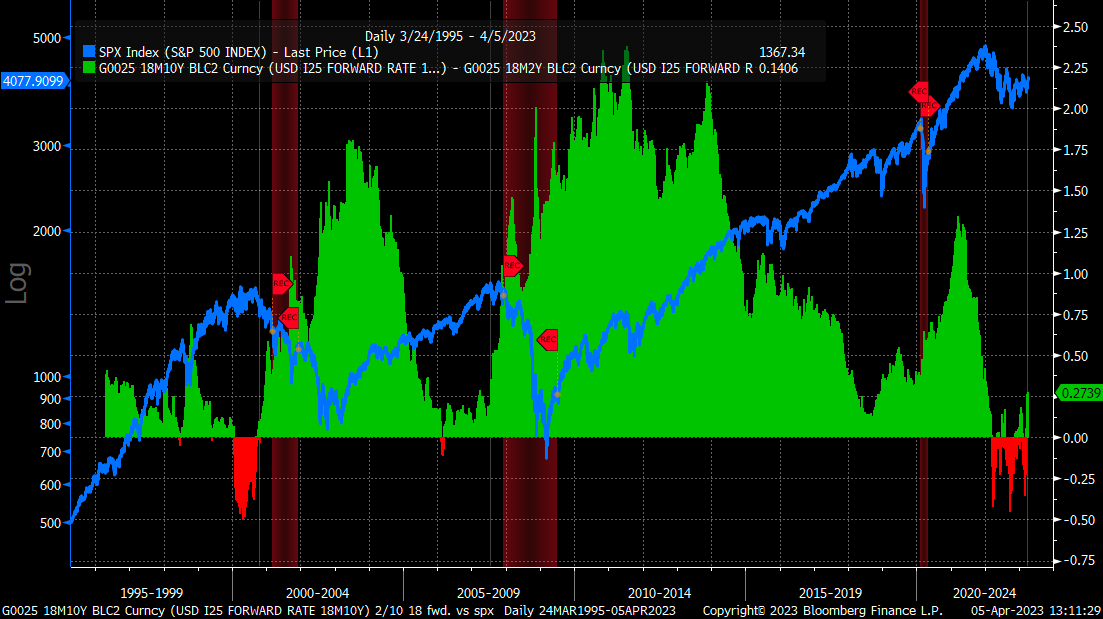
The S&P 500 (INDEX: SPX) has not bottomed based on these conditions. 3Fourteen Research concludes that the SPX has never bottomed during a Fed hike cycle, which one is still ongoing; typically, forward earnings stabilize and turn higher 3-6 months after a market bottom, which hasn’t happened; the 2-10 yield curve has never remained inverted six months after a major bear market bottom.
Graphic: Retrieved from Bloomberg via @MichaelMOTTCM.
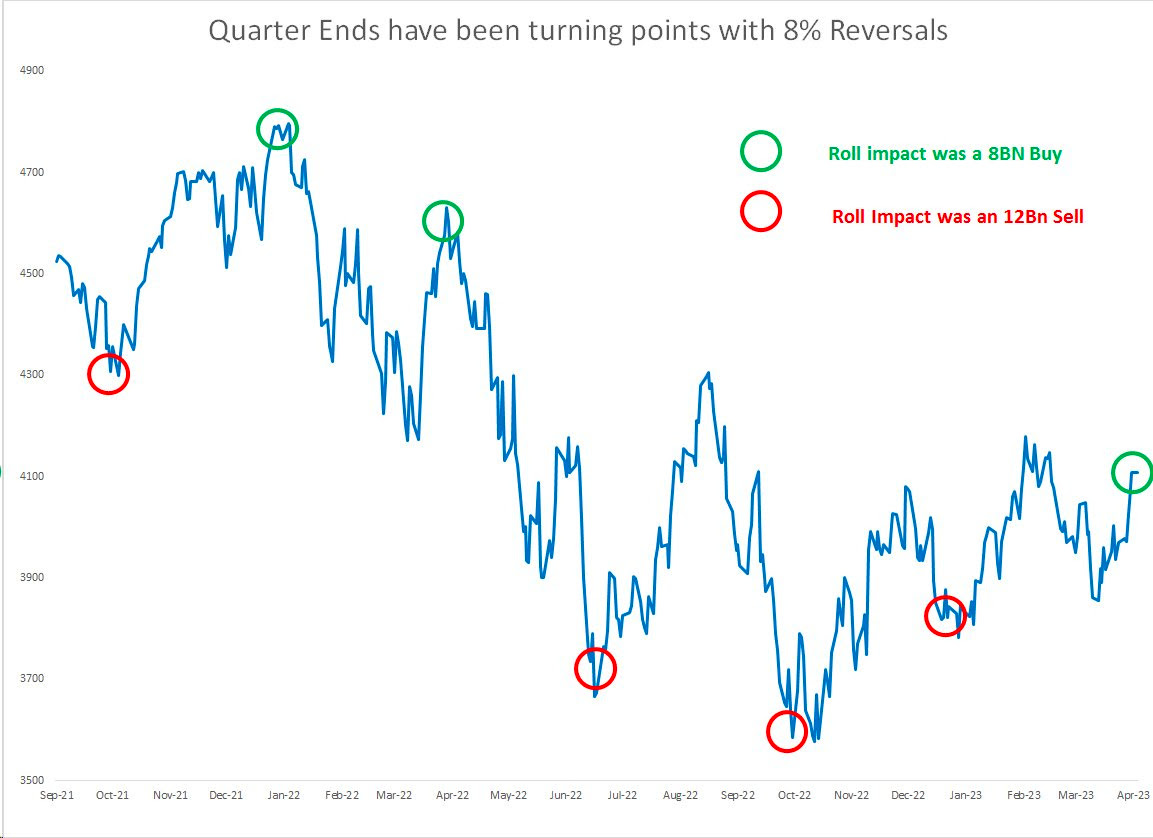
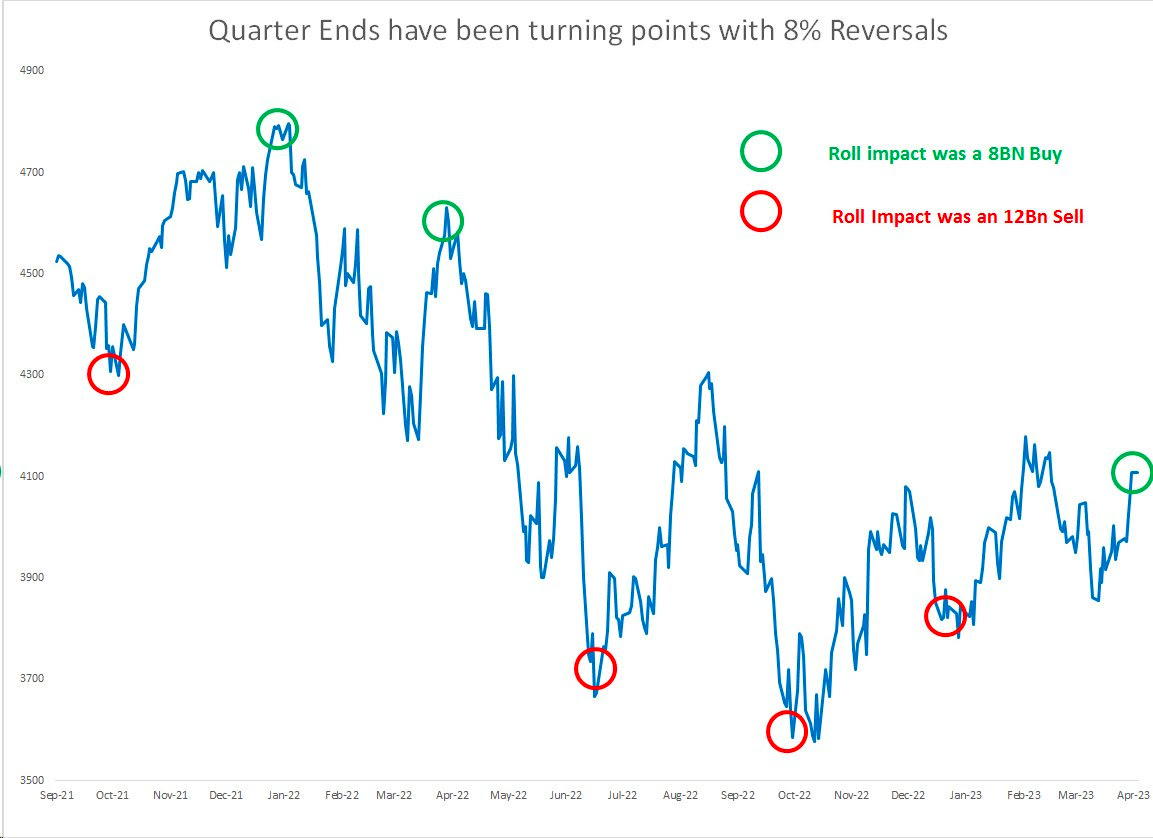
Notwithstanding all the doom and gloom, we explained in past letters that markets would likely remain strong through month-end March.
Graphic: Retrieved from Damped Spring Advisors’ Andy Constan. “6 of the last 6 quarters, the quarter end flow has resulted in a spike or dip and a subsequent 8%+ reversal.”
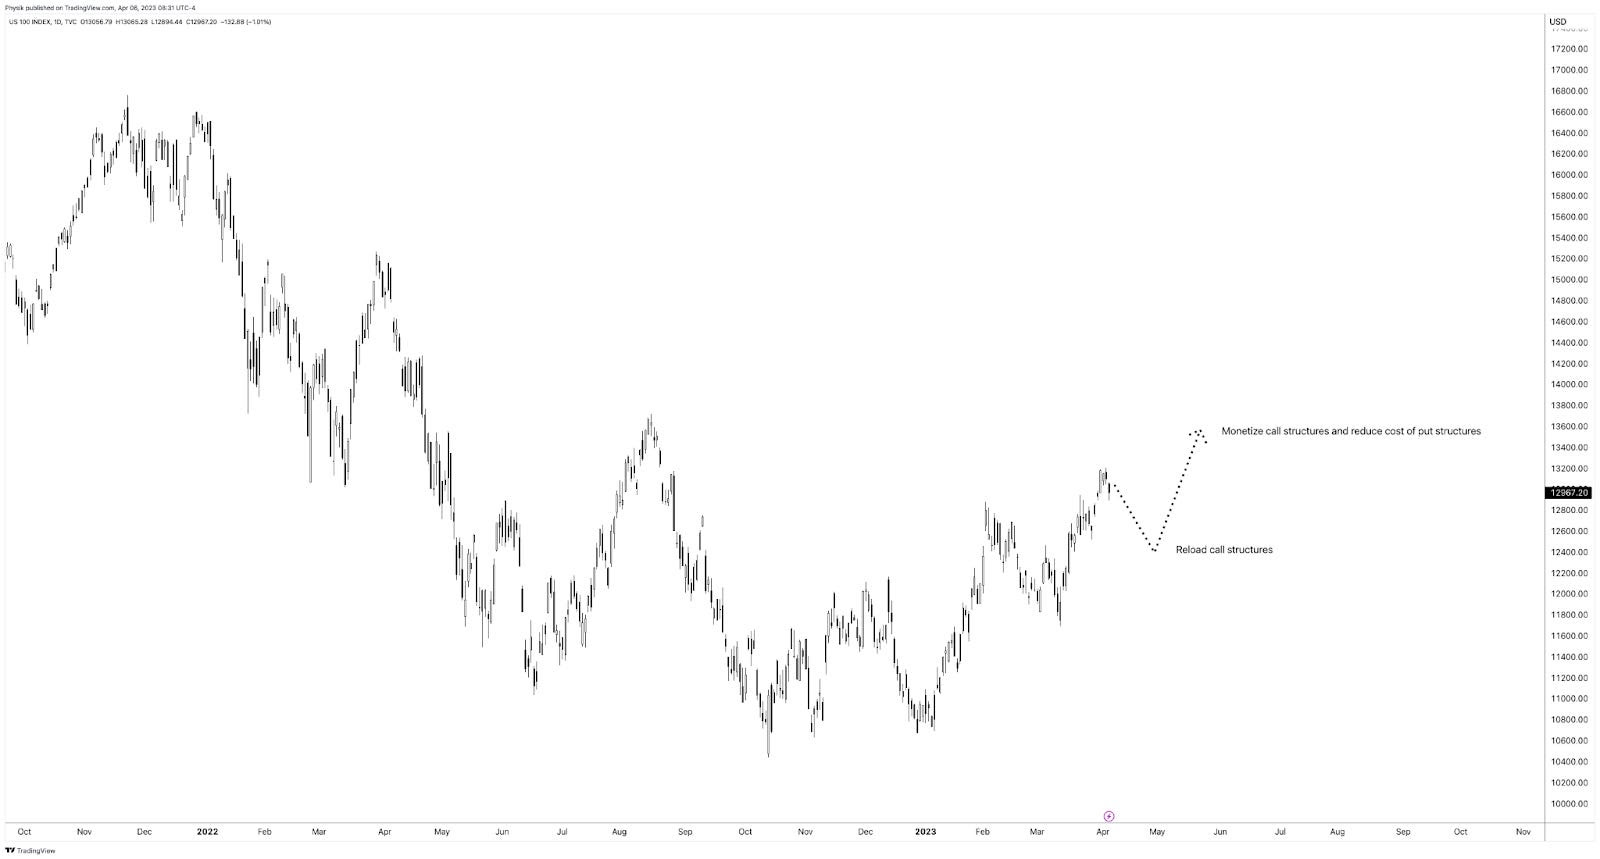
Accordingly, it made a lot of sense to own low- or no-cost call options structures in products like the Nasdaq 100 (INDEX: NDX), where many participants were caught offsides and bidding call volatility in response to the dramatic reversal; the reach for the right tail reduced the cost of ratio call spreads, making them the go-to structures.
It may make sense to re-load in similar call structures on pullbacks while using any proceeds or profits from those structures to reduce the cost of owning fixed-risk and less costly put structures (e.g., vertical) that may enable us to participate in equity market downside, as well as bet on lower rates in the future using call options structures on the /SR3 to express that opinion.
Graphic: Retrieved from TradingView via Physik Invest.
Disclaimer
Don’t use this free letter as advice; all content is for informational purposes, and derivatives carry a substantial risk of loss. At this time, Capelj and Physik Invest, non-professional advisors, will never solicit others for capital or collect fees and disbursements. Separately, you may view this letter’s content calendar at this link.
Welcome to the Daily Brief by Physik Invest. Learn about our origin story here, and consider subscribing for free daily updates on the most important market updates.
We keep recent letters brief as a lengthy one is still being written. Thank you for being so patient.
The Job Openings and Labor Turnover Survey showed a decrease in job vacancies and a tightening of the labor market; vacancies per job-seeker have reduced by 20%, and workers are in a weaker position to bargain.
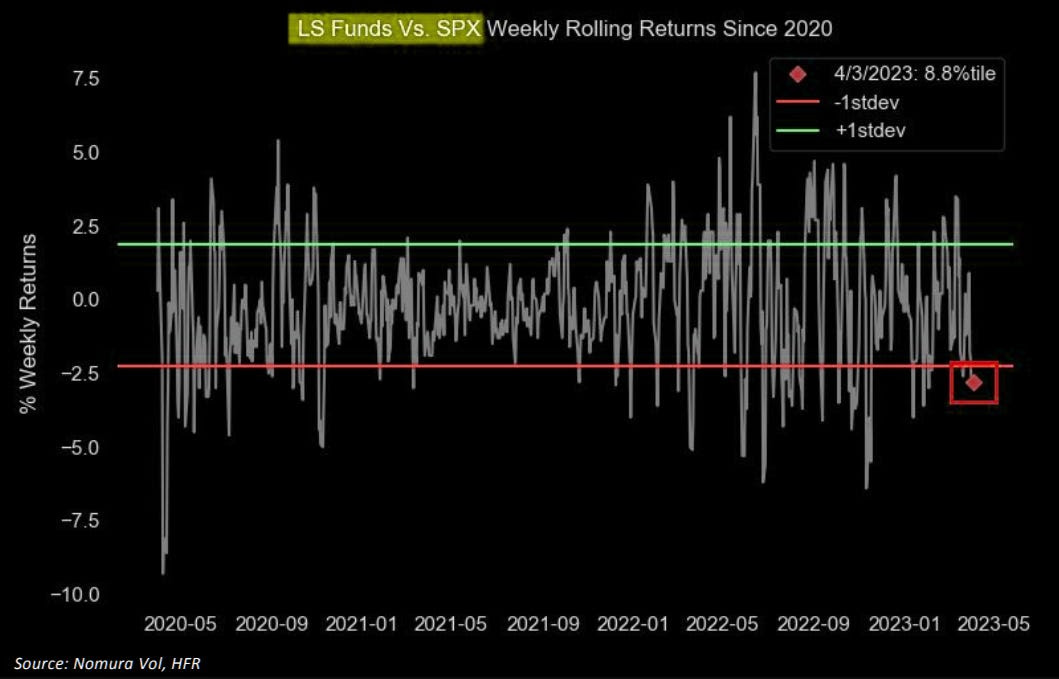
Accordingly, rate expectations dropped ahead of the next Federal Open Market Committee meeting; traders are bidding up the price of equities.
Graphic: Retrieved from Noura Holdings Inc (NYSE: NMR) via The Market Ear. “Long/short vs SPX rolling returns shows you the pain. Nomura’s quant guru McElligott weighs in: ‘…all of last year’s Equities Alpha was in your ‘Short’ books, which were loaded with ‘Expensive / High Multiple / Low Quality / Un-Profitable’ Growth…but that’s now the stuff that is exploding higher on the violent Rates reset LOWER.”
Federal Reserve President Loretta Mester maintained that the benchmark rate should move and stay above 5% to control inflation, adding that no rate cuts may happen this year, barring a significant change in price pressures. Mester said inflation is on its way out – price growth is likely to drop to 3.75% this year and reach 2% by 2025 – and the banking system is sound, though policymakers are ready to respond to new stresses.
A peek at the Secured Overnight Financing Rate or SOFR market shows activity or the consensus centered at the 95.00 options strike (~5%). Per Bloomberg, large positions include a June 95.00/96.00 1×2 call spread, a June 95.75/95.50/95.25/95.00 put condor, and 95.00/94.75/94.50 put flies in both September and December tenors.
From a positioning perspective, this letter maintains the idea of starting to monetizecall structures and rolling profits into fixed-risk bear put spreads. However, given the potential for an underwhelming selloff or “grinding de-leveraging,” keep those debits you pay in check!
To end, the upcoming non-farm payrolls or NFP reportsandinflation figures will provide crucial data on the state of the economy.
Graphic: Retrieved from Damped Spring Advisors’ Andy Constan. “6 of the last 6 quarters, the quarter end flow has resulted in a spike or dip and a subsequent 8%+ reversal.”
Disclaimer
Don’t use this free letter as advice; all content is for informational purposes, and derivatives carry a substantial risk of loss. At this time, Capelj and Physik Invest, non-professional advisors, will never solicit others for capital or collect fees and disbursements. Separately, you may view this letter’s content calendar at this link.
Welcome to the Daily Brief by Physik Invest, a soon-to-launch research, consulting, trading, and asset management solutions provider. Learn about our origin story here, and consider subscribing for daily updates on the critical contexts that could lend to future market movement.
JPMorgan Chase & Co’s (NYSE: JPM) Marko Kolanovic believes the equities rally will falter, with headwinds from bank turbulence, an oil shock, and slowing growth poised to send stocks back toward their 2022 lows over the coming months. Kolanovic says this is “the calm before the storm,” adding that the equity rally is masking weaknesses from recent bank collapses and a decline in corporate profits and growth.
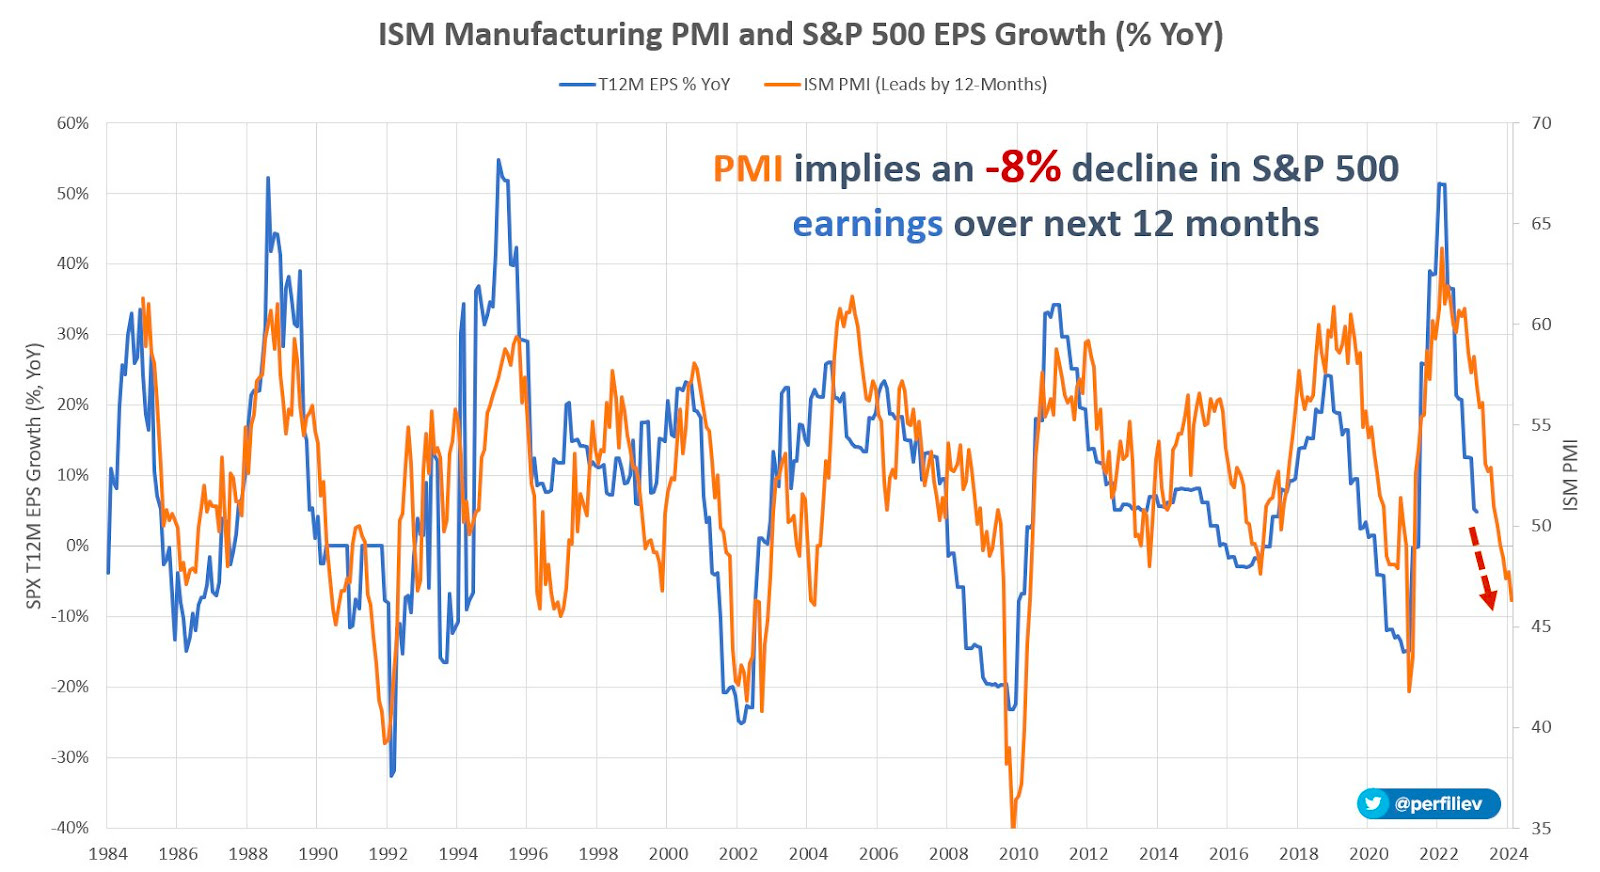
As a validation, we can look to ISM’s inventories exceeding that of new orders, and a dip in cost-push prices, Bloomberg’s John Authers explains. The overall ISM measure is recessionary; the upcoming earnings season may be unforgiving, and companies with weaker EPS are likely to be penalized more due to the prospects of a recession.
Graphic: Retrieved from Sergei Perfiliev. “Based on this relationship, today’s PMI reading of 46.3 implies an earnings contraction of about 8% over the next 12 months or an SPX EPS of 204. Using the current forward PE ratio of 18.7, this leads to an index level of about 3,815. A ‘recessionary’ PE ratio of 15 will see the index at ~3,060, assuming earnings don’t fall further.”
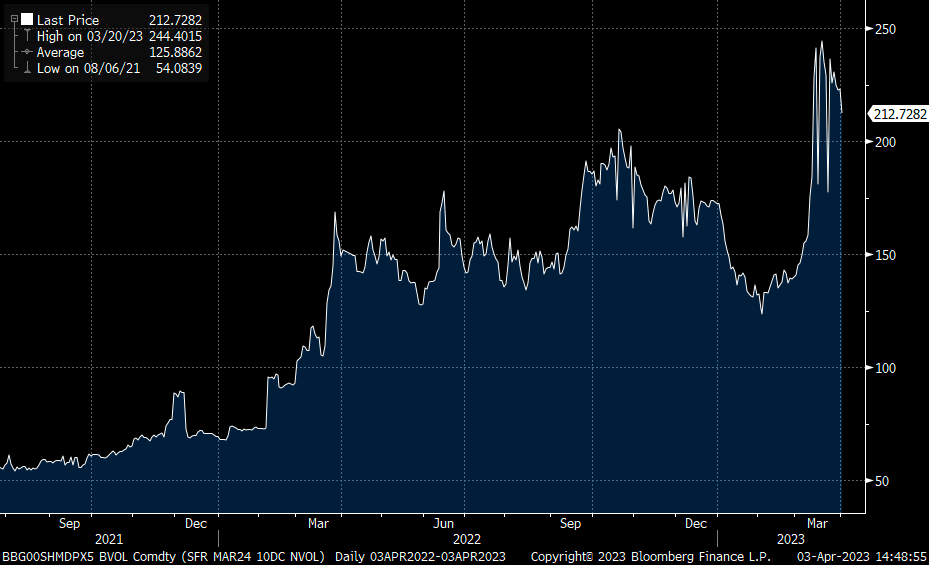
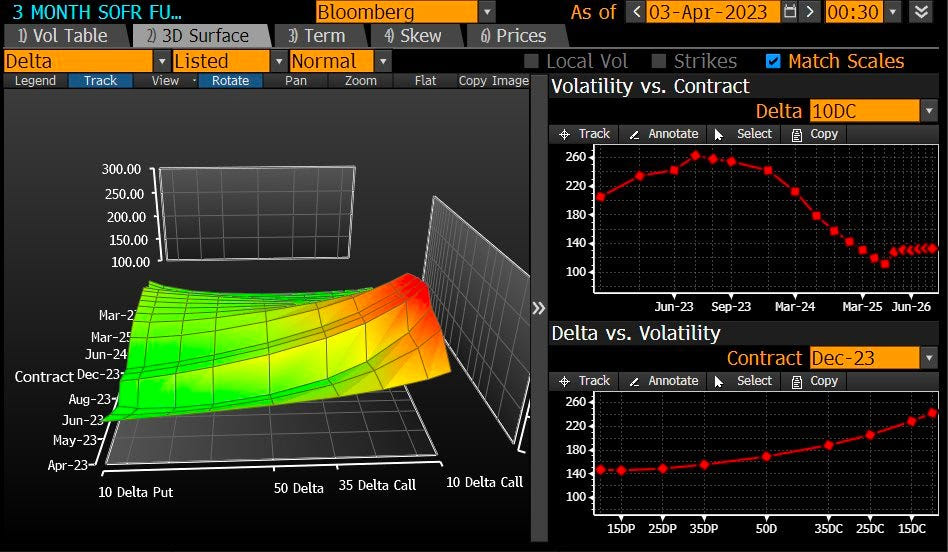
Graphic: Retrieved from @countdraghula. “We aren’t seeing the same thing for out-of-the-money calls on front-end futures. BUYING A CALL on front-end futures is taking a bet on Fed rates collapsing, especially if it is considerably out of the money, as below. Pricing for these is still sky high, despite some calm.”
Over the past weeks, we anticipated the markets trading “spiritedly for far longer,” quoting the likes of Kai Volatility’s Cem Karsan, who said the signs of a combustible situation would emerge when options implied volatility is sticky in a market rally.
Typically, as the market trades higher, volatility levels for fixed-strike options should decrease. If broad implied volatility measures are bid and fixed-strike volatility increases, this may lead to a more combustible situation as options counterparties begin to thin out on volatility, resulting in less support.
We maintain that you can monetize the example call structures we provided and roll some profits into bear put spreads (i.e., buy put and sell another at a lower strike), though you may limit your expectations. Some think there is a greater likelihood of a “crash-less selloff, a grinding de-leveraging.”
Don’t use this free letter as advice; all content is for informational purposes, and derivatives carry a substantial risk of loss. At this time, Capelj and Physik Invest, non-professional advisors, will never solicit others for capital or collect fees and disbursements. Separately, you may view this letter’s content calendar at this link.
Welcome to the Daily Brief by Physik Invest, a soon-to-launch research, consulting, trading, and asset management solutions provider. Learn about our origin story here, and consider subscribing for daily updates on the critical contexts that could lend to future market movement. Take care, and let’s dig in.
Markets are mixed with equities under light pressure following OPEC+’s surprise oil production cut. It’s likely that Saudi Arabia “realized they were getting played [on the Strategic Petroleum Reserve refill] and took matters into their own hands,” some say.
As a recap, on Friday, measures of inflation abated. Though these measures remain high and support the context for rates to stay high, markets responded positively.
Expectations of interest rate cuts have been pulled forward based on markets like SOFR, correlated to existing money market rates, where traders’ demand for call options (i.e., bet on rates falling) reveals the fear of a heavy rate-cutting cycle.
Graphic: Retrieved from Bloomberg via @countdraghula.
The S&P 500 (INDEX: SPX) closed above $4,100.00 for the first time in months. Many quickly wrote about new bull markets blooming in previously depressed market areas most sensitive to monetary policymakers’ policymaking.
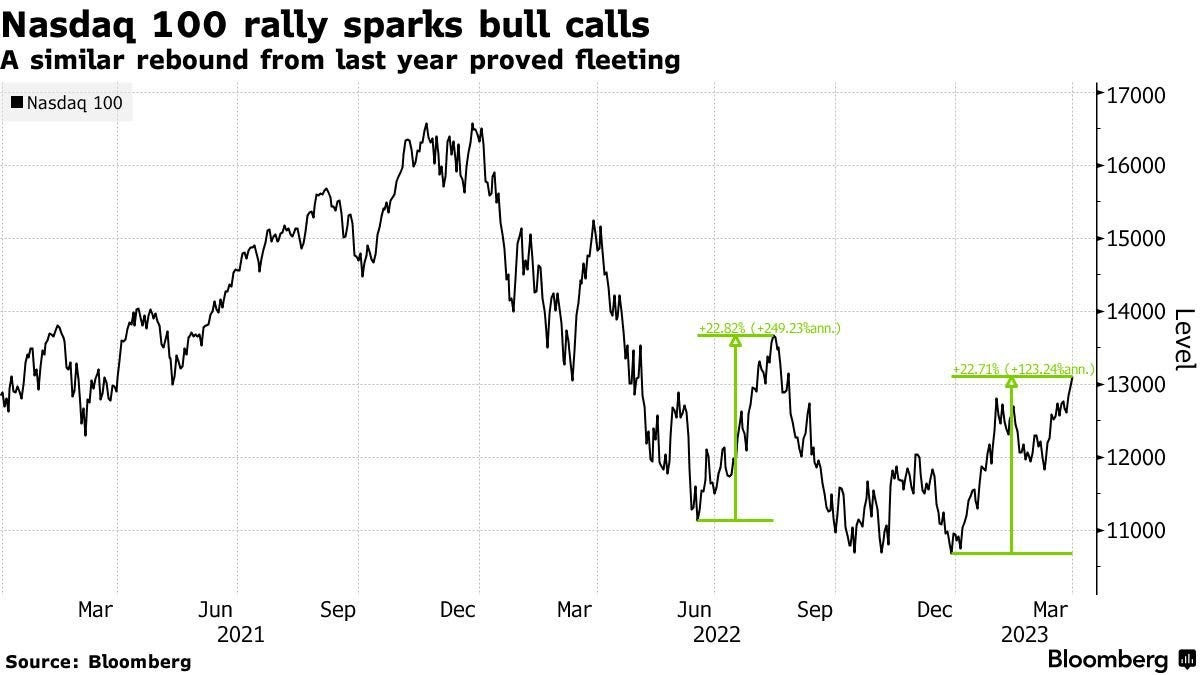
Recall, however, that during the dot-com bust, the Nasdaq 100 (INDEX: NDX) rallied ~20% numerous times before an actual bull market was born. Experts think the same thing is happening; the rally, partly driven by monetary policy expectations and the removal/monetization of downside protection, particularly in markets where traders were most concerned about a de-rate and volatility, is probably in its later stages.
The marginal benefit of any further volatility compression is far less than the cost one may incur by volatility expanding; “there isn’t much juice left to squeeze,” SpotGamma adds, and though short-biased volatility trades (e.g., sell options) could work for a bit longer, the risks remain, as explained on Friday. Rolling profits from the initially low- or no-cost call options structures we discussed last week into fixed-risk debit equity put options structures seem attractive. More to come. Hope you liked the new format!
Disclaimer
Please don’t use this free letter as advice; all content is for informational purposes, and derivatives carry a substantial risk of loss. At this time, Capelj and Physik Invest, non-professional advisors, will never solicit others for capital or collect fees and disbursements. Separately, you may view this letter’s content calendar at this link.
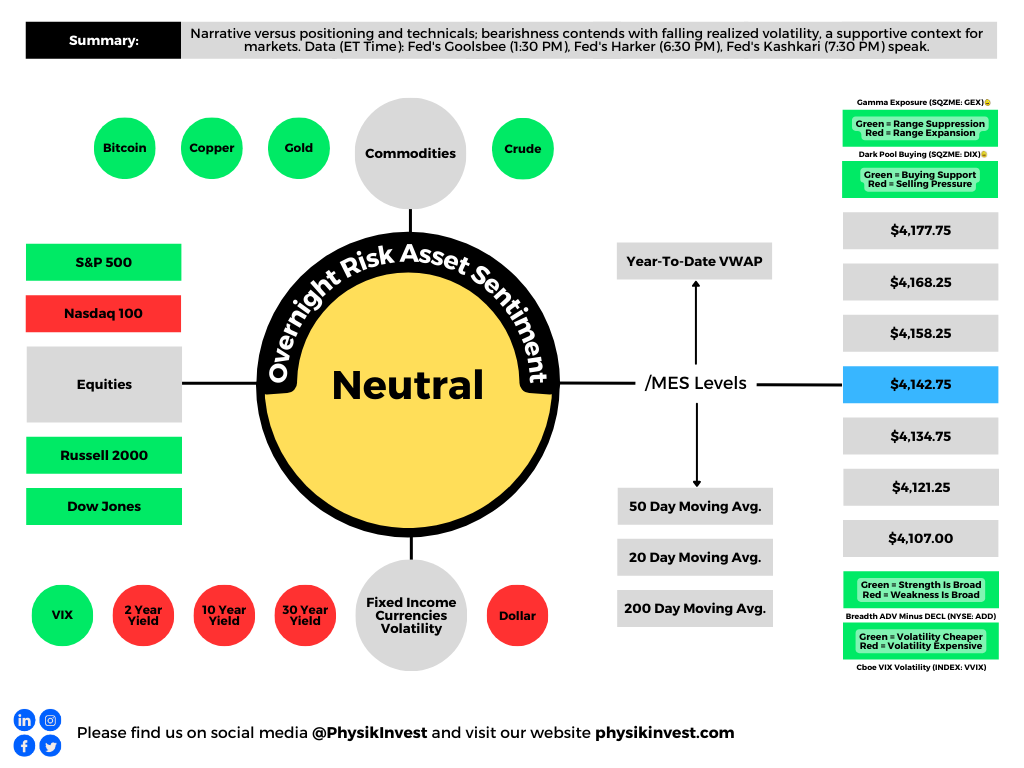
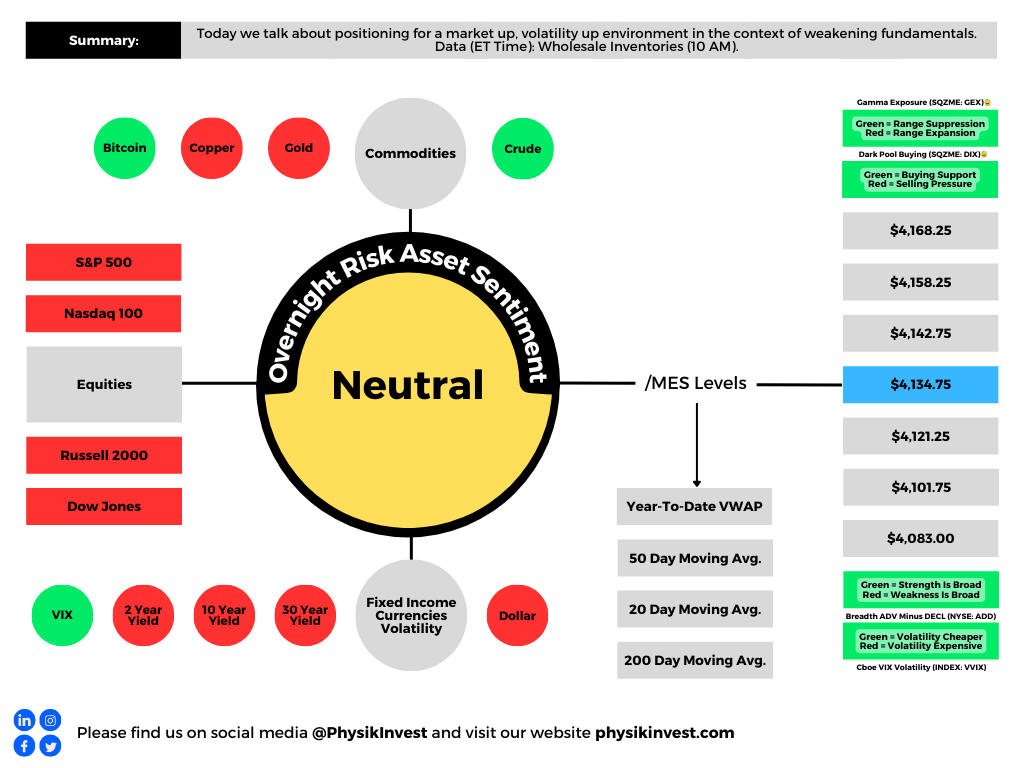
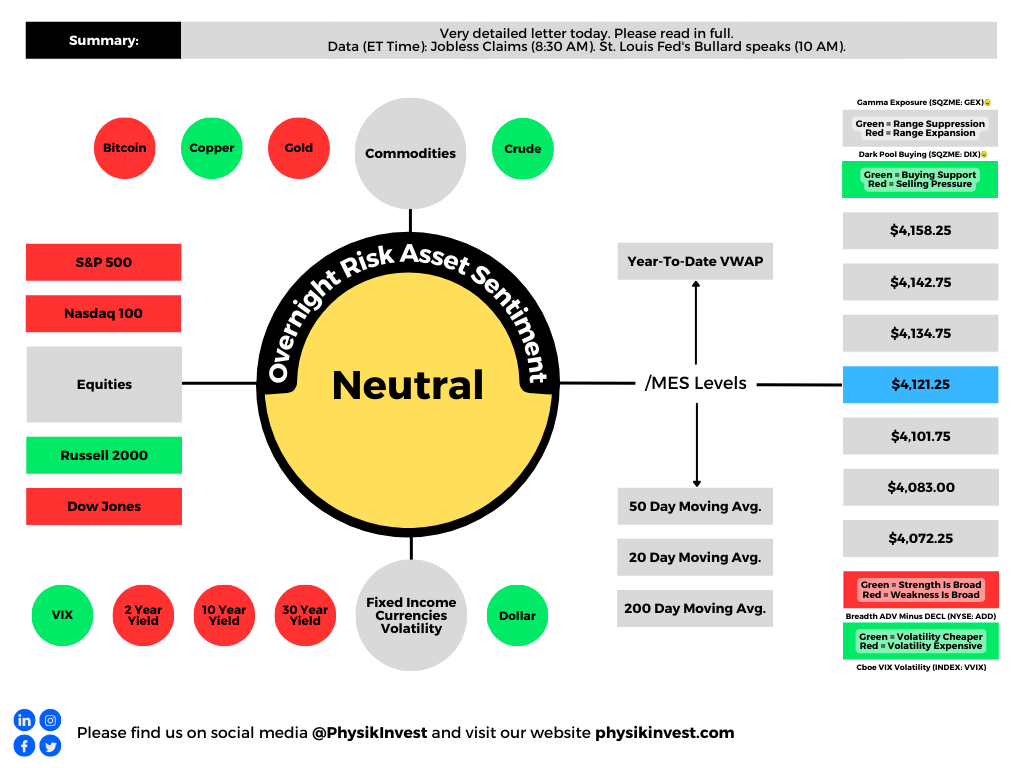
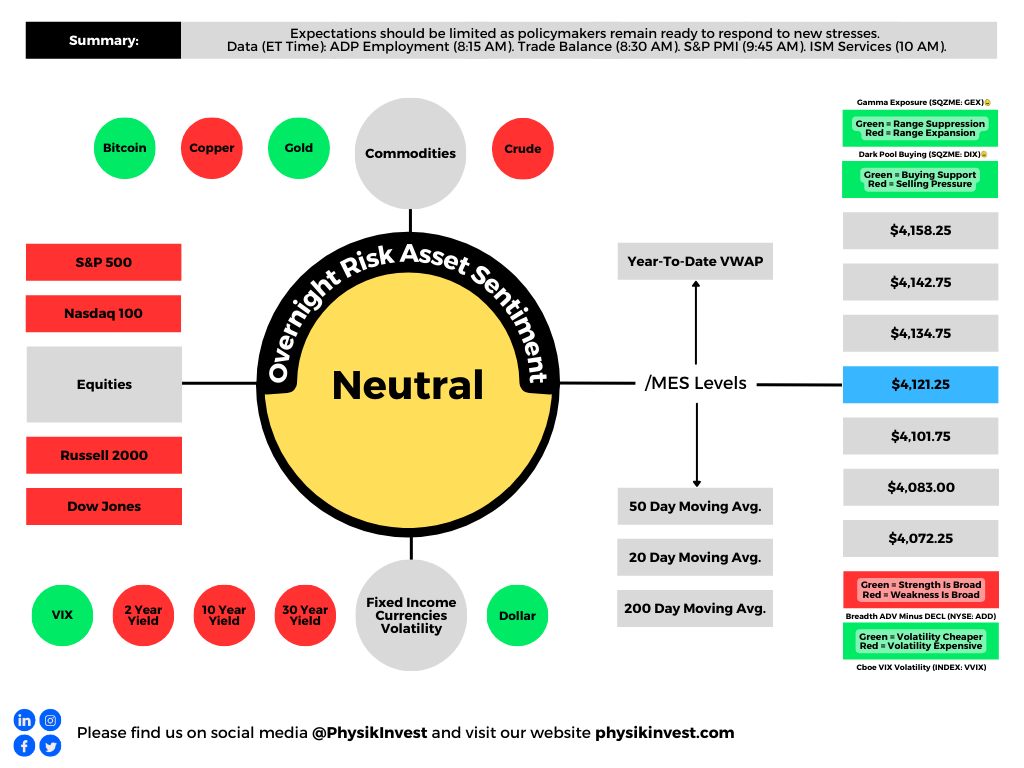
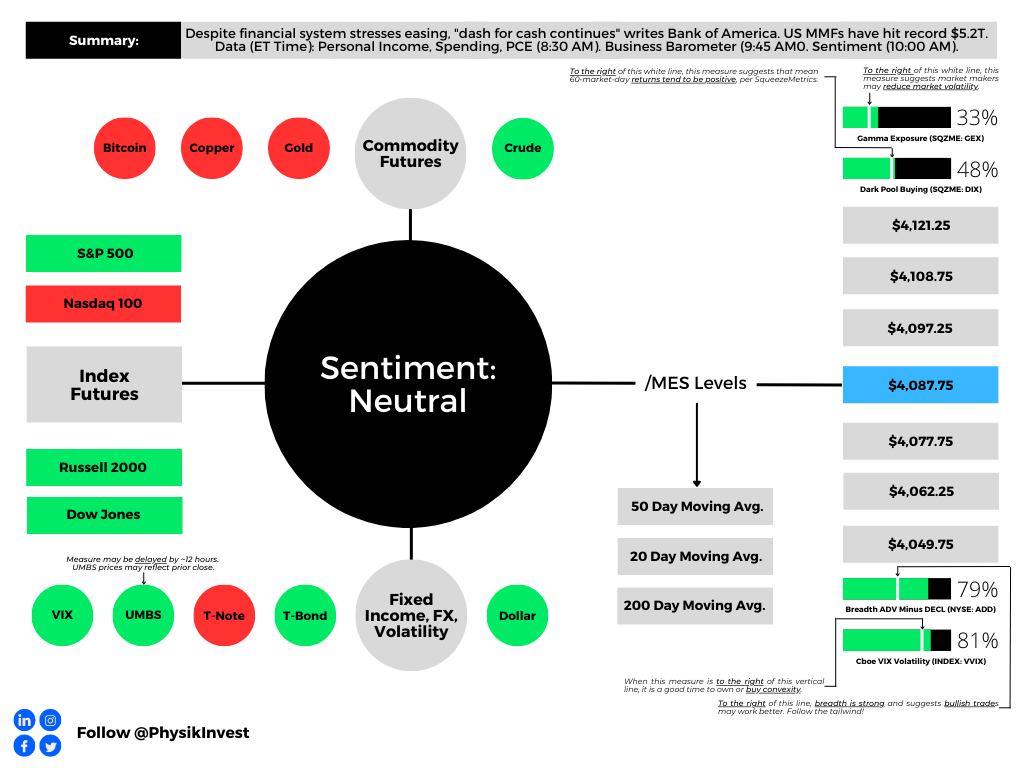
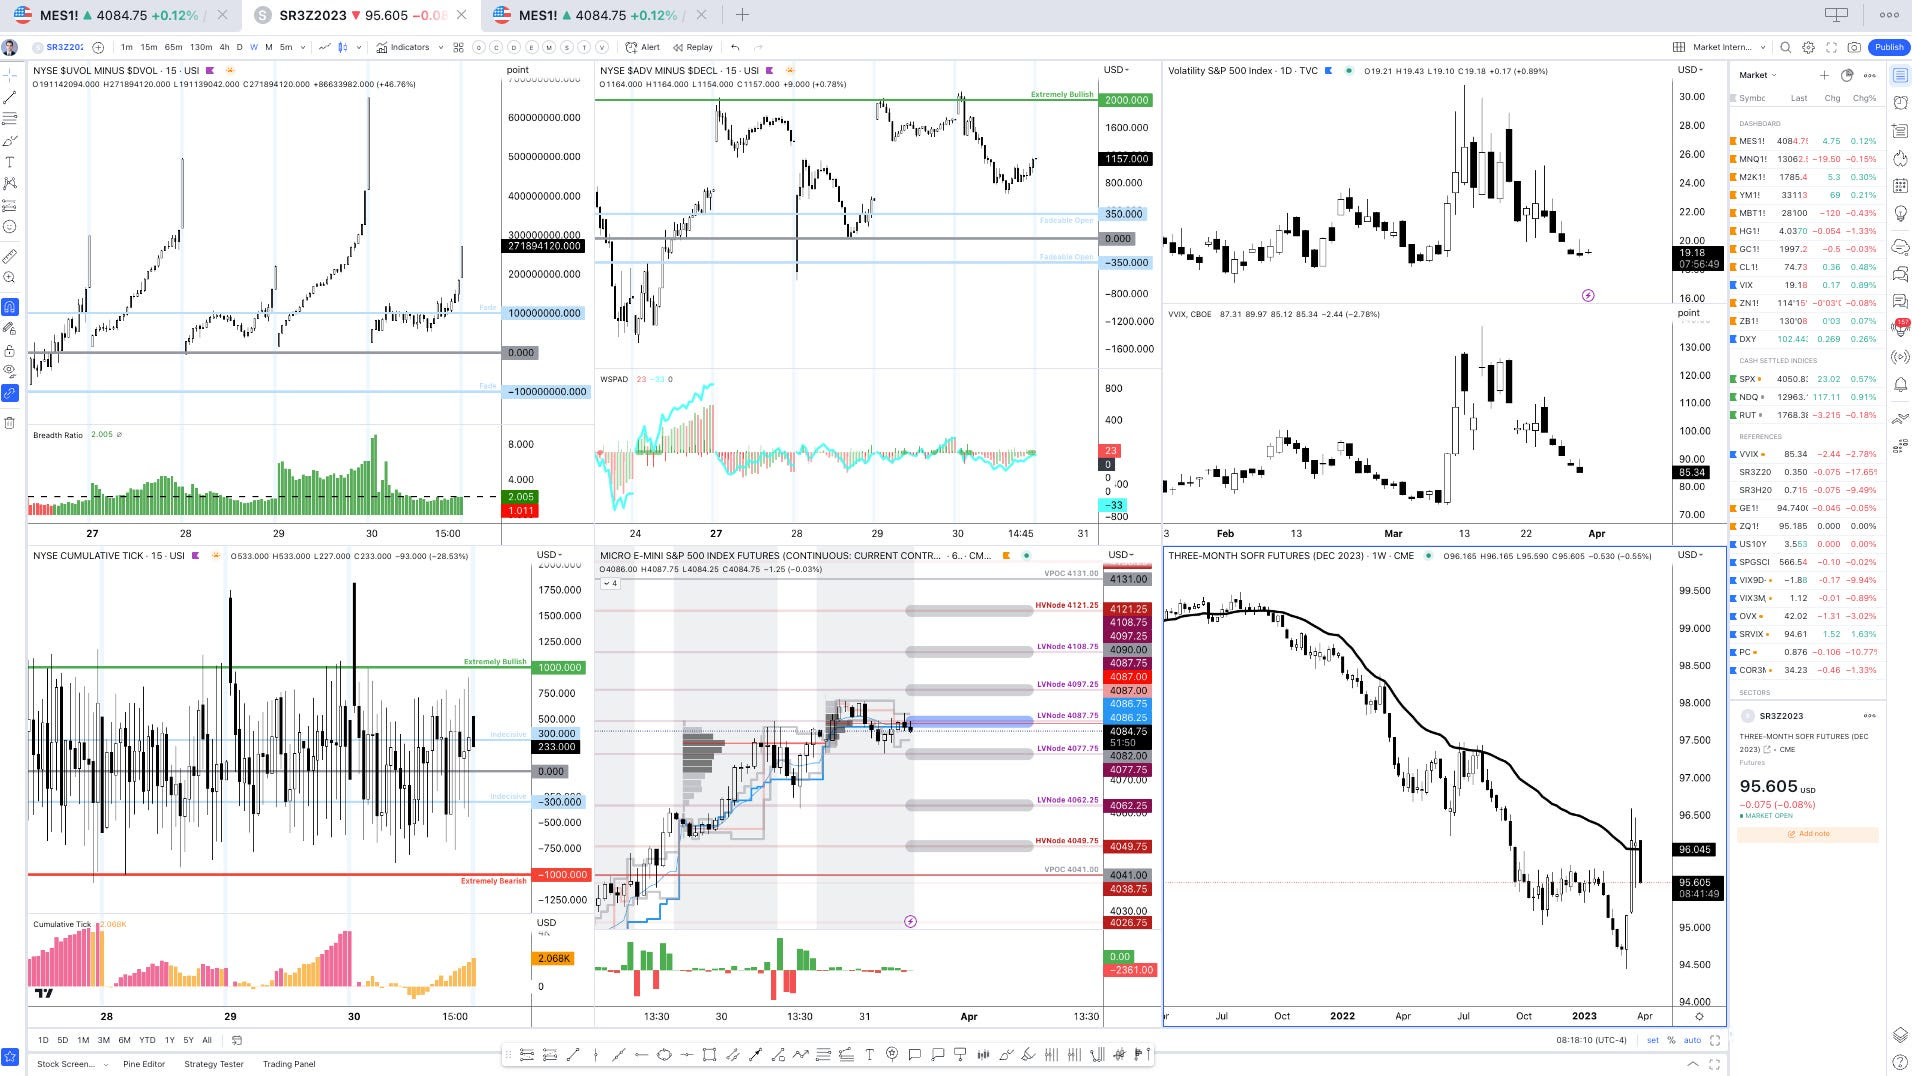
Graphic updated 8:00 AM ET. Sentiment Neutral if expected /MES open is inside of the prior day’s range. /MES levels are derived from the profile graphic at the bottom of this letter. Click here for the latest levels. SqueezeMetrics Dark Pool Index (DIX) and Gamma (GEX) with the latter calculated based on where the prior day’s reading falls with respect to the MAX and MIN of all occurrences available. A higher DIX is bullish. The lower the GEX, the more (expected) volatility. Click to learn the implications of volatility, direction, and moneyness. Breadth reflects a reading of the prior day’s NYSE Advance/Decline indicator. The CBOE VIX Volatility Index (INDEX: VVIX) reflects the attractiveness of owning volatility. UMBS prices via MND. Click here for the economic calendar.
Administrative
Keeping it brief for today. Enjoy your Friday. Be opportunistic and watch your risk.
Positioning
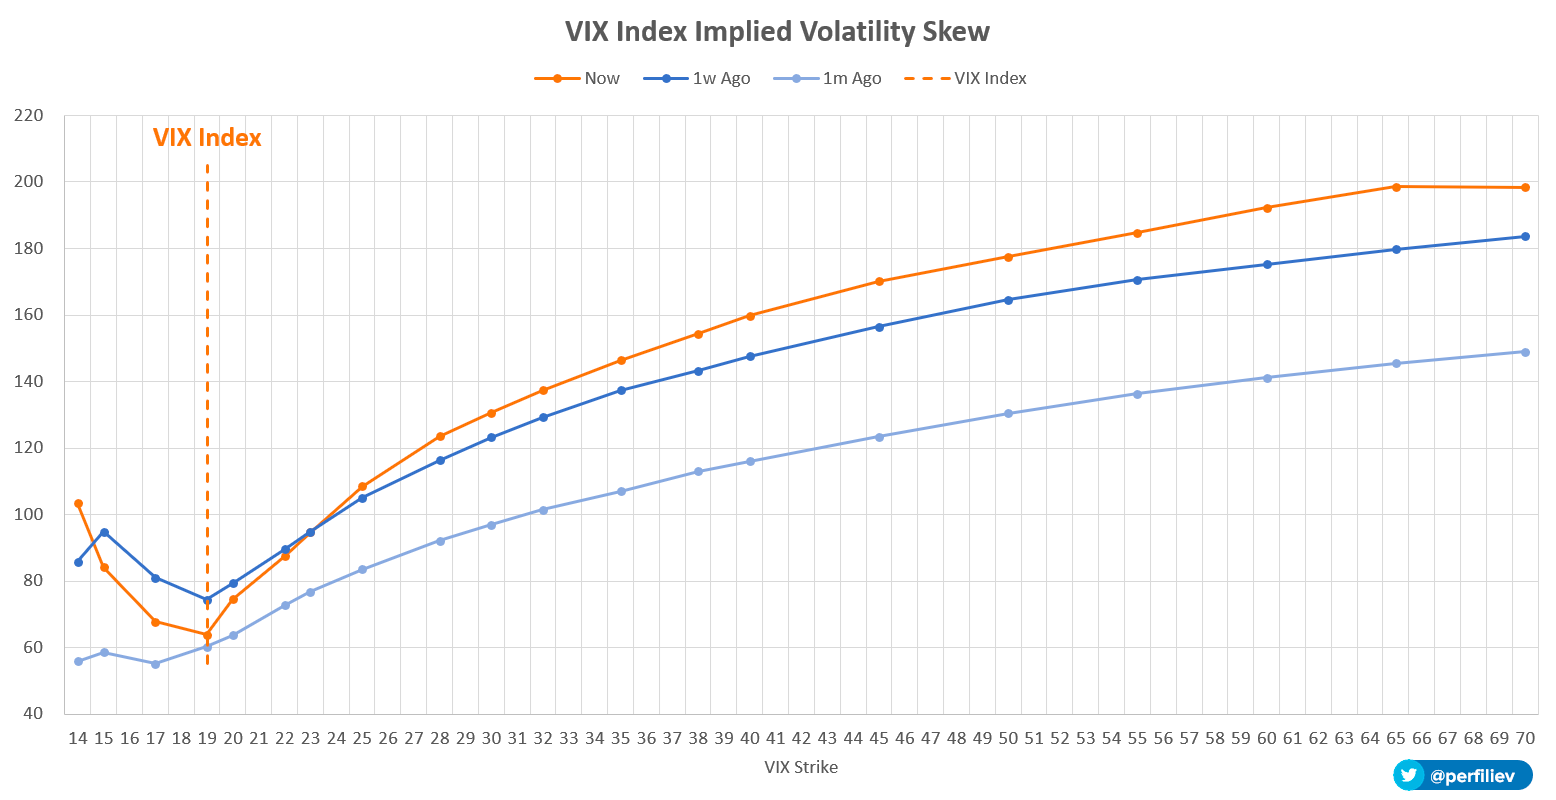
For days prior, top-line measures of implied volatility or IVOL like the Cboe Volatility Index (INDEX: VIX) fell, as did the Cboe VIX Volatility Index (INDEX: VVIX), the latter which is a way to gauge the expensiveness of IVOL or convexity. It was, in part, the resolution of a recent liquidity crisis that prompted this to happen. Under the hood, volatility skew told a different story; traders were hedging against tail outcomes.
Even so, this hedging and volatility skew behavior did little to boost the pricing of most spread structures above and below the market we analyzed. The non-stickiness of IVOL into this rally may have been detrimental to the more expensive call options structures, as we expected; hence, our consistent belief that structures should be kept at low- or no-cost.
The environment changed yesterday, however. Both top- and bottom-line measures of IVOL were sticky into equity market strength. This was observed via the pricing of spread structures (e.g., verticals and back- and ratio-spreads) structured above and below the market. The stickiness of volatility seemed to impact most the put side of the market. Some savvy traders may have been able to build spread structures below the market at a lesser cost potentially.
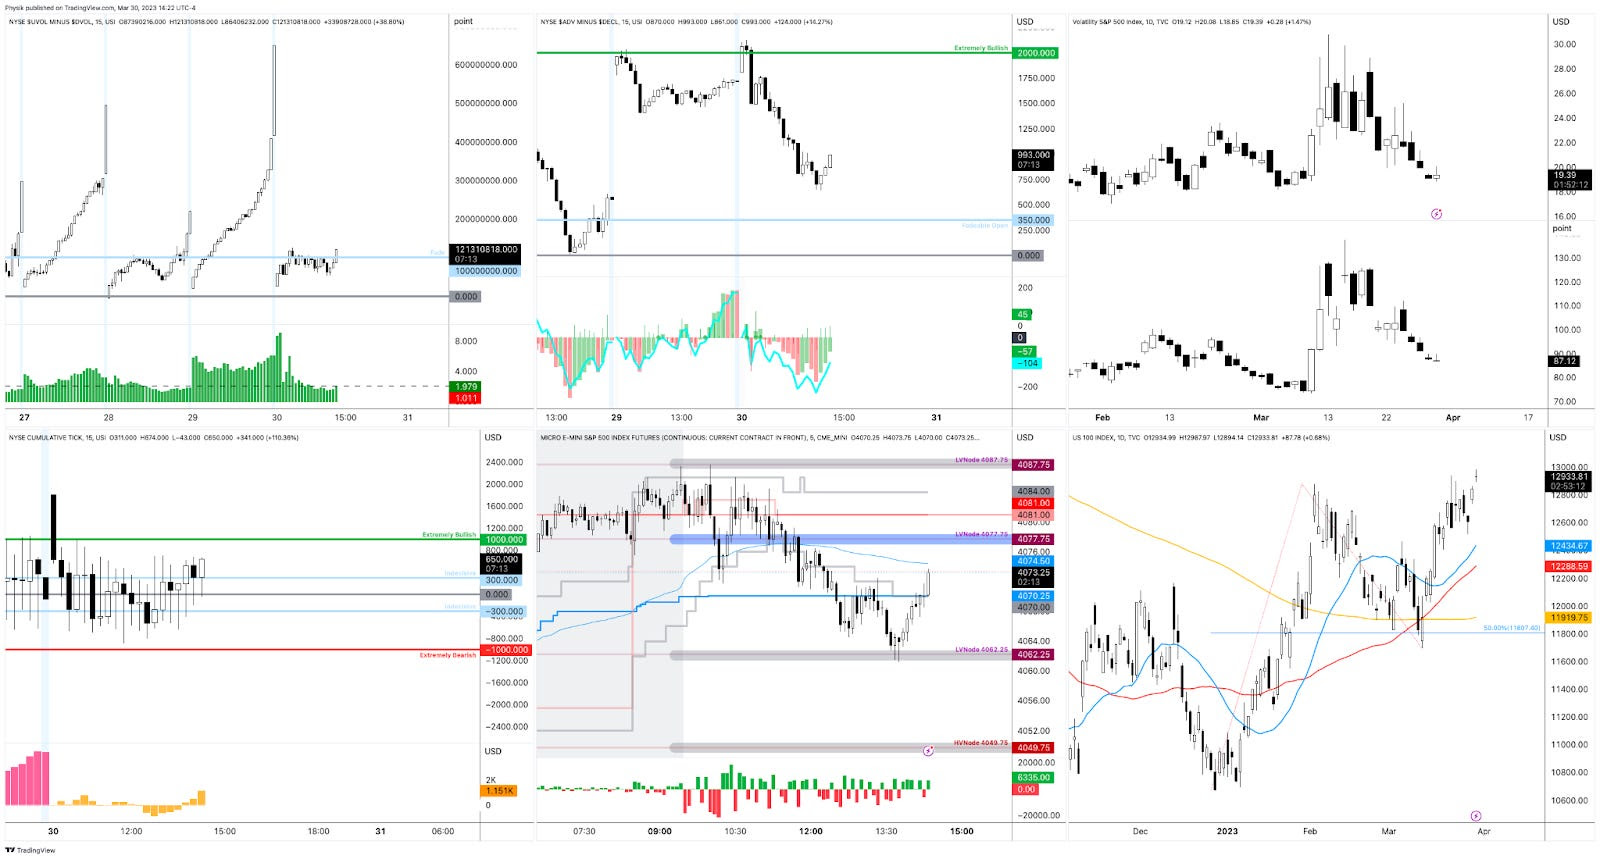
As an aside, some may have observed how well our levels have been working. For instance, as shown below (middle bottom), yesterday’s Daily Brief levels marked the session high and low for the Micro E-mini S&P 500 Index (FUTURE: /MES).
Graphic: Retrieved from TradingView.
Commentators online have rightly pointed out the build-up of short-dated options exposures near current market prices. In short, this activity, and its potential hedging, help promote mean-reversion and responsiveness at our volume profile-derived key levels, which often overlap with centers of significant options activity, as we see. Particularly after the quarterly options expiry (OpEx), this activity’s ability to contain markets will ease; markets will yield to fundamental strengths or weaknesses. Based on top-line measures of breadth and IVOL, “there isn’t much juice left to squeeze,” SpotGamma says. From an options positioning perspective, for volatility to reprice lower and solicit re-hedging that boosts the market, “we need a change in [the] volatility regime (i.e., soft landing, bank crisis resolved, etc.),” SpotGamma adds. The likelihood of that happening is low; some expect the Federal Reserve (Fed) to stick to its original message and continue to tighten and withdraw liquidity. So, blindly selling options (colloquially referred to as volatility) in this environment is dangerous.
Graphic: Retrieved from Bloomberg’s Joe Weisenthal.
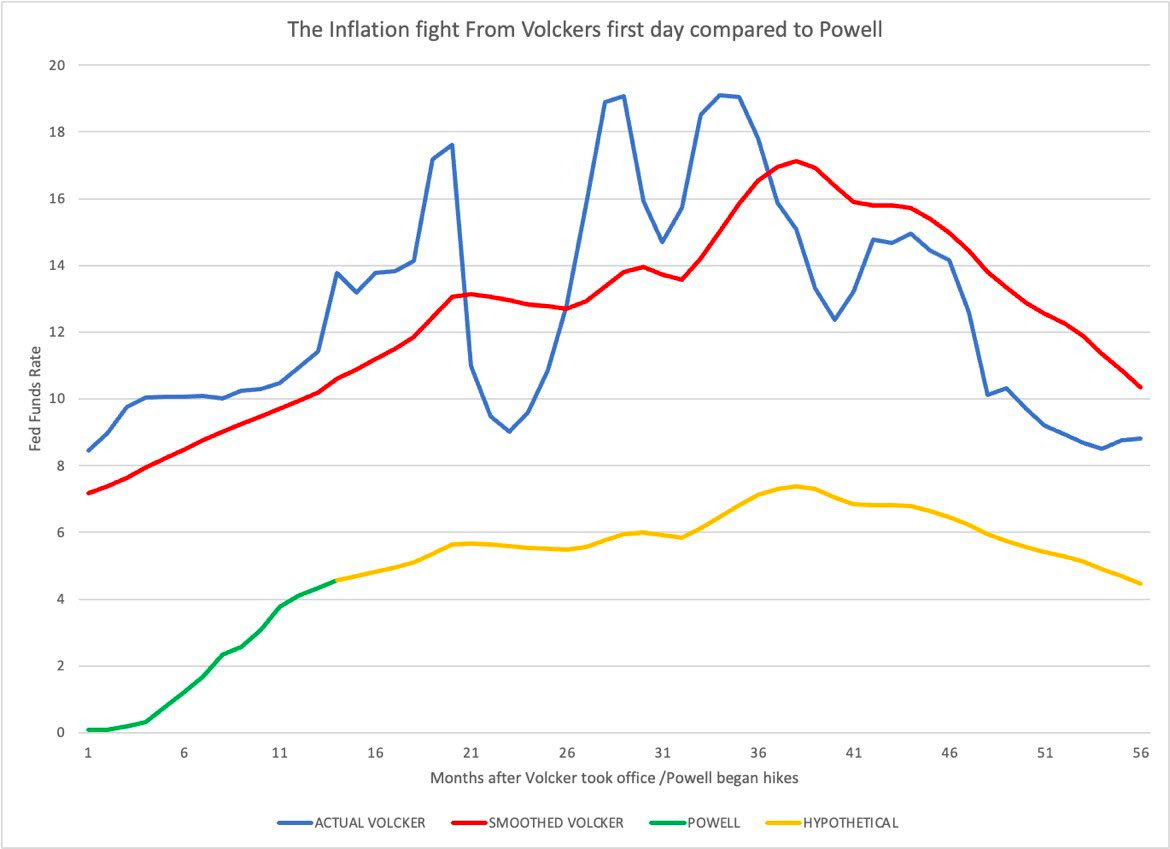
Damped Spring’s Andy Constan overlays past and present inflation fights. What if?
Graphic: Retrieved from Andy Constan of Damped Spring Advisors.
Technical
As of 8:00 AM ET, Friday’s regular session (9:30 AM – 4:00 PM ET) in the S&P 500 will likely open in the middle part of a balanced overnight inventory, inside of the prior day’s range, suggesting a limited potential for immediate directional opportunity.
The S&P 500 pivot for today is $4,087.75.
Key levels to the upside include $4,097.25, $4,108.75, and $4,121.25.
Key levels to the downside include $4,077.75, $4,062.25, and $4,049.75.
Disclaimer: Click here to load the updated key levels via the web-based TradingView platform. New links are produced daily. Quoted levels likely hold, barring an exogenous development.
Graphic: 65-minute profile chart of the Micro E-mini S&P 500 Futures (bottom middle).
About
The author, Renato Leonard Capelj, spends the bulk of his time at Physik Invest, an entity through which he invests and publishes free daily analyses to thousands of subscribers. The analyses offer him and his subscribers a way to stay on the right side of the market.
You may view this letter’s content calendar at this link.
Disclaimer
Do not construe this newsletter as advice; all content is for informational purposes, and derivatives carry a substantial risk of loss. Capelj and Physik Invest, non-professional advisors, will never solicit others for capital or collect fees and disbursements for their work.
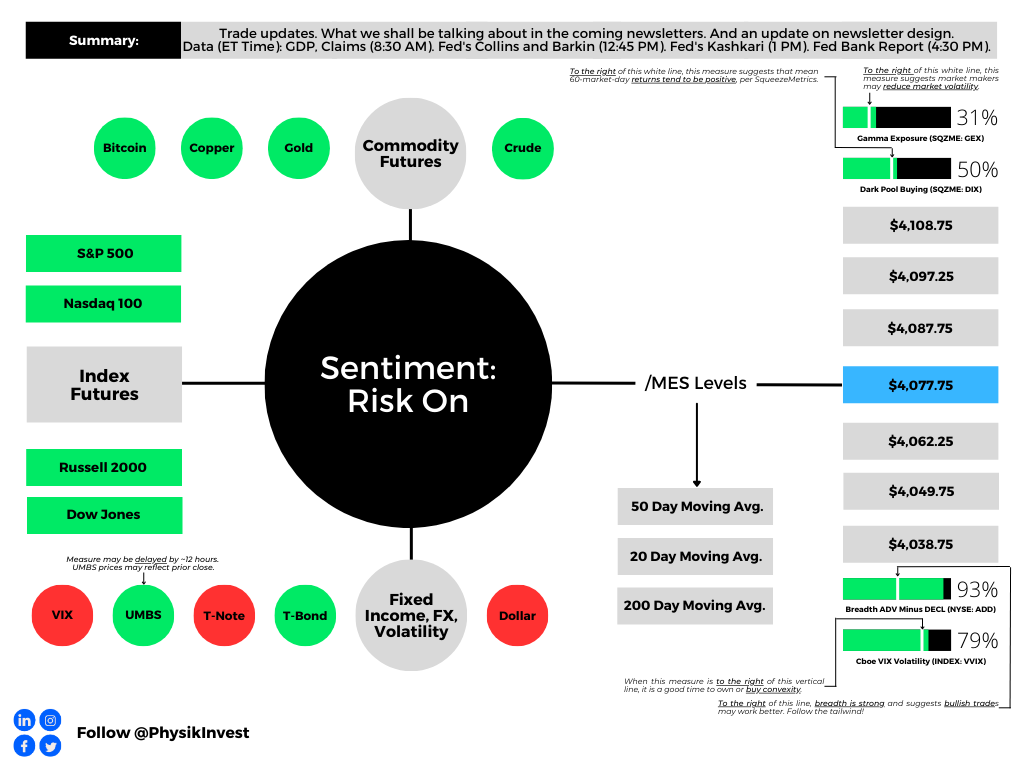
Graphic updated 6:30 AM ET. Sentiment Risk-On if expected /MES open is above the prior day’s range. /MES levels are derived from the profile graphic at the bottom of this letter. Click here for the latest levels. SqueezeMetrics Dark Pool Index (DIX) and Gamma (GEX) with the latter calculated based on where the prior day’s reading falls with respect to the MAX and MIN of all occurrences available. A higher DIX is bullish. The lower the GEX, the more (expected) volatility. Click to learn the implications of volatility, direction, and moneyness. Breadth reflects a reading of the prior day’s NYSE Advance/Decline indicator. The CBOE VIX Volatility Index (INDEX: VVIX) reflects the attractiveness of owning volatility. UMBS prices via MND. Click here for the economic calendar.
Administrative
Thanks for the feedback on the newsletter design! The technical section has returned for your viewing of crucial levels. We may update this section or merge it with another in the future. If you have any feedback, please comment or reply!
By the way, check out fx:macro’s neat market dashboard how-to-build guide! They have a fabulous newsletter, and this dashboard is an excellent component.
👉 A lot of people have asked about the Market Dashboard I'm using and how to build something similar
👉 I've put together a 35-page PDF with >50 screenshots going through the entire process using Excel and TradingView
In the coming sessions, there will be a dive into the geopolitical developments of late, far higher in quality than what we started this week with. For a sneak peek at what we will be talking about, look at this article, this podcast, and the Daily Brief for 1/4/23.
Positioning
In yesterday’s letter on positioning contexts, we concluded it was likely for markets to remain contained through month-end.
We said, “there is potential for markets to move into a far ‘more combustible’ position, … [and], with call skews far up meaningfully steep, still-present low- and zero-cost call structures” in previously depressed products like the Nasdaq 100 (INDEX: NDX), buoyed by financial tensions easing, were attractive to express the bullish view.
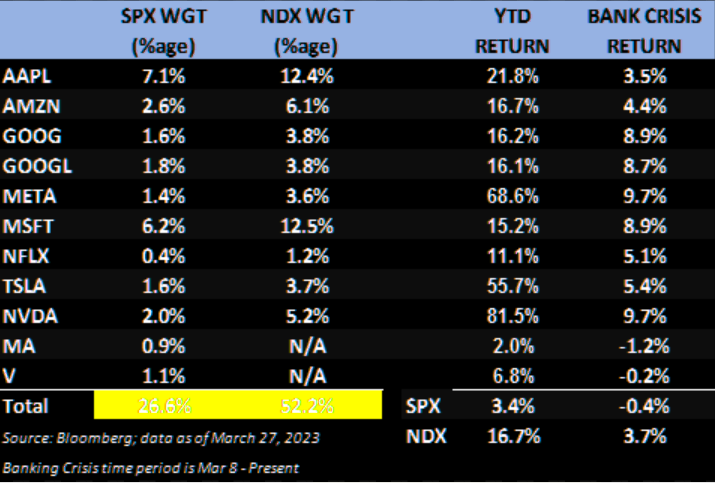
Graphic: Retrieved from JPMorgan Chase & Co (NYSE: JPM) via The Market Ear.
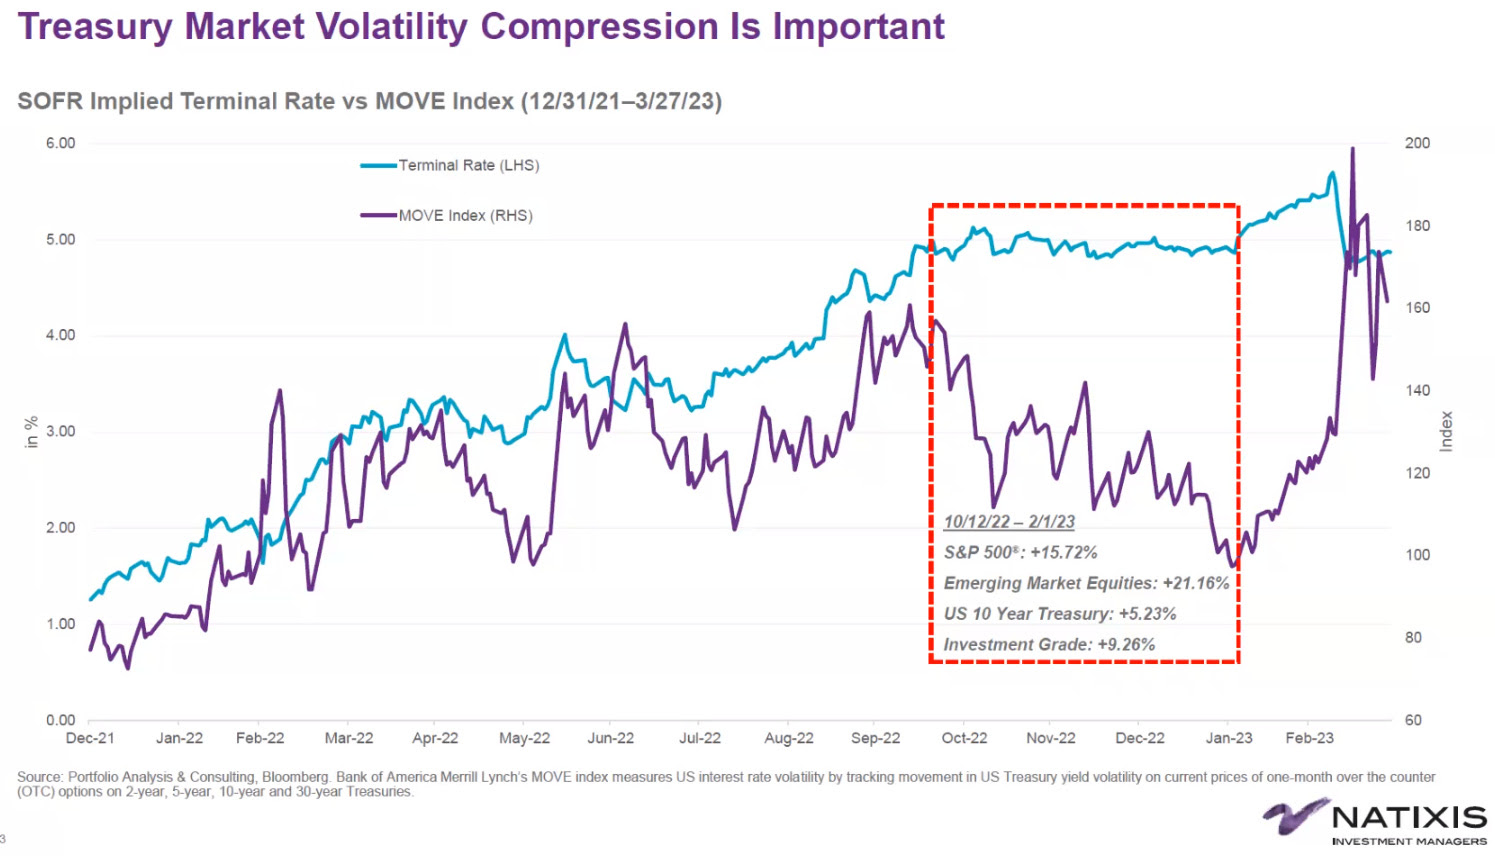
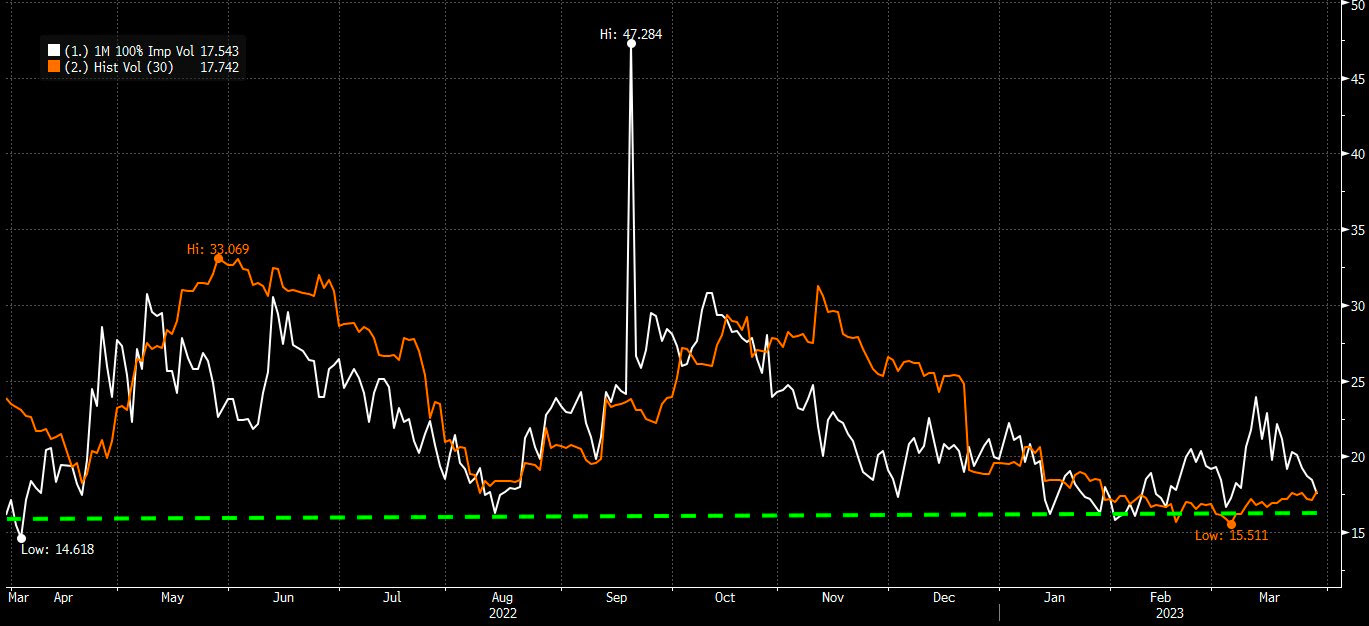
Though we weren’t too right about the potential for volatility to be sticky, which may be detrimental to some of the more expensive structures, such trades’ exposure to direction and movement appears to be offsetting time decay and volatility, sped up by the resolution of the liquidity crisis (i.e., the asset-liability mismatch at some banks that thought their depositors were far more loyal, hence less of a need to hedge risk) which prompted traders a few weeks back to demand protection and reprice options higher; the Merrill Lynch Option Volatility Estimate (INDEX: MOVE) and Cboe Volatility Index (INDEX: VIX) have come in dramatically. Please take a look at the full letter here.
As stated on 3/29, the fundamental view hasn’t changed. Therefore, we may consider monetizing our structures now and in the near future and using those credits to offset debit risk in plays such as far-dated bear put spreads (i.e., buy put and sell another at a lower strike); options data and insight platform SpotGamma says the juice has been squeezed now with S&P 500 (INDEX: SPX) 1-month at-the-money implied volatility or IVOL pricing at 17%. “For a decline to continue, we need a change in volatility regime (i.e., soft landing, bank crisis resolved, etc.) because, with 1-month realized at 15%, you can argue there isn’t much juice left to squeeze.” Caution on the upside plays.
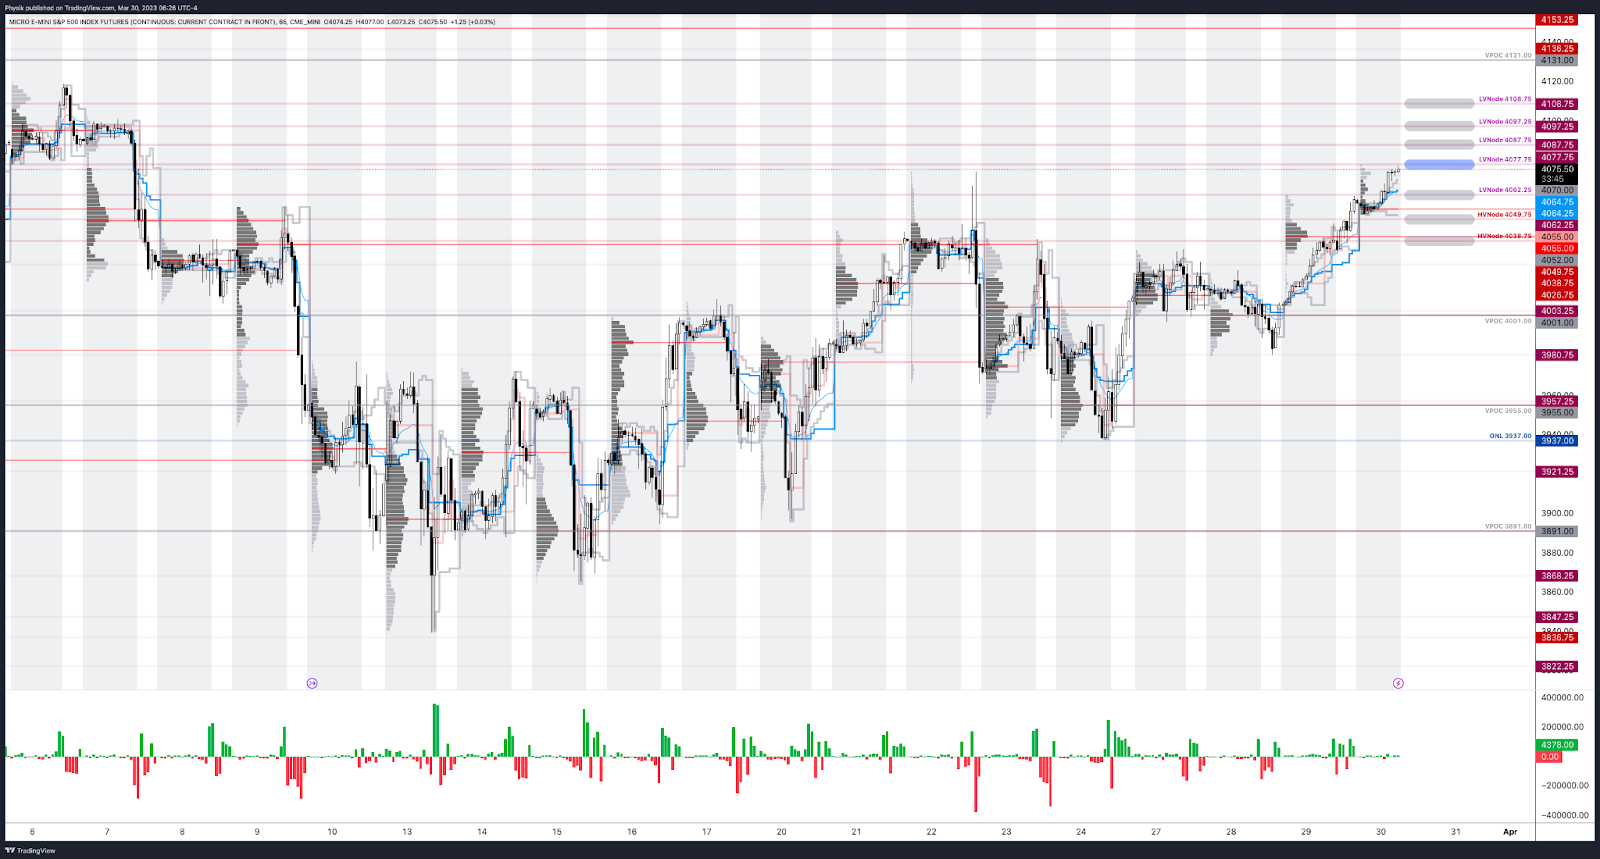
As of 6:30 AM ET, Thursday’s regular session (9:30 AM – 4:00 PM ET) in the S&P 500 will likely open in the upper part of a positively skewed overnight inventory, outside of the prior day’s range, suggesting a potential for immediate directional opportunity.
The S&P 500 pivot for today is $4,077.75.
Key levels to the upside include $4,087.75, $4,097.25, and $4,108.75.
Key levels to the downside include $4,062.25, $4,049.75, and $4,038.75.
Click here to load the updated key levels via the web-based TradingView platform.
New links are produced daily.
Quoted levels likely hold, barring an exogenous development.
Graphic: 65-minute profile chart of the Micro E-mini S&P 500 Futures.
About
The author, Renato Leonard Capelj, spends the bulk of his time at Physik Invest, an entity through which he invests and publishes free daily analyses to thousands of subscribers. The analyses offer him and his subscribers a way to stay on the right side of the market.
You may view this letter’s content calendar at this link.
Disclaimer
Do not construe this newsletter as advice; all content is for informational purposes, and derivatives carry a substantial risk of loss. Capelj and Physik Invest, non-professional advisors, will never solicit others for capital or collect fees and disbursements for their work.