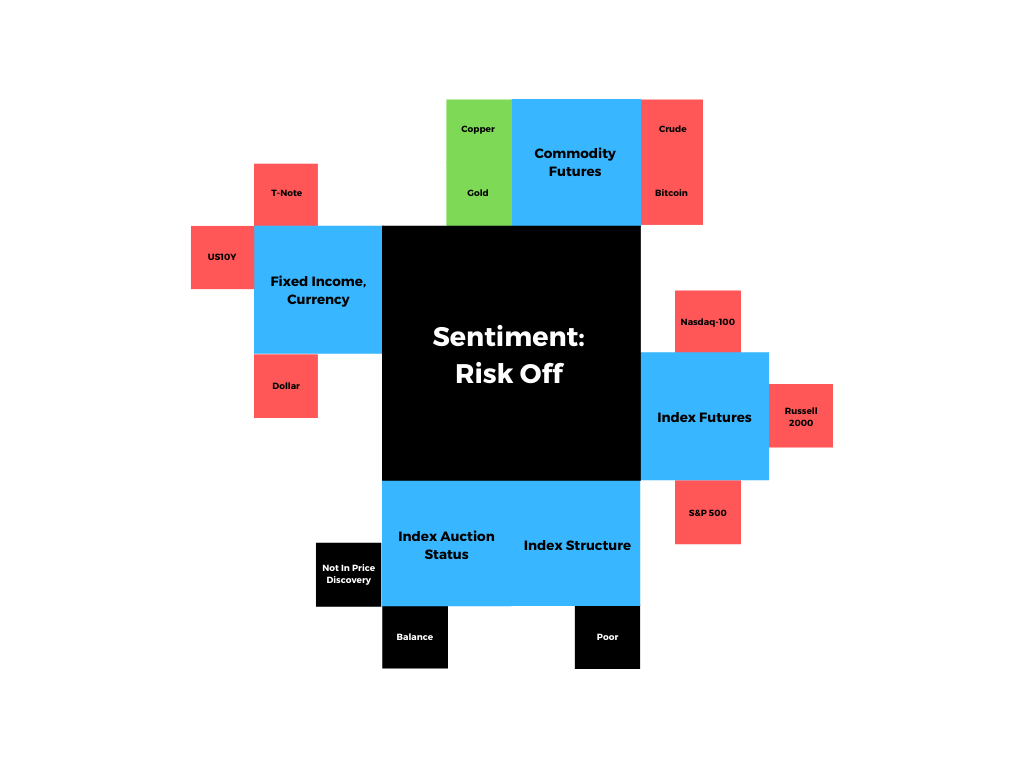
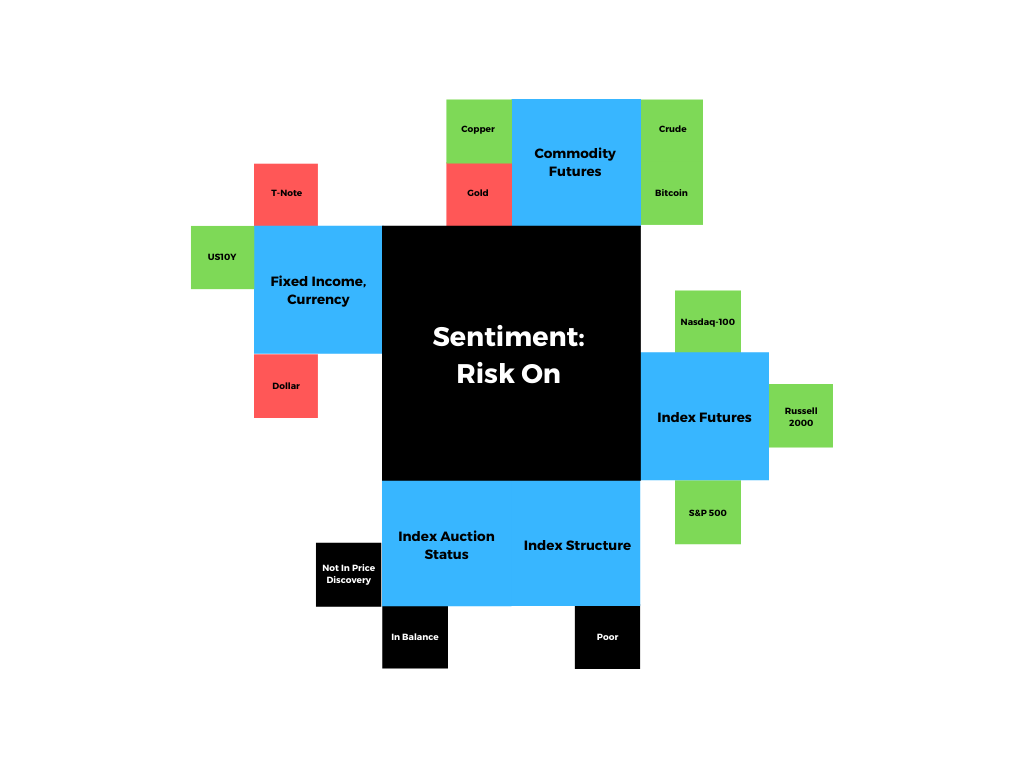
Index futures are attempting to balance and validate higher prices.
Global pandemic recovery uneven.
Investors await corporate earnings.
Indices to correct in time and price.
What Happened: U.S. stock index futures balanced ahead of a fresh round of corporate earnings.
What To Expect: Monday’s regular session (9:30 AM – 4:00 PM EST) will likely open inside of prior-range and -value, suggesting a limited potential for directional opportunity.
Adding, during the prior week, the best case outcome occurred, evidenced by initiative trade that established new all-time highs in the S&P 500, Nasdaq-100, and Dow Jones Industrial Average.
Coming into this week, though equity markets are positioned bullishly, there exists an increased potential to correct in time and price. Adding, should there be a turn and spike in volatility, participants must be ready to accept the possibility of a violent liquidation, given the poor structure left behind prior price discovery and increased put selling, among other factors highlighted in Sunday’s commentary.
Price Discovery (One-Timeframe Or Trend): Elongation and range expansion denotes a market seeking new prices to establish value, or acceptance (i.e., more than 30-minutes of trade at a particular price level).
For today, participants can trade from the following frameworks.
In the best case, the S&P 500 trades sideways or higher; activity above the $4,161.75 regular trade low targets the $4,171.00 VPOC. Initiative trade beyond the VPOC could reach as high as the $4,183.50 regular-trade high and the cluster of Fibonacci price extensions above $4,187.00. In the worst case, the S&P 500 trades lower; activity below $4,171.00 is likely to solicit responsive buying near the $4,157.00 high-volume area (HVNode). Thereafter, if lower, $4,137.00 and $4,123.00 are other valuable areas to do business.
Volume Areas: A structurally sound market will build on past areas of high-volume. Should the market trend for long periods of time, it will lack sound structure (identified as a low-volume area which denotes directional conviction and ought to offer support on any test).

If participants were to auction and find acceptance into areas of prior low-volume, then future discovery ought to be volatile and quick as participants look to areas of high-volume for favorable entry or exit.

POCs: POCs (like HVNodes described above) are valuable as they denote areas where two-sided trade was most prevalent. Participants will respond to future tests of value as they offer favorable entry and exit.

Responsive Buying: Buying in response to prices below area of recent price acceptance.
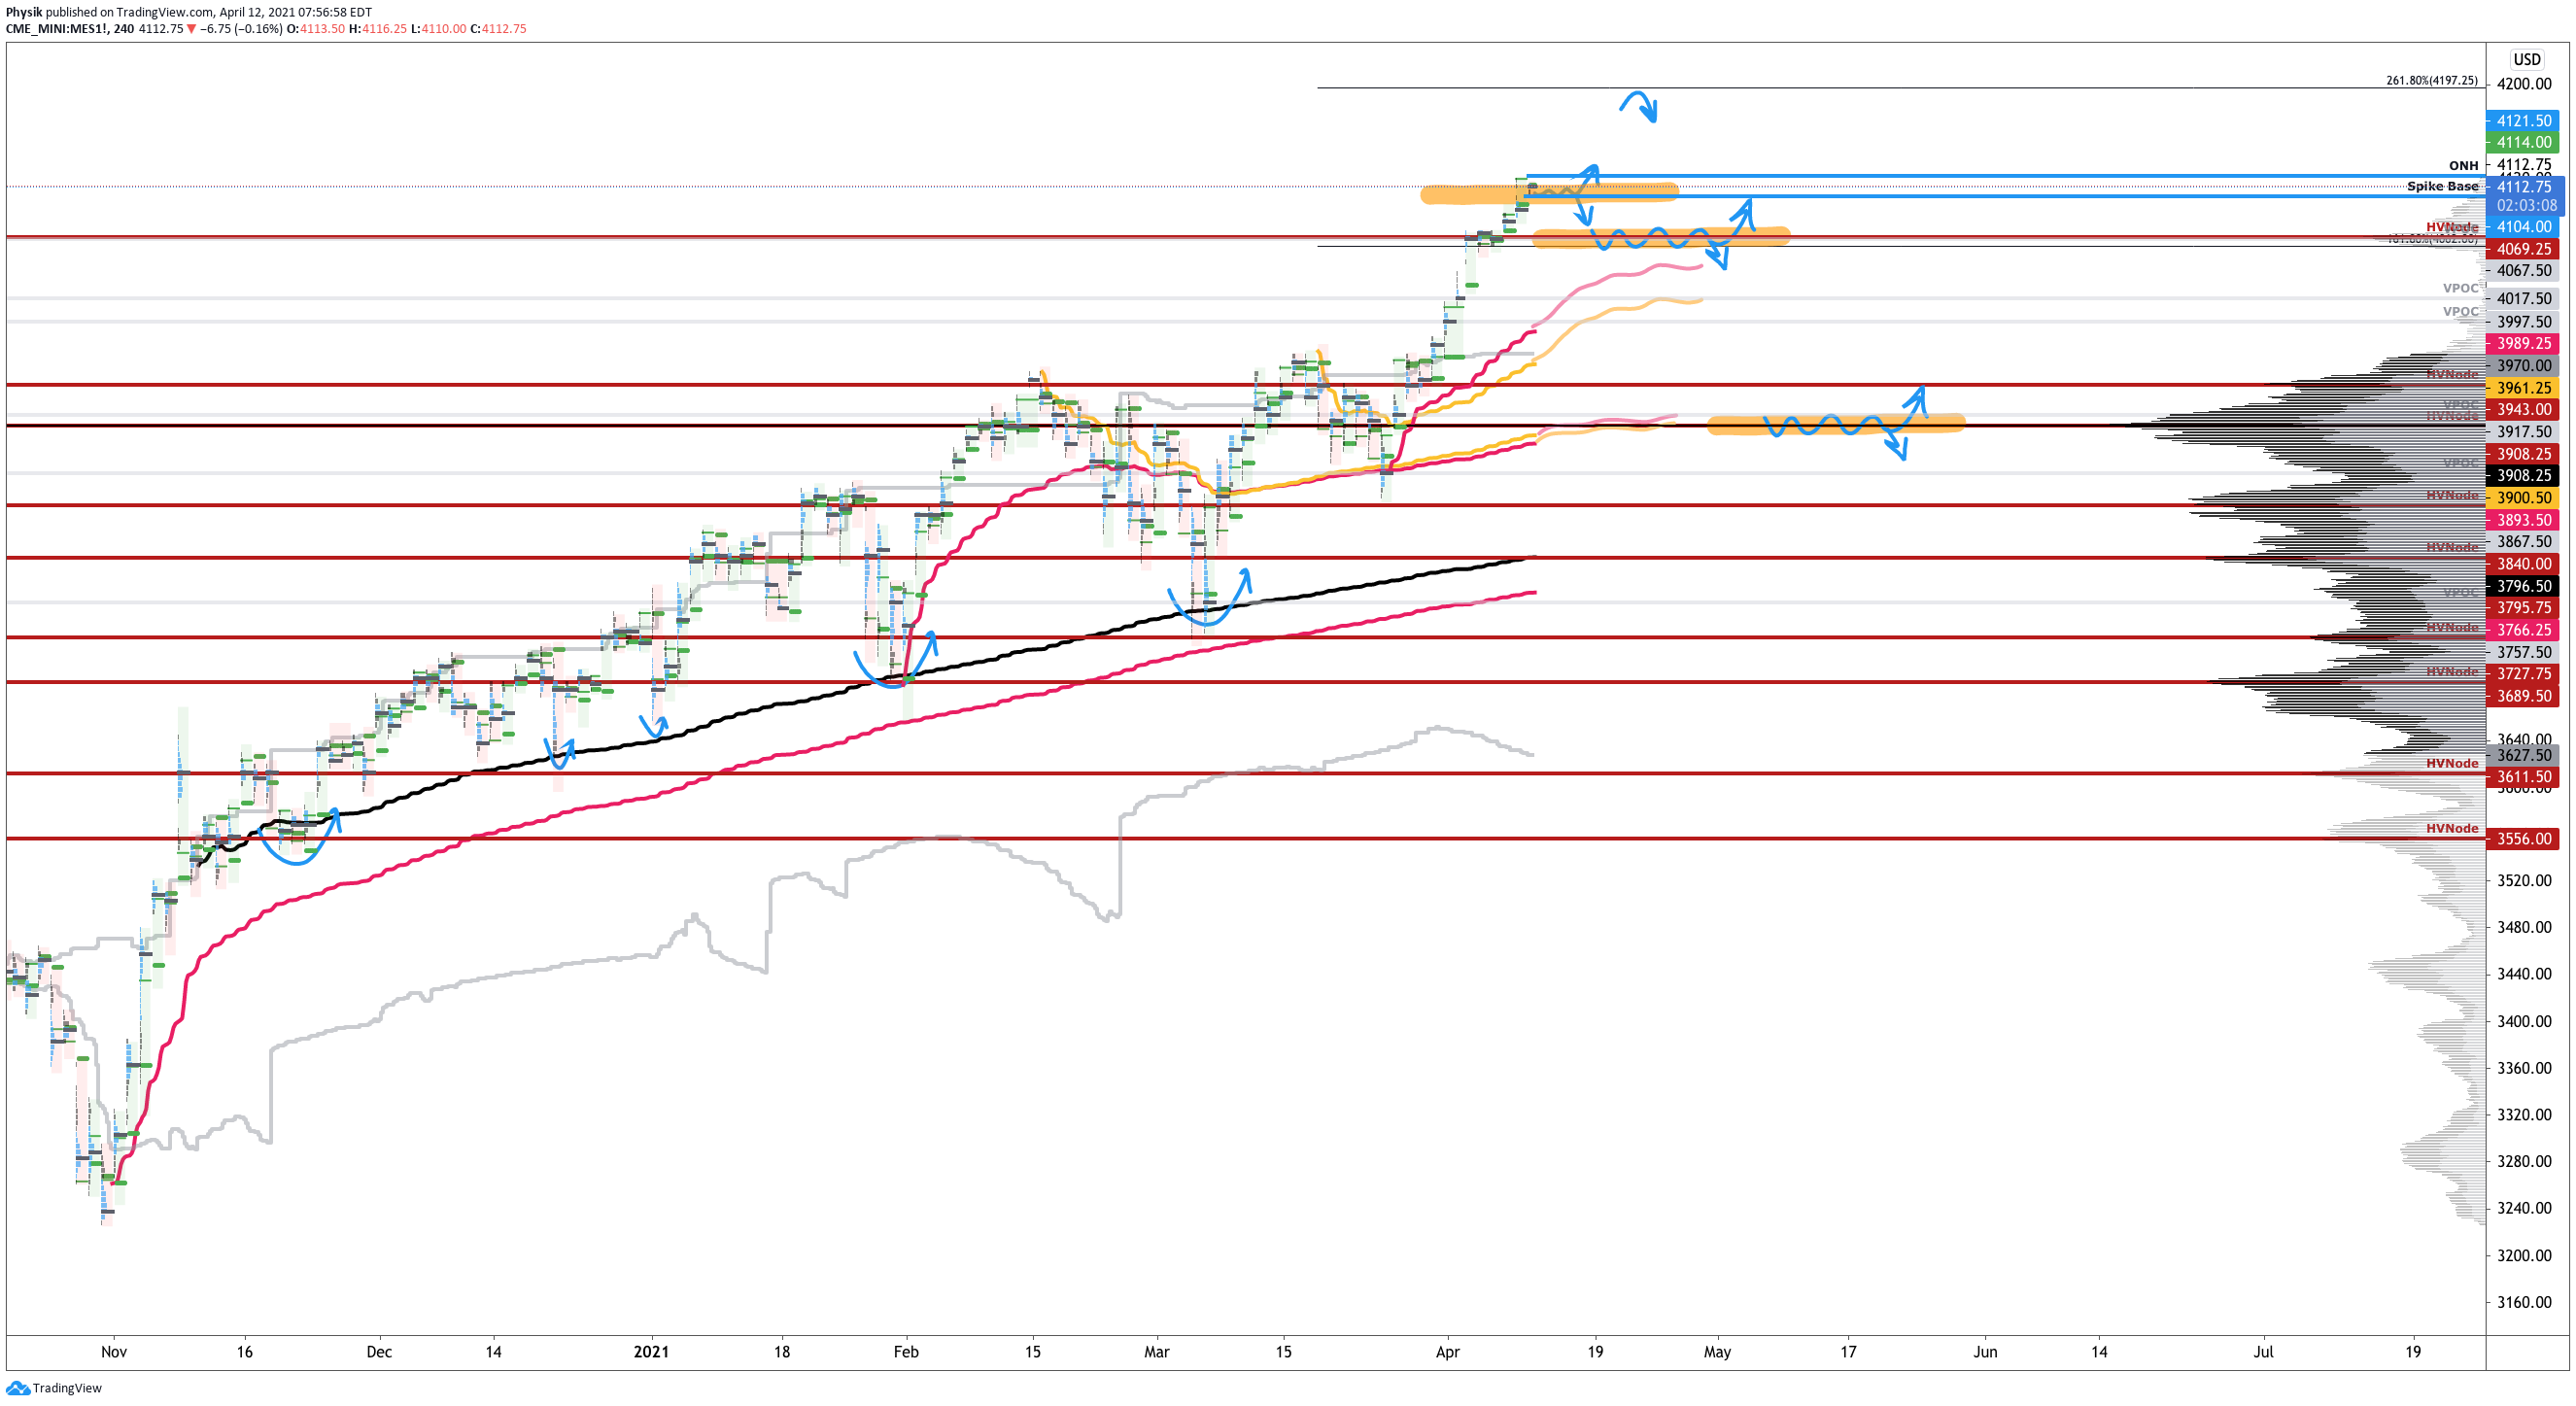
Graphic: 4-hour profile chart of the Micro E-mini S&P 500 Futures.Graphic: Physik Invest maps out the purchase of call and put options in the SPDR S&P 500 ETF Trust (NYSE: SPY), for the week ending April 16. Activity in the options market was primarily concentrated in short-dated tenors, in strikes as low as $364, which corresponds with $3,640 in the cash-settled S&P 500 Index (INDEX: SPX).
1/x I learned a loooong time ago to never fight a well FED Gary 🦍…Despite a long list of reasons to be 🐻’ish, including: 1)Vanna 👸 & Charm 🦥 away @ the 🏖 for an extended vacation, 2) sentiment & positioning historically stretched by almost every metric, 3) a VVIX/VIX ratio https://t.co/cBezBALbuYpic.twitter.com/gg8y4KnzwQ
This past week with S&P at all time highs, the data reveals ETF's were heavier in call selling (to close) and put buying (to open). pic.twitter.com/R6NxasRQHX
Startups | Tips for those that are joining a startup for the first time. (FRR)
Space | Why flying a four-pound helicopter on Mars is a big deal. (BBG)
FinTech | U.S. banks deploy AI to monitor customers and workers. (REU)
Spirits | Whisky world at war as tech allows for instant spirit aging. (FT)
Crypto | Bank of England, HM Treasury create a CBDC taskforce. (BoE)
Technology | Clubhouse closes round of funding, raising value. (REU)
About
Renato founded Physik Invest after going through years of self-education, strategy development, and trial-and-error. His work reporting in the finance and technology space, interviewing leaders such as John Chambers, founder, and CEO, JC2 Ventures, Kevin O’Leary, Canadian businessman and Shark Tank host, Catherine Wood, CEO and CIO, ARK Invest, among others, afforded him the perspective and know-how very few come by.
Having worked in engineering and majored in economics, Renato is very detailed and analytical. His approach to the markets isn’t built on hope or guessing. Instead, he leverages the unique dynamics of time and volatility to efficiently act on opportunity.
Disclaimer
At this time, Physik Invest does not manage outside capital and is not licensed. In no way should the materials herein be construed as advice. Derivatives carry a substantial risk of loss. All content is for informational purposes only.
What Happened: U.S. stock index futures balanced overnight as participants positioned themselves for a strong earnings season.
What To Expect: Wednesday’s regular session (9:30 AM – 4:00 PM EST) will likely open inside of prior-range and -value, suggesting a limited potential for immediate directional opportunity.
Adding, during the prior day’s regular trade in the S&P 500, the best case outcome occurred, evidenced by initiative trade above $4,127.00, which is significant because it marked an overnight-high (ONH).
More On Overnight Rally Highs (Lows): Typically, there is a low historical probability associated with overnight rally-highs (lows) ending the upside (downside) discovery process.
It seems that nearly every day this commentary goes out, U.S. index futures are trading sideways or higher. Is that a reason to become bearish? Absolutely not.
Much of the advance comes in light of a historically bullish period for markets. As a result of supportive structural flows and the pricing in of positive earnings expectations, the S&P 500 is up over 11% since the start of March.
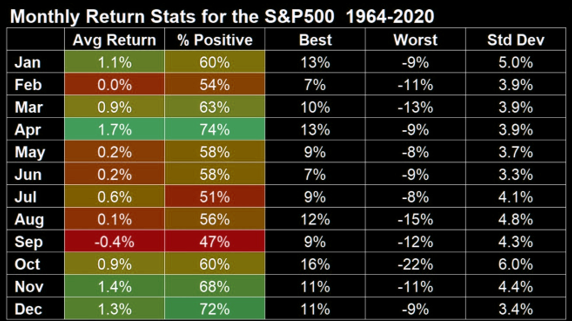
Graphic: April, historically speaking, is usually a good month for equity investors.
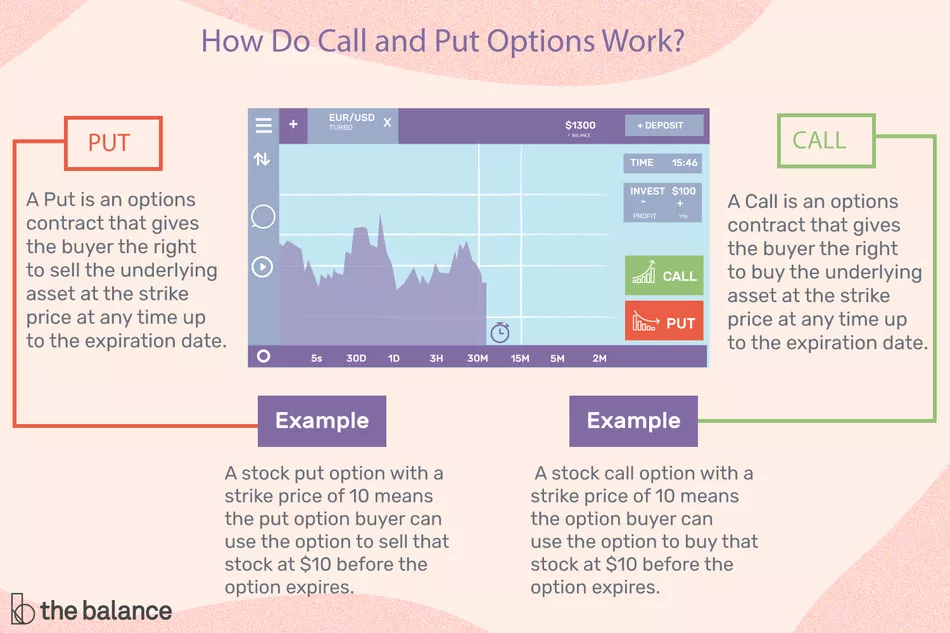
Taking a step back, based on speculative derivatives activity, participants are opportunistically hedging their downside. This is evidenced by ask-side activity in long-dated puts, which provide holders with the right to sell an asset, at a certain price, at some point in the future.
Graphic: The Balance explains how call and put options work.
At the same time, volatility is falling off of a cliff causing the sensitivity of options to changes in underlying price to increase. As a result, because option dealers are typically long calls and short puts, the “long-gamma” dynamic — crushed volatility and momentum — becomes more pronounced; amid associated hedging, liquidity increases and movement declines. This dynamic will likely resolve itself come April’s monthly options expiration.
Option Expiration (OPEX) Significance: Option expiries mark an end to pinning (i.e, the theory that market makers and institutions short options move stocks to the point where the greatest dollar value of contracts will expire worthless) and the reduction dealer gamma exposure.
As realized volatility falls from its peak around a year ago, more sold SPX options cluster at strikes nearer to spot. And as implied volatility falls with it, the gamma of those options increases.
More dealer long gamma means more liquidity. More liquidity means less movement. pic.twitter.com/712OAMq7iP
For today, participants can trade from the following frameworks.
In the best case, the S&P 500 trades sideways or higher; activity above $4,139.75 excess high targets $4,143.00, a price extension. Initiative trade beyond the $4,143.00 level could reach as high as $4,197.25. In the worst case, the S&P 500 trades lower; activity below the $4,120.00 pull-back low targets the $4,112.75 high-volume area (HVNode) and $4,104.00 spike base.
More On Volume Areas: A structurally sound market will build on past areas of high-volume (HVNode). Should the market trend for long periods of time, it will lack sound structure (identified as a low-volume area (LVNode) which denotes directional conviction and ought to offer support on any test).

If participants were to auction and find acceptance into areas of prior low-volume, then future discovery ought to be volatile and quick as participants look to areas of high volume for favorable entry or exit.

More On Spikes: Spike’s mark the beginning of a break from value. Spikes higher (lower) are validated by trade at or above (below) the spike base (i.e., the origin of the spike).
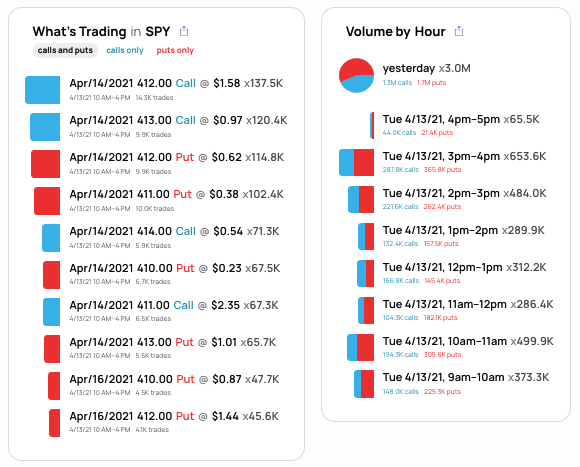
Graphic: 4-hour profile chart of the Micro E-mini S&P 500 Futures.Graphic: Physik Invest maps out the purchase of call and put options in the SPDR S&P 500 ETF Trust (NYSE: SPY), for April 13. Activity in the options market was primarily concentrated in short- and long-dated tenors, in strikes near $412, which corresponds with $4,120 in the cash-settled S&P 500 Index (INDEX: SPX).Graphic: SHIFT search shows that trade in the SPDR S&P 500 ETF Trust (NYSE: SPY) was scattered across call and put strikes near current prices.
News And Analysis
Travel | Airlines can’t get the world flying again despite the U.S. boom. (BBG)
Recovery | Amsterdam’s recovery from a deadly outbreak in 1665. (BBG)
Energy | Overhang in oil inventories worked off, outlook improving. (IEA)
Crypto | Yellen, crypto fearmongers get pushback from CIA director. (Forbes)
Markets | Nomura, Credit Suisse tighten financing in hedge fund units. (BBG)
Recovery | Pfizer, and BioNTech on track to beat Q2 EU vaccine goal. (BBG)
Earnings | JPMorgan’s net profit soars 5-fold to $14.3B, the stock slipped. (MW)
Economy | National delinquency rate posted a fifth consecutive decline. (MND)
Economy | Fed needs to do more to keep short-term rates above zero. (REU)
Crypto | IRS says crypto reporting standards would help close the tax gap. (TB)
Markets | SPACs may cast a wider net as competition for targets increases. (CB)
World | Japan to release contaminated Fukushima water after treatment. (REU)
What People Are Saying
In 96-97 the two top S&P traders in my office started to build big short positions at 650-700, their thesis made so much sense, 20 year run, triple off 87 crash low, blow off top. Market then doubled, they got shit canned and it never traded under their 'crash level' area of 650 pic.twitter.com/dL1UBOZknJ
Citi and MS both reported double-digit increases in their so-called Level 3 assets -opaque securities such as high-risk loans and some derivatives, same ones that cause havoc during the financial crisis. Shit is coming to the surface slowly everywhere pic.twitter.com/LPtbWPEvyM
1/x per usual, Wed’s update’ll be brief…Vanna’s👸gone. But Gary’s🦍@ the top of his game. & although our🦥is no👸, he’s charming enough when Gary’s well FED, & so, as predicted, here we are @ our projected 4140@ our long projected🪟, & WofFortune is crushing the ratings… But https://t.co/aS5zeTu9bUpic.twitter.com/pQH9pjrXwN
NFT | New York Stock Exchange debuts ‘First Trade’ non-fungible tokens. (FN)
About
Renato founded Physik Invest after going through years of self-education, strategy development, and trial-and-error. His work reporting in the finance and technology space, interviewing leaders such as John Chambers, founder, and CEO, JC2 Ventures, Kevin O’Leary, Canadian businessman and Shark Tank host, Catherine Wood, CEO and CIO, ARK Invest, among others, afforded him the perspective and know-how very few come by.
Having worked in engineering and majored in economics, Renato is very detailed and analytical. His approach to the markets isn’t built on hope or guessing. Instead, he leverages the unique dynamics of time and volatility to efficiently act on opportunity.
Disclaimer
At this time, Physik Invest does not manage outside capital and is not licensed. In no way should the materials herein be construed as advice. Derivatives carry a substantial risk of loss. All content is for informational purposes only.
Index futures are attempting to balance and validate higher prices.
U.S. calls for pause to one vaccine.
Participants await data on inflation.
Futures off new highs, but in-range.
What Happened: U.S. stock index futures auctioned higher overnight before liquidating alongside calls to stop using the Johnson & Johnson (NYSE: JNJ) vaccine after clotting cases.
What To Expect: Tuesday’s regular session (9:30 AM – 4:00 PM EST) will likely open inside of prior-range and -value, suggesting a low potential for immediate directional opportunity.
Adding, during the prior day’s regular trade, the best case outcome occurred, evidenced by range-bound trade above the $4,104.00 spike base, which is significant because it validated Friday’s late-day knee-jerk rally away from value, or the fairest price to do business for that session.
Coming up, consumer-price index numbers will be released at 8:30 a.m. EST; participants increasingly see the risks of inflation and taxes as a big headwind.
As an aside, as noted in the Weekly Brief, Friday, April 16, will mark an end to the monthly options expiration. As that date approaches, and volatility continues to drop, given how participants are positioned, odds of sustained directional resolve are low.
For today, participants can trade from the following frameworks.
In the best case, the S&P 500 trades sideways or higher; activity above the $4,104.00 spike base targets $4,117.25, the 50% overnight retracement. Initiative trade beyond the 50% retracement could reach as high as the $4,127.00 ONH. In the worst case, the S&P 500 trades lower; activity below $4,104.00 puts the rally on hold and targets the $4,069.00 and $3,943.00 high-volume areas (HVNodes).
More On Overnight Rally Highs (Lows): Typically, there is a low historical probability associated with overnight rally-highs (lows) ending the upside (downside) discovery process.

More On Volume Areas: A structurally sound market will build on past areas of high-volume (HVNode). Should the market trend for long periods of time, it will lack sound structure (identified as a low-volume area (LVNode) which denotes directional conviction and ought to offer support on any test).

If participants were to auction and find acceptance into areas of prior low-volume, then future discovery ought to be volatile and quick as participants look to areas of high volume for favorable entry or exit.
Graphic: 4-hour profile chart of the Micro E-mini S&P 500 Futures.Graphic: Physik Invest maps out the purchase of call and put options in the SPDR S&P 500 ETF Trust (NYSE: SPY), for April 12. Activity in the options market was primarily concentrated in short-dated tenors, in strikes as low as $398, which corresponds with $3,980 in the cash-settled S&P 500 Index (INDEX: SPX).Graphic: SHIFT search shows that trade in the cash-settled S&P 500 Index (INDEX: SPX) was concentrated in put strikes below current prices.
Realized volatility is back to post Covid-Crash lows as we push towards 4/16 OPEX. Currently we see ~30% of S&P gamma rolling off by Fridays close. pic.twitter.com/0xWzQYQ1Vb
Step 1: Pick few horizontal patterns Step 2: Pick a time frame Step 3: Go through as many charts/instruments (tradable) as possible Step 4: Build a daily/weekly routine to review same charts Step 5: Be selective pic.twitter.com/Jx6p3KrfdP
Renato founded Physik Invest after going through years of self-education, strategy development, and trial-and-error. His work reporting in the finance and technology space, interviewing leaders such as John Chambers, founder, and CEO, JC2 Ventures, Kevin O’Leary, Canadian businessman and Shark Tank host, Catherine Wood, CEO and CIO, ARK Invest, among others, afforded him the perspective and know-how very few come by.
Having worked in engineering and majored in economics, Renato is very detailed and analytical. His approach to the markets isn’t built on hope or guessing. Instead, he leverages the unique dynamics of time and volatility to efficiently act on opportunity.
Disclaimer
At this time, Physik Invest does not manage outside capital and is not licensed. In no way should the materials herein be construed as advice. Derivatives carry a substantial risk of loss. All content is for informational purposes only.
Index futures are attempting to balance and validate higher prices.
Pay attention to economic reports.
Earnings season officially starting.
Balance-to-higher into April OPEX.
What Happened: U.S. stock index futures balanced overnight ahead of first-quarter earnings reports by large financial firms.
What To Expect: Monday’s regular session in the S&P 500 (9:30 AM – 4:00 PM EST) will likely open inside of prior-range and -value, suggesting a limited potential for directional opportunity.
Adding, during prior regular trade, the best case outcome occurred, evidenced by initiative trade above the S&P 500’s $4,100.00 high-interest strike, which will act as a magnet into Friday’s monthly options expiration (OPEX).
Option Expiration (OPEX) Significance: Option expiries mark an end to pinning (i.e, the theory that market makers and institutions short options move stocks to the point where the greatest dollar value of contracts will expire worthless) and the reduction dealer gamma exposure.
As a result, given low trading volumes, and because of how impactful activity in the derivatives market is, traders should consider the potential for further balance or digestion of higher prices.
Further, for today, participants can trade from the following frameworks.
In the best case, the S&P 500 trades sideways or higher; activity above the $4,104.00 spike base targets the $4,121.50 overnight-high (ONH). Initiative trade beyond the ONH could reach as high as the $4,197.25 price extension. In the worst case, the S&P 500 trades lower; activity below the $4,104.00 spike base targets the $4,069.00 and $3,943.00 high-volume areas (HVNode).
More On Overnight Rally Highs (Lows): Typically, there is a low historical probability associated with overnight rally-highs (lows) ending the upside (downside) discovery process.

More On Volume Areas: A structurally sound market will build on past areas of high-volume (HVNode). Should the market trend for long periods of time, it will lack sound structure (identified as a low-volume area (LVNode) which denotes directional conviction and ought to offer support on any test).

If participants were to auction and find acceptance into areas of prior low-volume, then future discovery ought to be volatile and quick as participants look to areas of high volume for favorable entry or exit.
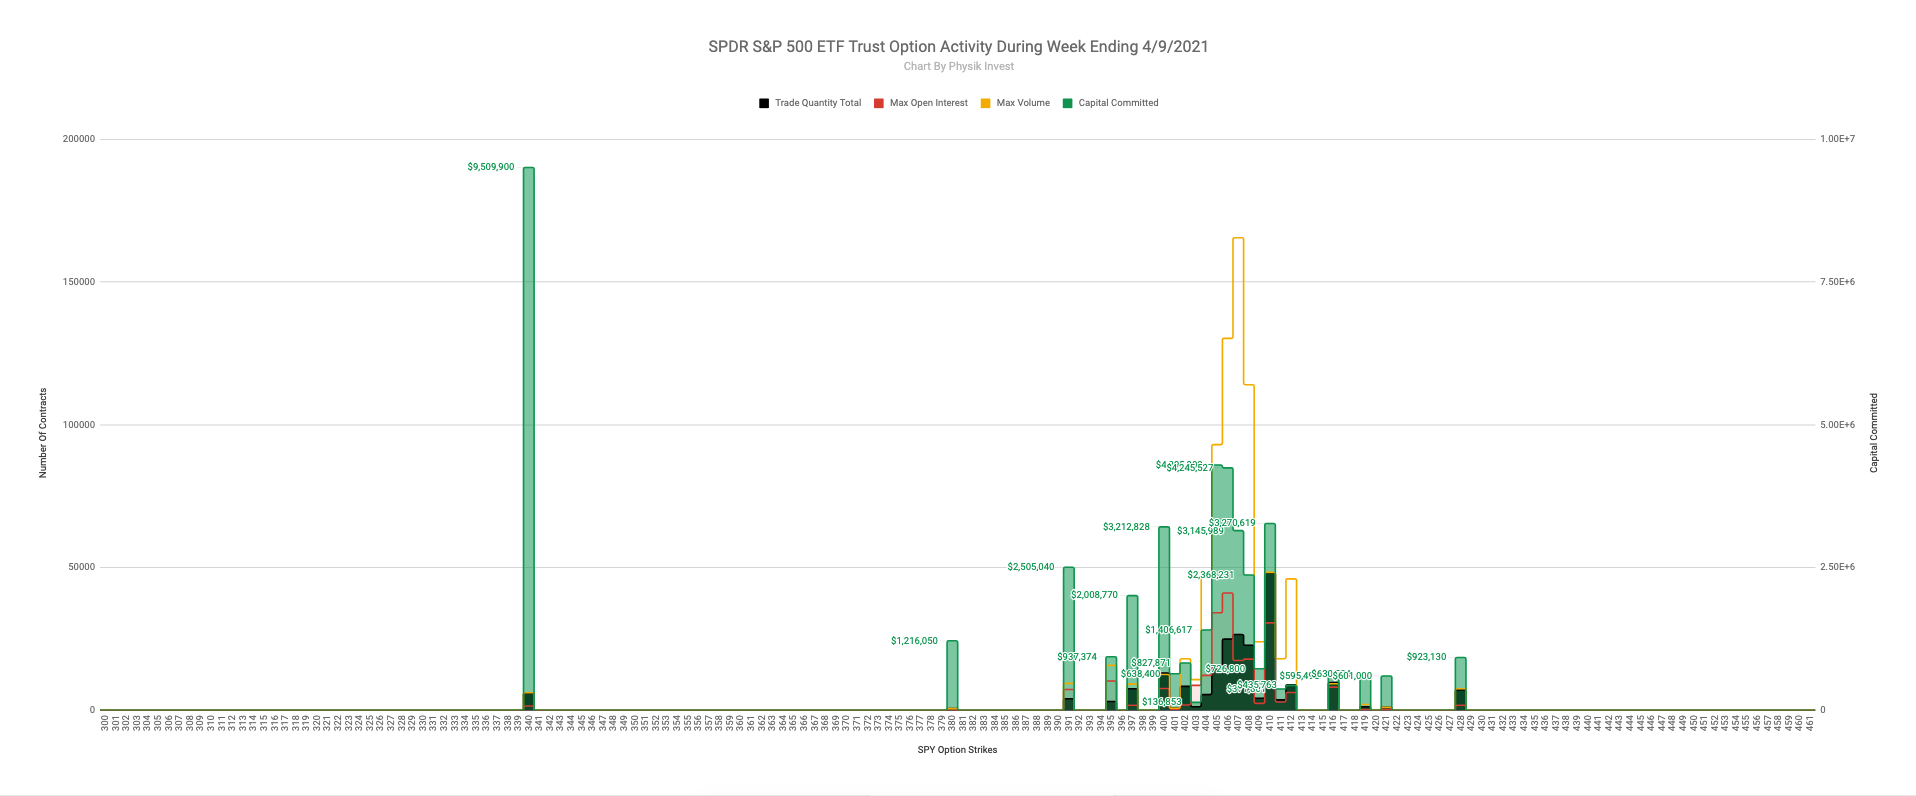
Graphic 1: 4-hour profile chart of the Micro E-mini S&P 500 Futures.Graphic 2: Physik Invest maps out the purchase of call and put options in the SPDR S&P 500 ETF Trust (NYSE: SPY), for the week ending April 9, 2021. Activity in the options market was primarily concentrated in short- and long-dated tenors, in put strikes as low as $340, which corresponds with $3,400 in the cash-settled S&P 500 Index (INDEX: SPX).
More index puts are being shorted then bought. The other times similar levels materialized was after large mkt declines – so puts were more expensive w/more volatility premium. Here though, traders have decided to step up and short puts with markets at record highs. pic.twitter.com/P8WdReVmdO
1/x Here we are @ 4/12. The rally to ATH has transpired as predicted & the VIX has tumbled to 13 month lows. The🪟of weakness has opened & this is where things start to get weird…it’s NEVER straightforward, & imagining how this market will manage to tumble through the🪟begins https://t.co/8U3awYjXXTpic.twitter.com/VFzC9KdRuX
Renato founded Physik Invest after going through years of self-education, strategy development, and trial-and-error. His work reporting in the finance and technology space, interviewing leaders such as John Chambers, founder, and CEO, JC2 Ventures, Kevin O’Leary, Canadian businessman and Shark Tank host, Catherine Wood, CEO and CIO, ARK Invest, among others, afforded him the perspective and know-how very few come by.
Having worked in engineering and majored in economics, Renato is very detailed and analytical. His approach to the markets isn’t built on hope or guessing. Instead, he leverages the unique dynamics of time and volatility to efficiently act on opportunity.
Disclaimer
At this time, Physik Invest does not manage outside capital and is not licensed. In no way should the materials herein be construed as advice. Derivatives carry a substantial risk of loss. All content is for informational purposes only.
Welcome to Market Intelligence, Physik Invest’s response to the many newsletters that seldom provide actionable market insights, free.
Through this newsletter you will get a glimpse into the following:
The implications of credit and positioning.
Impactful events in finance and technology.
Technical commentary for index products.
Media on emerging trends and hot topics.
Again, thanks for joining! Physik Invest looks forward to providing you an objective view into the who, what, when, where, why, and how in finance and technology.
What Happened: U.S. stock index futures closed higher, last week.
What Does It Mean: The S&P 500 closed above $4,100 for the first time as investors looked to price in an economic “‘Goldilocks moment’—fast, sustained growth alongside inflation and interest rates that drift slowly upward.”
According to a letter by JPMorgan Chase & Co’s (NYSE: JPM) Jamie Dimon, strong consumer savings, an increased pace in COVID-19 coronavirus vaccinations, and unprecedented efforts to spur economic activity could mean that a boom lasts as long as 2023.
This perspective differs from Dimon’s comments a year ago; he warned of a recession in which GDP could fall nearly 35%. Is Dimon one to fade? Likely not, given the fact that (1) he heads one of the biggest banks and (2) most forecasts by other institutions support Dimon’s perspectives.
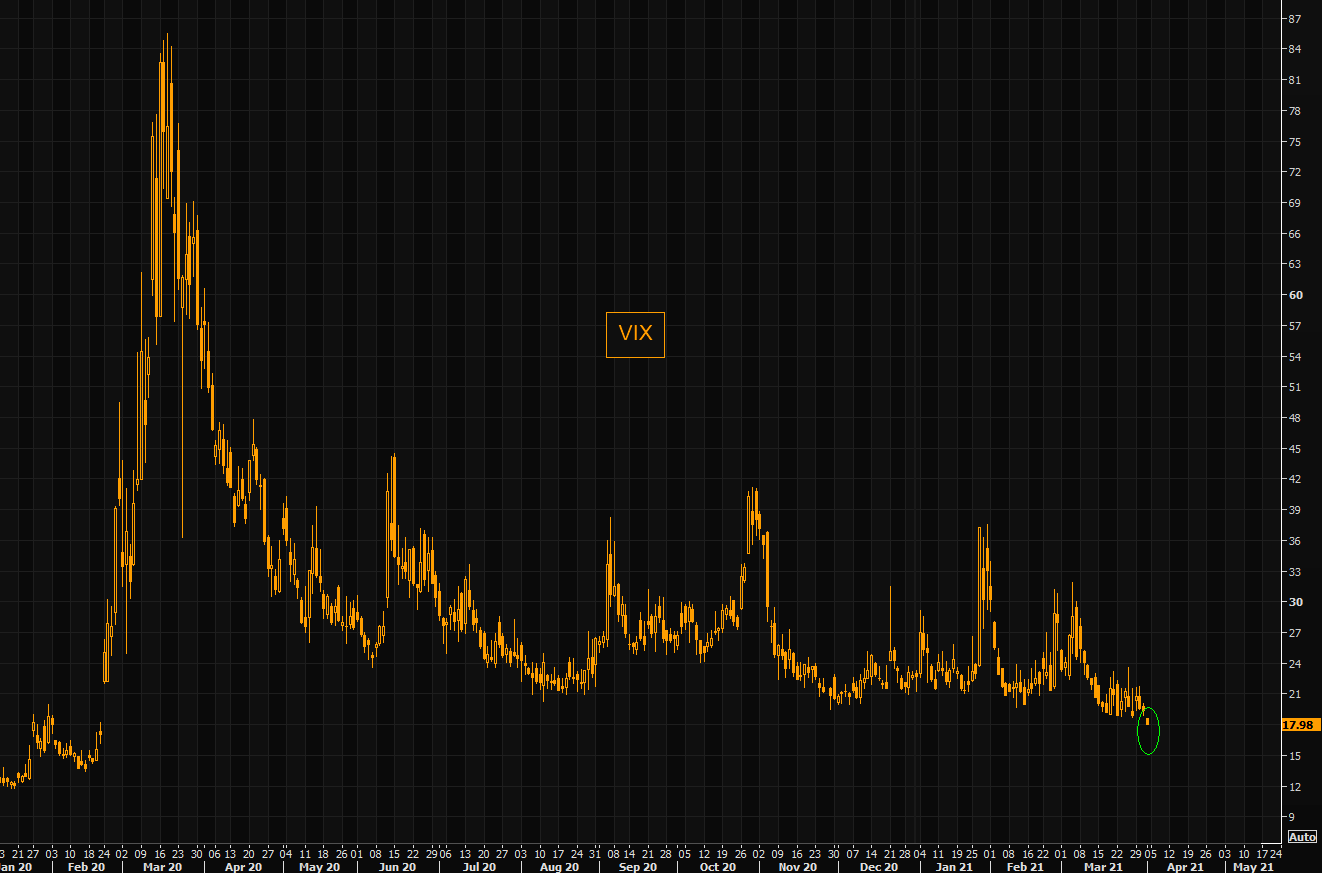
Further, the CBOE Volatility Index (INDEX: VIX), a measure of the stock market’s expectation of volatility based on S&P 500 (INDEX: SPX) options, traded to its lowest level since February 2020.
At the same time, participants saw blocks of VIX call spreads — bets that serenity won’t last — hit the tape; the unknown participant(s) bought nearly 200,000 contracts.
Graphic 1: Risk graph of the 25/40 VIX call spread in question via MarketEar.
“With VIX being priced in the low 17 area, I would imagine we would see more of these larger-sized bets going forward,” Kris Sidial, co-chief investment officer at Ambrus Group, told Bloomberg. “I think smart money understands that, although volatility has contracted a lot in these last two months, we are still seeing signs of excess market fragility appear from many different angles.”
Graphic 2: Volatility declines to its lowest level since February 2020.
As stated last week, the market is in a historically bullish period, ahead of the upcoming corporate earnings season, with structural flows supporting the ongoing narrative into the coming April monthly options expiration (OPEX).
Option Expiration (OPEX) Significance: Option expiries mark an end to pinning (i.e, the theory that market makers and institutions short options move stocks to the point where the greatest dollar value of contracts will expire worthless) and the reduction dealer gamma exposure.
As realized volatility falls from its peak around a year ago, more sold SPX options cluster at strikes nearer to spot. And as implied volatility falls with it, the gamma of those options increases.
More dealer long gamma means more liquidity. More liquidity means less movement. pic.twitter.com/712OAMq7iP
Adding, most funds are committed to holding long positions. In the interest of lower volatility returns, these funds will collar off their positions, selling calls to finance the purchase of downside put protection.
As a result of this activity, options dealers are long upside and short downside protection.
This exposure must be hedged; dealers will sell into strength as their call (put) positions gain (lose) value and buy into weakness as their call (put) positions lose (gain) value.
Now, unlike theory suggests, dealers will hedge call losses (gains) quicker (slower). This leads to “long-gamma,” a dynamic that crushes volatility and promotes momentum, observed by lengthy sprints — like the one the market is currently in — followed by rapid de-risking events as the market transitions into “short-gamma.”
What To Expect: Balance-to-higher.
Important to note is that equity market inflows, over the past 5 months, exceeded inflows of the prior 12 years, total. Think about the supply and demand dynamics of the market; in case of an equity market sell-off, a lot of late buyers will have poor location which may leave a thick area of supply above the market, putting a dampener on future rallies.
“You should definitely be worried about valuations and all the more so when people start justifying extremely high valuations. We are risk-on, but we haven’t put our foot down on the accelerator because of valuations in some parts of the market,” said Fahad Kamal, chief investment officer at Kleinwort Hambros.
Adding to the narrative, metrics, like DIX, confirm increased buying pressure while divergences in options activity suggest opportunistic hedging, especially with puts trading at their cheapest level, relative to calls the same delta.
Graphic 3: 1-month 25 delta risk-reversal, via SpotGamma, suggests puts are trading cheap.
More On DIX: For every buyer is a seller (usually a market maker). Using DIX — which is derived from short sales (i.e., liquidity provision on the market-making side) — we can measure buying pressure.
Graphic 4: Physik Invest maps out the purchase of call and put options in the SPDR S&P 500 ETF Trust (NYSE: SPY), for the week ending April 9, 2021. Activity in the options market was primarily concentrated in short- and long-dated tenors, in put strikes as low as $340, which corresponds with $3,400 in the cash-settled S&P 500 Index (INDEX: SPX).
What To Do: In the coming sessions, participants will want to pay attention to where the S&P 500 trades in relation to Friday’s end-of-day spike higher.
More On Spikes: Spike’s mark the beginning of a break from value. Spikes higher (lower) are validated by trade at or above (below) the spike base (i.e., the origin of the spike).
In the best case, the S&P 500 remains above the $4,104.00 spike base. Doing so means that the participants are validating the prices caused by the late-day knee-jerk rally.
In the case of higher prices, given that the 161.80% and 127.20% Fibonacci price extensions were achieved, and after-market trade established an overnight high at $4,121.50, participants can target prices as high as the $4,197.25 price extension.
More On Overnight Rally Highs (Lows): Typically, there is a low historical probability associated with overnight rally-highs (lows) ending the upside (downside) discovery process.
Any activity below the $4,104.00 spike base puts the rally on hold and calls for balance or an attempt to digest higher prices.
Balance (Two-Timeframe Or Bracket): Rotational trade that denotes current prices offer favorable entry and exit. Balance-areas make it easy to spot a change in the market (i.e., the transition from two-time frame trade, or balance, to one-time frame trade, or trend).
In the case of lower prices, participants can look to whether a test of the $4,069.00 high-volume area (HVNode) solicits a response. If not, initiative trade could take prices as low as $3,943.00, the next most valuable price area in the chain.
More On Volume Areas: A structurally sound market will build on past areas of high-volume (HVNode). Should the market trend for long periods of time, it will lack sound structure (identified as a low-volume area (LVNode) which denotes directional conviction and ought to offer support on any test).

If participants were to auction and find acceptance into areas of prior low-volume, then future discovery ought to be volatile and quick as participants look to areas of high volume for favorable entry or exit.
Graphic 5: 4-hour profile chart of the Micro E-mini S&P 500 Futures.
In the late 1800’s and early 1900’s – as telephone, electricity, and the automobile were emerging – the US equity market cap relative to GDP appears to have been 2-3 times higher than it is today. We need to verify this difficult-to-get data but, if true, I have a hypothesis. https://t.co/7V4dNo3vBL
Renato founded Physik Invest after going through years of self-education, strategy development, and trial-and-error. His work reporting in the finance and technology space, interviewing leaders such as John Chambers, founder, and CEO, JC2 Ventures, Kevin O’Leary, Canadian businessman and Shark Tank host, Catherine Wood, CEO and CIO, ARK Invest, among others, afforded him the perspective and know-how very few come by.
Having worked in engineering and majored in economics, Renato is very detailed and analytical. His approach to the markets isn’t built on hope or guessing. Instead, he leverages the unique dynamics of time and volatility to efficiently act on opportunity.
Disclaimer
At this time, Physik Invest does not manage outside capital and is not licensed. In no way should the materials herein be construed as advice. Derivatives carry a substantial risk of loss. All content is for informational purposes only.
What Happened: U.S. stock index futures closed higher, last week.
What Does It Mean: The S&P 500 closed above $4,000.00 for the first time.
This comes as investors shifted their focus from the risks of rapidly rising inflation to the increasing pace of COVID-19 coronavirus vaccinations and a rebound in economic activity.
At the time, the CBOE Volatility Index (INDEX: VIX), a measure of the stock market’s expectation of volatility based on S&P 500 (INDEX: SPX) options, hit the lowest level since February of 2020. This was likely the result of an oversupply in volatility due to contract rolling, signaling a shift in the demand for volatility and options-based hedging.
Graphic 1: Volatility declines ahead of the extended holiday weekend.
Adding, the market is entering into a historically bullish period, ahead of the upcoming corporate earnings season, with structural flows supporting the ongoing narrative, also, at least until mid-April. The reason being, most funds are committed to holding long positions. In the interest of lower volatility returns, these funds will collar off their positions, selling calls to finance the purchase of downside put protection.
Graphic 2: April, historically speaking, is usually a good month for equity investors.
As a result of this activity, options dealers are long upside and short downside protection.
This exposure must be hedged; dealers will sell into strength as their call (put) positions gain (lose) value and buy into weakness as their call (put) positions lose (gain) value.
Now, unlike theory suggests, dealers will hedge call losses (gains) quicker (slower). This leads to “long-gamma,” a dynamic that crushes volatility and promotes momentum, observed by lengthy sprints — like the one the market is currently in — followed by rapid de-risking events as the market transitions into “short-gamma.”
What To Expect: Balance-to-higher into mid-April.
Why? One last hurrah before the reopening accelerates and flows turn.
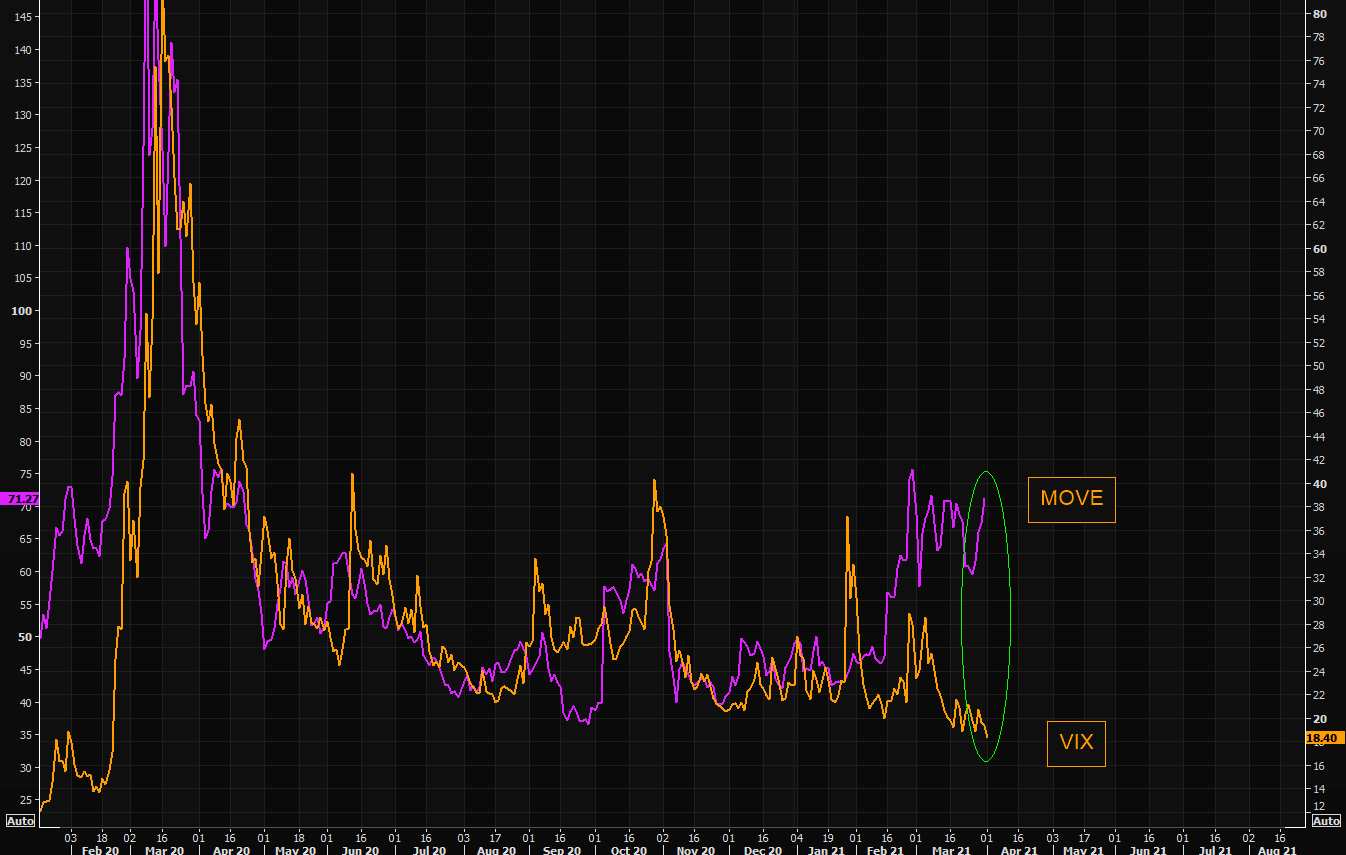
When flows turn, it is likely that equity and bond market volatility converge; the ongoing divergence comes alongside an attempt, by market participants, to price in rising debt levels and inflation. As consumers shift their preferences from saving and investing to spending, this divergence ought to disappear.
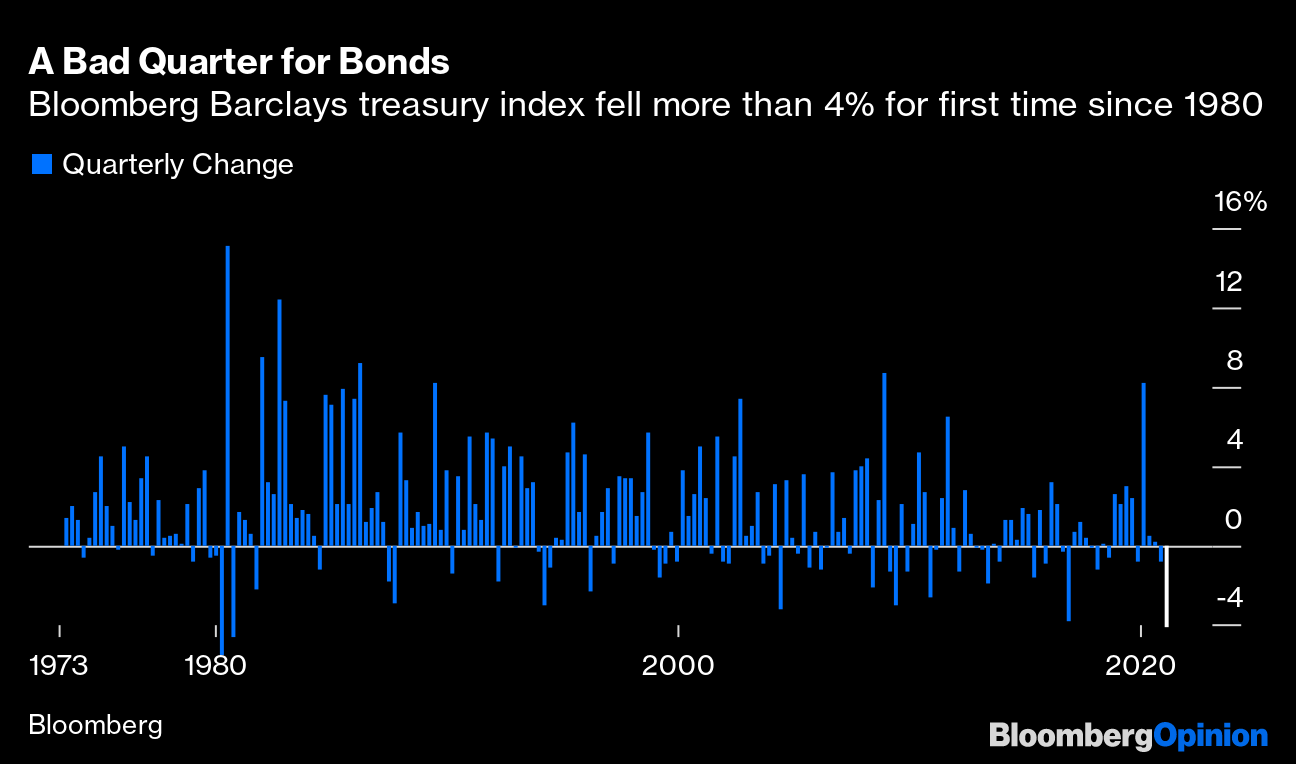
Graphic 3: Q1 2021 the worst quarter for bonds in decades, via Bloomberg. Graphic 4: Divergence in volatility across the bond and equity market.
Adding, metrics, like DIX, confirm increased buying pressure while divergences in options activity and volume delta suggest opportunistic selling.
More On DIX: For every buyer is a seller (usually a market maker). Using DIX — which is derived from short sales (i.e., liquidity provision on the market-making side) — we can measure buying pressure.Volume Delta: Buying and selling power as calculated by the difference in volume traded at the bid and offer.
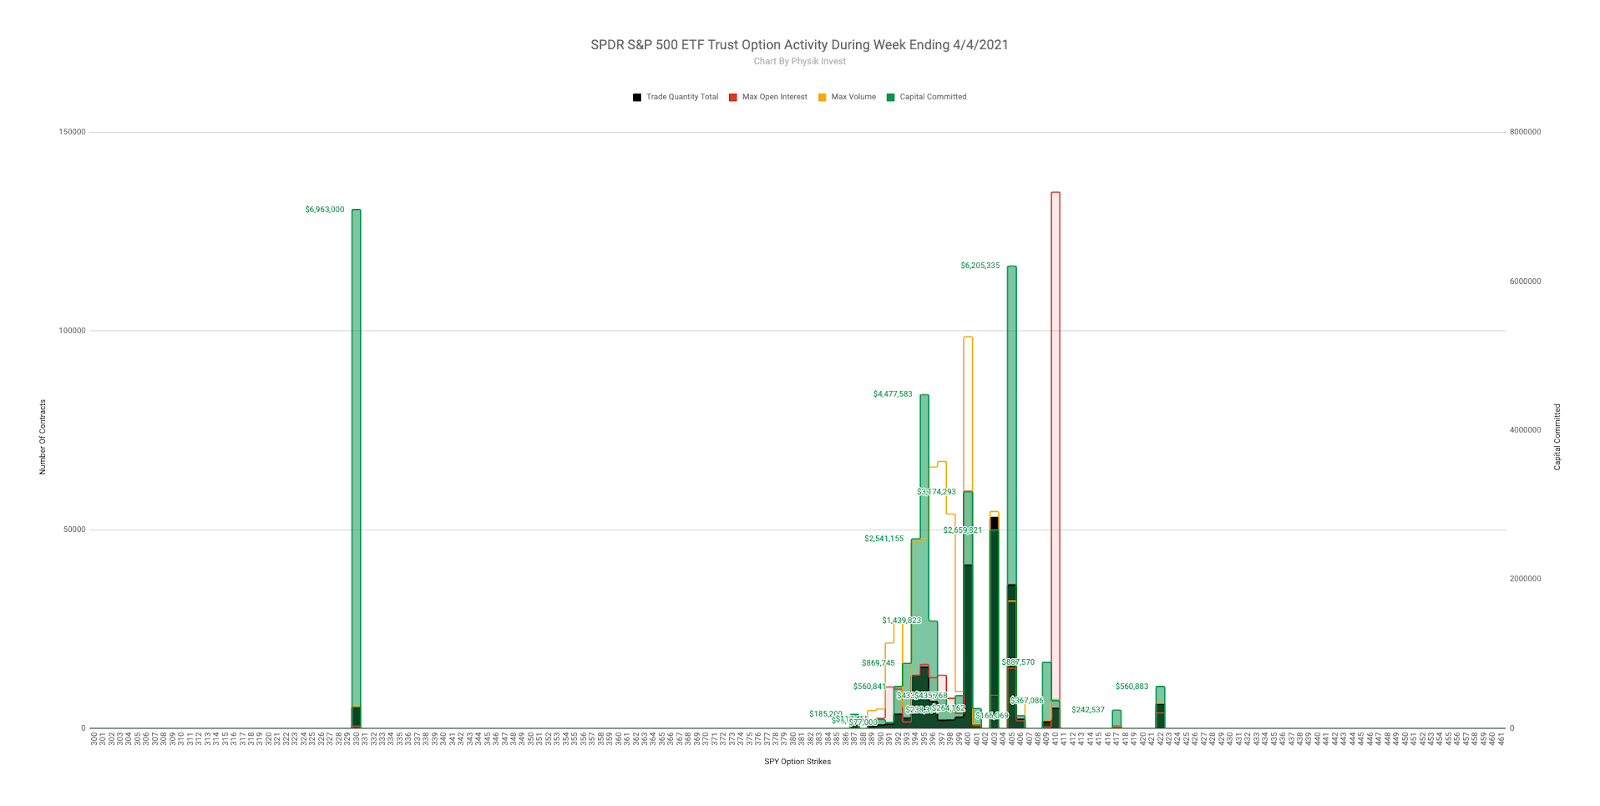
Graphic 5: Physik Invest maps out the purchase of call and put options in the SPDR S&P 500 ETF Trust (NYSE: SPY), for the week ending April 4, 2021. Activity in the options market was primarily concentrated in short- and long-dated tenors, in strikes as low as $330, which corresponds with $3,300 in the cash-settled S&P 500 Index (INDEX: SPX).
What To Do: In the coming sessions, participants will want to pay attention to where the S&P 500 trades in relation to Thursday’s end-of-day spike higher.
More On Spikes: Spike’s mark the beginning of a break from value. Spikes higher (lower) are validated by trade at or above (below) the spike base (i.e., the origin of the spike).
In the best case, the S&P 500 remains above the $4,004.25 spike base. Doing so means that the participants are finding higher prices, above the VWAP anchored from the March 17 rally-high, valuable (i.e., buyers, on average, are in control and winning since the March 17 rally-high).
More On Volume-Weighted Average Prices (VWAPs): A metric highly regarded by chief investment officers, among other participants, for quality of trade. Additionally, liquidity algorithms are benchmarked and programmed to buy and sell around VWAPs.
In the case of higher prices, given that the $4,015.25 price extension was achieved in after-market trade that established an overnight high at $4,038.25, participants can target the $4,062.00 extension.
More On Overnight Rally Highs (Lows): Typically, there is a low historical probability associated with overnight rally-highs (lows) ending the upside (downside) discovery process.
Any activity below the $4,004.25 spike base puts the rally on hold and calls for balance or digestion of higher prices.
Balance (Two-Timeframe Or Bracket): Rotational trade that denotes current prices offer favorable entry and exit. Balance-areas make it easy to spot a change in the market (i.e., the transition from two-time frame trade, or balance, to one-time frame trade, or trend).
In the case of lower prices, participants can look to whether a test of the $3,943.00 and $3,908.25 high-volume areas (HVNodes) solicit a response.
More On Volume Areas: A structurally sound market will build on past areas of high-volume (HVNode). Should the market trend for long periods of time, it will lack sound structure (identified as a low-volume area (LVNode) which denotes directional conviction and ought to offer support on any test).

If participants were to auction and find acceptance into areas of prior low-volume, then future discovery ought to be volatile and quick as participants look to areas of high volume for favorable entry or exit.
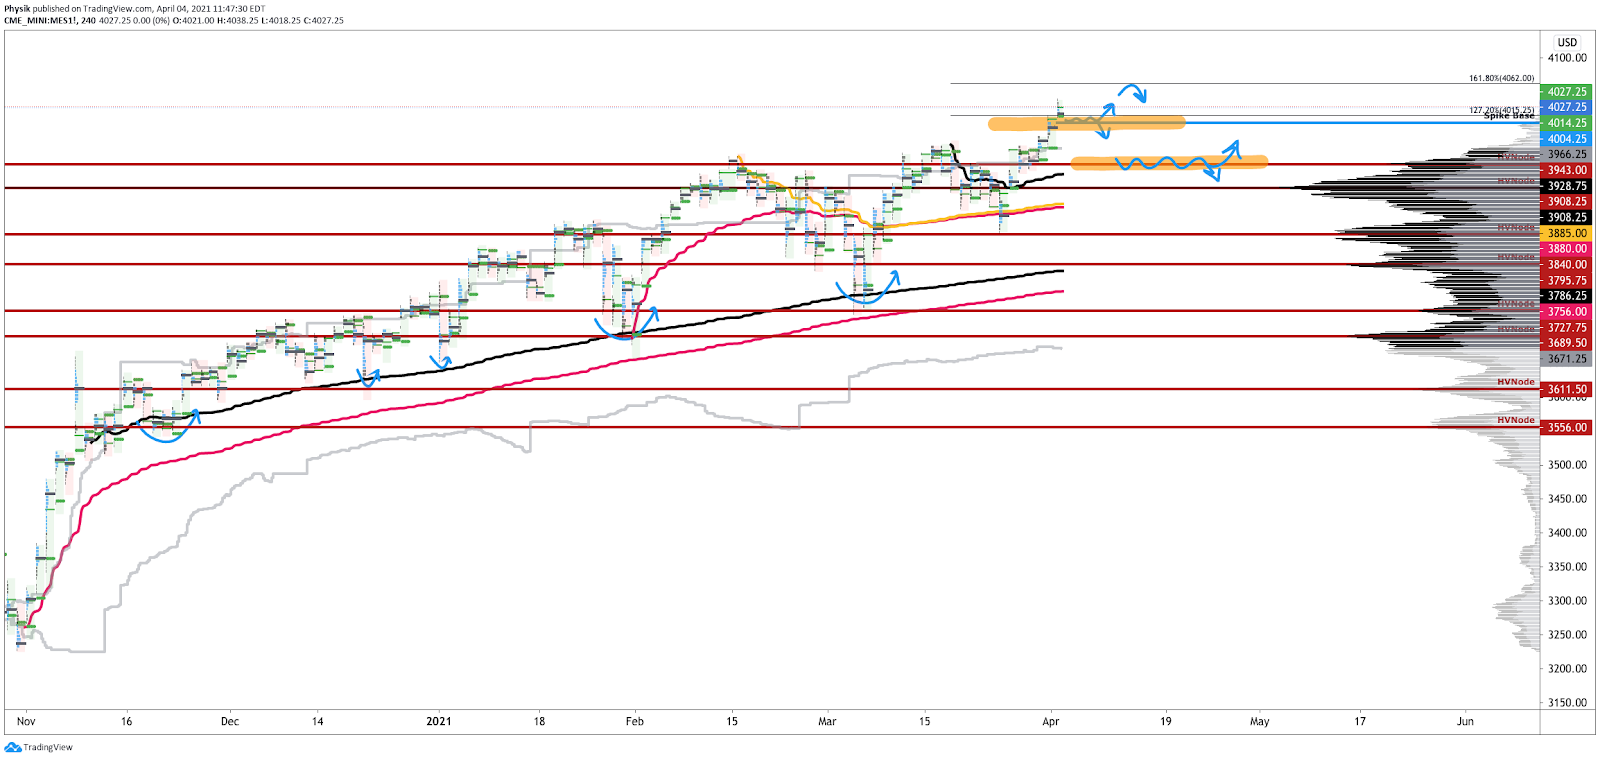
Graphic 6: 4-hour profile chart of the Micro E-mini S&P 500 Futures.
Conclusions: The go/no-go level for next week’s trade is $4,004.25.
Any activity above this level confirms the bullishness of last Thursday’s end-of-day spike.
What Happened: U.S. stock index futures closed higher, last week.
This came alongside (1) the enactment of a massive, $1.9 trillion coronavirus relief plan, (2) convergence in the 10-year Treasury rate and S&P 500 dividend yield, as well as (3) a material divergence in bond and equity market volatility.
What Does It Mean: The pandemic disrupted the global economy, hitting the hardest airlines, leisure facilities, energy, manufacturing, and restaurants, among other industries.
The stock market tumbled, as a result, and the subsequent recovery was lead by technology, which delivered its strongest annual average return since the Global Financial Crisis (GFC).
Now, as virus case counts fall, the pace of vaccinations accelerates, and massive coronavirus relief bills are passed, shares of stocks in beaten-down industries are becoming favorites.
This reopening trade, as it’s called, comes alongside projections the U.S. will lead the 2021 global economic recovery.
Amidst the bullishness, the yield on a 10-year Treasury, a risk-free asset, which was — per Axios — “artificially depressed by the flight-to-quality trade during the coronavirus pandemic, as well as by large-scale purchases by the Federal Reserve,” converged with S&P 500’s dividend yield.
Graphic 1: Goldman Sachs Group Inc (NYSE: GS) projects yields to rise and the curve to steepen.
Typically, the S&P 500’s dividend yield is less than the risk-free rate because investors expect to earn less in dividends than they would holding the same amount in bonds, absent rising stock prices.
Values are derived using the discounted cash flow calculation; as interest and discount rates go up, the present value of future earnings goes down, which will drag stock prices, especially in growth categories, as evidenced by the Nasdaq-100’s relative weakness.
Graphic 2: Nordea Group expects inflation to print above the Federal Reserve’s target, soon.
Still, historically speaking, rising yields aren’t that harmful. Looking as far back as the 1960s, there are 13 periods in which the yield on a 10-year Treasury rose by at least 1.5%.
“In nearly 80% (10 of 13) of the prior periods, the S&P 500 Index posted gains as rates rose, as it has so far in the current rising-rate period,” a statement by LPL Financial said. “In fact, the average yearly gain for the index during the previous rising-rate periods, at 6.4%, is just a little lower than the historical average over the entire period of 7.1%, while rising rates have been particularly bullish for stocks since the mid-1990s.”
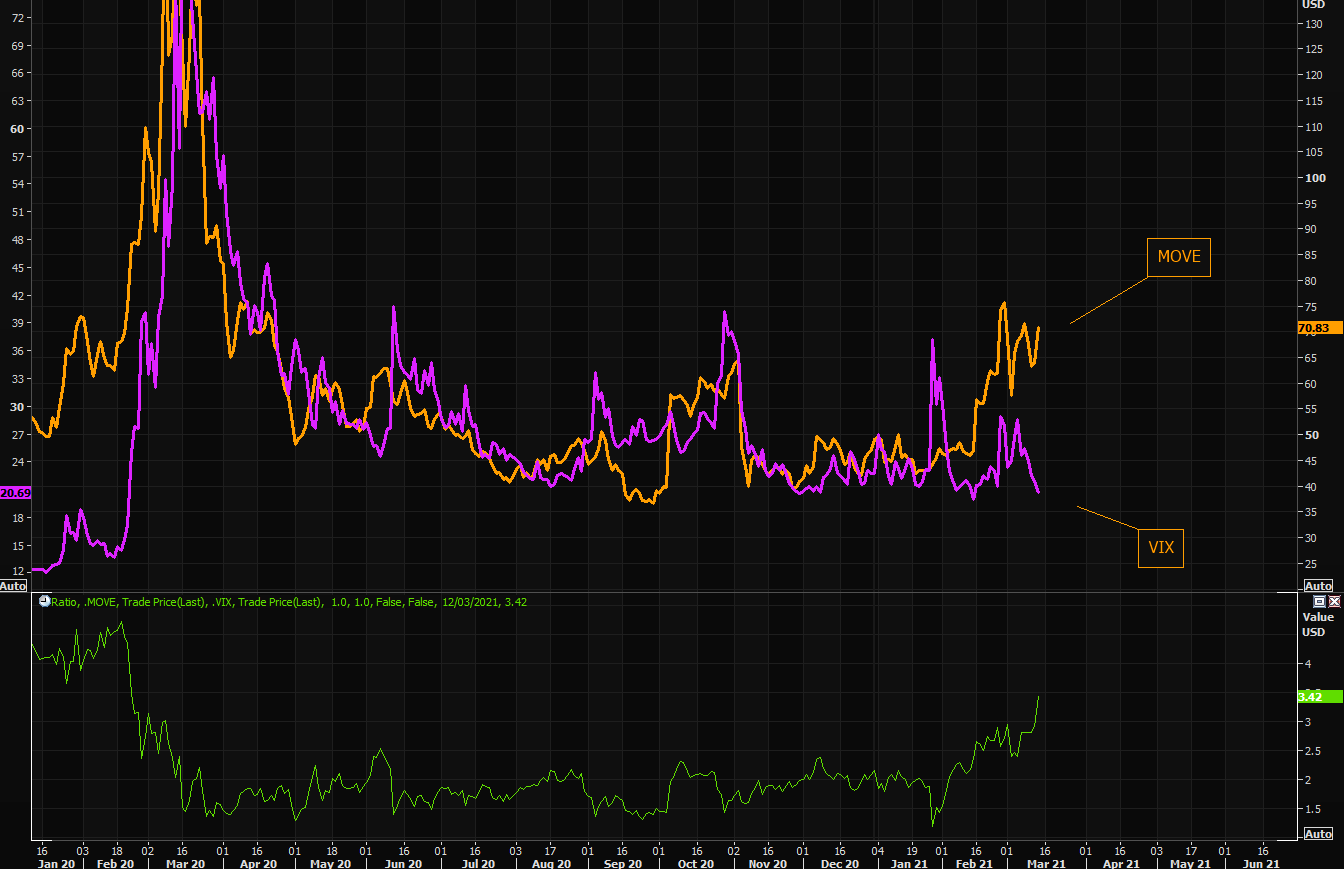
Further, despite an attempted pricing in of rising debt levels and inflation, a divergence in bond and equity market volatility persists.
Historically, fear across markets tends to move in tandem. That’s not the case today.
Graphic 3: Divergence in volatility across the bond and equity market.
What To Expect: Balance, or two-sided trade as participants look for more information to base their next move on after last week’s rapid recovery.
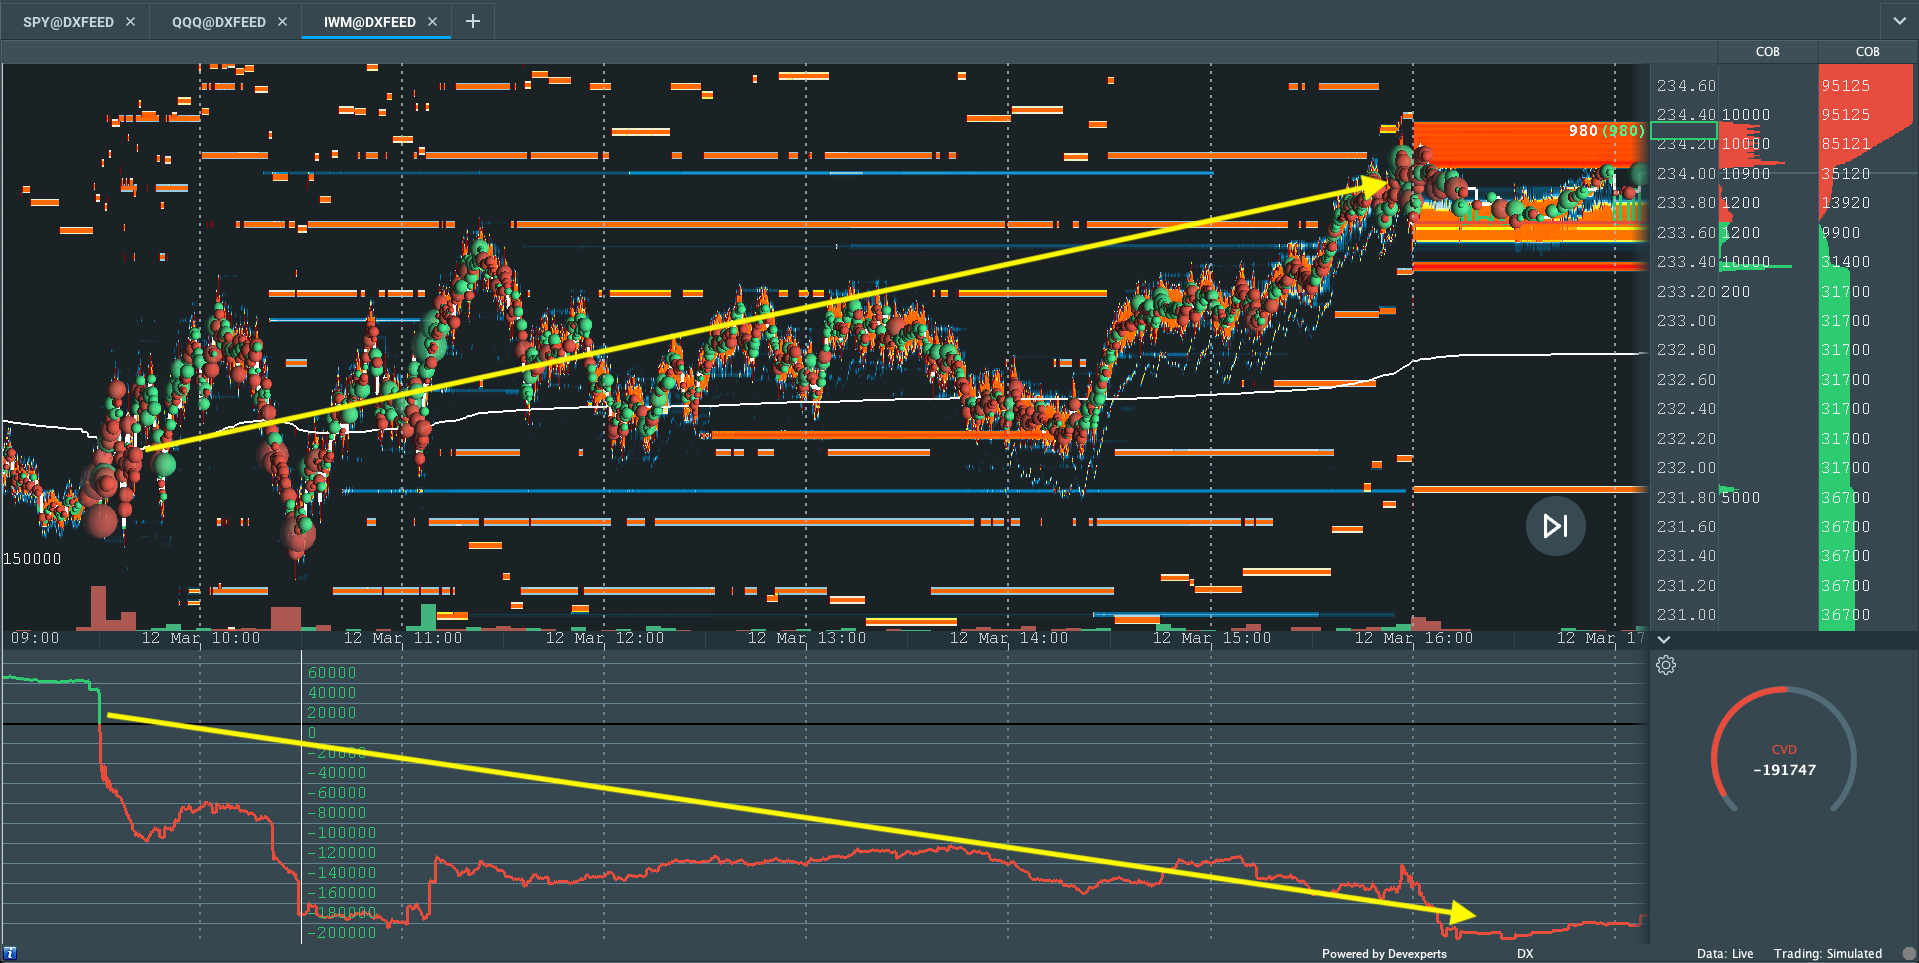
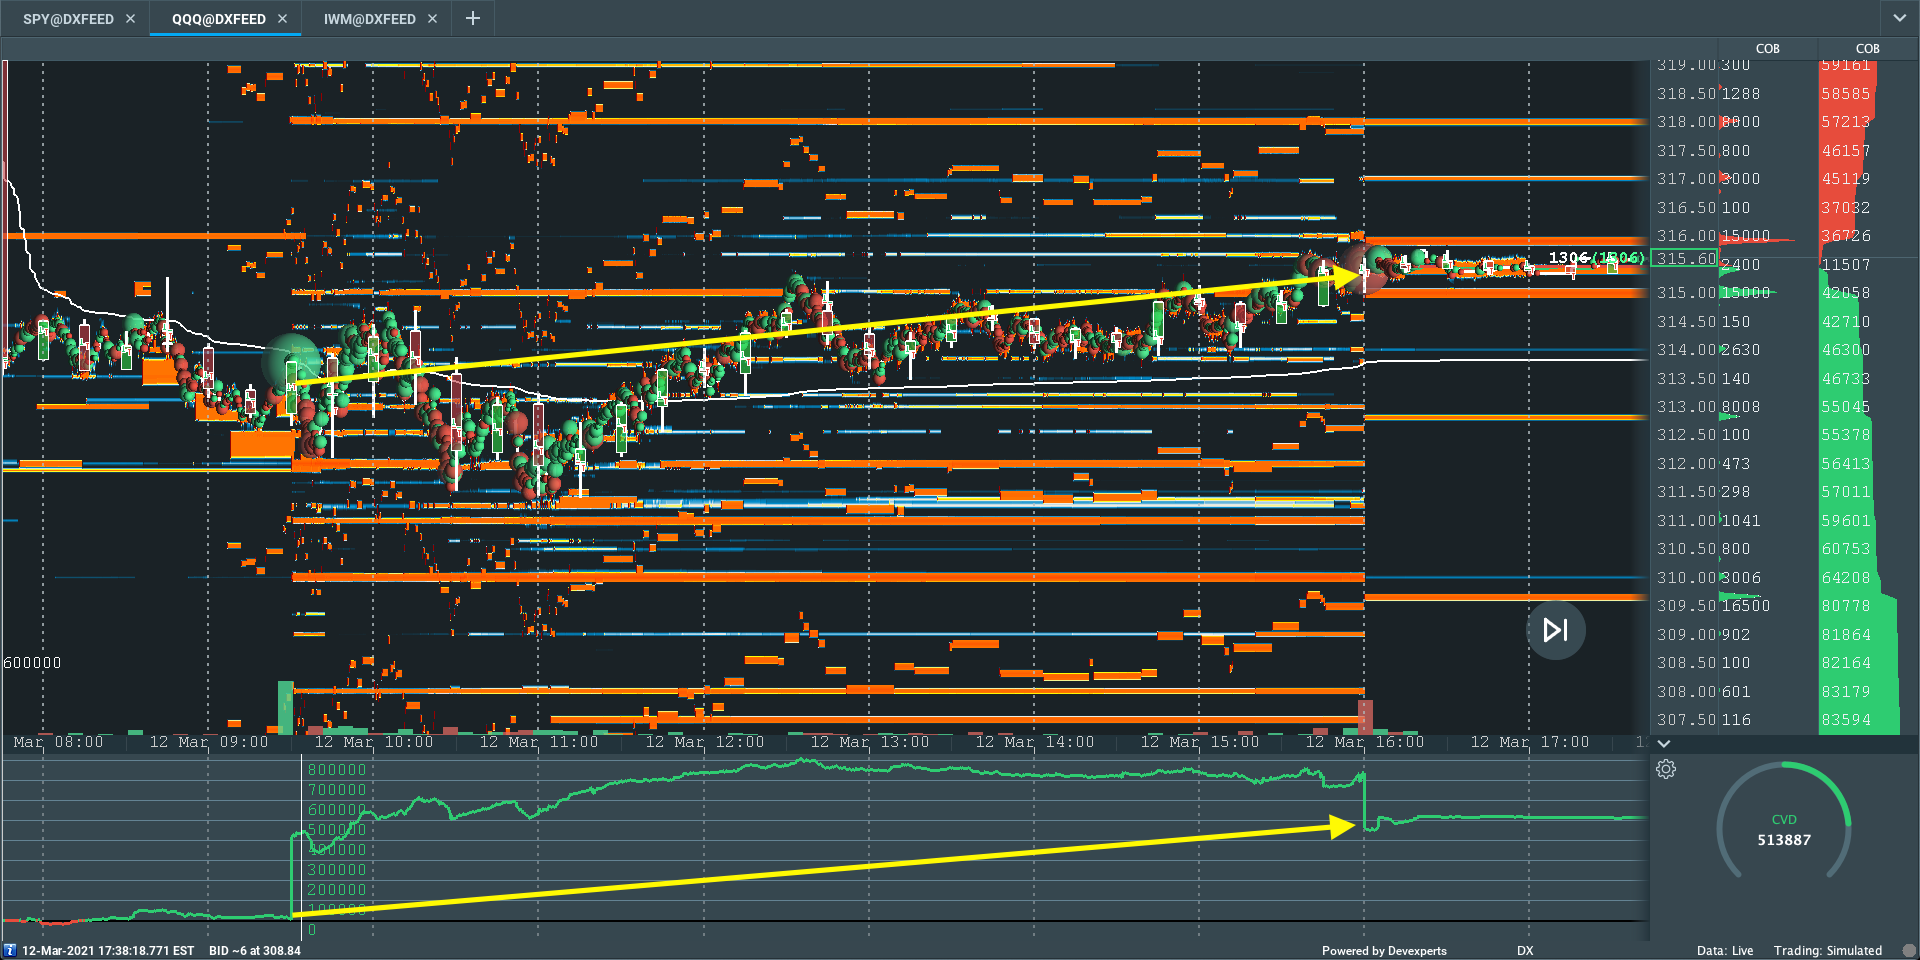
Coming into the weekend, market liquidity suggested (1) buying pressure was leveling out and/or (2) buyers were absorbing resting liquidity (opportunistic selling or selling into strength), while speculative options activity was concentrated on the put-side.
Graphic 4: Physik Invest maps out the purchase of call and put options in the SPDR S&P 500 ETF Trust (NYSE: SPY), for the week ending March 12, 2021. Activity in the options market was primarily concentrated in short- and long-dated tenors, in strikes as low as $353, which corresponds with $3,530.00 in the cash-settled S&P 500 Index (INDEX: SPX).
IWM Market Liquidity
QQQ Market Liquidity
SPY Market Liquidity
What To Do:In the coming sessions, participants will want to pay attention to the VWAP anchored from the $3,959.25 overnight rally-high, as well as the $3,840.00 high-volume area (HVNode).
Volume-Weighted Average Prices (VWAPs): Metrics highly regarded by chief investment officers, among other participants, for quality of trade. Additionally, liquidity algorithms are benchmarked and programmed to buy and sell around VWAPs.More On Volume Areas: A structurally sound market will build on past areas of high-volume (HVNode). Should the market trend for long periods of time, it will lack sound structure (identified as a low-volume area (LVNode) which denotes directional conviction and ought to offer support on any test).
If participants were to auction and find acceptance into areas of prior low-volume, then future discovery ought to be volatile and quick as participants look to areas of high-volume for favorable entry or exit.More On Overnight Rally Highs (Lows): Typically, there is a low historical probability associated with overnight rally-highs (lows) ending the upside (downside) discovery process.
In the best case, the S&P 500 remains above the $3,840.00 volume area, and VWAP anchored from the $3,959.25 peak. This would suggest buyers, on average, are in control and winning since the February 15 rally-high.
Any activity below the VWAP anchored from the $3,959.25 peak may (1) leave the $3,840.00 HVNode as an area of supply, offering initiative sellers favorable entry and responsive buyers favorable exit.
Graphic 5: Profile overlays on a 30-minute candlestick chart of the Micro E-mini S&P 500 Futures.Graphic 6: 4-hour profile chart of the Micro E-mini S&P 500 Futures.
Conclusions: The go/no-go level for next week’s trade is $3,840.00.
Any activity at this level suggests market participants are looking for more information to base their next move. Anything above (below) this level increases the potential for higher (lower).
What Happened: U.S. stock index futures auctioned lower last week.
What Does It Mean: Market participants witnessed a rapid de-risking event, as a result of individual stock volatility, and a subsequent v-pattern recovery, that was later taken back as Friday’s large February monthly options expiration (OPEX) neared.
More On The V-Pattern: A pattern that forms after a market establishes a high, retests some support, and then breaks above said high. In most cases, this pattern portends continuation.
At the same time, bond and equity market volatility diverged, materially.
In other words, a rapid move up in rates — as investors become increasingly concerned over the value of their bonds due to rising debt levels and inflation — has yet to be priced in as an equity market risk.
Graphic 1: The Market Ear unpacks divergence in volatility across different markets.
Adding, the risk of inflation comes alongside a potential for slowing in economic growth, which may have knock-on effects, such as savers protecting their capital by investing in non-productive assets, thus helping form speculative asset bubbles.
Risk Of Monetary Support: The increased moneyness of financial markets; investors look to exchange-traded products (e.g., S&P 500) as savings vehicles, thereby forcing participants, like the Federal Reserve, to backstop market liquidity, and promote market and economic stability in times of turmoil.
A great paper on the impact of central bank intervention, passive index investing, and asymmetric liquidity provisioning.
Still, as Bloomberg suggests, reasons to not panic include an overreaction by market participants, premature Fed tightening, and a risk asset rout (i.e., rising rates may eventually increase demand for safety assets).
“Typically it’s a good environment for risk assets. Neither the pace nor the extent of the move so far has been unusual relative to other historical moves coming out of a recession,” said Pimco’s Erin Browne. “It would take a significant move in real yields in order to disrupt risk markets broadly.”
Graphic 2: Benchmark 10-year real rate in solidly negative territory.
Moving on, given OPEX, participants have a clue as to why the market failed to resolve directionally over the past week: option expiries mark an end to pinning (i.e, the theory that market makers and institutions short options move stocks to the point where the greatest dollar value of contracts will expire worthless) and the reduction dealer gamma exposure.
Aside from OPEX, we must talk more about the v-pattern recovery and a prior week’s spike exit from balance, as well as low broad market volatility.
In light of the v-pattern, balance, and spike, the S&P 500’s long-term uptrend remains intact. In support of this uptrend, systematic and hedge fund participants are increasing their long-exposure, given the economic recovery, and a drop in volatility.
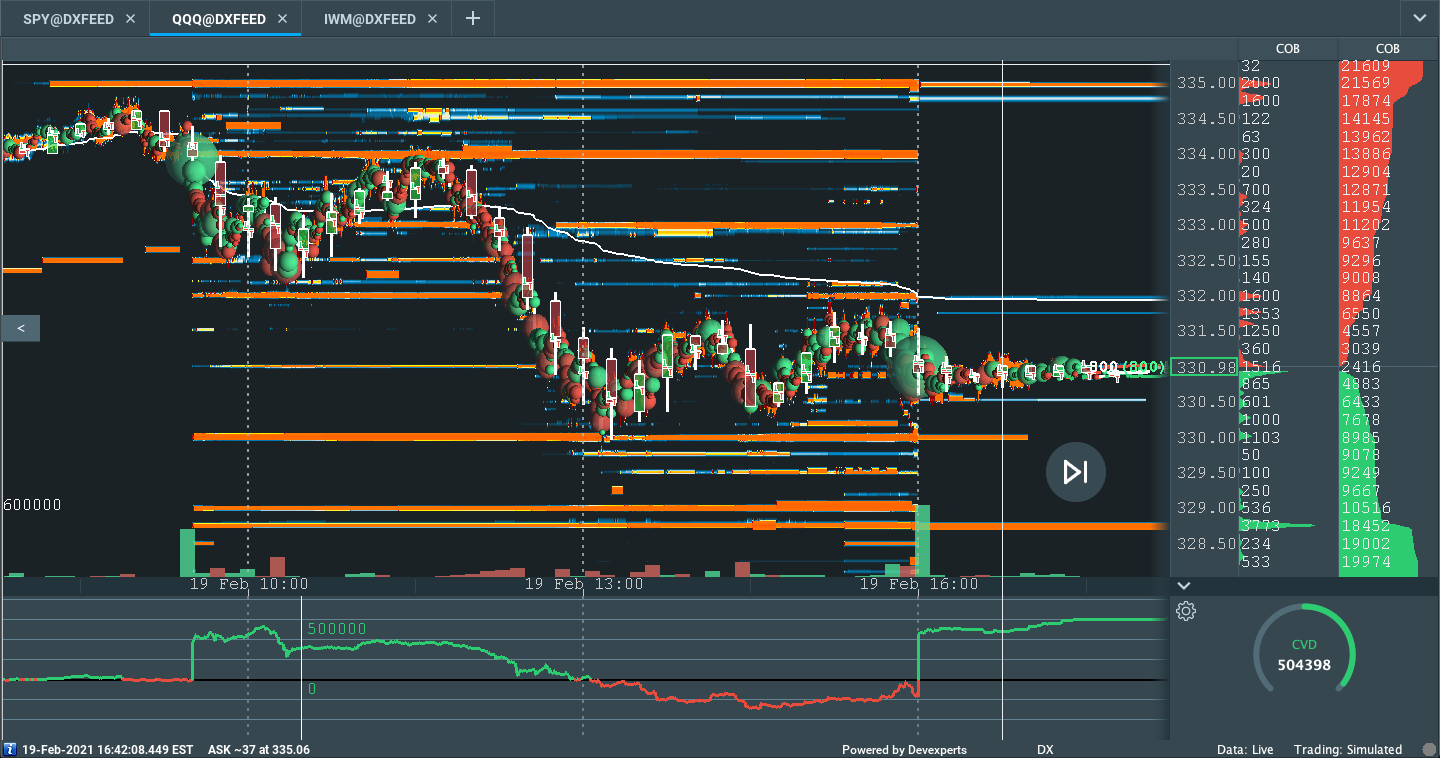
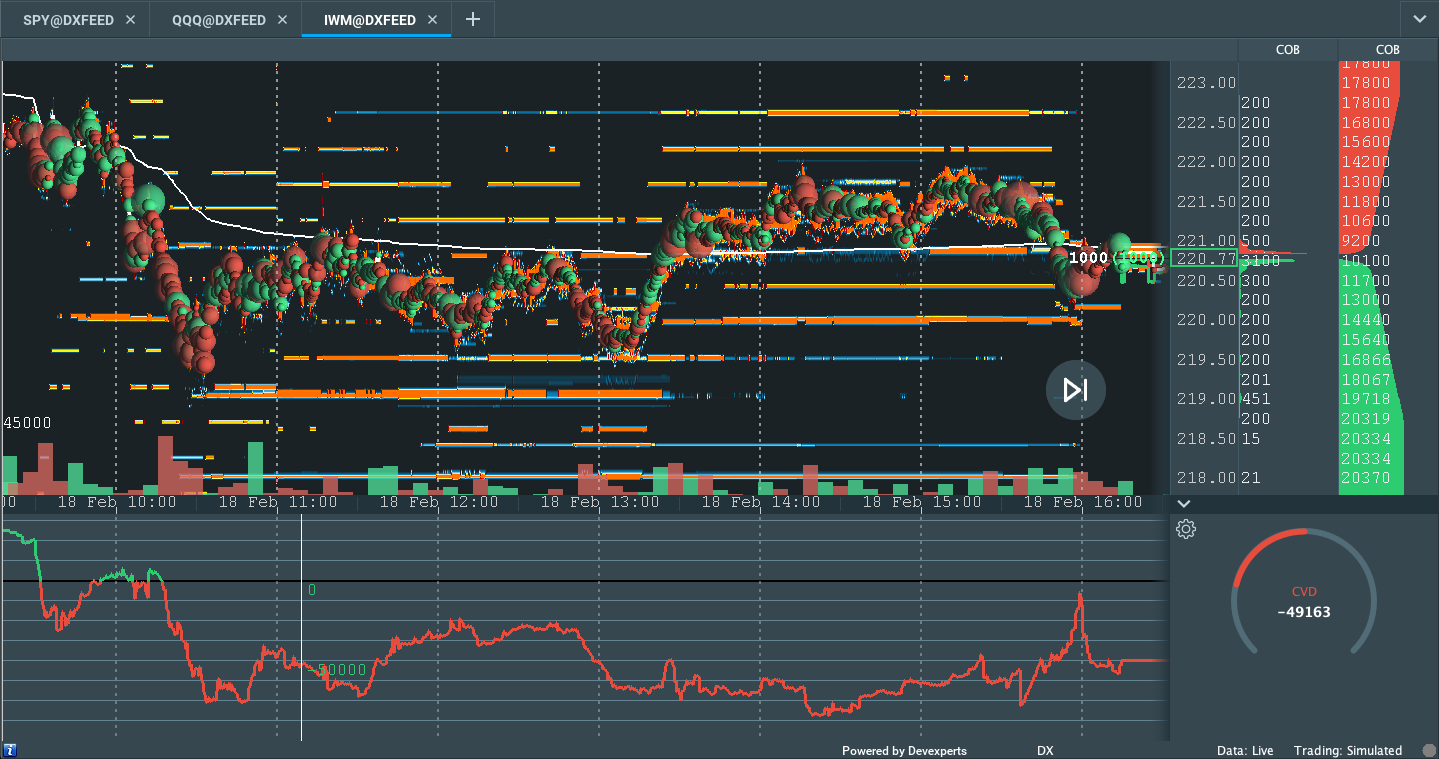
Beyond that, speculative activity in the options market and measures of market liquidity fail in offering much information.
Graphic 3: Physik Invest maps out the purchase of call and put options in the SPDR S&P 500 ETF Trust(NYSE: SPY), for the week ending February 19, 2021. Activity in the options market was primarily concentrated in short- and long-dated tenors, near the $390, a strike that corresponds with $3,900.00 in the cash-settled S&P 500 Index (INDEX: SPX).
SPY Market Liquidity
QQQ Market Liquidity
IWM Market Liquidity
What To Expect: U.S. stock indexes are positioned for directional resolve.
This comes alongside the acceptance of higher prices (inside a prominent high-volume area, or HVNode) and an overnight rally-high at $3,959.25.
More On Overnight Rally Highs: Typically, there is a low historical probability associated with overnight rally-highs ending the upside discovery process.More On Volume Areas: A structurally sound market will build on past areas of high-volume. Should the market trend for long periods of time, it will lack sound structure (identified as a low-volume area which denotes directional conviction and ought to offer support on any test). If participants were to auction and find acceptance into areas of prior low-volume, then future discovery ought to be volatile and quick as participants look to areas of high-volume for favorable entry or exit.
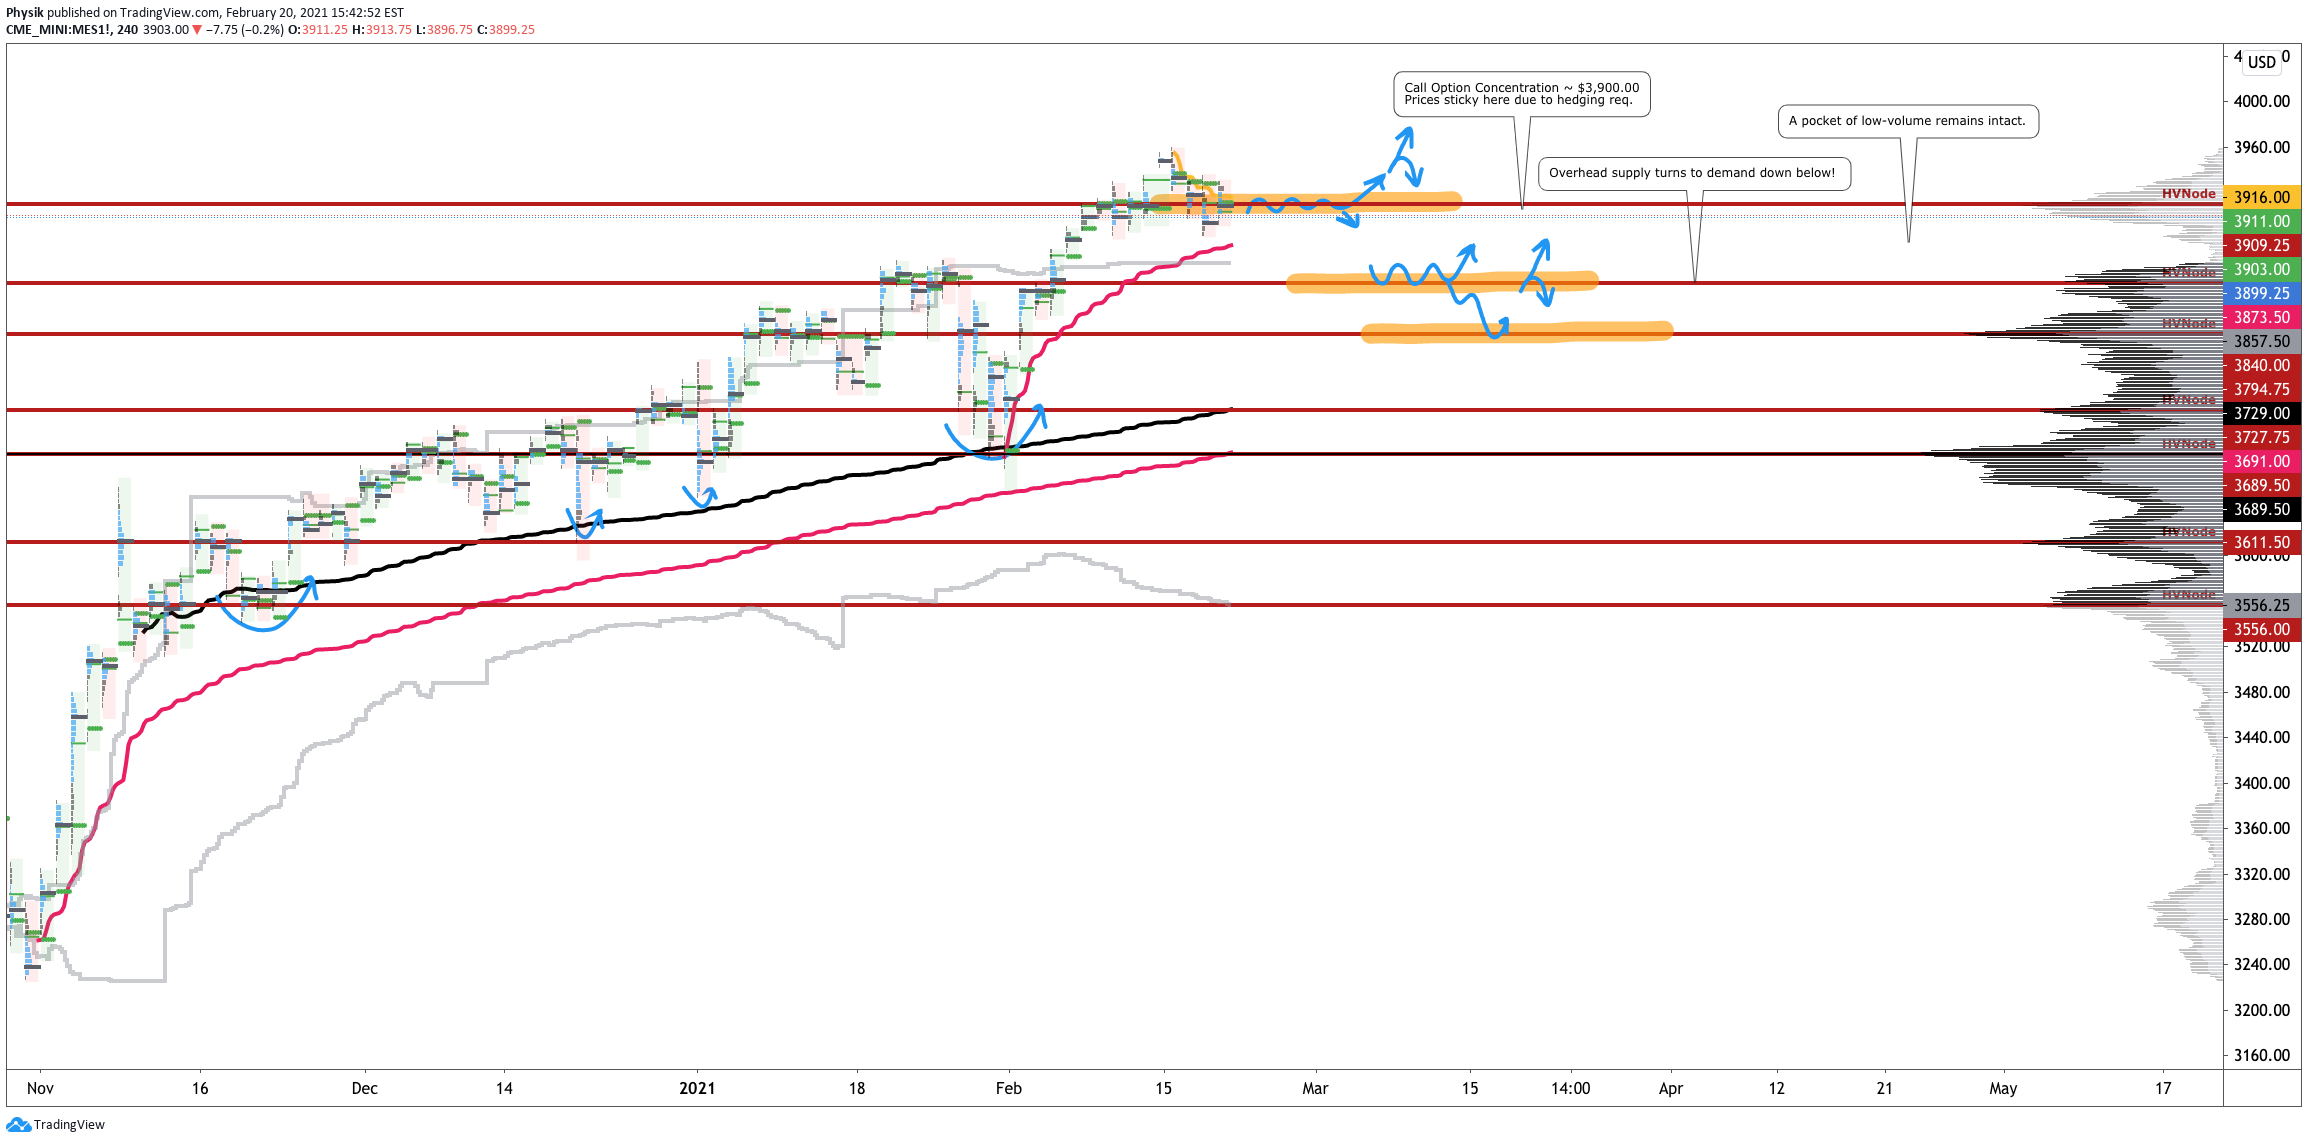
What To Do: In the coming sessions, participants will want to pay attention to the VWAP anchored from the $3,959.25 peak and $3,909.25 HVNode.
Volume-Weighted Average Prices (VWAPs): Metrics highly regarded by chief investment officers, among other participants, for quality of trade. Additionally, liquidity algorithms are benchmarked and programmed to buy and sell around VWAPs.
In the best case, the S&P 500 opens and remains above the $3,909.25 volume area.
Additionally, auctioning above the $3,915.00 VWAP would suggest buyers, on average, are in control and winning, since the February 15 rally high.
Auctioning beneath $3,909.25 turns the HVNode, nearby, into an area of supply, offering initiative sellers favorable entry and responsive buyers favorable exit.
The situation would drastically deteriorate with trade beneath the $3,880.00 HVNode, the last reference before participants find acceptance in an area of low-volume.
In such scenario, future discovery ought to be volatile and quick as participants repair some of the poor structures left in the wake of a prior advance, and look to the next area of high-volume (i.e., $3,830.75) for favorable entry and exit.
Graphic 4: Profile overlays on a 65-minute and 4-hour chart of the Micro E-mini S&P 500 Futures. See all decision levels of /ES and /NQ here, also.
Conclusions: The go/no-go level for next week’s trade is $3,909.25.
Any activity at this level suggests market participants are looking for more information to base their next move. Anything above (below) this level increases the potential for higher (lower).
Notice: To view this week’s big picture outlook, click here.
Key Takeaways For Today:
$3,900.00 S&P 500 is sticky, so expect balance.
The longer-term bias remains up until it is not.
Hedge bets when you can, not when you have to.
What Happened: Overnight, U.S. stock index futures auctioned higher, ahead of economic releases on U.S. business activity.
What Does It Mean: The past few weeks have been volatile.
Market participants witnessed a rapid de-risking event, as a result of individual stock volatility, and a subsequent v-pattern recovery, that was later taken back as the February monthly options expiration (OPEX) neared.
Given OPEX, participants have a clue as to why the market has failed to resolve directionally: option expiries mark an end to pinning (i.e, the theory that market makers and institutions short options move stocks to the point where the greatest dollar value of contracts will expire worthless) and the reduction dealer gamma exposure.
Aside from OPEX, we must talk more on the aforementioned v-pattern recovery and last week’s spike exit from balance, as well as weakening broad market volatility.
More On The V-Pattern: A pattern that forms after a market establishes a high, retests some support, and then breaks above said high. In most cases, this pattern portends continuation.More On Spikes: Spike’s mark the beginning of a break from value. Spikes higher (lower) are validated by trade at or above (below) the spike base (i.e., the origin of the spike).
In light of the v-pattern, balance, and spike, the S&P 500’s long-term uptrend remains intact. In support of this uptrend, systematic and hedge fund participants are increasing their long-exposure, given the economic recovery, and a drop in volatility.
Beyond that, speculative activity in the options market and measures of market liquidity fail in offering much information.
SPY Market Liquidity
QQQ Market Liquidity
IWM Market Liquidity
What To Expect: Friday’s regular session (9:30 AM – 4:00 PM ET) will likely open outside of prior-balance and -range, suggesting the potential for immediate directional opportunity.
This comes alongside the acceptance of higher prices (above a prominent high-volume area), and an overnight rally-high at $3,959.25.
More On Overnight Rally Highs: Typically, there is a low historical probability associated with overnight rally-highs ending the upside discovery process.More On Volume Areas: A structurally sound market will build on past areas of high-volume. Should the market trend for long periods of time, it will lack sound structure (identified as a low-volume area which denotes directional conviction and ought to offer support on any test). If participants were to auction and find acceptance into areas of prior low-volume, then future discovery ought to be volatile and quick as participants look to areas of high-volume for favorable entry or exit.
Given the above dynamics, the following frameworks ought to be applied.
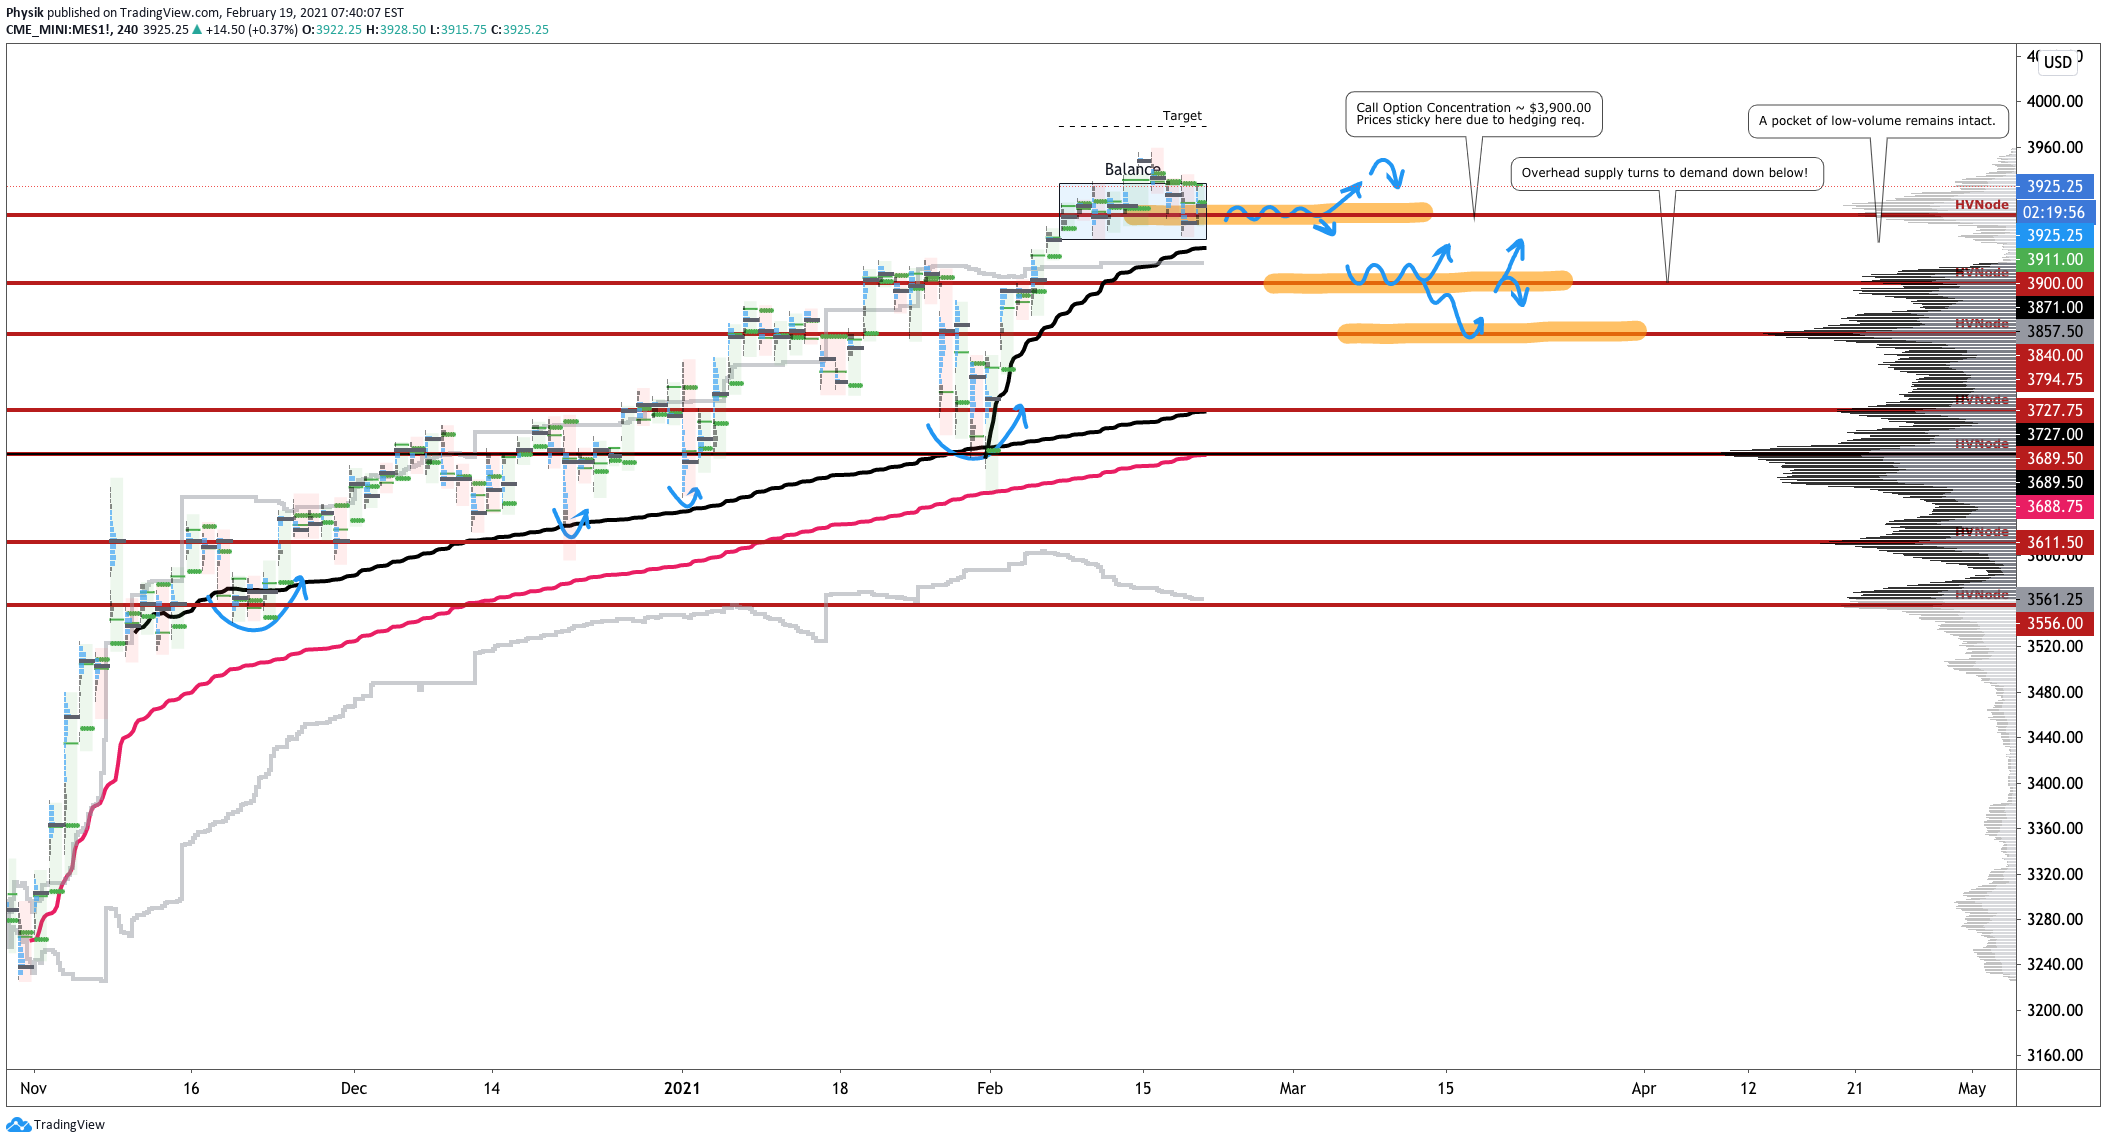
In the best case, as stated yesterday, the S&P 500 opens and remains above the $3,900.00 confluence zone. Auctioning beneath $3,900.00 turns the high-volume area (HVNode) nearby into supply, offering initiative sellers favorable entry and responsive buyers favorable exit.
Pictured: Profile overlays on a 65-minute candlestick chart of the Micro E-mini S&P 500 Futures.
Notice: To view this week’s big picture outlook, click here.
What Happened: As the new administration pushes approval of a $1.9 trillion coronavirus relief plan, alongside the approval of another $14 billion for pandemic-hit airlines and signs of improve in the labor market, U.S. stock index futures traded sideways, in prior-balance and -range.
What Does It Mean: Market’s were range-bound after a rapid de-risking event associated with the GameStop Corporation (NYSE: GME) crisis, and subsequent v-pattern recovery.
Pictured: 4-hour profile chart of the Micro E-mini S&P 500 Futures
The tight trading range is most attributable to the large February monthly options expiration (OPEX), after which, the interest at the $3,900.00 S&P 500 option strike will roll-off. Why’s this? Most funds are committed to holding long positions. In the interest of lower volatility returns, these funds will collar off their positions, selling calls to finance the purchase of downside put protection.
As a result of this activity, option dealers are long upside and short downside protection.
The exposure must be hedged: dealers sell into strength as their call (put) positions gain (lose) value and buy into weakness as their call (put) positions lose (gain) value.
Now, unlike theory suggests, dealers will hedge call losses (gains) quicker (slower). This leads to “long-gamma,” a dynamic that crushes volatility and promotes momentum, observed by lengthy sprints, followed by rapid de-risking events as the market transitions into “short-gamma.”
Long-Gamma Visualized
Long-Gamma Evidence
If the interest near $3,900.00 S&P 500 is not rolled up in price and out in time, then option hedging requirements will change.
The absence of strong fundamentally-driven buying (as we’ve seen with such things as DIX), can have serious implications on price action.
More On DIX: For every buyer is a seller (usually a market maker). Using DIX — which is derived from short sales (i.e., liquidity provision on the market making side) — we can measure buying pressure.
Pictured: DIX by Squeeze Metrics
However, it is important to note that, in recent days, some exposure has been rolled up in price and out in time.
One such example can be seen below.
Pictured: Purchase of call positions higher in price and farther out in time in the cash-settled S&P 500 Index
What To Expect: Friday’s regular session (9:30 AM – 4:00 PM ET) will likely open inside of prior-balance and -range, suggesting limited potential for immediate directional opportunity.
Given dynamics discussed in the prior section, the odds of substantial change are low, so long as broad market indices, like the S&P 500, remain in balance (i.e., range-bound).
Also, trading in a prominent area of high-volume ($3,900.00) will likely make for a volatile session as such areas denote the market’s most recent perception of value and offer favorable entry and exit, hence the two-sided trade.
More On Volume Areas: A structurally sound market will build on past areas of high-volume. Should the market trend for long periods of time, it will lack sound structure (identified as a low-volume area which denotes directional conviction and ought to offer support on any test).

If participants were to auction and find acceptance into areas of prior low-volume, then future discovery ought to be volatile and quick as participants look to areas of high-volume for favorable entry or exit.
Going forward, participants will look to the overnight rally-high at $3,928.25, and low-volume structure beneath the $3,880.00 HVNode, which offered responsive buyers favorable entry during Wednesday’s intraday liquidation break.
More On Overnight Rally Highs: Typically, there is a low historical probability associated with overnight rally-highs ending the upside discovery process.More On Liquidation Breaks: The profile shape in the S&P 500 suggests participants were “too” long and had poor location.
That said, the following frameworks apply.
In the best case, the S&P 500 remains rotational, at or above the $3,900.00 HVNode. In the worst case, any break that finds increased involvement (i.e., supportive flows and delta) below the $3,880.00 HVNode, would favor continuation as low as the $3,830.75 HVNode.
As stated yesterday, majorchange will be identified with trade above the $3,928.25 overnight rally-high, and below the $3,878.50 regular-trade low.