Notice: To view this week’s big picture outlook, click here.
What Happened: U.S. stock index futures balanced in prior-range, as evidenced by a lack of directional resolve.
What Does It Mean: After a rapid de-grossing and v-pattern recovery, stock indexes are nearing an important hurdle.
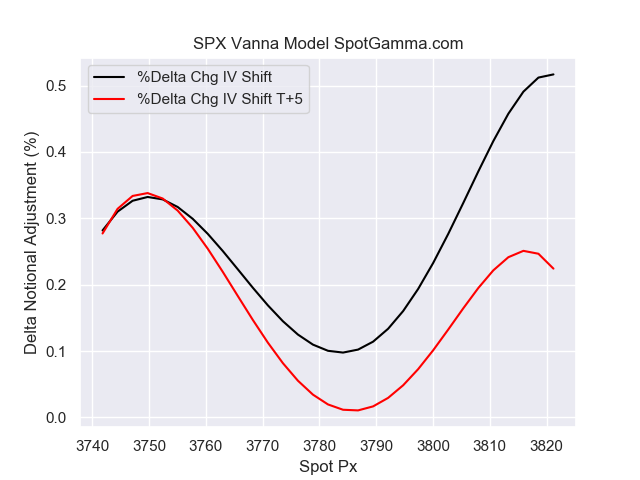
In particular, the S&P 500 has to contend with a transition into long-gamma.
Gamma is the sensitivity of an option to changes in underlying price. Dealers that take the other side of option trades hedge their exposure to risk by buying and selling the underlying.
When dealers are short-gamma, they hedge by buying into strength and selling into weakness. When dealers are long-gamma, they hedge by selling into strength and buying into weakness. The former exacerbates volatility. The latter calms volatility.
Adding: Here’s a good explanation I wrote regarding the derivative market’s impact on the equity market.

Further, given the aforementioned v-pattern recovery, a price sequence that ought to be followed by further price discovery, as high as the 100% price projection, which happens to be near $4,000.00 in the S&P 500, market participants ought to also pay attention to divergences popping up across different indices.
To be more specific, Wednesday’s regular trade in the Nasdaq-100 showed weakness relative to the S&P 500. In the end, participants established a neutral-center day on S&P 500 and neutral-extreme down day in the Nasdaq-100.
On a neutral-center day, participants test both extremes before closing an index in range, suggesting minimal confidence and balance. On a neutral-extreme day, participants test both extremes before closing at on extreme, suggesting increased confidence and imbalance.
The profile shape in the S&P 500 confirms balance while in the Nasdaq-100 it’s likely that participants were “too” long and had poor location.
What To Expect: Thursday’s regular session (9:30 AM – 4:00 PM ET) will likely open inside of prior-balance and -range, suggesting limited directional opportunity and high volatility.
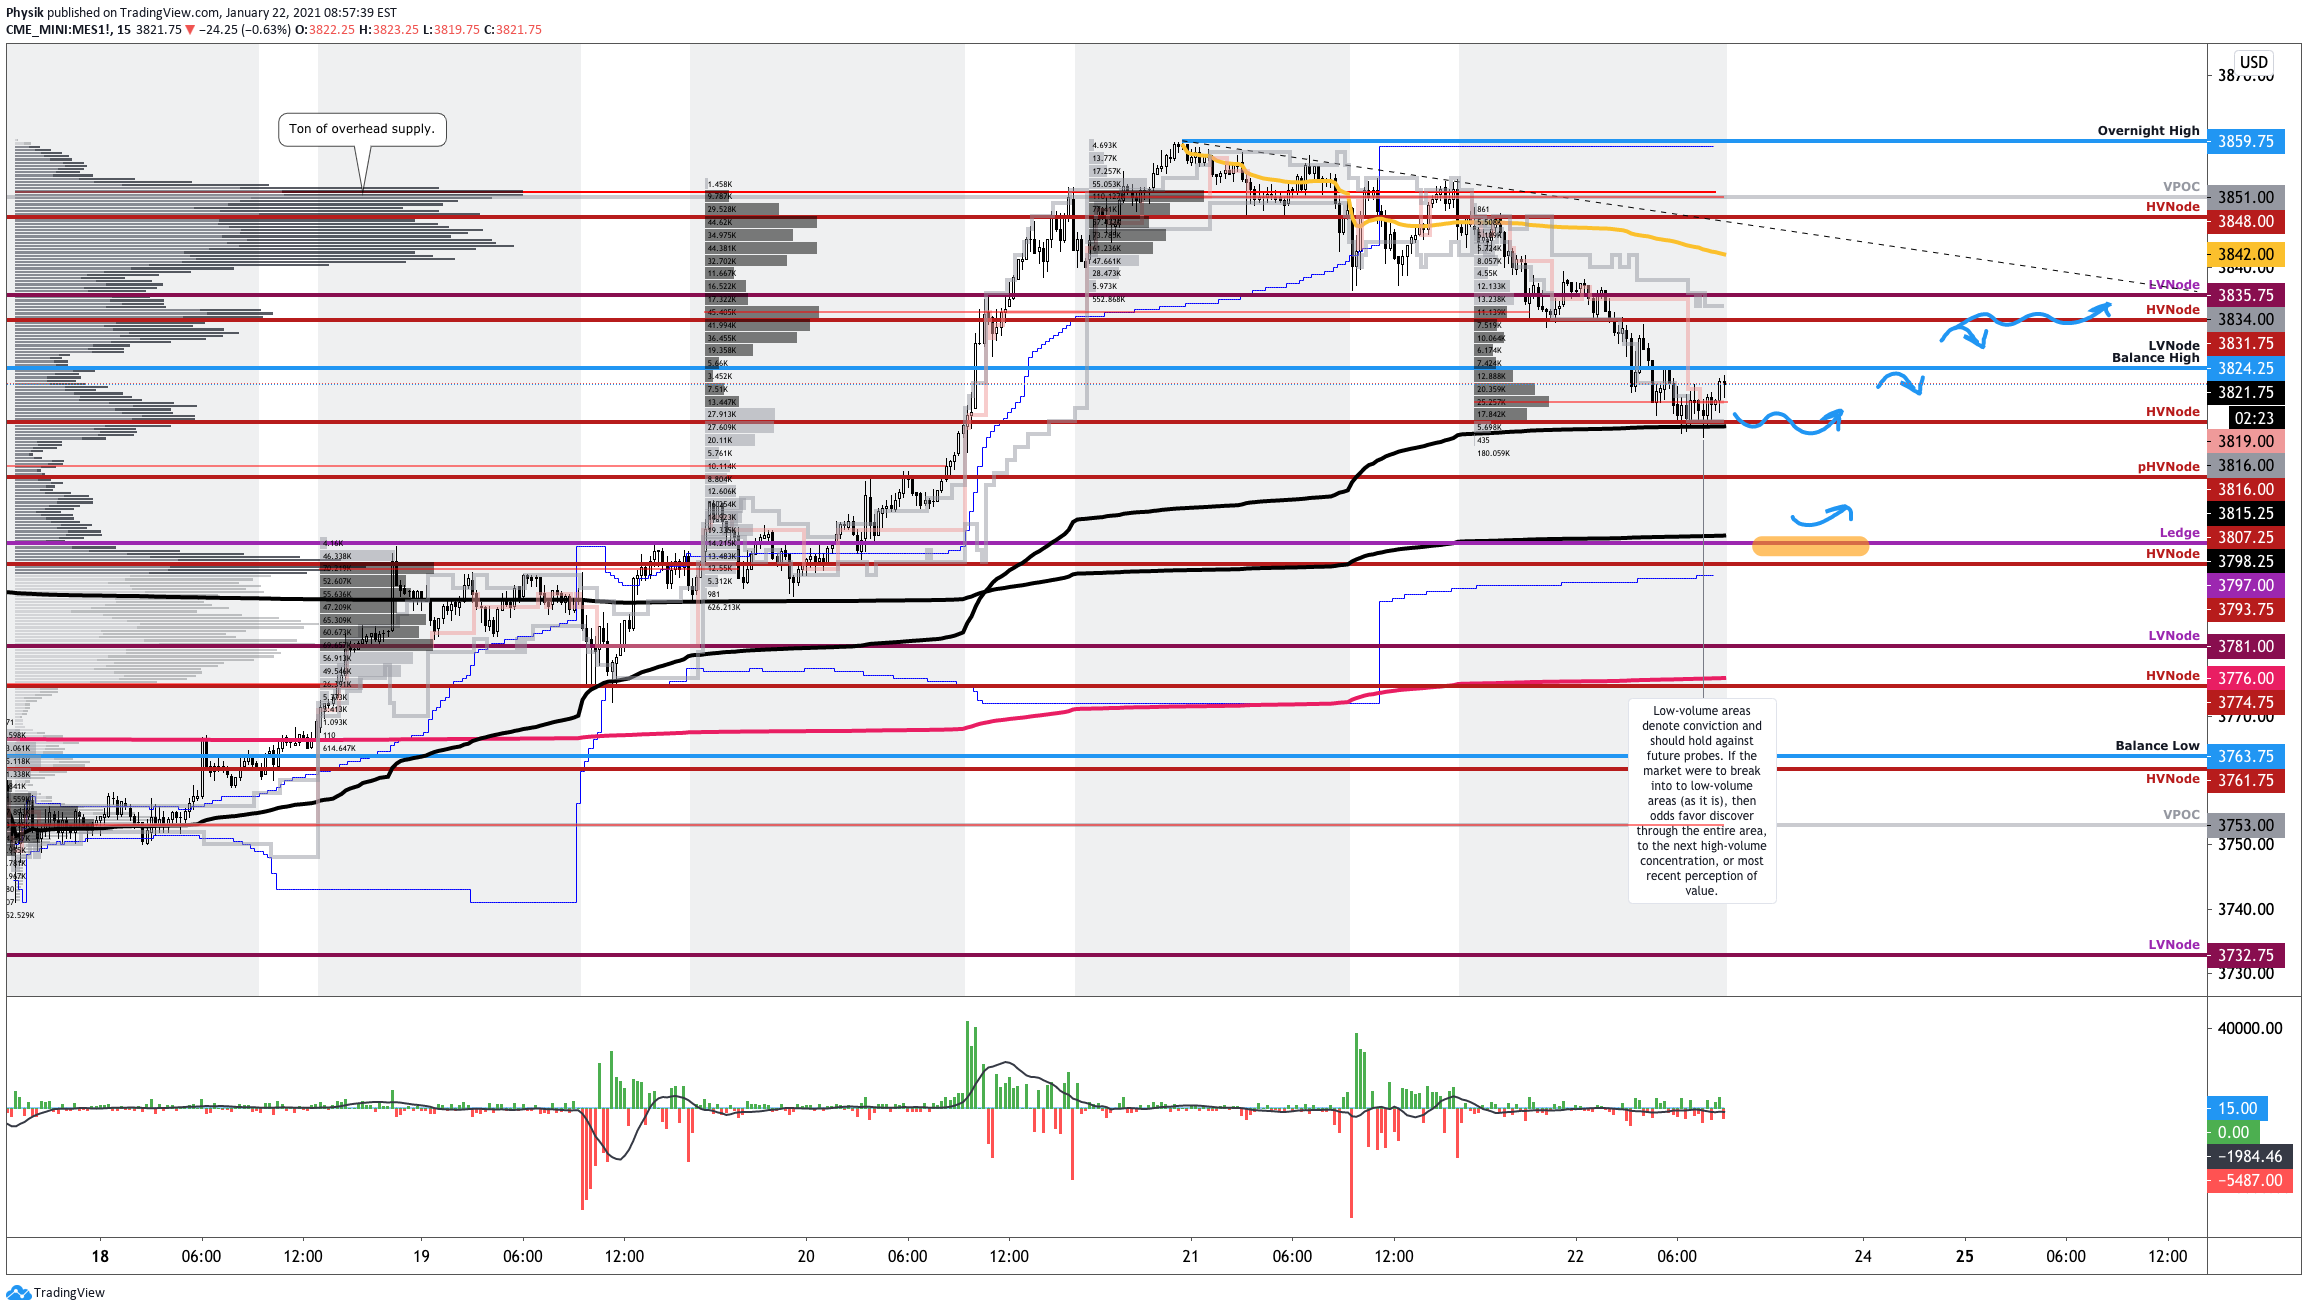
Currently, the S&P 500 is rotating at the $3,842.00 high-volume area (HVNode).
As stated, HVNodes can be thought of as building blocks — they also denote areas of supply and demand. In this case, $3,842.00 can be thought of as an area of supply. The primary strategy is to respond to probes into these supply (i.e., selling responsively) and demand (i.e., buying responsively) areas as they offer favorable entry and exit.
In the coming session, participants will want to pay attention to Tuesday’s overnight high ($3,483.50) and Monday’s regular-trade low ($3,799.00). The reason being, between those two references is a developing balance area. Balance-areas make it easy to spot change in the market (i.e., the transition from two-time frame trade, or balance, to one-time frame trade, or trend).
Added Note: There is a low historical probability that overnight rally-highs end the upside discovery process.
From an order flow perspective, the absence of aggressive buying suggests more of the same — balance or downside to repair poor structures left in the wake of short-covering and initiative buying in the day’s prior.
In the simplest way, high-volume areas can be thought of as building blocks. A structurally sound market will build on past areas of high-volume. Should the market trend for long periods of time, it will lack sound structure. If participants were to auction and find acceptance into areas of prior low-volume, then future discovery ought to be volatile and quick as participants look to areas of value for favorable entry or exit.
For today, the following frameworks ought to be applied.
In the best case, the market will initiate above, or find acceptance at (in the form of rotational trade) the $3,842.00 HVNode. In the worst case, responsive sellers appear and restart the downside discovery process. Any break that finds increased involvement below the $3,799.00 regular-trade low, would favor continuation as low as the $3,727.75 HVNode.
The go/no-go for upside is the $3,843.50 overnight-trade high (ONH). The go/no-go for downside is $3,799.00 regular-trade low (RTH Low). Anything in-between portends responsive, non-directional trade.
A break above the ONH, participants may see discovery as high as $3,880.00, a balance-area projection (i.e., typical balance-break target). A break below the RTH Low, participants may see prices as low as $3,750.00, another balance-area projection.
Levels Of Interest: $3,843.50 ONH, $3,799.00 RTH Low.