Categories
Commentary

Daily Brief For February 25, 2022

Editor’s Note: The Daily Brief is a free glimpse into the prevailing fundamental and technical drivers of U.S. equity market products. Join the 200+ that read this report daily, below!

What Happened

Overnight, equity index futures auctioned sideways, providing some more validation to Thursday morning’s reversal fueled by aggressive short-covering.

Geopolitical tensions and monetary tightening are the two major narratives news outlets are assigning to the volatility. 

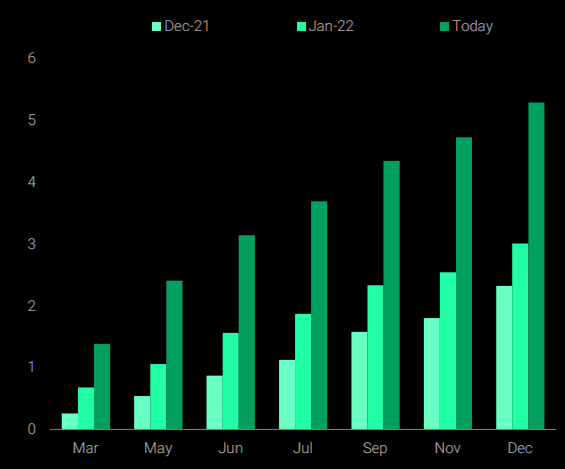
The U.S. and its allies applied more sanctions on Russia for its invasion of Ukraine and markets are still pricing around six quarter-point rate hikes by the Fed.

Ahead is data on personal income, consumer spending PCE inflation, core inflation, disposable income, durable goods orders, and core capital equipment orders (8:30 AM ET), University of Michigan sentiment, inflation expectations, and pending home sales (10:00 AM ET).

Graphic updated 6:35 AM ET. Sentiment Neutral if expected /ES open is inside of the prior day’s range. /ES levels are derived from the profile graphic at the bottom of the following section. Levels may have changed since initially quoted; click here for the latest levels. SqueezeMetrics Dark Pool Index (DIX) and Gamma (GEX) calculations are based on where the prior day’s reading falls with respect to the MAX and MIN of all occurrences available. A higher DIX is bullish. At the same time, the lower the GEX, the more (expected) volatility. Learn the implications of volatility, direction, and moneyness. SHIFT data used for S&P 500 (INDEX: SPX) options activity. Note that options flow is sorted by the call premium spent; if more positive, then more was spent on call options. Breadth reflects a reading of the prior day’s NYSE Advance/Decline indicator. VIX reflects a current reading of the CBOE Volatility Index (INDEX: VIX) from 0-100.

What To Expect

Fundamental: Must keep it short, today.

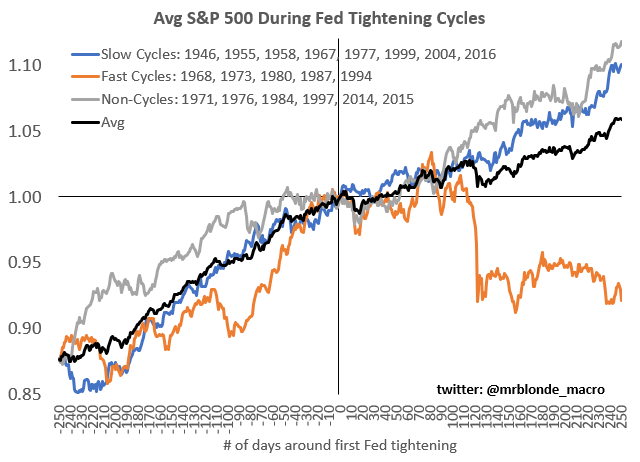
Per JPMorgan Chase & Co’s (NYSE: JPM) Marko Kolanovic, “While Equities are down year-to-date due to rising rates, we note that historically the initial volatility around rate liftoff didn’t last and equities made new all-time highs 2-4 quarters out.”

“The start of policy tightening is usually a confirmation that the cycle has legs, rather than the signal of its end. As we don’t see the yield curve inverting or real yields reaching problematic levels this year, it is premature to talk about end-of-cycle worries.”

Graphic: Via Haver. Retrieved from The Market Ear. Macro conditions are more supportive than during the Global Financial Crisis.

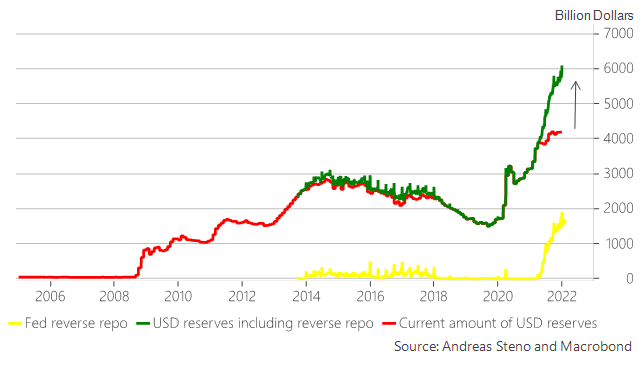
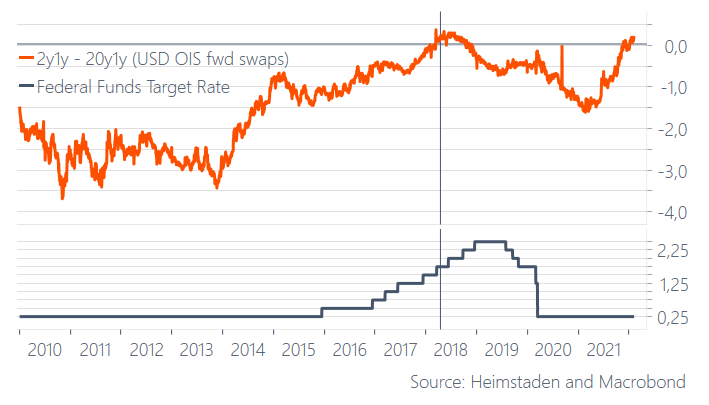
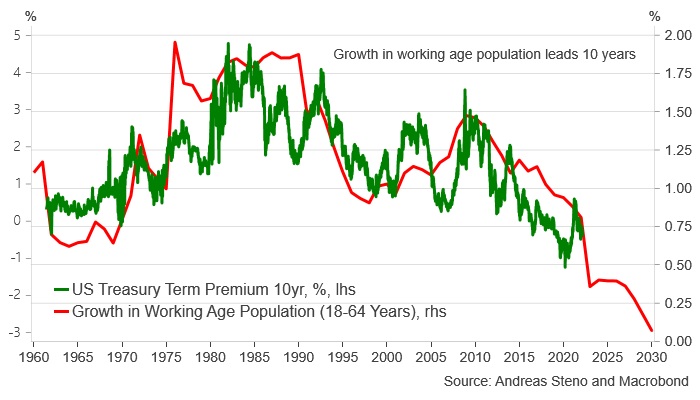
Pursuant to Kolanovic’s remarks, Andreas Steno Larsen of Heimstaden explains that bond yields remain governed by demographics, and this is good news for tech.

“I still think that inflation and bond markets will be governed by other structural trends over the medium term,” he said. “Just look at the growth rate of the working-age population (10 years forward) versus the term premium of US Treasury bonds. The current bond bear market is not standing on structural pillars.”

Graphic: Via Andreas Steno Larsen, “Bond yields remain governed by demographics over the medium-term. Low(er) for longer.”

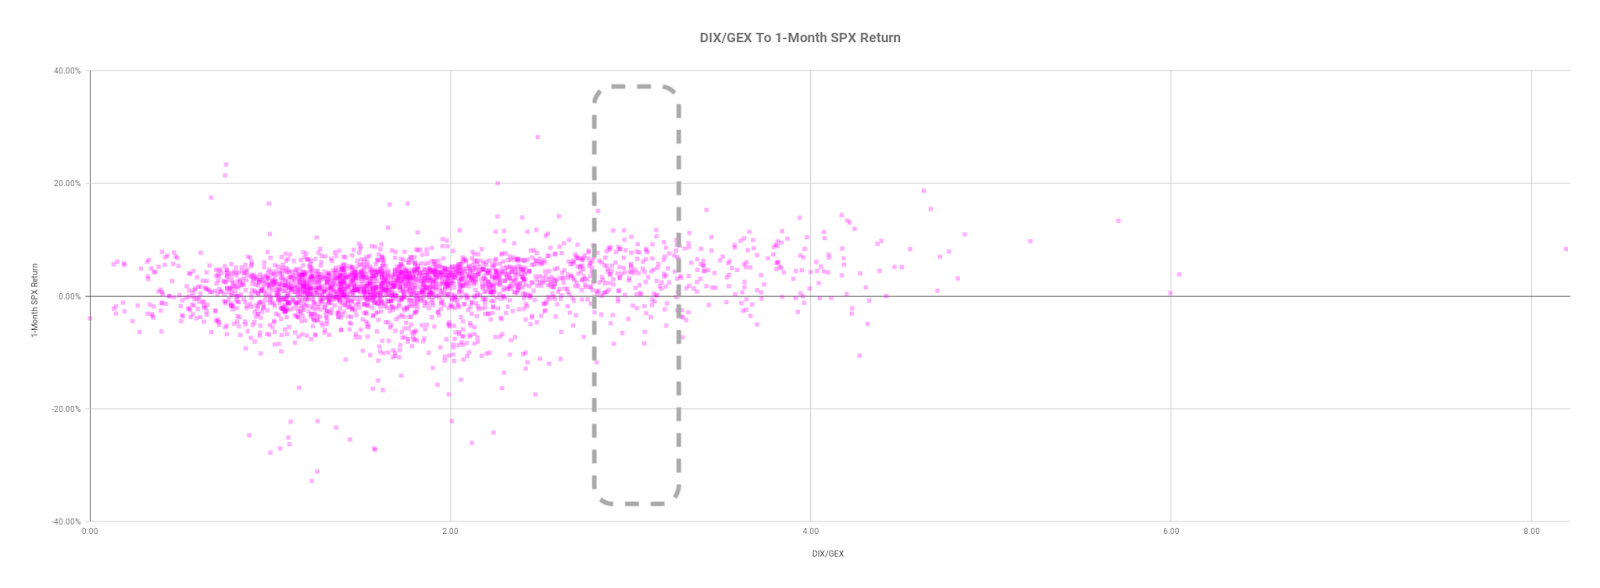
Positioning: Based on a variety of metrics, some of which were pointed to in yesterday’s commentary, there were no clear signs of capitulation

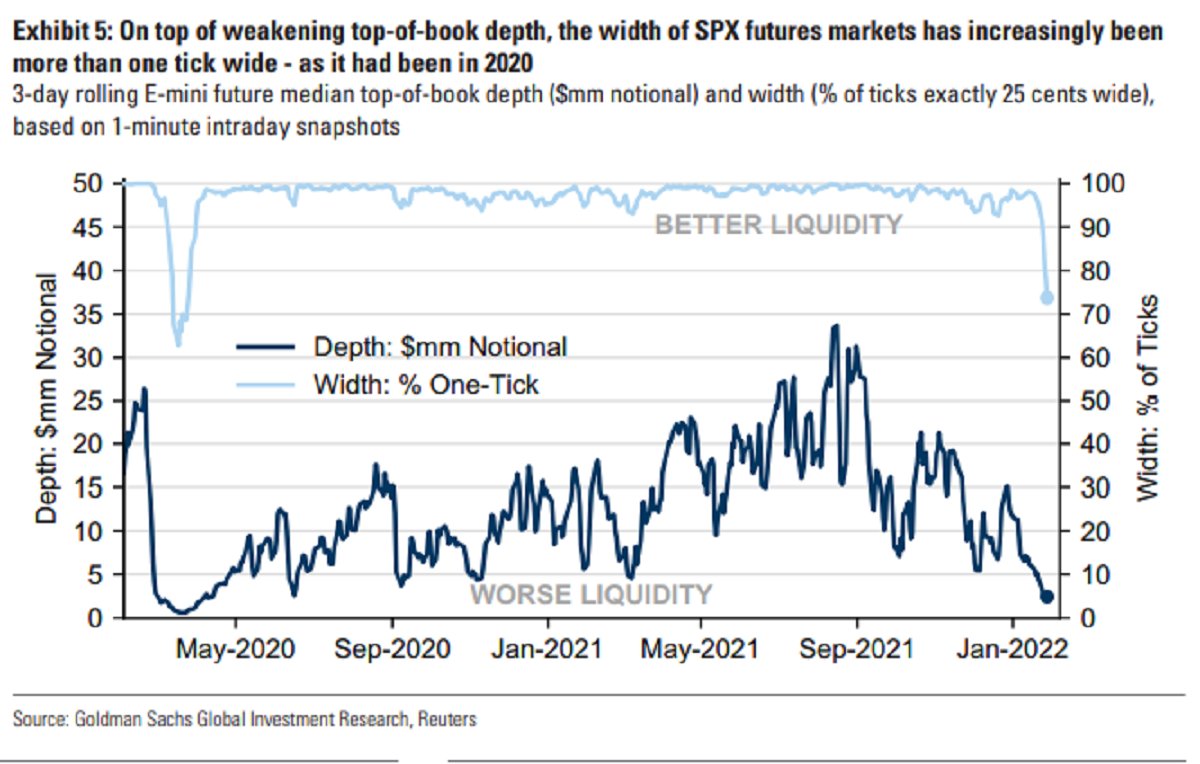
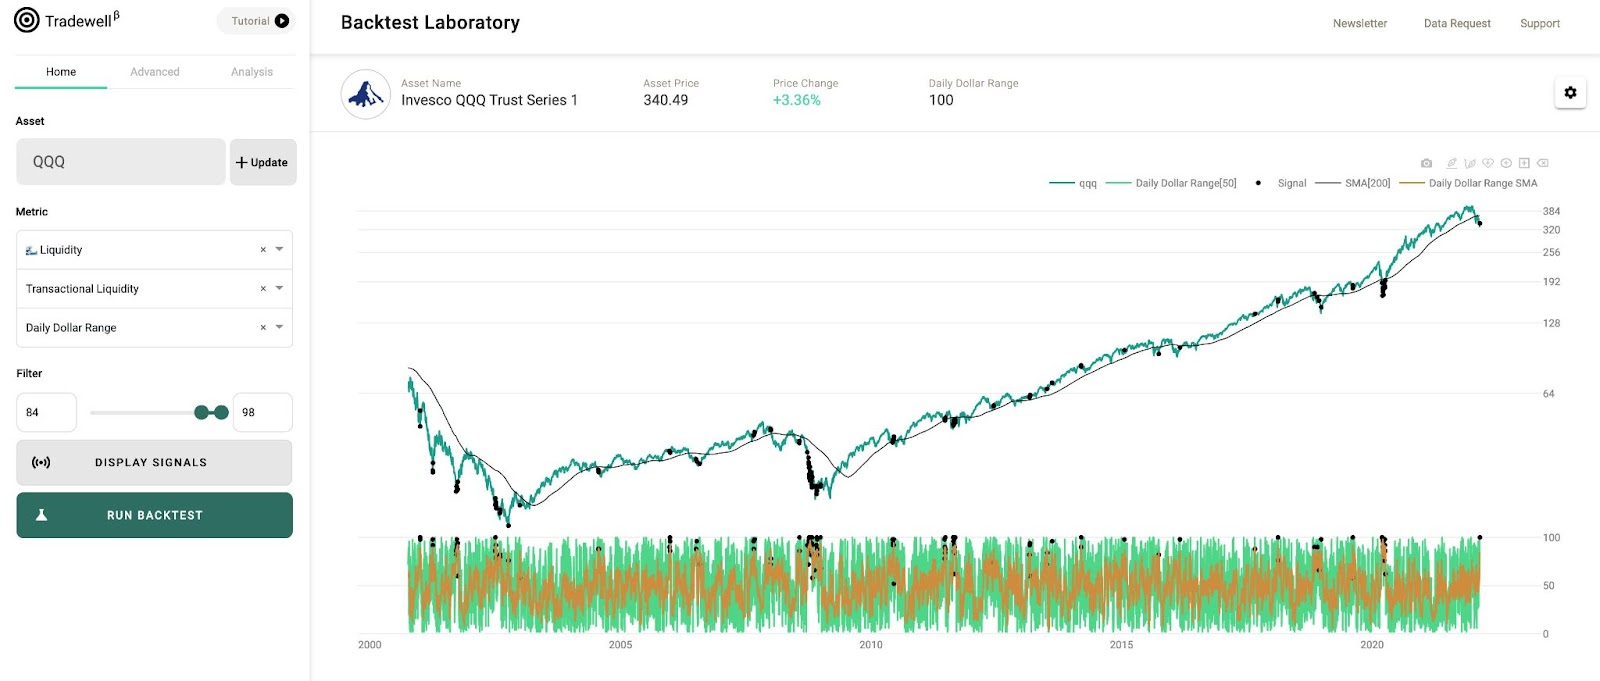
For instance, one of the largest ETF products that track the Nasdaq 100 (QQQ) “has seen persistently illiquidity (daily range / $ volume). There was not much volume (participation) behind the move in price. The 1-week return distribution gets pretty wild.”

Graphic: Via @HalftersPower.

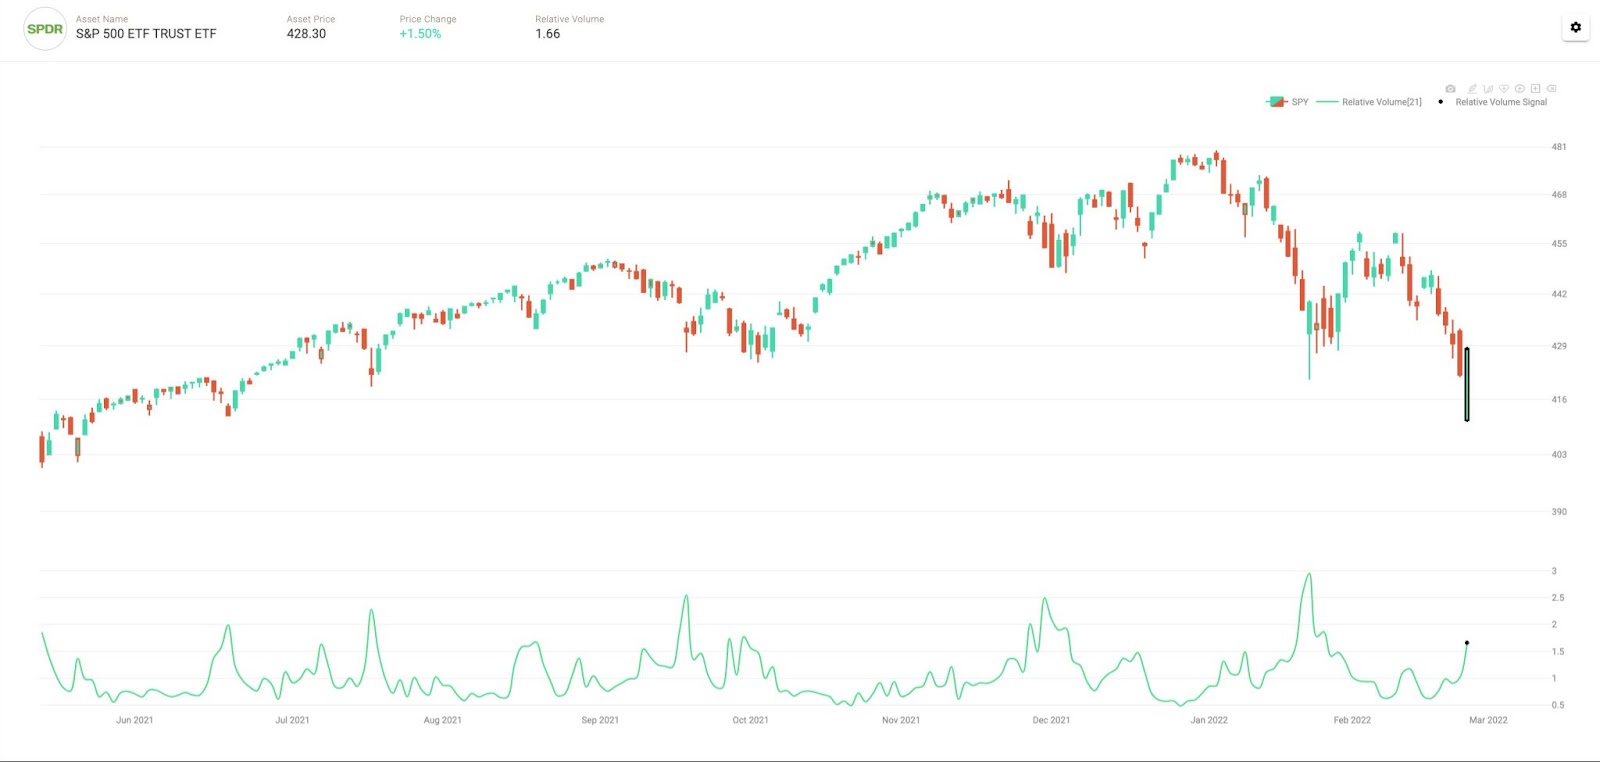
Similarly, “1 Month relative volume (today’s volume / 1-month average) on SPY today (1.66) doesn’t have a capitulatory look to it. Bottoms in the past year occurred at 2+.”

Graphic: Via @HalfersPower.

There was, however, a massive covering of short (negative delta) exposures. The gap lower presented participants a “gift” and many took it as an opportunity to monetize downside bets.

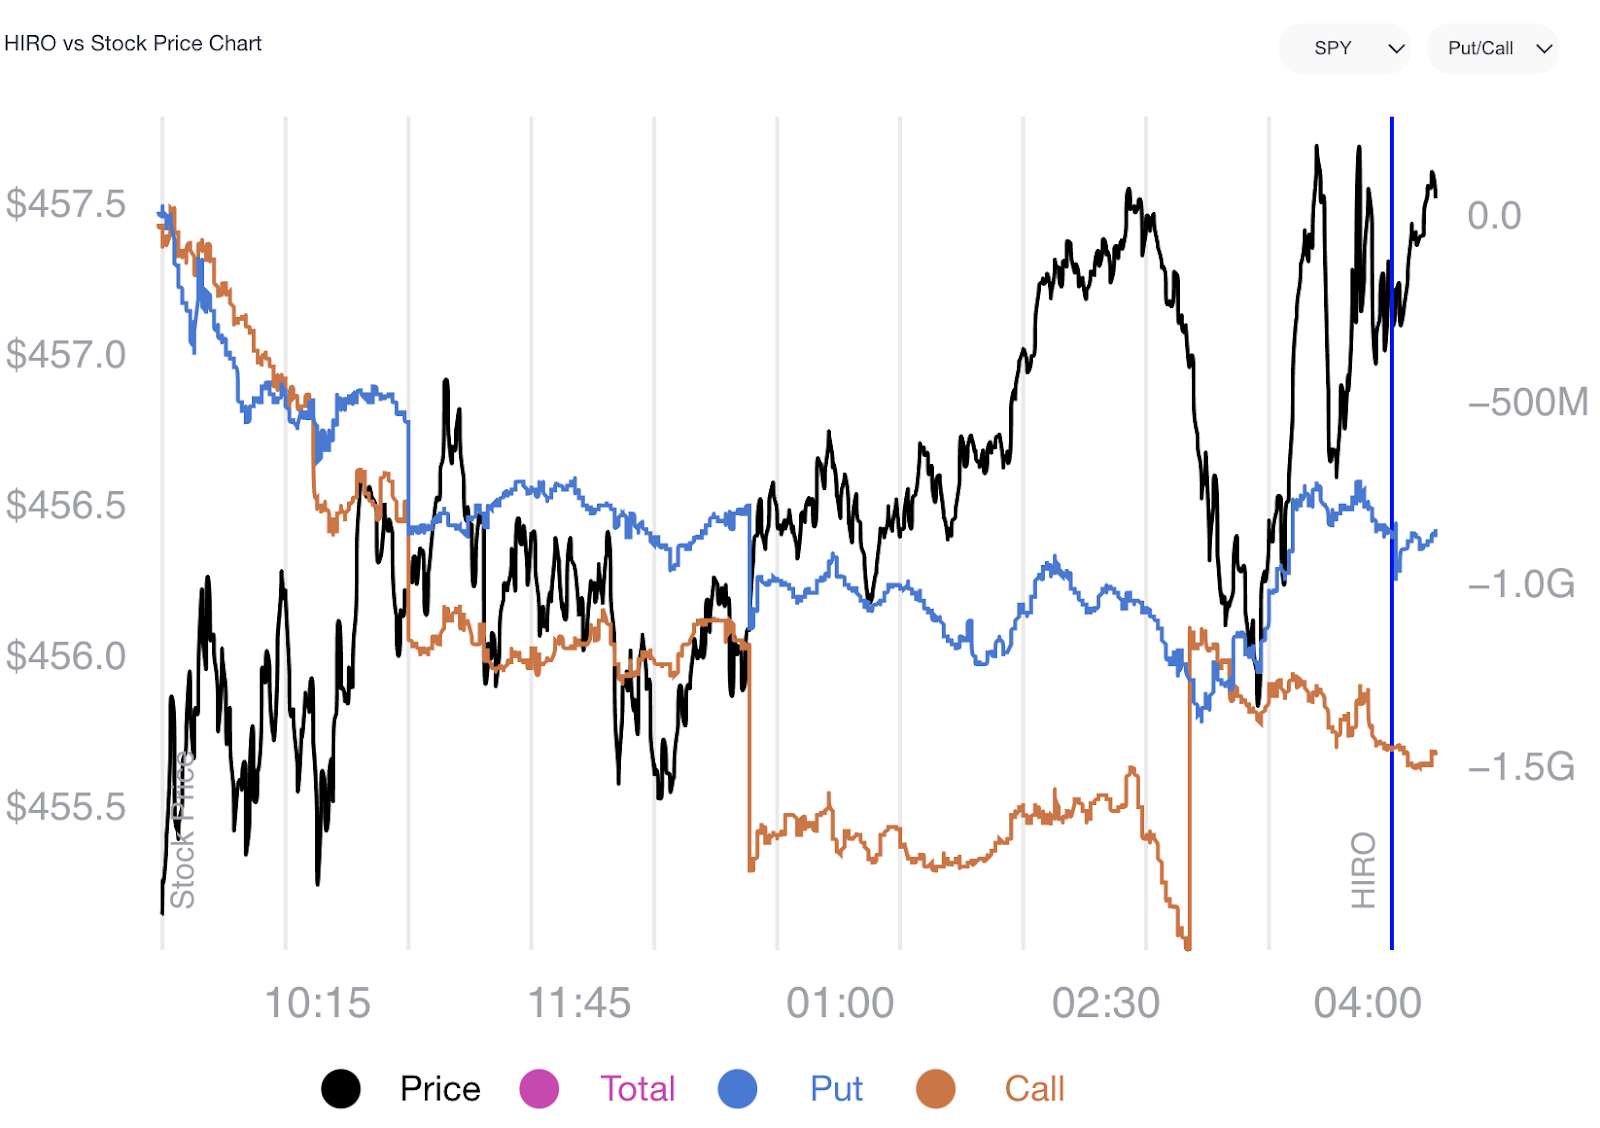
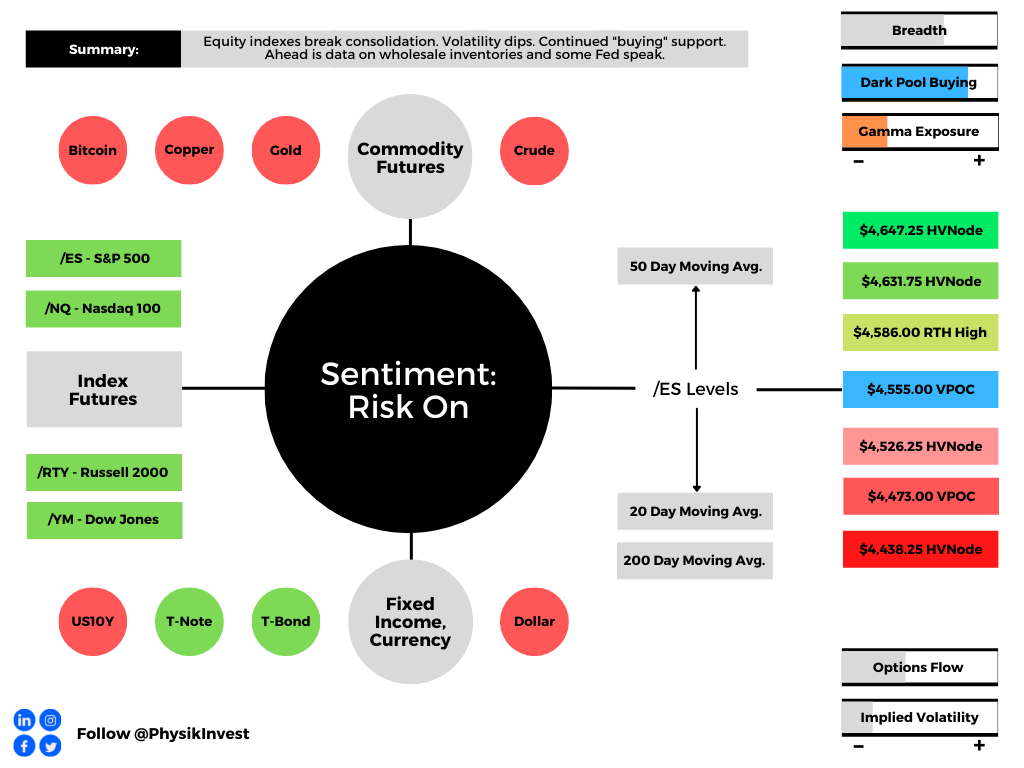
Despite metrics pointing to continued accumulation, and buying support, equity products are in negative gamma wherein the hedging of put-heavy exposures results in whip-saw action (i.e., options counterparties hedge in a manner that exacerbates moves to upside and downside).

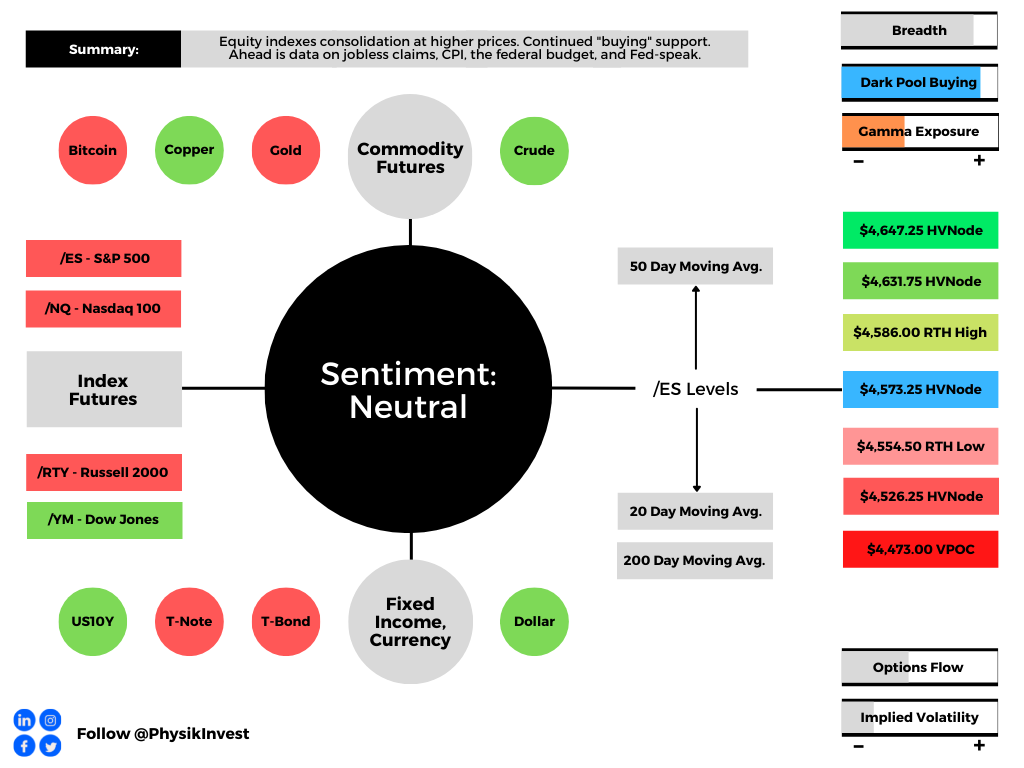
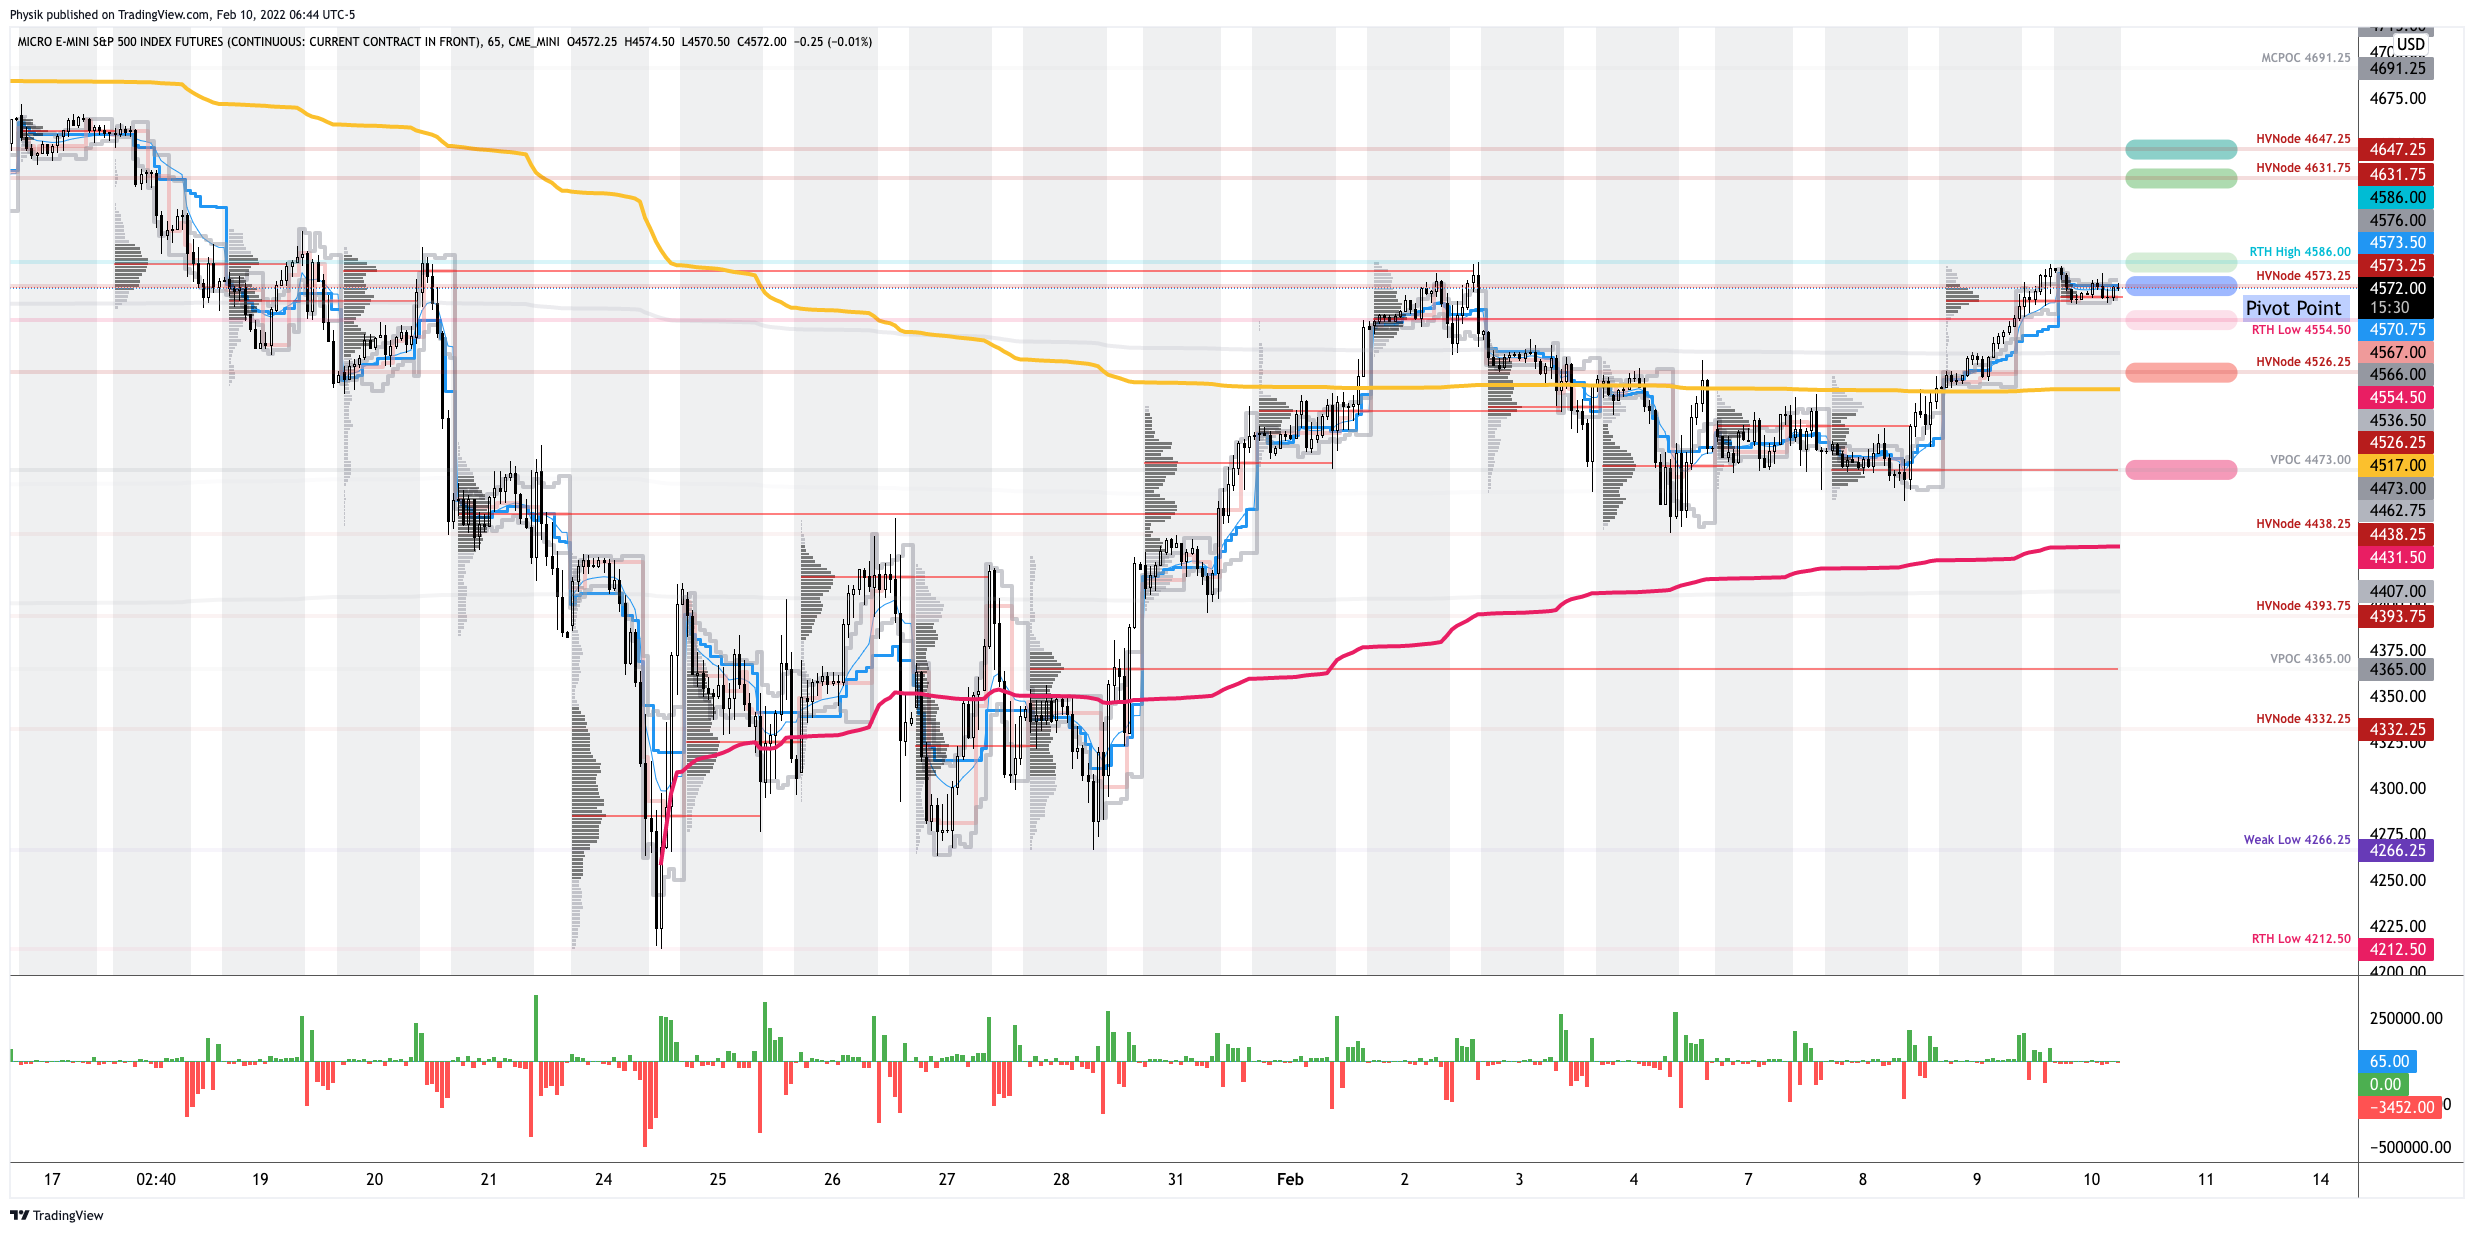
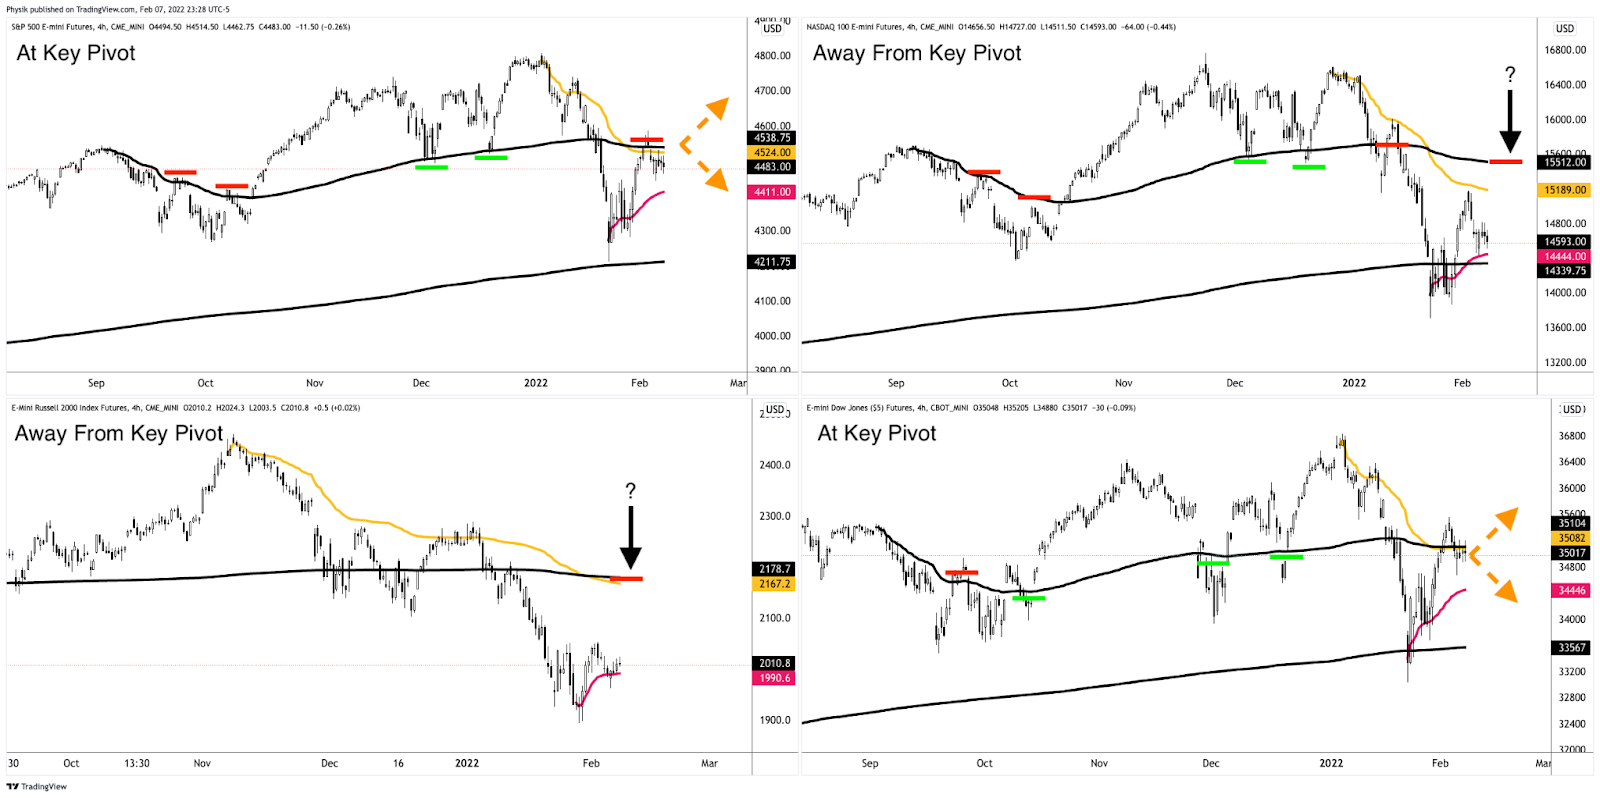
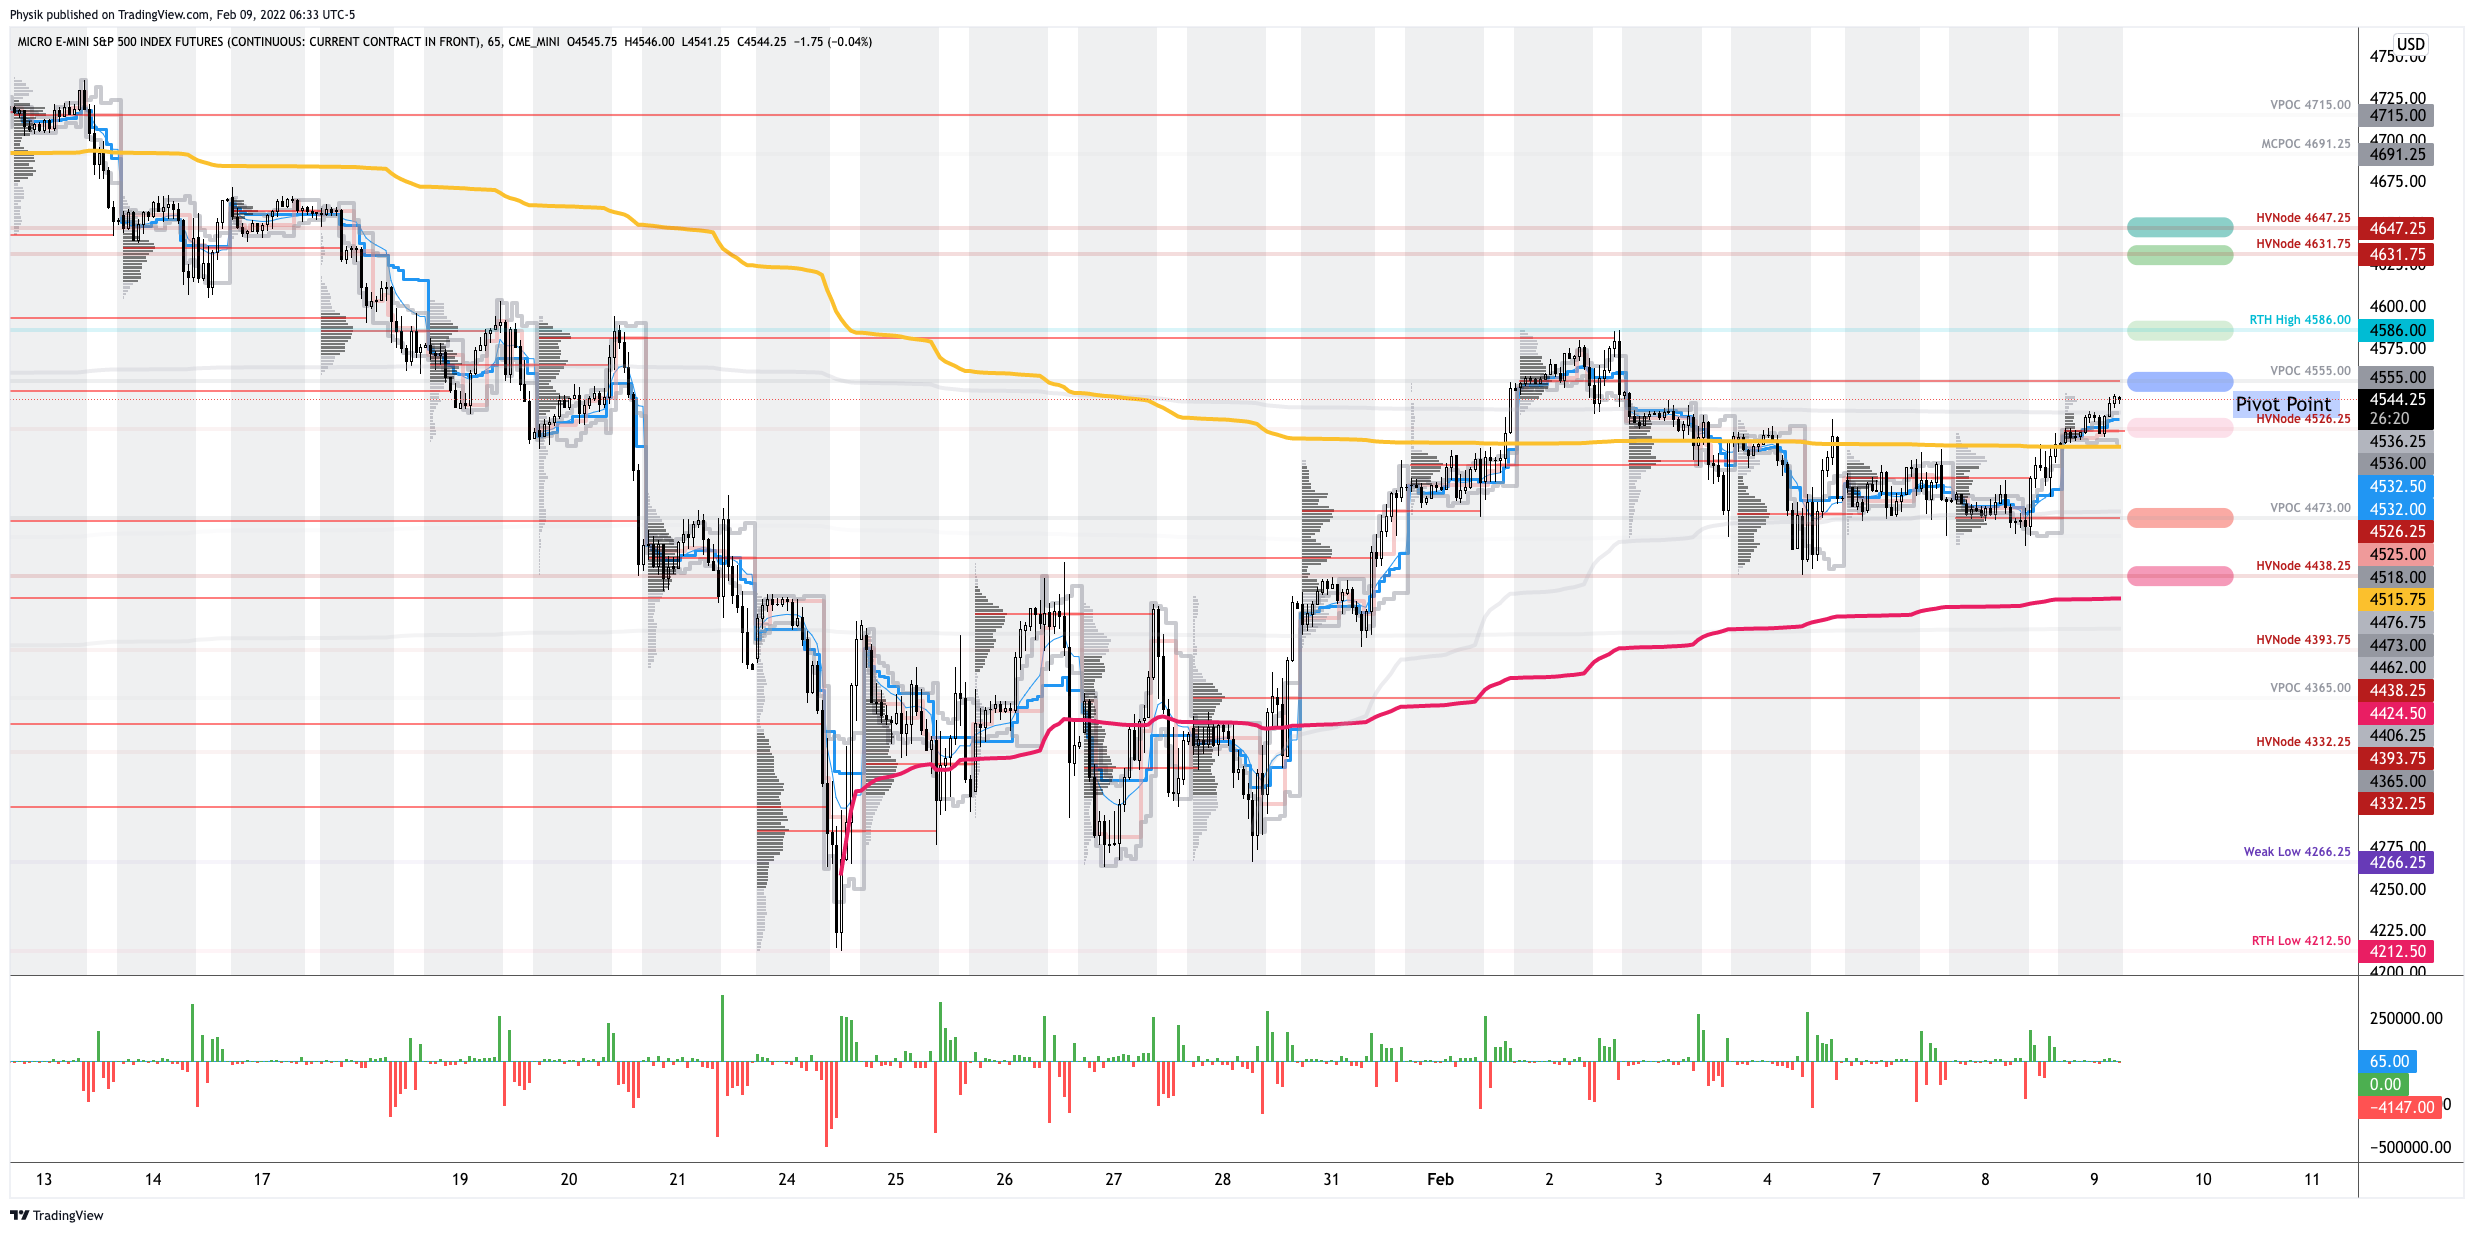
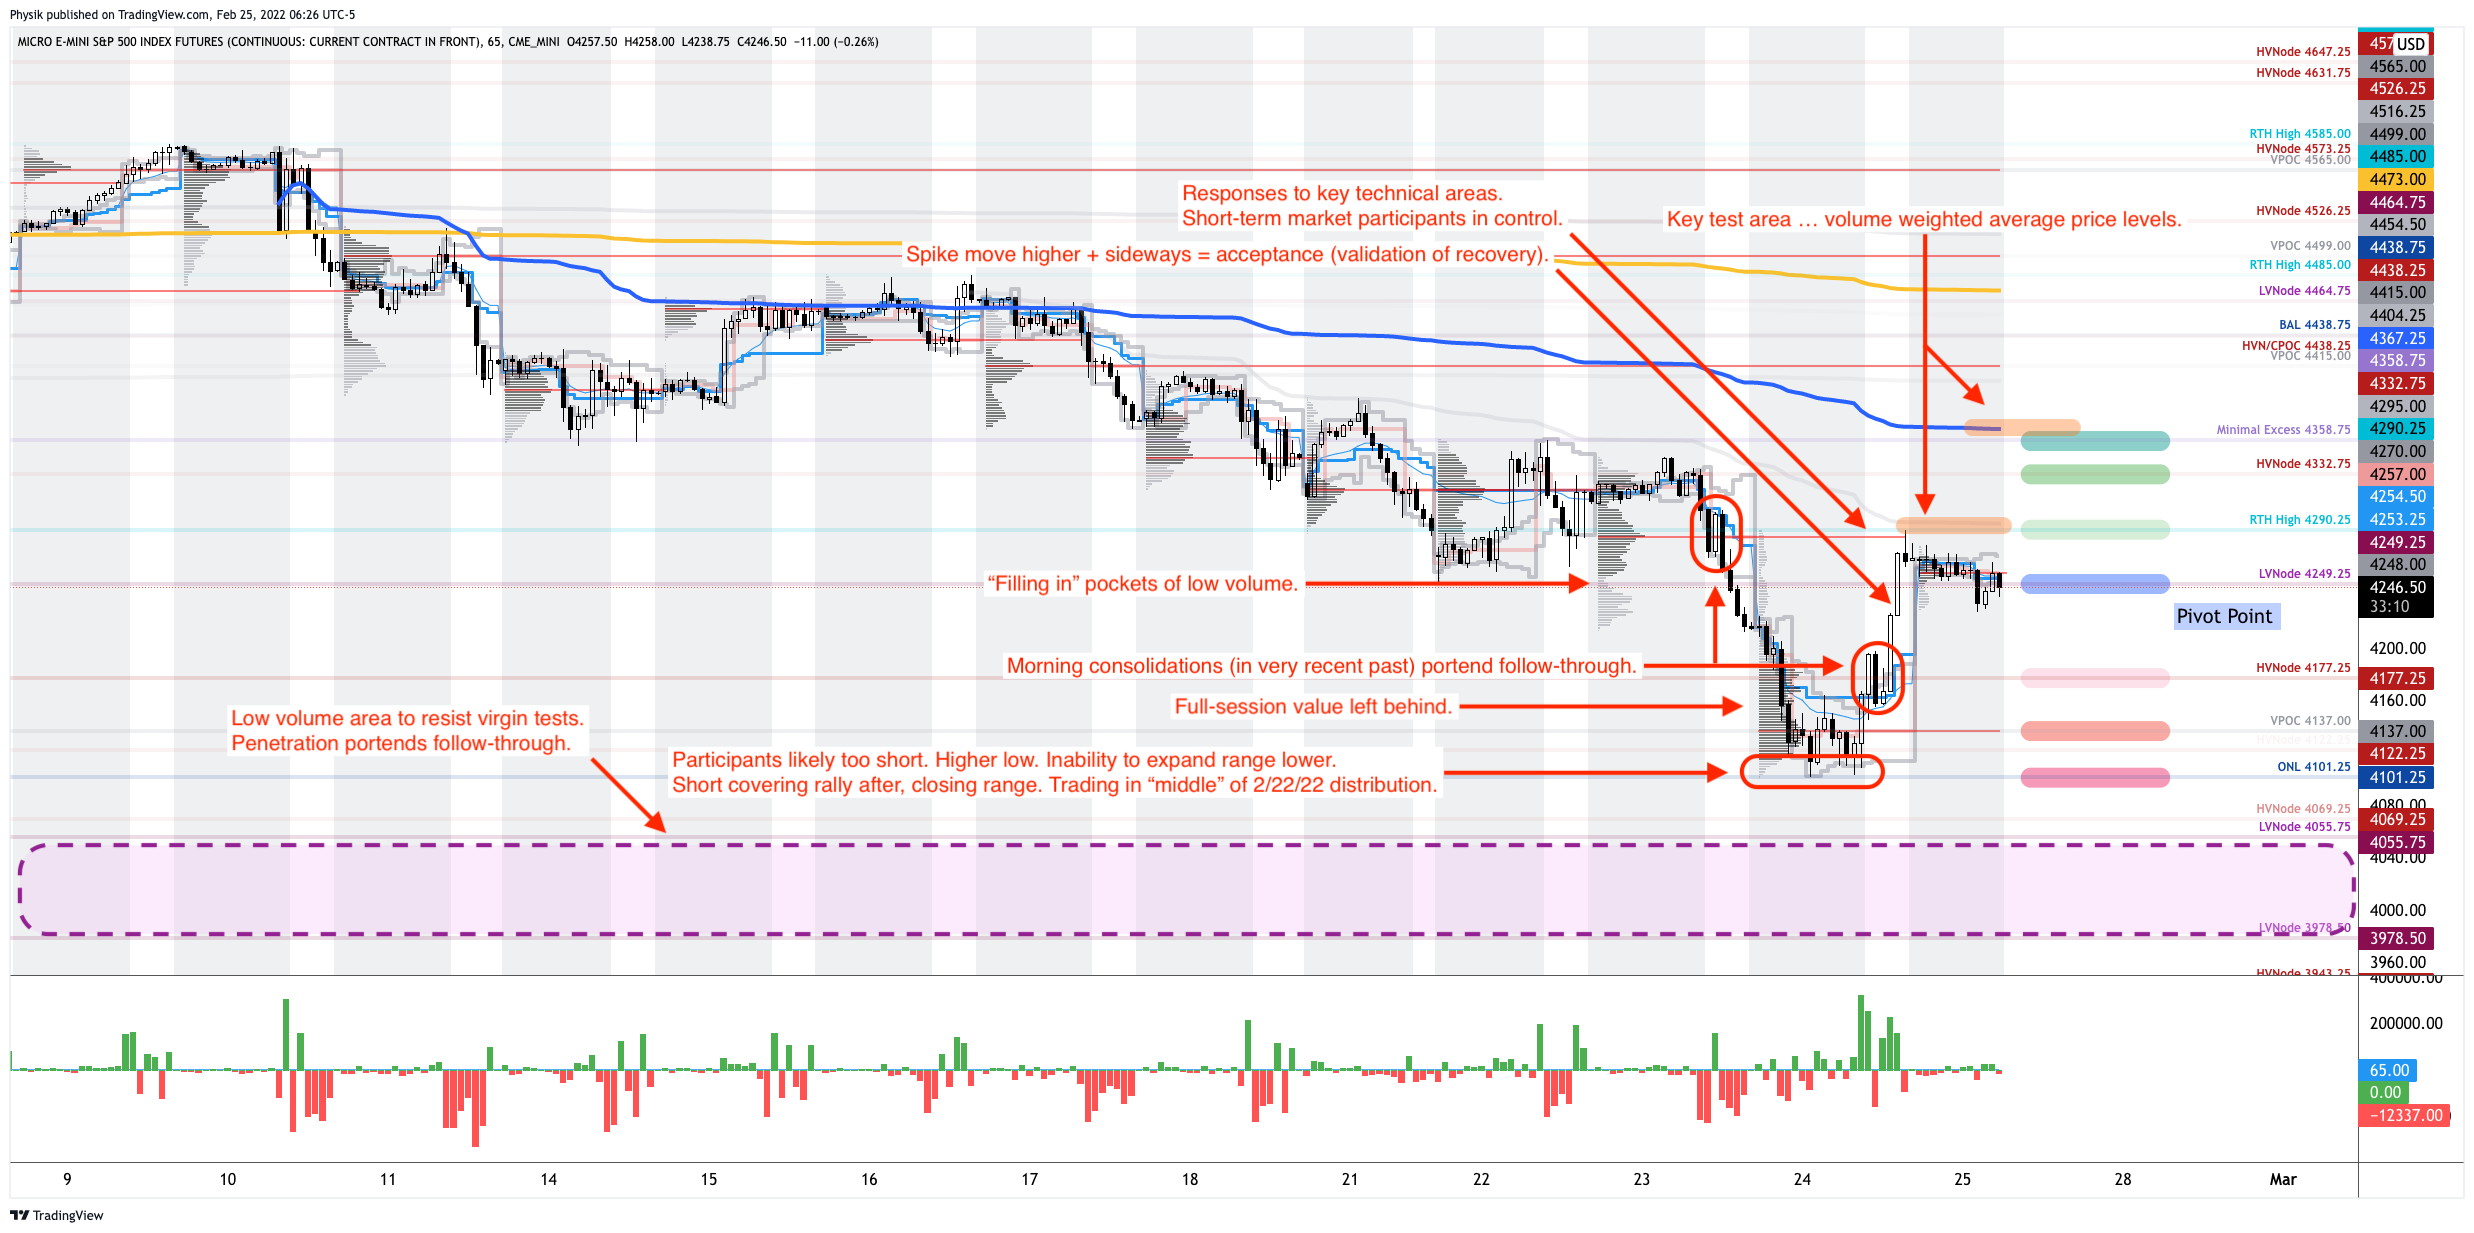
Technical: As of 6:30 AM ET, Friday’s regular session (9:30 AM – 4:00 PM ET), in the S&P 500, will likely open in the upper part of a balanced skewed overnight inventory, inside of prior-range and -value, suggesting a limited potential for immediate directional opportunity.

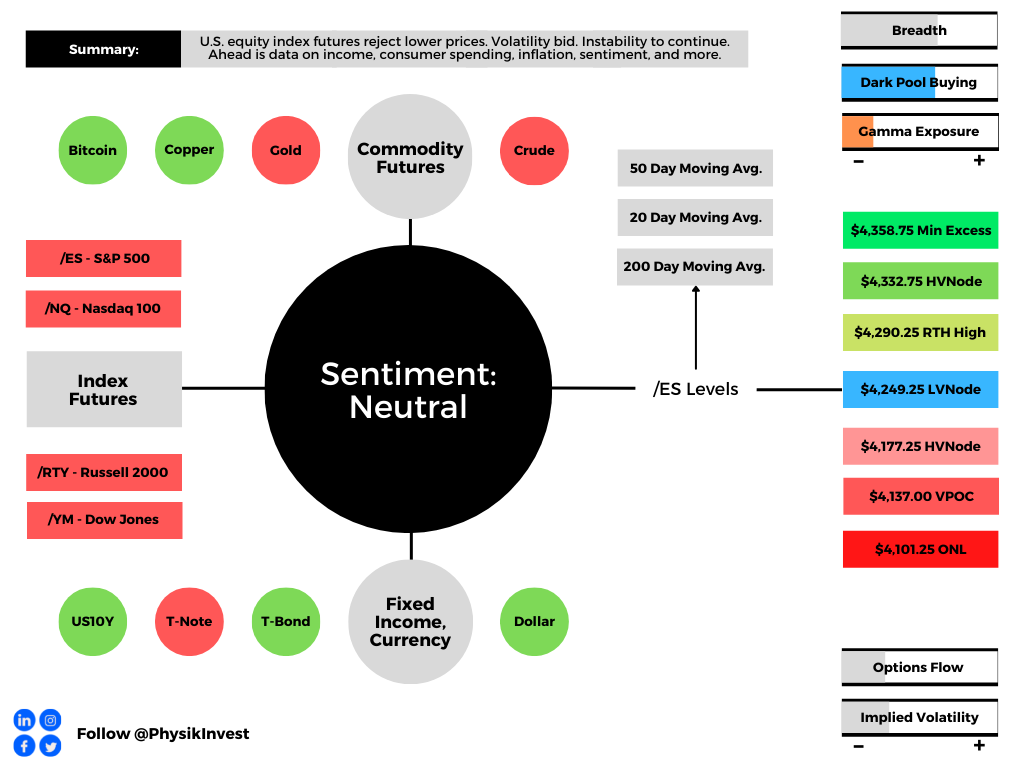
In the best case, the S&P 500 trades higher; activity above the $4,249.25 low volume area (LVNode) puts in play the $4,290.25 regular trade high (RTH High). Initiative trade beyond the RTH High could reach as high as the $4,332.75 high volume area (HVNode) and $4,358.75 minimal excess high, or higher.

In the worst case, the S&P 500 trades lower; activity below the $4,249.25 LVNode puts in play the $4,177.25 HVNode. Initiative trade beyond the HVNode could reach as low as the $4,137.00 untested point of control (VPOC) and $4,101.25 overnight low (ONL), or lower.

Click here to load today’s key levels into the web-based TradingView charting platform. Note that all levels are derived using the 65-minute timeframe. New links are produced, daily.
Graphic: 65-minute profile chart of the Micro E-mini S&P 500 Futures.

Definitions

Overnight Rally Highs (Lows): Typically, there is a low historical probability associated with overnight rally-highs (lows) ending the upside (downside) discovery process.

Volume Areas: A structurally sound market will build on areas of high volume (HVNodes). Should the market trend for long periods of time, it will lack sound structure, identified as low volume areas (LVNodes). LVNodes denote directional conviction and ought to offer support on any test. 

If participants were to auction and find acceptance into areas of prior low volume (LVNodes), then future discovery ought to be volatile and quick as participants look to HVNodes for favorable entry or exit.

POCs: POCs are valuable as they denote areas where two-sided trade was most prevalent in a prior day session. Participants will respond to future tests of value as they offer favorable entry and exit.

Excess: A proper end to price discovery; the market travels too far while advertising prices. Responsive, other-timeframe (OTF) participants aggressively enter the market, leaving tails or gaps which denote unfair prices.

About

After years of self-education, strategy development, mentorship, and trial-and-error, Renato Leonard Capelj began trading full-time and founded Physik Invest to detail his methods, research, and performance in the markets.

Capelj is also a Benzinga finance and technology reporter interviewing the likes of Shark Tank’s Kevin O’Leary, JC2 Ventures’ John Chambers, FTX’s Sam Bankman-Fried, and ARK Invest’s Catherine Wood, as well as a SpotGamma contributor developing insights around impactful options market dynamics.

Disclaimer

Physik Invest does not carry the right to provide advice.

In no way should the materials herein be construed as advice. Derivatives carry a substantial risk of loss. All content is for informational purposes only.

Categories
Commentary

Daily Brief For February 10, 2022

Editor’s Note: The Daily Brief is a free glimpse into the prevailing fundamental and technical drivers of U.S. equity market products. Join the 200+ that read this report daily, below!

What Happened

Overnight, equity index futures auctioned off recovery highs, with bonds. Most commodity products held a bid, as did measures of equity index implied volatility (IV). 

Ahead is data on Jobless Claims, the Consumer Price Index (8:30 AM ET), the Federal Budget (2:00 PM ET), and Fed-speak (7:00 PM ET).

Graphic updated 6:50 AM ET. Sentiment Neutral if expected /ES open is inside of the prior day’s range. /ES levels are derived from the profile graphic at the bottom of the following section. Levels may have changed since initially quoted; click here for the latest levels. SqueezeMetrics Dark Pool Index (DIX) and Gamma (GEX) calculations are based on where the prior day’s reading falls with respect to the MAX and MIN of all occurrences available. A higher DIX is bullish. At the same time, the lower the GEX, the more (expected) volatility. Learn the implications of volatility, direction, and moneyness. SHIFT data used for S&P 500 (INDEX: SPX) options activity. Note that options flow is sorted by the call premium spent; if more positive, then more was spent on call options. Breadth reflects a reading of the prior day’s NYSE Advance/Decline indicator. VIX reflects a current reading of the CBOE Volatility Index (INDEX: VIX) from 0-100.

What To Expect

Fundamental: Participants have readied themselves for data on inflation.

According to Nordea Bank’s (OTC: NRDBY) research, though January inflation will be higher, ultimately leading to volatility in bonds and equities, there will be a moderation in momentum.

The headline figure may print at 7.4% y/y (consensus: 7.2%) while core inflation may print 5.9% y/y (consensus: 5.9%). This is after CPI basket weights were updated and show an increased weight towards the prices that are rising the most (used cars and shelter costs).

“An above-consensus print could imply frontloading of hikes and increased speculation in a 50bp March-hike,” Nordea’s Philip Maldia Madsen and Helene Østergaard explain. 

“Frontloading rate hikes support the USD, but substantial gains may require higher terminal rates pricing (more hikes priced, not just faster).”

Graphic: Via TS Lombard. Taken from The Market Ear. Market prices in more than five rate hikes in 2022.

This is as U.S. labor conditions have tightened markedly, fueling a “sell-off in the short-end of the USD curve as inflation risks remain historically high.”

Graphic: Via Nordea, “the million-dollar question for 2022 remains whether wage growth will persist as base effects start to kick in.”

Taken together, data points to the Federal Reserve staying hawkish and a continued risk in shorter-duration bonds. 

Andreas Steno Larsen of Heimstaden, who this newsletter quoted, yesterday, has explained that despite inflation printing higher in Q1, the trends will shift in Q2-Q4, given new CPI weights.

“The changes made by the BLS hence provide a net/net negative impact on inflation down the line (likely during H2-2022 already), but not before another positive tilt to inflation is seen in the very short-term.”

Graphic: Via Deutsche Bank (NYSE: DB), inflation proving stickier.

What is the outlook for bonds and tech? Steno Larsen suggests it is benign. 

“I don’t really fear the planned QT from the Fed in that regards either,” he elaborates. 

“We will not see a strong negative USD liquidity effect from QT initially as the gap between the total amount of printed USD reserves and the current amount of USD reserves available to the banking system will act as a buffer once the Fed starts bringing down the balance sheet size (QT).”

Graphic: Via Steno Larsen, “USD reserves currently parked at the reverse repo will flow into T-bills once QT commences effectively leaving USD liquidity unchanged as frozen reverse repo liquidity will be unleashed into the system, … [mitigating] the adverse effects of the Fed trying to bring down the balance sheet size again, and this is in sharp contrast to the QT process of 2017-2018.”

Positioning: The effects of continued volatility compression contended with demand for protection, yesterday.

Graphic: VIX term structure continues to compress. This solicits flows that may bolster a price rise.

In the face of a sort-of upward drift, participants legged into negative delta (-delta) trades that offered them positive exposure to the downside. 

Below is a chart of SpotGamma’s (beta) Hedging Impact of Real-Time Options indicator. Notice the trend in the blue (put) and orange (call) lines. This trend denotes demand for -delta (call selling and put buying) which translates to pressure from dealers who are selling underlying (adding -delta) against their positive delta (+delta) options exposure.

Graphic: SpotGamma’s HIRO indicator for the SPDR S&P 500 ETF Trust (NYSE: SPY).

As stated, the pressure from this divergence was offset by continued compression in volatility; as time and volatility trend to zero, the supportive hedging flows with respect to time (charm) and volatility (vanna), along with “passive buying support,” took from the negative implications of customer demand for protection.

Overall, similar to yesterday, buying proxies still point to modest bullishness.

Graphic: Via @HalfersPower, the forward return distribution for SPY when implied volatility less realized volatility is between -20 and -10. “VRP (30 Day ATM Implied Volatility – 21 Day Realized Volatility (Y-Z) is the most deeply negative since the 2020 crash at -12 pts (hitting as low as -14 on Wednesday).”

Technical: As of 6:30 AM ET, Monday’s regular session (9:30 AM – 4:00 PM ET), in the S&P 500, will likely open in the middle part of a negatively skewed overnight inventory, inside of prior-range and -value, suggesting a limited potential for immediate directional opportunity.

In the best case, the S&P 500 trades higher; activity above the $4,573.25 high volume area (HVNode) puts in play the $4,586.00 regular trade high (RTH High). Initiative trade beyond the RTH High could reach as high as the $4,631.75 and $4,647.25 HVNodes, or higher.

In the worst case, the S&P 500 trades lower; activity below the $4,573.25 HVNode puts in play the $4,554.50 RTH Low. Initiative trade beyond the RTH Low could reach as low as the $4,526.25 HVNode and $4,473.00 VPOC, or lower.

Click here to load today’s key levels into the web-based TradingView charting platform. Note that all levels are derived using the 65-minute timeframe. New links are produced, daily.
Graphic: 65-minute profile chart of the Micro E-mini S&P 500 Futures.

What People Are Saying

Definitions

Volume Areas: A structurally sound market will build on areas of high volume (HVNodes). Should the market trend for long periods of time, it will lack sound structure, identified as low volume areas (LVNodes). LVNodes denote directional conviction and ought to offer support on any test. 

If participants were to auction and find acceptance into areas of prior low volume (LVNodes), then future discovery ought to be volatile and quick as participants look to HVNodes for favorable entry or exit.

POCs: POCs are valuable as they denote areas where two-sided trade was most prevalent in a prior day session. Participants will respond to future tests of value as they offer favorable entry and exit.

About

After years of self-education, strategy development, mentorship, and trial-and-error, Renato Leonard Capelj began trading full-time and founded Physik Invest to detail his methods, research, and performance in the markets.

Capelj is also a Benzinga finance and technology reporter interviewing the likes of Shark Tank’s Kevin O’Leary, JC2 Ventures’ John Chambers, FTX’s Sam Bankman-Fried, and ARK Invest’s Catherine Wood, as well as a SpotGamma contributor developing insights around impactful options market dynamics.

Disclaimer

Physik Invest does not carry the right to provide advice.

In no way should the materials herein be construed as advice. Derivatives carry a substantial risk of loss. All content is for informational purposes only.

Categories
Commentary

Daily Brief For February 9, 2022

Editor’s Note: The Daily Brief is a free glimpse into the prevailing fundamental and technical drivers of U.S. equity market products. Join the 200+ that read this report daily, below!

What Happened

Overnight, equity index futures broke the confines of tight consolidation. 

As stated some commentaries ago, the odds pointed to a continued counter-trend rally; volatility compression, coupled with metrics that point to buying support, was to bolster follow-through.

Ahead is data on Wholesale Inventories (10:00 AM ET), as well as Fed-speak by Governor Michelle Bowman (10:30 AM ET) and President Loretta Mester (12:00 PM ET).

Graphic updated 6:30 AM ET. Sentiment Risk-On if expected /ES open is above the prior day’s range. /ES levels are derived from the profile graphic at the bottom of the following section. Levels may have changed since initially quoted; click here for the latest levels. SqueezeMetrics Dark Pool Index (DIX) and Gamma (GEX) calculations are based on where the prior day’s reading falls with respect to the MAX and MIN of all occurrences available. A higher DIX is bullish. At the same time, the lower the GEX, the more (expected) volatility. Learn the implications of volatility, direction, and moneyness. SHIFT data used for S&P 500 (INDEX: SPX) options activity. Note that options flow is sorted by the call premium spent; if more positive, then more was spent on call options. Breadth reflects a reading of the prior day’s NYSE Advance/Decline indicator. VIX reflects a current reading of the CBOE Volatility Index (INDEX: VIX) from 0-100.

What To Expect

Fundamental: Equity indices resolve higher in the face of hawkishness from the Federal Reserve (Fed) and data showing slowing growth at home and abroad.

“Fiscal policy is turning more restrictive, the Q4 inventory boost is now behind us, and the financial conditions impulse will go from sharply positive in 2021 to (at least) modestly negative in 2022,” Goldman Sachs Group Inc (NYSE: GS) strategists explain. 

“For these reasons, our 2022 GDP forecast of 2¼% on a Q4/Q4 basis is 0.8pp below the latest Bloomberg consensus and 1.8pp below the FOMC’s last published forecast (as of the December meeting).”

Graphic: Via Goldman Sachs. Retrieved through The Market Ear.

At the same time, according to Moody’s Corporation (NYSE: MCO), the Fed has not pushed “against market expectations for three to four rate hikes this year.” 

Instead, Chair Jerome Powell “signaled the central bank will have zero tolerance for any upside surprises in inflation.”

To note, though, the consensus expectation – five rate hikes or more – is ahead of itself, according to Andreas Steno Larsen of Heimstaden. 

“Direct transfers and fiscal deficits are behind the current inflation spikes,” he explains. “If they were the root causes of inflation, they will also turn into the root causes of disinflation again during H2-2022.”

Steno Larsen adds that the 20y1y and 2y1y curve is inverted, “as it was when the 2015-2018 hiking cycle was very mature,” and only three hikes occurred after inversion.

Graphic: “Good luck hiking 6-7 times this year, … 3-4 max,” via Steno Larsen

The net effect, according to Steno Larsen, is that long bond yields will likely not rise over the next quarters; rate-sensitive technology and innovation products may rebound while cyclical assets may suffer.

In line with the above comments is the average S&P 500 trend into Fed tightening cycles. 

Graphic: Retrieved from Callum Thomas’ Weekly S&P 500 ChartStorm newsletter.

Positioning: Ranges compressed as participants committed capital to bets on lower volatility.

Such bets (expressed via the selling of protection on both sides of the market) left counterparties warehousing the other side (long puts and calls). 

In hedging this exposure on a move higher, the counterparties increased +delta exposure is offset via the addition in -delta (sell futures)

In hedging this exposure on a move lower, the counterparties increased -delta exposure is offset via the addition of +delta (buy futures).

Moreover, as (1) participants continue to bet on lower ranges and (2) time and volatility trend to zero for the expiries most open interest is concentrated in, gamma, the sensitivity of options to changes in underlying price (delta) increases. 

What that means is that counterparties’ near-the-money exposure to options delta rises and portends increased liquidity (e.g., the counterparty will buy futures into weakness and sell futures into strength).

Given a lower liquidity environment, these hedging flows therefore have a bigger impact.

Graphic: Via SpotGamma, “gamma flows increasingly important in a lower liquidity environment. If the counterparty is taking on more exposure to positive gamma, then their addition of liquidity to hedge may suppress ranges.”

The resolve of this consolidation, coupled with decaying out-of-the-money protection and supportive hedging flows with respect to time (charm) and volatility (vanna), and buying proxies, point to “[m]odest bullishness on the 1-month timeframe.”

Graphic: Data via SqueezeMetrics. Graph via Physik Invest.

Technical: As of 6:30 AM ET, Wednesday’s regular session (9:30 AM – 4:00 PM ET), in the S&P 500, will likely open in the upper part of a positively skewed overnight inventory, outside of prior-range and -value, suggesting a potential for immediate directional opportunity.

Balance-Break + Gap Scenarios: A change in the market (i.e., the transition from two-time frame trade, or balance, to one-time frame trade, or trend) is occurring.

Monitor for acceptance (i.e., more than 1-hour of trade) outside of the balance area. 

Leaving value behind on a gap-fill or failing to fill a gap (i.e., remaining outside of the prior session’s range) is a go-with indicator. 

Rejection (i.e., return inside of balance) portends a move to the opposite end of the balance.

In the best case, the S&P 500 trades higher; activity above the $4,555.00 untested point of control (VPOC) puts in play the $4,586.00 regular trade high (RTH High). Initiative trade beyond the RTH High could reach as high as the $4,631.75 and $4,647.25 HVNode, or higher.

In the worst case, the S&P 500 trades lower; activity below the $4,555.00 VPOC puts in play the $4,526.25 HVNode. Initiative trade beyond the $4,526.25 HVNode could reach as low as the $4,473.00 VPOC and $4,438.25 HVNode, or lower.

Consideration: All equity index products have resolved tight consolidation’s higher. The Nasdaq 100 and Russell 2000 are the furthest away from clear areas of resistance. 

On the other hand, the S&P 500 and Dow Jones Industrial Average have little in the way of higher prices.

Graphic: Updated 2/8/2022. Anchored Volume Weighted Average Price (VWAP) analysis via Physik Invest. Notice Dow Jones Industrial Average (bottom right) and S&P 500 (top left) strength, as well as Nasdaq 100 (top right) and Russell 2000 (bottom left) weakness. Key pivots marked off.
Click here to load today’s key levels into the web-based TradingView charting platform. Note that all levels are derived using the 65-minute timeframe. New links are produced, daily.
Graphic: 65-minute profile chart of the Micro E-mini S&P 500 Futures.

What People Are Saying

Definitions

Volume Areas: A structurally sound market will build on areas of high volume (HVNodes). Should the market trend for long periods of time, it will lack sound structure, identified as low volume areas (LVNodes). LVNodes denote directional conviction and ought to offer support on any test. 

If participants were to auction and find acceptance into areas of prior low volume (LVNodes), then future discovery ought to be volatile and quick as participants look to HVNodes for favorable entry or exit.

POCs: POCs are valuable as they denote areas where two-sided trade was most prevalent in a prior day session. Participants will respond to future tests of value as they offer favorable entry and exit.

About

After years of self-education, strategy development, mentorship, and trial-and-error, Renato Leonard Capelj began trading full-time and founded Physik Invest to detail his methods, research, and performance in the markets.

Capelj is also a Benzinga finance and technology reporter interviewing the likes of Shark Tank’s Kevin O’Leary, JC2 Ventures’ John Chambers, FTX’s Sam Bankman-Fried, and ARK Invest’s Catherine Wood, as well as a SpotGamma contributor developing insights around impactful options market dynamics.

Disclaimer

Physik Invest does not carry the right to provide advice.

In no way should the materials herein be construed as advice. Derivatives carry a substantial risk of loss. All content is for informational purposes only.