Categories
Results

Alpha Drop

Hedge fund week just wrapped up here in Miami, and I had the chance to catch up with some industry friends like fellow Croatian and former podcast guest Vuk Vukovic. A big shoutout to Vuk and the incredible success of Oraclum Capital, his NYC-based hedge fund! Beyond motivation, these conversations always get us thinking—about how far we’ve come, the lessons learned, and the market patterns emerging. So, today, we’re switching things up a bit.

Breaking Down Thinking vs. Acting in Real-Time

These newsletters often dive deeply into trade theory—how to form opinions, identify dislocations, and structure trades to take advantage of them. Thinking critically about market context is just as important, if not more so, than taking action, as outlined in the case study linked here. But let’s be honest: we don’t always have the luxury of testing every idea before committing capital. Sometimes, decisions must be made on the spot, and more often than not, they’re more straightforward than they appear—they have to be.

To illustrate this, I share a slightly refined diary entry from a year ago, offering reflection and motivation. Market highs, uncertainty, and the fear of missing out create a lot of noise—but they also spark new ways of thinking. I hope this record and perspective spark new ideas on when and how to engage in markets this year ahead.

Take your time, enjoy the read, and try to focus on the bigger picture rather than getting lost in the details. Stay tuned for upcoming podcasts, explainers, and part two of the Market Tremors newsletter. Cheers, and let’s make some money.


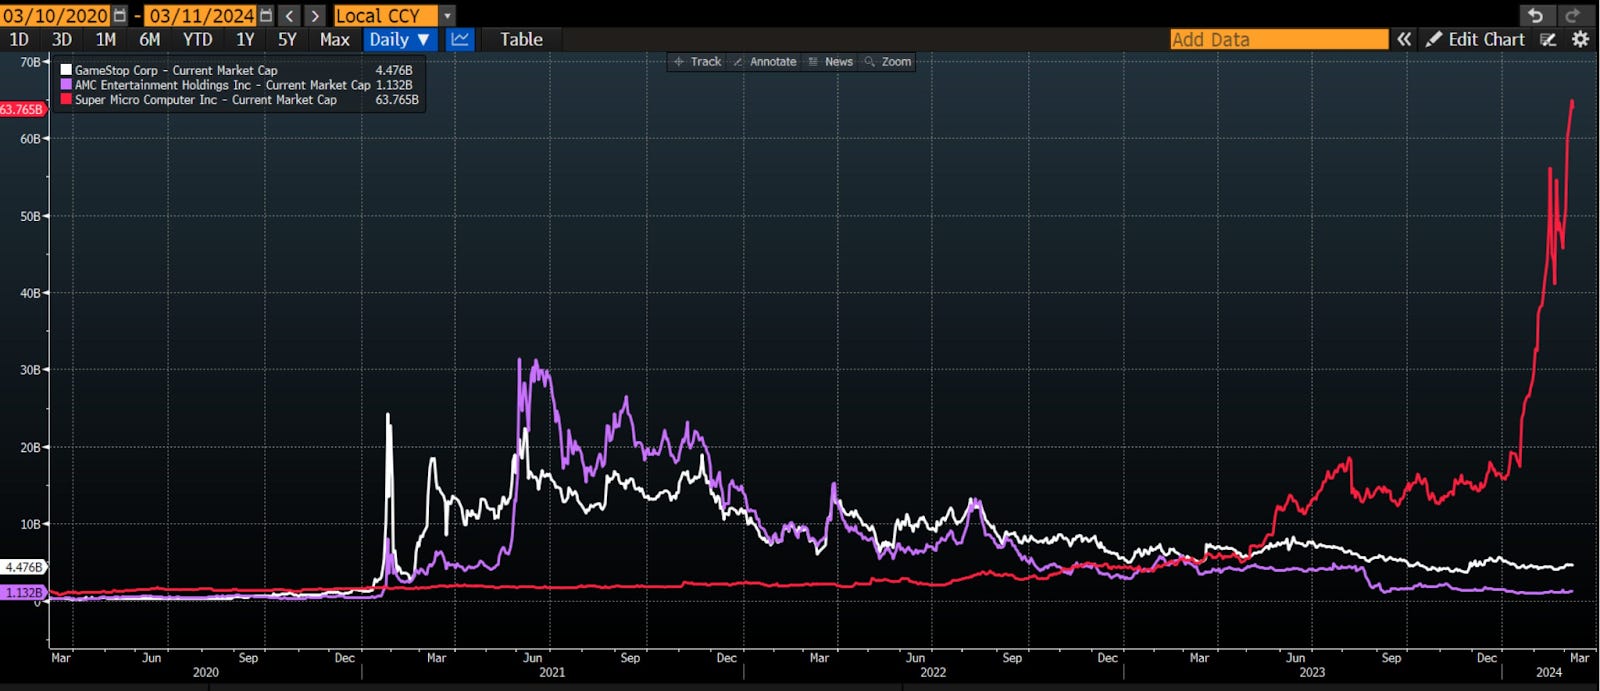
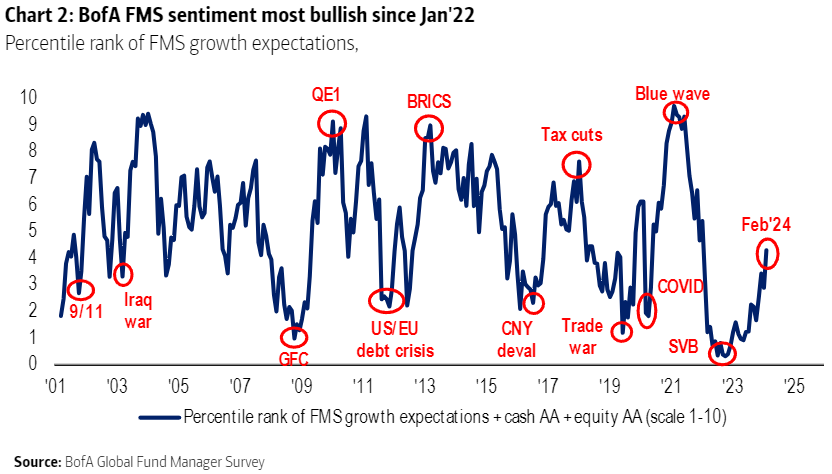
On February 16, 2024, my trading partner Justin pointed out a rich, elevated call skew in Super Micro Computer Inc. (NASDAQ: SMCI). This occurs when out-of-the-money call options carry higher implied volatility than at-the-money or in-the-money options, often signaling strong demand for upside exposure. At that point, SMCI had been climbing steadily for weeks, with the charts suggesting a parabolic advance and an imminent climax.

I spotted 200-wide 1×2 ratio spreads that could be opened for credit. Simply put, a ratio spread is an options structure in which you buy a contract at one strike and sell two (or more) at another, further away. I often use such a structure when volatility is more steeply skewed, meaning certain strikes—like deep out-of-the-money (OTM) calls—have much higher implied volatility (IV) because traders expect more risk or extreme moves in that direction.

IV is the amount of movement traders anticipate. A higher IV means the market expects more significant price swings, leading to more expensive options, while a lower IV suggests less expected movement, making options cheaper—factors like earnings reports, economic data, or overall market uncertainty influence IV.

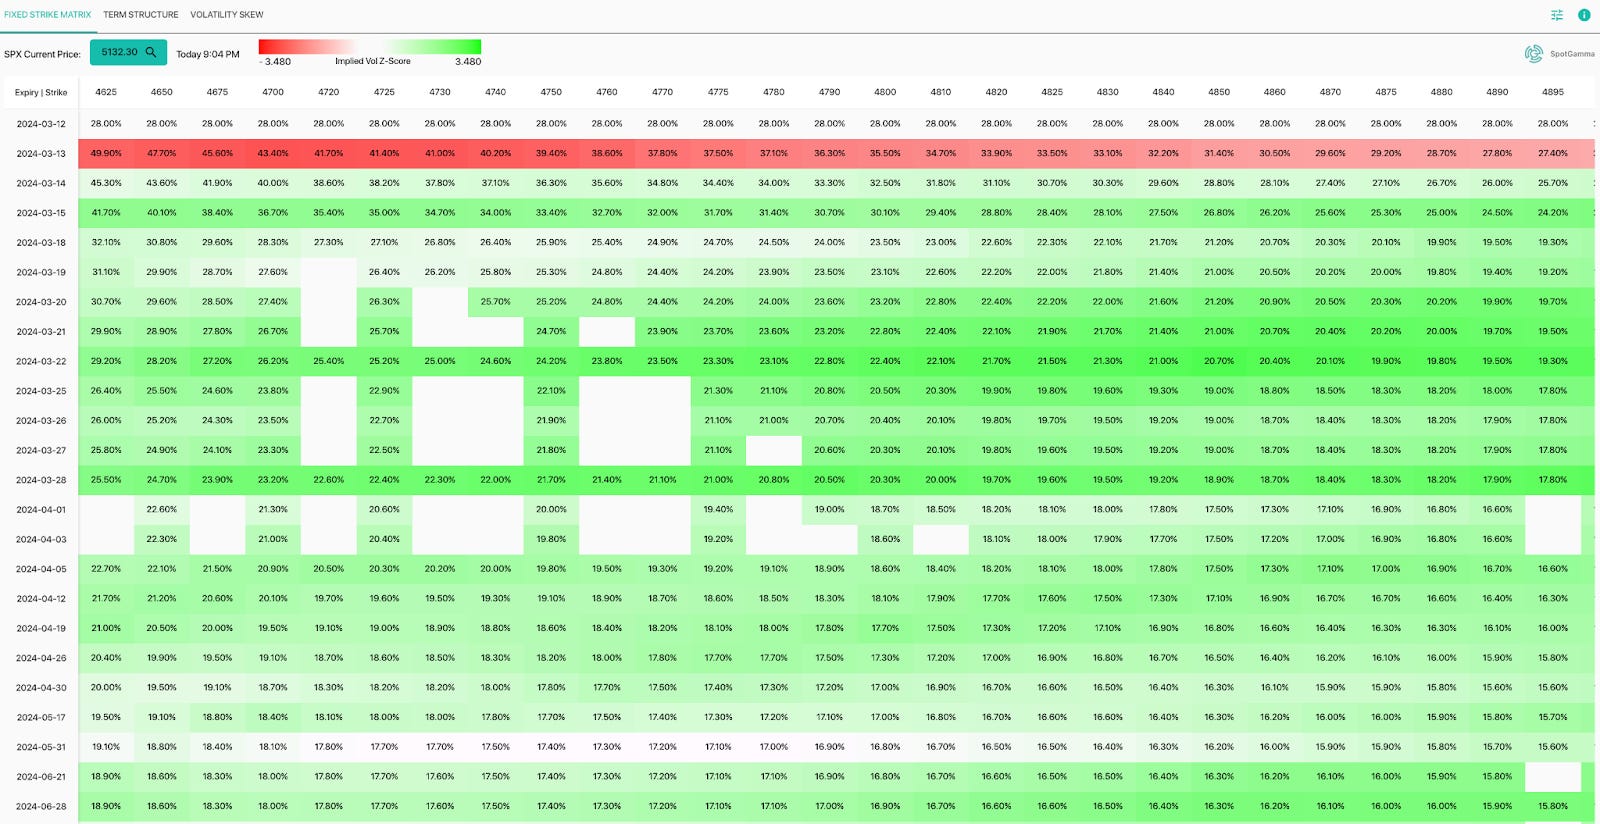
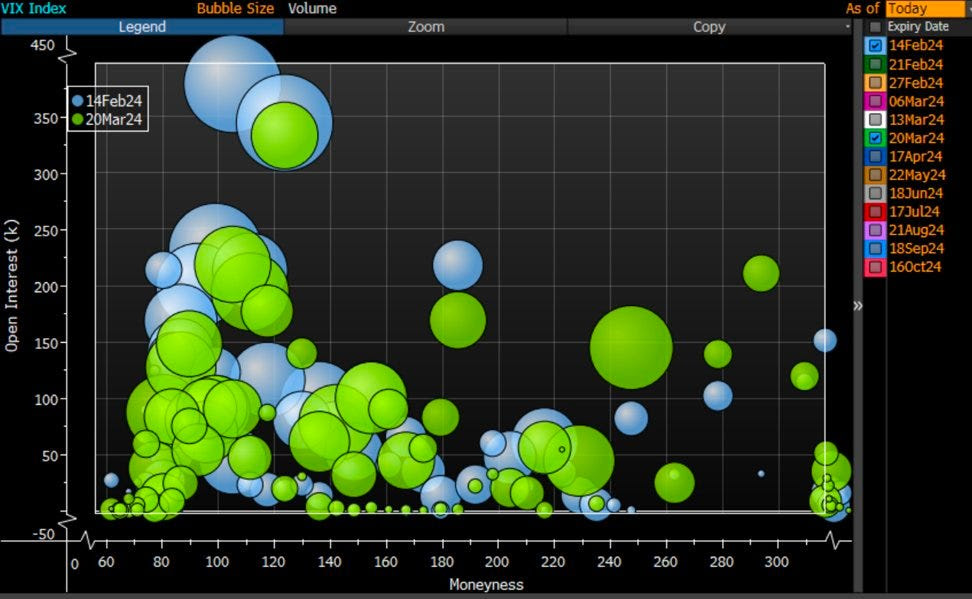
In this case, using Schwab’s thinkorswim lookback feature, implied volatility on the call side ranged from the mid-100s near the current market price to over 200% at the furthest strike. On the put side, things got even wilder—volatility climbed from the mid-100s near the market price to several hundred percent at the farthest strike, as pictured below. When volatility is this high in far-out-of-the-money options, traders are piling in—either looking for protection or betting on a big, unexpected move.

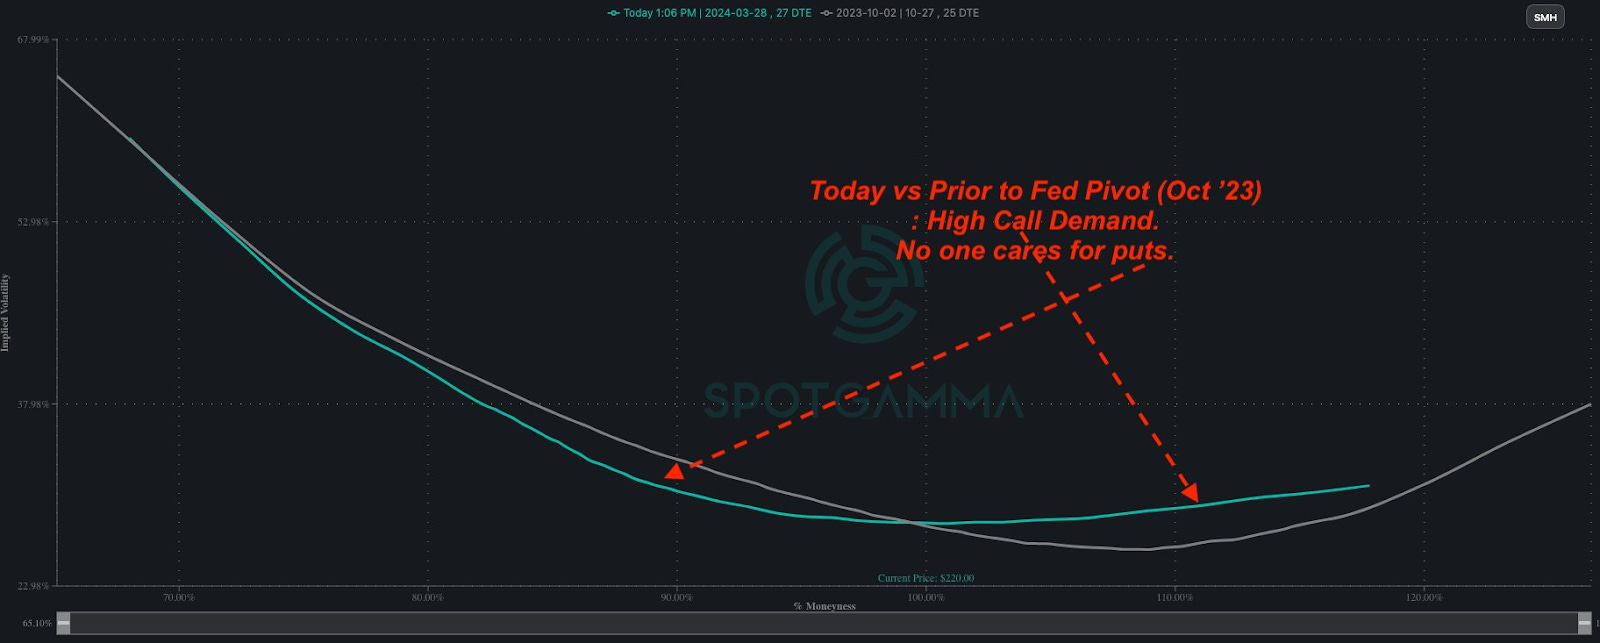
As the stock was pulled back from its highs, we observed that the excitement in call-side volatility had begun to diminish—it wasn’t as intense as it had been a month earlier, according to SpotGamma data. This served as a key signal for us. A declining enthusiasm for calls indicates that traders are less inclined to chase the stock higher. We were prepared to act on this shift, betting that the stock had reached an interim peak; this was great news for us, as our options structures tend to perform best when volatility stabilizes and the stock drifts rather than making significant, protracted moves.

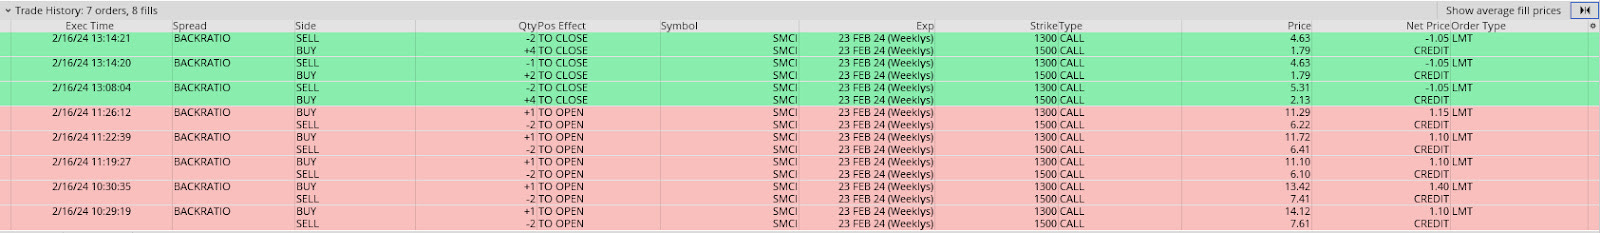
Right after the market opened, the 23 FEB 24 1300/1500 spread flipped from a 0.50 debit to over a 1.00 credit to open. I didn’t catch it right at the start, but about an hour later, I spotted the opportunity. The pricing looked solid—it offered a credit to close at the money—and everything checked out risk-wise according to my rules. So, I decided to dip my toes in with five units, keeping it on the smaller side for this trade. This all went down on February 16.

SOLD -1 1/2 BACKRATIO SMCI 100 (Weeklys) 23 FEB 24 1300/1500 CALL @1.10

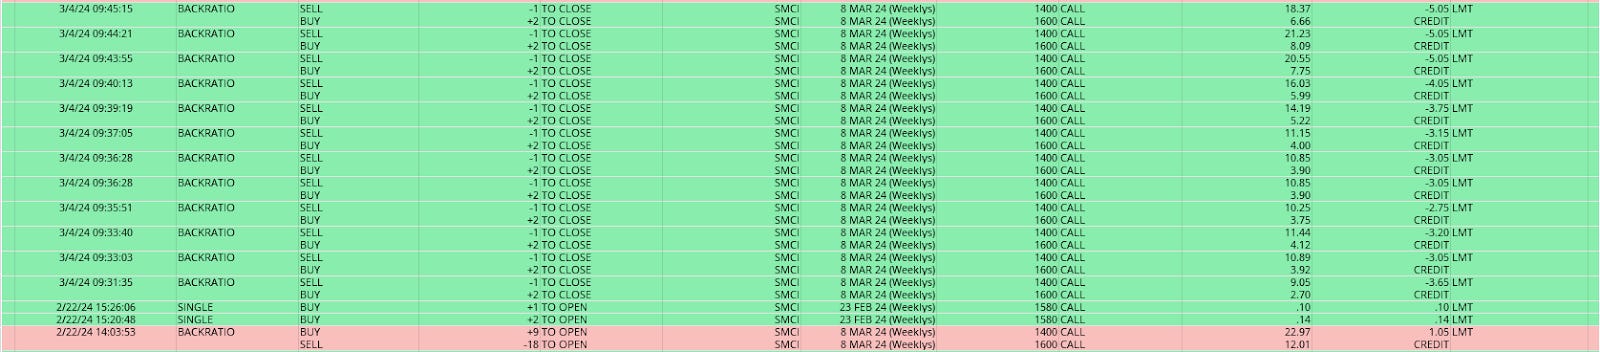
All else equal, if the trade were entirely in the money (ITM), meaning the short strikes are right around the current market price, it would price for about 40.00 credit to close. At the money (ATM), right around the current market price, the structures traded for around 12.00 credit to close. This quick check suggests we’re good to move forward. Here are the orders for one account. You can find a summary screenshot of all orders at the end of this letter.

Given the risk involved in this trade, the abovementioned account could take on a maximum of 8 units. As we’ll see later in this entry, I pushed those limits, possibly going beyond what’s typical for me. However, I justified this by considering the distance between the stock price and the strikes used in the trades, which felt like a safe cushion to work with.

$320,000 (Net Liquidation Value) / $38,000 (Daily Loss at +1 EPR if the Spread’s Long Strike is ATM) = 8.4 units. EPR represents the brokerage firm’s estimate of the maximum expected one-day price range for an underlying security. Net Liquidation Value refers to the total value of a portfolio if all positions were liquidated at current market prices. Here are more details.

A few hours later, implied volatility dropped across the board, with the further out-of-the-money (OTM) options seeing the most significant decline. The implied volatility of the options closest to the stock price fell moderately, while the farther OTM strikes experienced a more substantial drop. This shift worked in our favor and helped make the trade profitable.

The long strike I owned (1300) had an implied volatility of ~190% before, which dropped to ~165% after.

The short strike I sold (1500) had an implied volatility of ~215% before, which dropped to ~180% after.

The trades were closed on the consolidation following the sharp morning liquidation. Here are the trade tickets.

BOT +1 1/2 BACKRATIO SMCI 100 (Weeklys) 23 FEB 24 1300/1500 CALL @-1.05

From the panicked price movement, it looked like people late to the party were just selling off existing positions, not necessarily big new sellers entering the market; the stock might eventually retest those higher levels again. Even with the drop, implied volatility stayed high, which is crucial because it suggests continued uncertainty and anticipation of significant movement.

Given how sharp the sell-off was and how many traders were probably surprised by it, I decided to jump back into the trade on February 20—this time with a bigger position, especially after the long weekend when the market had some time to settle. Strikes and trade tickets follow.

SOLD -1 1/2 BACKRATIO SMCI 100 (Weeklys) 1 MAR 24 1300/1500 CALL @1.10

SOLD -1 1/2 BACKRATIO SMCI 100 (Weeklys) 1 MAR 24 1400/1600 CALL @1.10

SOLD -1 1/2 BACKRATIO SMCI 100 (Weeklys) 1 MAR 24 1350/1550 CALL @1.05

With the liquidation, the trade above was farther away from current prices than the last. Additionally, we moved it to next week’s expiry after the long weekend since it was no longer present for the 23 FEB 24 expiry. The lookback feature on Schwab’s thinkorswim shows implied volatility at the 1300 strike was ~180%, while at the short strikes, it was ~200%.

A quick check of SpotGamma’s implied volatility skew tool reveals a still-elevated call skew. Awesome!

Soon after, despite minor volatility shifts, we added similar trades with strikes that were further from the current price.

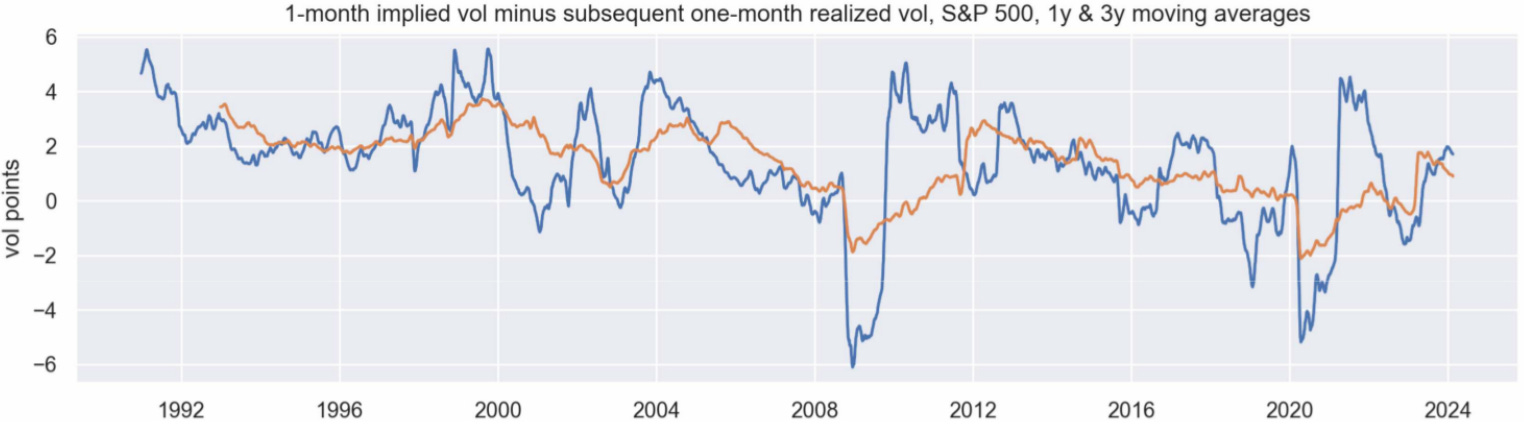
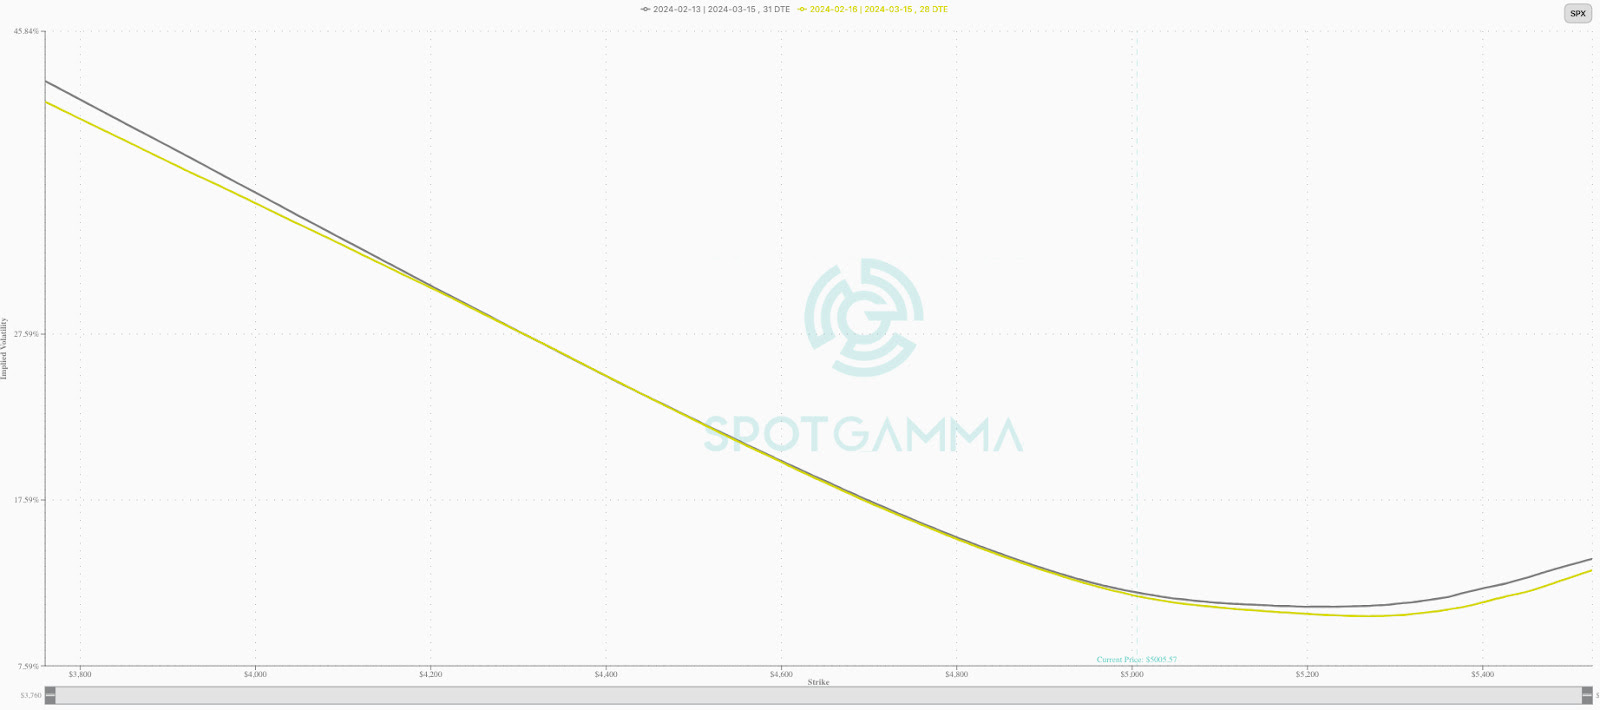
Gauging implied volatility accurately using the lookback feature can be tricky, but we observed that the difference in implied volatility between the strikes was narrowing. This indicated that the volatility skew was “flattening.” In simpler terms, the implied volatility between different strikes was becoming more similar, unlike a steeper skew where the farther strikes have much higher implied volatility. This can be good for the trade.

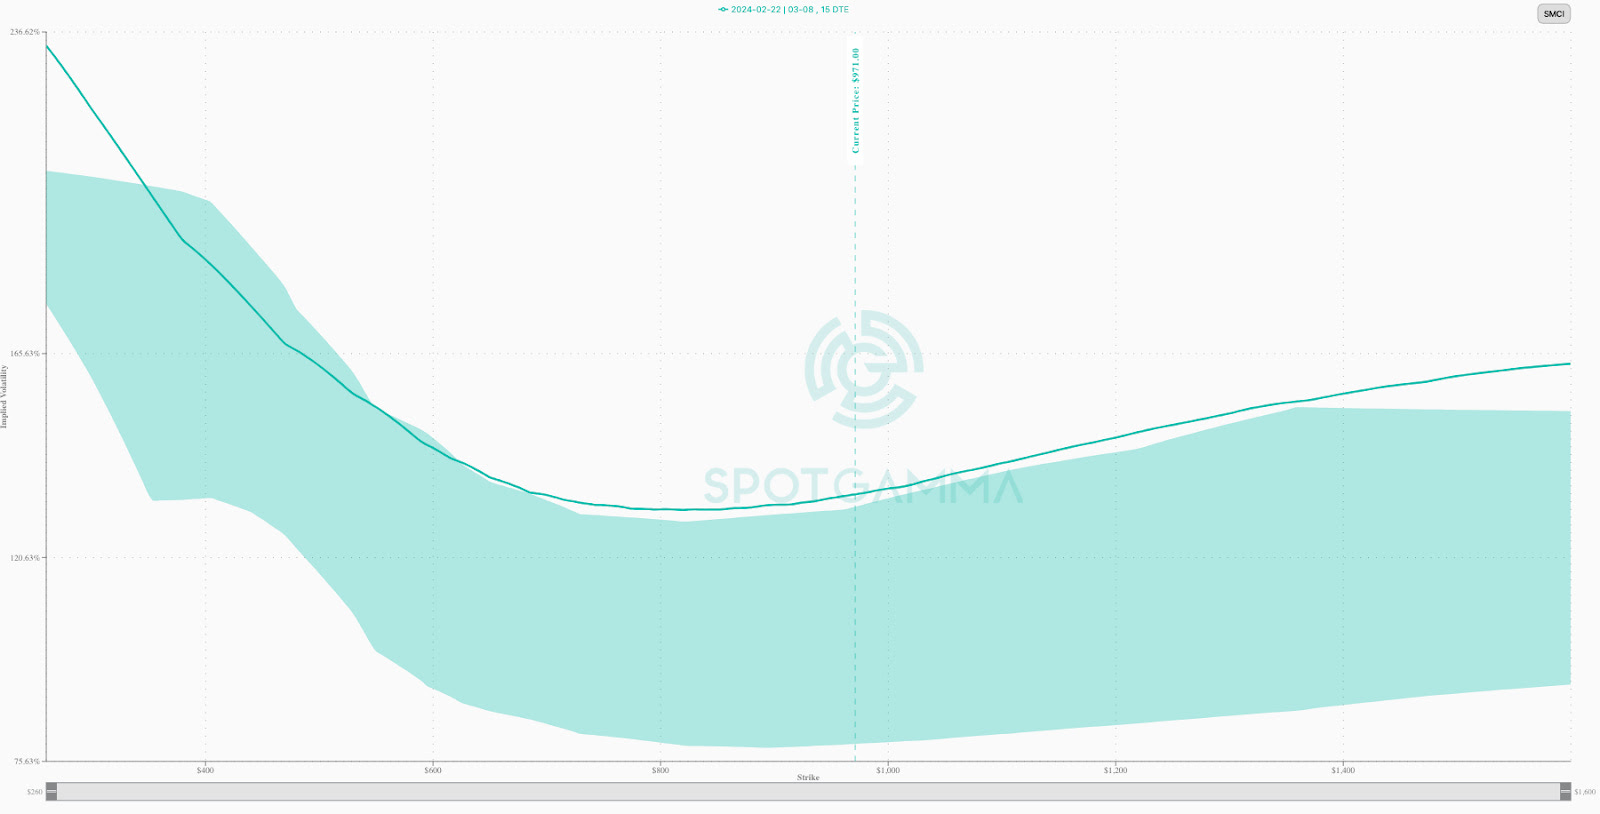
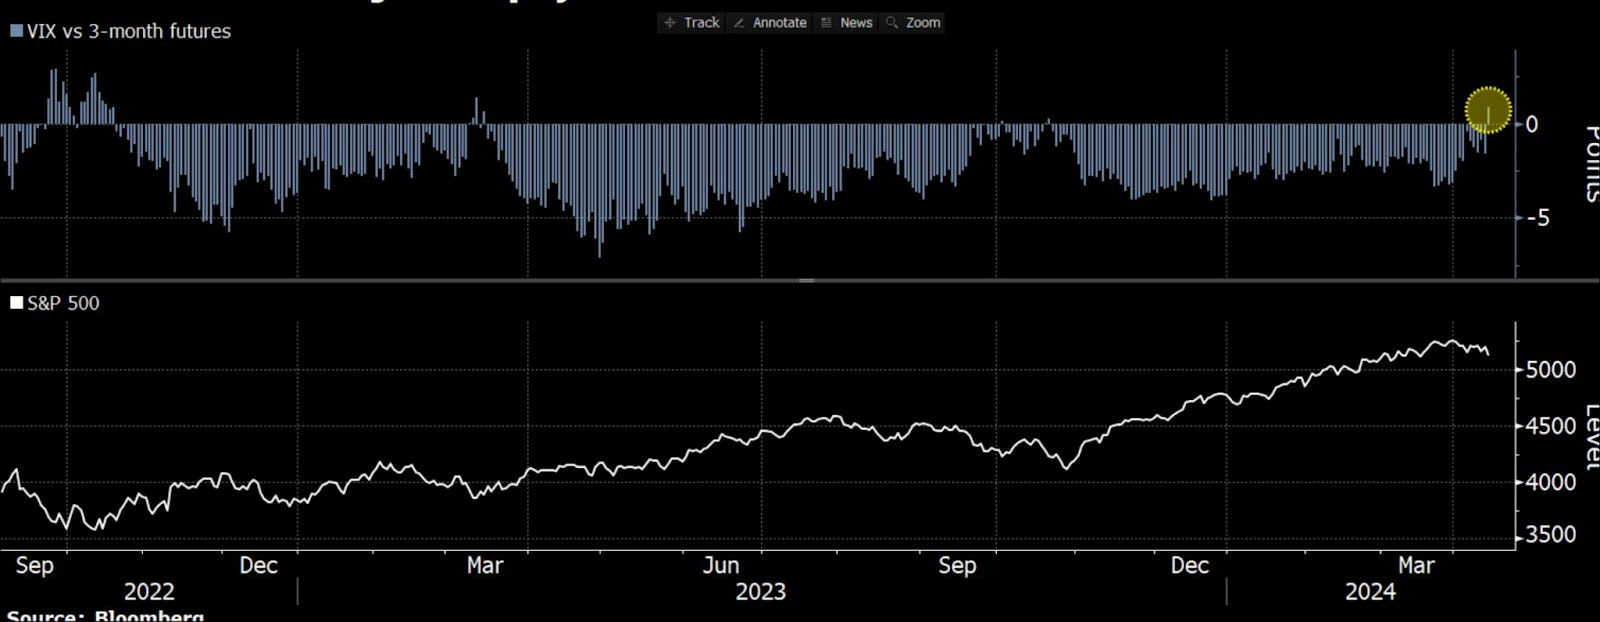
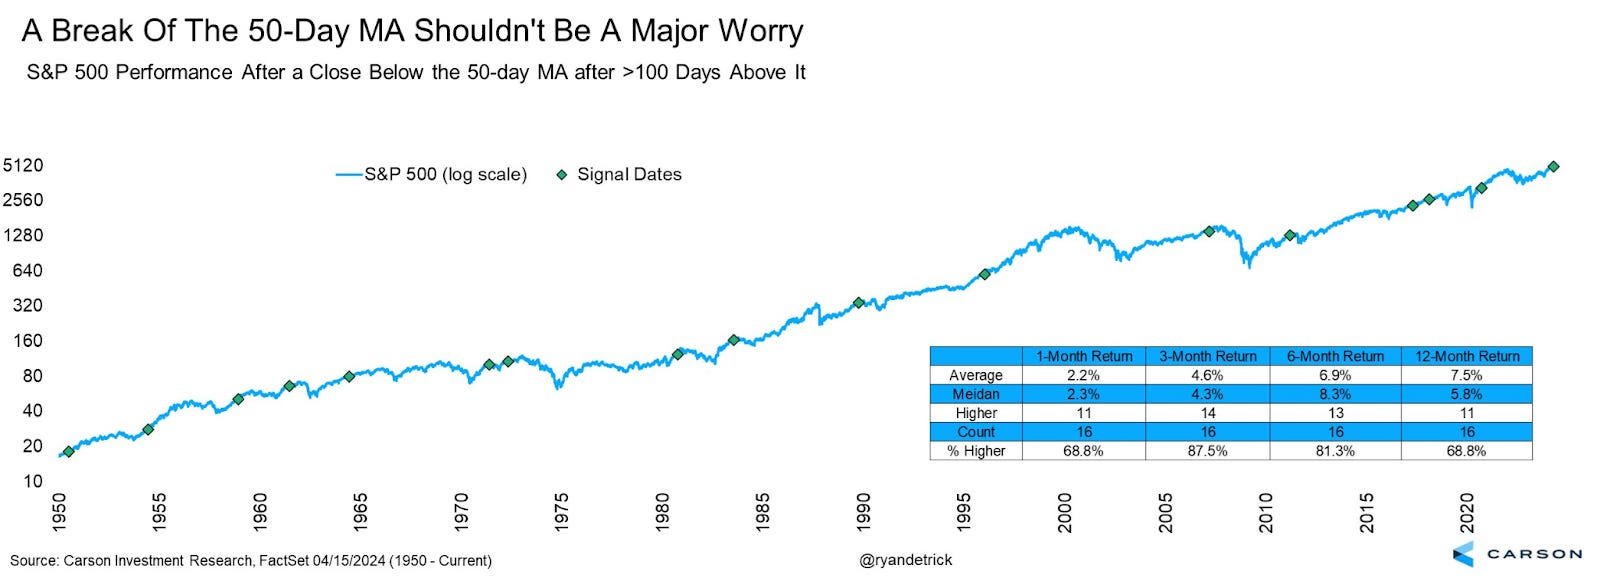
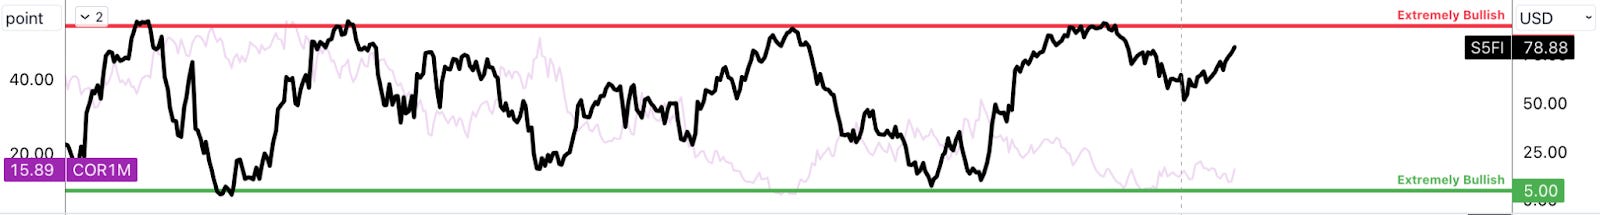
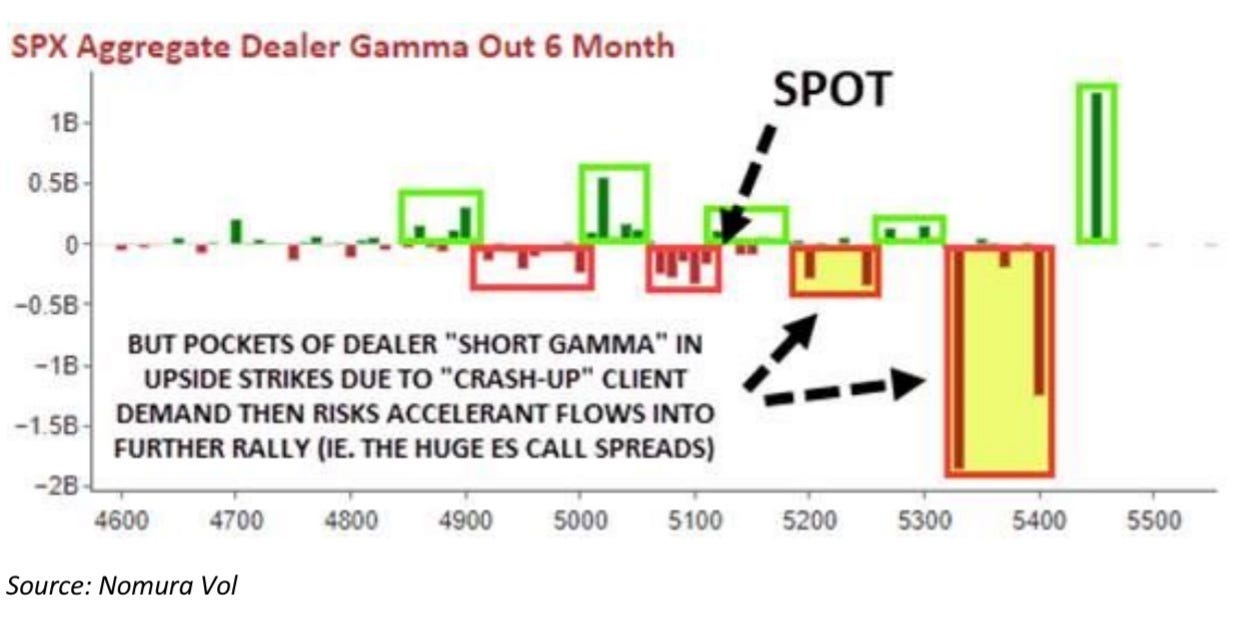
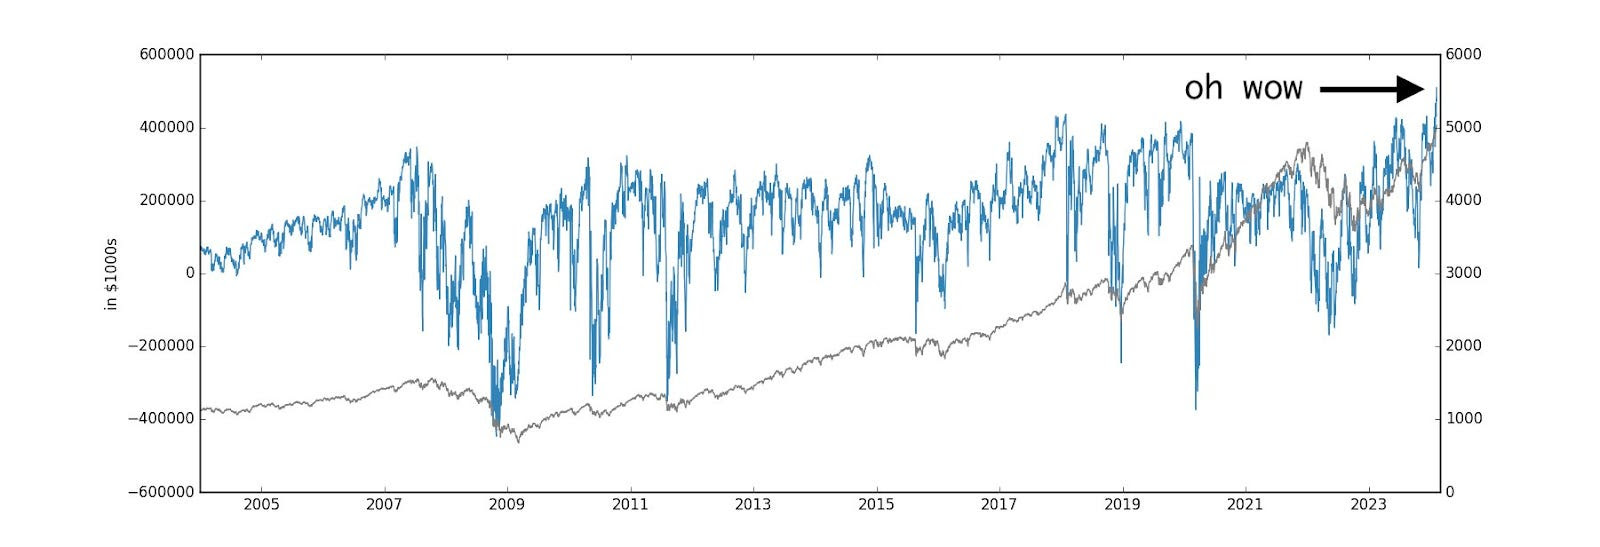
Here’s a chart that illustrates this “flattening” volatility skew. While this example shows the S&P 500, the concept is the same. Pay attention to the blue versus green line!

Anyways, back to the charts. So, here’s the price action. Straight down!

On February 22, we rotated more into similar structures we started working on February 20.

SOLD -1 1/2 BACKRATIO SMCI 100 (Weeklys) 8 MAR 24 1400/1600 CALL @1.10

At the time of entry, lookback showed the implied volatility of the 8 MAR 24 spreads was around 145% for the long and 155% for the short strikes. At the second entry, the volatility spread between the strikes started narrowing. Overall volatility came down, but the difference between the strikes was about the same.

Here’s what the volatility skew looked like at this point. This is a 30-day look back (the shadow).

I ended up closing the 1 MAR 24 spreads on February 22 for up to a 1.00 cr.

BOT +1 1/2 BACKRATIO SMCI 100 (Weeklys) 1 MAR 24 1350/1550 CALL @-.50

Here’s the implied volatility for the 1 MAR 24 options chain. Again, while a bit lower than when we started, the difference between the two is roughly the same. The passage of time is definitely working in our favor, here!

I’ll note that I closed prematurely because underlying price action suggested we could trend higher, with the upper VWAP band as an upside target. The spreads ended up pricing for $1.00 more in credit. Take what you can get, Renato!

The challenge we faced was deciding whether closing and rotating the trade early would lead to additional profits. Ultimately, we rolled the position and made money either way, but this was the thought at the time. In other words, are we doing too much?

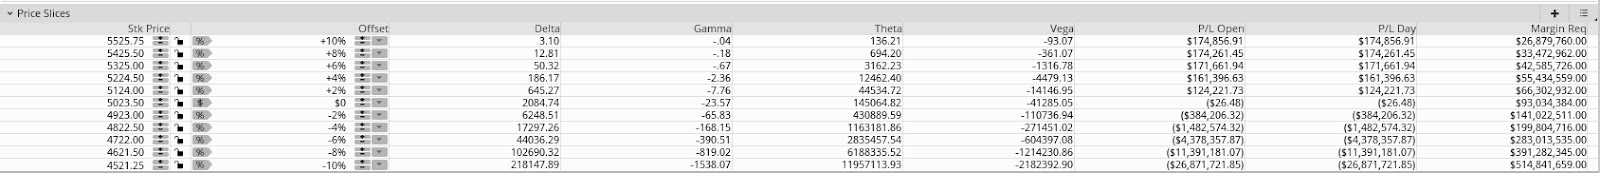
After closing the 1 MAR structure, we added 8 MAR structures on February 22. Trade tickets for one account below. These additions made the position larger than I wanted, so I bought cheaper crash options to manage the margin (the amount of money required to maintain the position) first and foremost. It was a tense moment! Thankfully, with these additions, we stayed within our limits and didn’t breach any safety thresholds.

SOLD -12 1/2 BACKRATIO SMCI 100 (Weeklys) 8 MAR 24 1400/1600 CALL @1.05

BOT +3 SMCI 100 (Weeklys) 23 FEB 24 1580 CALL @.13

At this point, the lookback showed implied volatility for the short strikes was around 160%, while the long strikes were at 150%. The difference between the two was around 10%.

Again, IV refers to the market’s expectations of future price movement expressed as a percentage. A higher IV suggests more movement, while a lower IV suggests less movement.

This is what the chart looked like at that time.

Around 2 PM, the market struggled but recovered, finishing higher by the close. The trades moved against me slightly, but the ATM and ITM entry and holding criteria (i.e., credit to close) mentioned above were still met, so I stuck with it.

Regarding having to hedge, I just focused on the spread’s sensitivity to price movements. Despite intense price action, the Greeks were okay. I remained in the position for about a week and a half. After the first week, the spread moved in my favor, but not to the extent I had hoped.

To explain, implied volatility remained higher on the short strike but dropped more on the long strike. Had the volatility on the short strikes dropped significantly more, the spreads would have likely come off sooner. Pricing the 15 MAR 24 spreads, those were trading for a debit to close, and it did not make sense to do anything other than sit on my hands and wait. If the stock continued to rise, which eventually occurred, the spread had more potential. Here’s the lookback at the time.

This is the price chart at month-end. It felt like there was more room to go up.

After the weekend, there was a big overnight move. Traders caught the news that SMCI would be included in the S&P 500.

I used the gap as a gift and sold into it, monetizing spreads from 3.00 to 5.05 cr to close. Trade tickets for one account follow.

BOT +1 1/2 BACKRATIO SMCI 100 (Weeklys) 8 MAR 24 1400/1600 CALL @-5.05

5.05 marked the top in the structure’s pricing despite the stock moving higher after 10:00 AM. It took me years of watching these structures to spot softening sensitivity in the spread, prompting such closure. Had this gap not happened, the spreads likely would have been closed for small credits (0.05 cr). Again, the gap was a gift. Take it, Renato!

At this point, I am already considering rinsing and repeating this trade. The 15 MAR 24 200-point spread fully ITM traded for a small credit to close, which was unsafe. I widened accordingly to a 250-wide spread, priced for a very thick credit to close—the lookback shows about 44.00 cr. Here’s the lookback.

So, we went out to 1300/1550. There, I saw 1x2s pricing for thick credits to open.

SOLD -1 1/2 BACKRATIO SMCI 100 15 MAR 24 1350/1600 CALL @3.05

The implied volatility at the 1300 strike was ~150%, and at the 1550 strike, it was ~175%. We entered an hour early without regard for the stock chart (above), which was a costly mistake. The stock ripped higher, resulting in a ~$2.00 loss per spread.

Notably, the implied volatility skew steepened on the day of entry. Here’s a visual.

However, later that day, the spreads settled down. At 1:40 PM, the stock peaked, and the pricing of the 1300/1550 we put on declined slightly. To manage risk, I closed some units there. In any case, the spread narrowed, owing to a flattening and stickiness of the skew; 1300/1550 = 150/175% (~25% spread) → 140/160% (~20% spread). If I waited longer, the additional units would have gone massively in my favor. Oh, well!

Over the next few days, the stock moved down and then up; overall, the stock stayed flat. During this time, the spread increased in value, working in my favor. With these spreads, you want drift, not protracted movement!

My targets were at 5.00 and 10.00 cr to close, as I got over the next day or so. Implied volatility didn’t budge much. Based on thinkorswim’s lookback feature, it rose in the long strike more than the short strikes, which is what you want to see. Decay helped!

I wanted to hold longer because the spread 50 points closer to the money was pricing at 10.00 cr to close, about 3-5.00 cr more than I had my pricing for. Based on the stock price chart, we were peaking, but these moves tend to go sideways or higher for a bit longer. Candle shadows tend to get tested!

If we fast forward, the session was quiet, with SMCI trading sideways to lower from the open. The pricing of the spread went as high as 10.00 cr (at which point I started to monetize).

BOT +1 1/2 BACKRATIO SMCI 100 15 MAR 24 1350/1600 CALL @-10.05

Here’s what implied volatility looked like (i.e., a rise in the long strike, whereas the short strike stayed about the same).

After the close, I started thinking, “Man, I should have closed that last spread.” It went to my target, but I kept holding (correctly), as you want to maintain some runners. However, the price action was weak into the evening, after the market closed, and I was now concerned I would lose all or most of the profit in my remaining spread. Mental games, here. Patience, Renato!

The market opened sideways the next day. I monetized my last spread for 11.00 cr, close to its peak.

BOT +1 1/2 BACKRATIO SMCI 100 15 MAR 24 1350/1600 CALL @-11.07

Here are the implied volatilities at the exit (i.e., noticing the more significant drops in short strikes relative to the long ones).

There’s a critical factor that helped the trade keep its value. The stock went sideways, and a day or so passed, allowing some of the decay to kick in. The decay disproportionately affected the further OTM strikes (i.e., there’s more to decay than usual), with the lookback showing implied volatility dropped to 135% long / 150% short a few minutes after I closed my position. The market was attempting to go higher, volume was low on the 1300 strike, and the spread ended up pricing higher than what I closed it for. Bummer! Here’s what it looked like.

SELL -1 1/2 BACKRATIO SMCI 100 15 MAR 24 1300/1550 CALL @-15.70 LMT

On March 8, the market peaked, hitting the 1200 figure I had envisioned. 1200 was a target for me due to the amount of interest (open interest and volume) at that strike, as well as the trend of the market. The March 4 shadow would also be taken based on the March 5-7 price action. Essentially, we traded up to and held short of the March 4 high, and the spread increased in value by $10.00 cr. I could have doubled my profits for the trade, but at the risk of losing it if things had gone the other way. Remember February 22, when the extreme volume was at the 1000 strike and above? We failed there. This was a blow to options buyers!

On March 8, 10-15 minutes after the market opened, implied volatility for 1300/1550 per thinkorswim’s lookback showed a much more significant drop in further OTM strike as the stock went up by $33 in that one day. Vol down, stock up, weekend decay, and that’s how a spread that priced 5.00 cr to close two days before ended up trading to 25.00 cr to close. Here’s the lookback.

On March 11, the stock traded much weaker. Implied volatility on the 1300/1550 went to 150/170%. Despite this, the trade lost a lot of delta, which the implied volatility bump couldn’t make up. The lookback shows the trade went to a 7.00 cr, a ~70% loss. This is what I say you’re up against. There’s not a lot of give to work with at times.

At this point, I realized I was doing what I was supposed to: take what I could get. Sometimes, the risk of losing what you made is not worth the potential reward. The trade was done after the stock hit 1200 (a location where I struck a bunch of Fibonacci extensions, too).

Finally, this is what the implied volatility skew looked like on March 8, the peak day.

In conclusion, this trade demonstrated one of my better executions. Over the month, SMCI traded sideways, and I captured about $24,000 in premiums across a couple of accounts. As I told my trading partner, the execution felt “divine”; there were plenty of moments where we could have made big mistakes—being too greedy, sizing too large and having to delta hedge in response, entering or exiting at the wrong times, or letting fears take over. However, the SMCI trades show improved thinking and acting quickly. Continuous improvement is all this is about—and that’s all I can ask for!

Some thoughts from this experience include waiting for market capitulation when the excitement fades, which helps spot better opportunities to trade the above structures. I identify these trades by scanning for high implied volatility, tracking a watchlist daily, sizing trades appropriately, and monitoring them closely; I size appropriately when I spot potential trades and save those trades (i.e., keep them in my monitor tab). I also suggest tracking implied volatility at specific strikes and keeping detailed notes; if you see a pattern, note it and decide whether adding or reducing the position is worth it. Additionally, holding onto “runners” (remaining positions) can significantly boost profits, as seen with the trades expiring on 15 MAR. Also, consider what may happen if the underlying moves toward the spreads and how you’ll react, adding, hedging, or reducing size.

What’s your favorite engagement trade when the fear of missing out is so great? Let’s discuss.


Disclaimer

By viewing our content, you agree to be bound by the terms and conditions outlined in this disclaimer. Consume our content only if you agree to the terms and conditions below.

Physik Invest is not registered with the US Securities and Exchange Commission or any other securities regulatory authority. Our content is for informational purposes only and should not be considered investment advice or a recommendation to buy or sell any security or other investment. The information provided is not tailored to your financial situation or investment objectives.

We do not guarantee the accuracy, completeness, or timeliness of any information. Please do not rely solely on our content to make investment decisions or undertake any investment strategy. Trading is risky, and investors can lose all or more than their initial investment. Hypothetical performance results have limitations and may not reflect actual trading results. Other factors related to the markets and specific trading programs can adversely affect actual trading results. We recommend seeking independent financial advice from a licensed professional before making investment decisions.

We don’t make any claims, representations, or warranties about the accuracy, completeness, timeliness, or reliability of any information we provide. We are not liable for any loss or damage caused by reliance on any information we provide. We are not liable for direct, indirect, incidental, consequential, or damages from the information provided. We do not have a professional relationship with you and are not your financial advisor. We do not provide personalized investment advice.

Our content is provided without warranties, is the property of our company, and is protected by copyright and other intellectual property laws. You may not be able to reproduce, distribute, or use any content provided through our services without our prior written consent. Please email renato@physikinvest for consent.

We reserve the right to modify these terms and conditions at any time. Following any such modification, your continued consumption of our content means you accept the modified terms. This disclaimer is governed by the laws of the jurisdiction in which our company is located.

Categories
Commentary

Reality Is Path-Dependent

This week’s letter begins with an overview of reflexivity. Many works exist on this topic, with “The Alchemy of Finance” summarizing it well. Written by investor George Soros, it concludes that markets are often wrong, and biases validate themselves by influencing prices and the fundamentals they should reflect.

Graphic: Retrieved from Michael Mauboussin. 

Namely, reflexivity is this feedback loop between participants’ understanding and the situations they’re participating in. Sometimes, these feedbacks manifest far-from-equilibrium prices. Think of the connection between lending and collateral value, selling stock to finance growth in the dot-com boom, leaning on cheap money to make longer-duration bets on promising ideas, or the success of volatility trades increasing the crowd in volatility investments, be this dispersion or options selling ETFs.

Graphic: Retrieved from Nomura Holdings Inc (NYSE: NMR)

Perception begets reality, with these far-from-equilibrium conditions reinforced until expectations are so far-fetched they become unsustainable. Sometimes, the corrections become something more, with self-reinforcing trends initiating the opposite way.

Enron creatively hid debt from its balance sheets, guaranteeing it with its stock. When the stock fell, it revealed financial misdeeds, contributing to a broader market downtrend, bankruptcies, and corporate scandals. 

FTX brought itself and some peers down when withdrawals revealed a billions-large gap between liabilities and assets. 

Volmageddon climaxed with the demise of products like the VelocityShares Daily Inverse VIX Short Term Exchange-Traded Note (ETN: XIV) after a sharp jump in volatility sparked a doom loop; to remain neutral, issuers rebalanced, buying large amounts of VIX futures, which propelled volatility even higher and sent products like XIV even lower.

Graphic: VelocityShares Daily Inverse VIX Short Term Note (ETN: XIV) retrieved from investing.com.

The expansion of such trades increases liquidity, sometimes making assets appear more liquid and money-like stores of wealth. This may also stimulate economic growth. Likewise, the contraction or closing of these trades can lead to a sudden reduction in liquidity, negatively impacting the economy and market stability.

“The Alchemy of Finance” identifies a recurring asymmetric market pattern of slow rises and abrupt falls. Additionally, if market prices accurately reflected fundamentals, there would be no opportunity to make additional money; just invest in index funds.

Further, we continue to see interventions to stabilize markets, and they encourage further distortion and misdirection of capital. Often, such interventions are blamed for benefitting wealthy investors most and increasing inequality. As explained in works like “The Rise of Carry: The Dangerous Consequences of Volatility Suppression and the New Financial Order of Decaying Growth and Recurring Crisis,” monetary authorities and regulators’ interventions reinforce scenarios of deteriorating economic growth, more frequent crises and less equality and social cohesion.

We’re getting off track, but the point is that the conclusions and approaches outlined in “The Alchemy of Finance” are captivating. Soros sought to understand markets from within without formal training, access to unique information, or his being math savvy; instead, he attempted to connect deeply with markets, assuming they felt like he did and he could sense their mood changes.

“We must recognize that thinking forms part of reality instead of being separate from it,” he explains. “I assumed that the market felt the same way as I did, and by keeping myself detached from other personal feelings, I could sense changes in its mood, … mak[ing] a conscious effort to find investment theses that were at odds with the prevailing opinion.”

We apply this understanding of the market’s mood in our best way here. Our long-winded analyses of everything from technicals to positioning and, increasingly, fundamentals and macroeconomic themes give us a holistic understanding of what’s at stake, whether self-reinforcing trends exist, and whether to adjust how we express ourselves.

Let’s get into it.


The Great Rotation

Last Thursday, an update on consumer prices showed US inflation cooling to its slowest pace since 2021. Accordingly, traders began pricing the news and buying bonds in anticipation the Federal Reserve may cut its benchmark rate by ~0.75% this year.

Graphic: Retrieved from CME Group Inc’s (NASDAQ: CME) FedWatch Tool. SOFR is a check on market conditions and expectations regarding short-term interest rates.

Optimism about lower interest rates prompted investors to shift from the previously favored large-cap tech, AI, and Mag-7 stocks into riskier market areas and safe-haven assets like gold, reflecting concerns about a potential dovish mistake. The Russell 2000 (INDEX: RUT), an index of smaller companies, outperformed the Nasdaq 100 (INDEX: NDX) by one of the most significant margins in the last decade. Despite the S&P 500 (INDEX: SPX) declining by nearly 1%, almost 400 components recorded gains.

Graphic: Retrieved from BNP Paribas (OTC: BNPQY) Markets 360.

With these underlying divergences, committing capital to bearish positions is challenging. Breadth strengthened with more volume flowing into rising stocks than falling ones. This wouldn’t happen in a sell-everything scenario, explaining the hesitation to sell.

Graphic: Market internals as taught by Peter Reznicek.

The outsized movement observed isn’t surprising as it aligns with the narrative we shared earlier this year. 

While individual stocks are experiencing significant volatility, indexes like the S&P 500, which represent these stocks, show more restrained movement. For example, after Thursday’s sell-off, despite its large constituents like Nvidia Corporation (NASDAQ: NVDA) weakening, the S&P 500 firmed.

Here’s a chart to illustrate.

Graphic: Retrieved from TradingView. Nvidia versus the S&P 500, with the latter in orange.

Among the culprits, investors have concentrated on selling options or volatility (the all-encompassing term) on indexes, and some of this is used to fund volatility in components, a trade (considered an investment by some) known as dispersion. 

The trade is doing well in this environment, with Cboe’s S&P 500 Dispersion Index (INDEX: DSPX) jumping to a one-year high. Dropping realized volatility (i.e., volatility calculated using historical price data) and a widening spread between stock and index implied volatility (i.e., expectations of future volatility derived from options prices) validate this trade’s success, reports Mandy Xu, the Vice President and Head of Derivatives Market Intelligence at Cboe Global Markets (BATS: CBOE).

Graphic: Retrieved from Cboe Global Markets’ (BATS: CBOE) Mandy Xu.

“The market has been broken up into two groups: 1. Nvidia and Magnificent 7; and 2. The other 493. The correlation between those two groups has been low, which has pressured S&P 500 correlation,” explained Chris Murphy, a derivatives strategy co-head at Susquehanna. “When looking at S&P stocks on an equal-weighted basis, the outsized impact of the MAG7 as a group and NVDA specifically is neutralized.”

Understanding correlation is critical to grasping the pricing dynamics between index options and their components and trading volatility dispersion. When counterparties (our all-encompassing term for the dealers, banks, or market makers who may be on the other side) fill their customers’ options sales in the index, they may hedge by buying the index as its price falls and selling when it rises, with all other conditions remaining the same. Consequently, trading ranges may narrow, with realized volatility also falling.

To explain visually, see immediately below. Movement benefits the counterparty’s position. Hedging may result in trading against the market, selling strength, and buying weakness.

Graphic: Retrieved from Reddit, from all places!

This effect may be less pronounced or absent in single stocks, which do not experience the same level of this supposed volatility selling; instead, there is more buying, and the opposite occurs. Movement is a detriment to the counterparty’s position, with all else equal. Hedging may result in trading with the market, buying strength, and selling weakness. This can reinforce momentum and give trends a lease on their life; hedging can help sustain and extend market movements rather than neutralize them.

Graphic: Retrieved from Reddit. 

Together, as counterparties align the index with its underlying basket through arbitrage constraints, its volatility is suppressed, and the components can continue to exhibit their unique volatility—the only possible outcome is a decline in correlation. If the index is pinned and one of the larger constituents moves considerably, the dispersion trader may make good money in such a scenario.

Graphic: Retrieved from Bloomberg.

We now see large stocks starting to turn and lesser-weighted constituents in the S&P 500 firming up, picking up the slack. For instance, Nvidia traded markedly higher immediately after its last earnings report, and the S&P 500 was unfazed. Something is giving, and those constraints we talked about keep things intact.

The rotation, in and of itself, is healthy, giving legs to and broadening the equity market rally. It’s just that it’s happening with the most-loved stocks being severely overbought.

Graphic: Retrieved from BNP Paribas.

Should interruptions continue across large-cap equities, souring speculation on further upside, a broader turn and outflows may manifest. The market’s gradual shift into a higher implied volatility environment, notwithstanding direction, may aid in any such unsettling, feeding into a higher realized volatility.

Graphic: Retrieved from The Market Ear. 

Building on this point, we observe a shift in S&P 500 call options before last Thursday’s steep decline. Implied volatility rose with the S&P 500. SpotGamma indicates this is partly the result of demand for SPX call options as traders seek synthetic exposure to the upside in the place of stock. This “SPX up, SPX vol up” pattern is unusual and typically happens near the short-term tops.

Graphic: Retrieved from Bloomberg via Danny Kirsch, head of options at Piper Sandler Companies (NYSE: PIPR).

SpotGamma adds that the pressure on individual stocks that followed last Thursday stemmed from significant selling of longer-dated calls in the tech sector, a last-in, first-out (LIFO) phenomenon. In other words, those late to the party are the first out!

The counterparts on the other side of this trading potentially (re)hedge this by selling stock.

Graphic: Retrieved from SpotGamma.

However, with call selling, the chances of sustained follow-through are significantly lower. Put buying, which was less prevalent, changes this dynamic. 

In the case of a prolonged downturn, equity put buying is the key indicator we would watch for, along with deteriorating market internals such as breadth, as analyzed earlier. We want to see traders committing more money to the downside at lower prices, and increasingly so, as prices drop and the range expands downward. That’s what market and volume profiles can help with!

The fundamentals don’t necessarily support the case for some disastrous downside, though. 

A dovish Fed can be good for risk as it’s seen as preemptive, BNP Paribas (OTC: BNPQY) shares. Or, a dovish Fed could suggest a coming deceleration. In any case, long-term interest rates will be least sensitive to any change, a negative implication for capital formation, growth, and equity returns.

The Summer Of George

Kai Volatility founder Cem Karsan uses this Summer of George Seinfeld reference to describe the current market. During the summer months, there is insufficient liquidity to overwhelm the market’s current position.

Graphic: Retrieved from Bloomberg via Michael J. Kramer. 

We know the SPX volatility risk premium is near its highs this year. The Cboe, itself, shows the implied-realized volatility spread widening to 4.5% (96th percentile high). 

Implied volatility is low, but not cheap. Consequently, short-leaning volatility trades mentioned in this document remain attractive. 

At the same time, however, there’s still a ton of volatility protecting investors against downsides owned below the market. 

To quote QVR Advisors, there’s “too much supply of front month call selling and too much buying demand for longer-dated puts.” 

“This trade flow is contributing to a large and growing structural dislocation which is not compensating ‘insurance sellers’ (i.e., near-dated call and put writers) and is overcharging in implied volatility terms, buyers of insurance (i.e., long-dated puts).”

Taken together, the implications are staggering. With calm and falling realized volatility, there may be some counterparty re-hedging. This may consist of buying stocks and futures and supporting markets where they are. 

Let’s break down some of the trades to understand better.

Consider yourself a customer who owns 100 shares of the SPRD S&P 500 ETF Trust (NYSE: SPY). You’re traveling to Europe and want to hedge your position against the downside. So, you wake up one morning, go online, and tell your broker you want to buy one at-the-money 50 delta SPY put option.

The delta is terminology for how that option’s price will change based on a $1 change in the underlying. In this case, for every $1 move up/down, the option will change in value by $0.50. Delta is also used to estimate the likelihood of an option expiring in the money. For example, a delta of 0.5 suggests there is approximately a 50% chance the option will expire in the money. There’s also gamma, the second derivative of how the option’s price changes with underlying changes, but we won’t discuss that further.

With your 100 shares hedged, if the market goes down, you don’t mind. You’re hedged, after all!

Naively, we’ll say this trade wasn’t paired up against another investor’s; instead, some mysterious counterparty will warehouse this risk. These mysterious persons want nothing to do with the directional risk of your trade. They’ll hedge by selling 50 SPY shares (i.e., 100 × 0.50). Again, we’re naive here and don’t consider their potential to offset this risk with other positions they may have.

You check your phone after a while and find that SPY hasn’t moved much. Your 50 delta put is now 20 delta. Bummer! You shrug, turn off your phone, and hit the beach.

What happened to that mysterious counterparty on the other side of this trade, though? They bought back 30 SPY shares, supporting the market and reinforcing the trend! 

Though this is a naive take, it may help.

Reality Is Path-Dependent

Your and the counterparty’s actions partly shaped the SPY’s price movement. You bought puts, setting off a chain of events. The counterparty hedged, the market didn’t move, and the hedge was unwound. This only serves to support the SPY further.

“There’s skew in the market, which ultimately forces a buyback of stock by dealers, market makers, banks, etc., every day, and it accelerates into expirations,” Karsan elaborates

“When the market’s up, there’s a buyback and a momentum re-leveraging, … forcing more buying.”

As we approach the end of summer, things change. Among other things, elections are coming, and there will be some hedging of that. With months to go, broad market hedges against a sudden downturn have appeared generally inexpensive, with three-month puts protecting against a drop in the S&P 500 near their lows. See the dark blue line in the graphic below as an example!

Graphic: Retrieved from Cboe Global Markets. 

“The high dispersion of stocks has contributed to weighing on VIX,” shares Tanvir Sandhu, chief global derivatives strategist at Bloomberg Intelligence. “If the equity market breath improves then that may weigh on volatility, while a pullback in mega-cap tech stocks could see both correlation and index volatility rise.”

In fact, excluding NVDA, the VIX hit traded into the 9s, on par with 2017 lows. 

Graphic: Retrieved from Bloomberg via Michael Green.

SpotGamma adds that we are in the second longest stretch without an SPX 1-day 2% move up/down; traders aren’t committing capital to bets on big moves, either. 

Graphic: Retrieved from SpotGamma. 

We see this in spot-vol beta, which refers to the relationship between the market (which we refer to as the “spot” here) and changes in its volatility over time or volatility’s sensitivity to market trading. 

This spot-vol beta has been depressed.

In observance, Nomura Cross-Asset Macro Strategist Charlie McEligott states there’s limited potential for volatility to decrease further, particularly with the SPX 1-month implied correlation at historically low levels. 

To that point, “the historically low spot-vol beta we are seeing now will eventually be followed by historically high spot-vol beta,” the Ambrus Group’s co-CIO anticipates.

Graphic: Retrieved from Nomura. A weak spot-vol beta historically leaves stocks going nowhere.

The case is less so valid with more actively traded shorter-dated options. According to Simplify Asset Management’s Michael Green, the sensitivity remains. You just have to look elsewhere.

Graphic: Retrieved from Michael Green.

It makes sense why. 

Shorter-dated options are less exposed to changes in implied volatility; instead, they expose one more directly to movement or realized volatility. They can be more attractive to hedge with but can cause problems and amplify wild swings in rare cases.

Graphic: Retrieved from JPMorgan Chase & Co (NYSE: JPM).

If news shocks the market one way, movements may exaggerate when traders scramble to adjust their risk, as discussed below. 

Though that’s usually not a worry, as Cboe puts, according to Karsan, a dwindling supply of margin puts, especially those with high convexity and far out-of-the-money, would be the indicator to watch for impending exaggerated movement. These options, particularly if shorter-dated, are crucial during market stress, serving as indicators and drivers of potential crashes when traded in large sizes (e.g., 5,000-10,000 0-DTE options bought on the offer to hedge). 

As a counterparty, you may also use similarly dated options to hedge yourself, bolstering a reflexive loop!

Again, the reality is path-dependent! The path leading to this point—low correlations and reduced availability of those protective options—sets the stage for increased volatility.

Here, we wish to emphasize the convexity component—gamma or the rate at which the delta changes with the underlying asset’s price—rather than the likelihood of the underlying asset reaching the options’ strike prices. Just because an option turns expensive doesn’t mean it is likely to pay at expiry; instead, it may have value because that’s precisely what traders need to trim their margin requirements during volatile markets. 

“Implied vol is about liquidity. It isn’t about fear or greed,” writes Capital Flows Research. 

“Implied vol is about liquidity on specific parts of the distribution of returns on an asset. Remember, even the outright price of an asset is pricing a distribution of outcomes, not a single destination. Options make this even more explicit by having various strikes and expirations with differing premiums and discounts.”

History shows a minor catalyst can lead to a big unwind. Take what happened with index options a day before XIV crash day.

“Going into the close the last hour, we saw nickel, ten, and five-cent options trade up to about $0.50 and $0.70,” Karsan elaborates. “They really started to pop in the last hour.”

“And then, the next day, we opened up, and they were worth $10.00. You often don’t see them go from a nickel to $0.50. If you do, don’t sell them. Buy them, which is the next trade.”

New rules surrounding the collateral traders must post to trade can only amplify a bad situation, “potentially leading to premature and forced hedging as volatility increases,” The Ambrus Group writes.

“Because everyone has to put down more capital, you have to disallow people from trading down there in a way that you don’t have to now,” JJ Kinahan, president of Tastytrade, says.

The opposite can happen when markets move quickly higher. Take the options activity and price action in the Russell 2000 over the last week. Volatility skew, or the difference in implied volatility across different strike options, steepened accordingly. 

Graphic: Retrieved from Bespoke Investment Group via Bloomberg.

Typically, options with farther-away strike prices have higher implied volatility than options with closer strike prices. When the skew steepens, the disparity in implied volatility between these various strike prices widens. 

Depending on the steepening, we may have insight into the type of impending velocity and trade accordingly.

For instance, the implied volatility of out-of-the-money (OTM) calls, which offer protection against market upturns, rises significantly compared to at-the-money (ATM) calls and downside protection (puts). This steepening volatility skew indicates heightened enthusiasm among investors regarding potentially large upward market movements. 

The steepening call volatility skew below results from distant call options pricing higher implied volatility than usual due to investor demand. Beyond helping understand the market’s thinking and mood, it can serve as a catalyst, with call options buying into a price rise further accelerating movement indirectly by how the other side hedges this risk (i.e., they buy stock to hedge).

Graphic: Retrieved from SpotGamma. 

This action is apparent elsewhere, too, in the S&P 500 (as can be seen via the SPX cross-sectional skew graphic from Cboe above), where it’s proving quite sensitive, as well as single stocks like NVDA and Super Micro Computer Inc (NASDAQ: SMCI). We provided examples this year where steepening call skew helped reduce the cost of trades we used to capture the upside. In one case, we removed SMCI butterfly and ratio spreads for tens of thousands of percent in profit (e.g., $0.00 → $10.00)!

Graphic: SMCI volatility skew in February, relative to where it was (shaded) in recent history before that.

Market Tremors

This week’s market tremors are affecting some of the most loved areas of the market, and a flattening skew (e.g., green line versus grey line below) alludes to further potential for pressure.

Graphic: Retrieved from SpotGamma.

In the long term, a few things stick out, including high interest rates and a stronger dollar, which create macroeconomic problems. 

A few explain it better than we do. Higher US interest rates relative to other economies can result in outflows and stress. Just look to places like Japan, where there’s been a lot of currency volatility. If the dollar’s strength continues, it could lead to crises elsewhere, creating a ripple effect and priming potential volatility at home.

“A US Dollar devaluation will then be a tailwind to S&P 500 earnings, which would be positive for stock prices,” Fallacy Alarm summarizes. “However, an unwinding carry trade also causes deleveraging, which is typically not good for asset prices.”

May this upset popular trading activities and catapult something minor into something more? 

Sure, and the current low correlation and implied volatility mean that any considerable market disruption could have a substantial impact. Still, markets are intact and likely to stay so.

“If we continue to grind higher, options will get cheaper and cheaper on their own accord. Not to mention all the vol selling that’s getting them to a point which is even cheaper, at some point,” Karsan adds. “And the acceleration generally in those things becomes on the upside, the realized volatility on the upside gets to be just too big relative to the implied, which means it becomes profitable for entities to come in and start buying vol at these lower levels. Add to that, the vol supply is likely to dissipate a bit as we get into September, October, and November. Why? We have an election sitting there.”

So, as the market moves higher, it transitions into this lower implied volatility, reflected in broad measures like the VIX. If the VIX remains steady or higher, “that indicates that fixed-strike volatility is increasing, and if this persists, … it can unsettle volatility and create a situation where dealers themselves … begin to reduce their volatility exposure,” naturally buoying markets as previously outlined. If there is greater demand for calls, counterparties may hedge through purchases of the underlying asset, a positive.

If The Music’s Playing, Get Up And Dance

With volatility at its lower bound, at which it can stay given its bimodality, it makes sense to look at markets through a more optimistic lens. A lot is working in its favor, and if near-term declines are marginal and not upsetting to the status quo, it may set the stage for a rally through elections.

Accordingly, how do we make positive returns in rising markets and minimize losses or gains in flat-to-down markets as we have now? That’s the goal, right?

For the anxious and must-trade types, short-dated (e.g., 50- or 100-point-wide and 0-1 DTE) butterflies in the NDX worked well on sideways days. Here, we’ve tried to double and triple our initial risk but can easily hit more in benign markets. For the passive types, calendars may do just as well should the realized volatility keep where it is or fall relative to what is implied. 

In anticipation of this week’s controlled retracement, we initiated wide (e.g., up to 2,000-point-wide) broken-wing butterflies and ratio spreads on the put side in the NDX, reducing their cost basis, if any, with the credits from the short-dated fly trades, among others. Into weakness, those spreads now price a few thousand percent higher, and we’re monetizing them, intending to use the credit to finance trades that capture upside potentially or to reduce our stock cost basis.

Regarding hedging potential outliers, BNP Paribas says VIX calls and call spreads remain compelling low premium tail hedges.

“And I think this is one of the arguments for going with VIX calls, not that we’ve seen anything explosive yet this year, but if we do see some of these things unwind, you’re going to get a kicker there where you might see the VIX cruise very quickly up to 45, and it probably won’t stay there unless there’s a real good fundamental reason for that to happen,” explains Michael Purves, the CEO and founder of Tallbacken Capital Advisors. Josh Silva, managing partner and CIO at Passaic Partners, adds, that “when there is a liquidation, it’ll be hard, it’ll be fast and it’ll be dramatic.” 

“Typically, the market after that is pretty awesome.”


Disclaimer

By reading our content, you agree to be bound by the terms and conditions outlined in this disclaimer. Consume our content only if you agree to the terms and conditions below.

Physik Invest is not registered with the US Securities and Exchange Commission or any other securities regulatory authority. Our content is for informational purposes only and should not be considered investment advice or a recommendation to buy or sell any security or other investment. The information provided is not tailored to your financial situation or investment objectives.

We do not guarantee any information’s accuracy, completeness, or timeliness. Please do not rely solely on our content to make investment decisions or undertake any investment strategy. Trading is risky, and investors can lose all or more than their initial investment. Hypothetical performance results have limitations and may not reflect actual trading results. Other factors related to the markets and specific trading programs can adversely affect actual trading results. We recommend seeking independent financial advice from a licensed professional before making investment decisions.

We don’t make any claims, representations, or warranties about the accuracy, completeness, timeliness, or reliability of any information we provide. We are not liable for any loss or damage caused by reliance on any information we provide. We are not liable for direct, indirect, incidental, consequential, or damages from the information provided. We do not have a professional relationship with you and are not your financial advisor. We do not provide personalized investment advice.

Our content is provided without warranties, is the property of our company, and is protected by copyright and other intellectual property laws. You may not be able to reproduce, distribute, or use any content provided through our services without our prior written consent. Please email renato@physikinvest for consent. 

We reserve the right to modify these terms and conditions at any time. Following any such modification, your continued consumption of our content means you accept the modified terms. This disclaimer is governed by the laws of the jurisdiction in which our company is located.

Categories
Commentary

The End Game

Good Morning! I hope you have a great start to the week. I would be so honored if you could comment and/or share this post. Cheers!

Bursts of volatility punctuate calm and resilience, resulting in demand for safety and protection in everything from stocks and commodities to bonds and currencies. The general agreement is that macroeconomic policy and geopolitics are to blame, and investors are repositioning to stem risk and potential bleeding in their portfolios. This sometimes disturbs historical trends and relationships. 

Thank you for tuning in. We will unpack much of it herein. Let’s get into it.

Graphic: Retrieved from Bloomberg.

Hedging Against Monetary Inflation, Weaponized Dollars, And Debt Monetization

Gold serves as a prime example. Instead of being guided by conventional catalysts, including real interest rates (i.e., nominal interest rate minus inflation), growth prospects, and currencies like the dollar, recent movements are more likely driven by factors like central bank accumulation on macroeconomic and geopolitical shifts.

For instance, China may increase its gold reserves to hedge potential disruptions and sanctions, as Russia saw after it invaded Ukraine in February 2022, or establish a collateral reserve for an autonomous financial system. Likewise, Poland, the Czech Republic, and Singapore have also increased their gold reserves.

As liquidity in the gold market is thinner, this buying activity amplifies volatility and disrupts established trends. Therefore, fast moves up!

Graphic: Retrieved from Bloomberg via SuperMacro.

Why could gold continue this upward trajectory?

The typical trajectory is guided by monetary inflation, characterized by increasing liquidity within the financial system. According to CrossBorder Capital, gold moves 1.5 times the liquidity growth, a solid sensitivity to so-called monetary expansion. Bitcoin, often considered a digital gold, moves sooner and exhibits higher sensitivity.

Recent expressions of interest in Treasury securities by central banking authorities, such as Federal Reserve Governor Christopher Waller, further fuel ascents. New demand would lead to higher bond prices and lower yields.

Therefore, gold continues surging due to geopolitical shifts, liquidity in the financial system, and the potential for debt monetization. The latter occurs when excessive debts prompt central bank authorities to intervene, using printed money to purchase bonds to manage interest rate levels more effectively.

“Investors are looking beyond the ‘here and now,’ realizing that there is no way markets or the economy can sustain 5% nominal and 2% real rates,” Bank of America elaborates. Investors are “hedging two things: i) the risk that the Fed cuts as CPI accelerates, and ii) and more ominously, the ‘endgame of Fed Interest Cost Control (‘ICC’), Yield Curve Control (YCC) and QE to backstop US government spending.’”

Graphic: Retrieved from Bank of America.

There is bi-modality. Typically, high rates are bad for gold. But, with debts and rates as they are, the probability of debt monetization increases. For now, we have a cycle wherein stocks and commodities may rise with a firming economy, and bonds may offer limited salvation, nodding to higher-for-longer rates.

Hedging Loss Of Momentum And Left Tails Following Big Move-Up And De-levering

Interest rate increases are likely only on the horizon if something unexpected occurs. Given that stocks are priced well, the question arises: how can we protect ourselves while many anticipate, based on market pricing, either minimal changes to the status quo or a substantial event triggering a broad downturn?

For one, commodities don’t do much good in a broad downturn.

Consider the years 2001 (during the tech bubble), 2008 (amidst the global financial crisis), 2015 (the flash crash), 2018 (during Volmageddon), and 2020 (amidst the pandemic). According to Kris Sidial of The Ambrus Group, gold was an ineffective hedge against equities during these periods.

So, how do we hedge the middle reality between “minimal” and “substantial.”

Graphic: Retrieved from Bloomberg.

While direct bets on equity volatility bursts have been prominent, digestion trades may be a better alternative. Let’s unpack why.

Graphic: Retrieved from Bloomberg.

The first idea involves hedging downside thrusts in equities via call options in the Cboe Volatility Index (INDEX: VIX), Goldman Sachs, and UBS note. This isn’t necessarily optimal. Volatility is high over the short term and may revert quickly, indirectly boosting stocks. The alternative strategy entails selling options and utilizing the funds to purchase similar options with later expiration dates. Such digestion trades enable traders to capitalize on increases in volatility in the near term, reducing their costs on longer-term trades.

Graphic: Retrieved from SpotGamma’s April 15, 2024 Founder Note.

To explain, in a recent letter to subscribers, SpotGamma shared that numerous expiring VIX call options were in the money. In other words, this exposure, which makes money if the VIX and S&P 500 implied volatility (or the options market’s anticipation of future movement in the underlying), was soon to disappear. Accordingly, the hedges to this exposure would do the same, and the rebalancing after that would be enough to buoy markets.

We’ll try to break it down further in the simplest way possible. 

The S&P 500 (INDEX: SPX) and VIX are inversely correlated. When the S&P 500 falls, the VIX tends to rise. Naive of us to say, we know, but bear with us.

One can buy an SPX put or a VIX call to hedge a portfolio’s volatility. Let’s say one buys an SPX put, and the other side of this trade sells an SPX put. The other side may hedge this short put by selling stock and futures correlated to the S&P 500. Let us say the S&P 500 falls and volatility rises (pictured below). That counterparty may have to sell more stock and futures, pressuring markets. If this now valuable put expires, the counterparty will buy back the stock and futures it sold. This can support markets or do less to exacerbate movement and underlying volatility.

Graphic: Retrieved from SqueezeMetrics.

SpotGamma’s data suggests the markets are not facing an impending crash; instead, per their April 17, 2024 note, “if stocks rally and IV drops, it may add more stock for dealers to buy.” I plug SpotGamma because I worked there. Check them out! 😀

Graphic: Retrieved from SpotGamma.

So, calendar and unbalanced butterfly or ratio spread trades (pictured naively below), a play on the recent richness (pictured much further above) of options, may help capture the low case of downside and stem potential portfolio volatility.

Graphic: Retrieved from Physik Invest.

Flipping these trades (i.e., using call options in the SPX instead of put options) allows one to play the market rising. For instance, let us say the upside of gold and silver will continue, but only after stopping and digesting recent movements. You can sell a call expiring soon and buy one later at the same strike price. Your loss is, technically, limited to the amount paid for the trade.

Graphic: Retrieved from Schwab’s thinkorswim platform.

In general, ratio spreads, and butterfly trades are designed to capitalize on movement toward specific price levels, while outright calls and puts are better suited for hedging sharp movements.

The former two strategies serve as practical tools for safeguarding the value of your positions during periods of heightened volatility. In such environments, the options you own are positioned closer to the market, usually retaining their value well, while the options you sell are priced higher than usual and located farther from the market, with more value to decay into expiry. 

Consequently, while the options you own tend to keep their value, the options you sell struggle to retain theirs. As a result, the spread can appreciate even without significant movement, particularly if implied volatility declines significantly at the furthest strikes. Earlier this year, such was true in Super Micro Computer Inc (NASDAQ: SMCI) and Nvidia Corp (NASDAQ: NVDA).

SMCI was trending up, and traders were feverishly betting/hedging this reality. In a 20-page case study we may release, we detail how Physik Invest navigated this environment successfully. In short, we bought options closer to where the market was trading and sold more of them in places where we thought the market wouldn’t end up going. With implied volatility jacked, for lack of better phrasing, it was often difficult for those far-away and short-dated options to keep their value. Hence, we managed to put trades on for low or no cost and flip them for significant credits!!!

Graphic: Retrieved from SpotGamma. SMCI volatility skew.

In any case, there’s been a weakening under the surface of the indexes (see below).

Graphic: Retrieved from TradingView via Physik Invest. Black = Breadth Measure.

Later, when breadth improves, we can use the portfolio volatility-reducing trades discussed to cut costs or buy more stocks, anticipating upside continuation. According to Carson Group’s Ryan Detrick, the S&P 500 experienced its first close below the 50-day moving average in 110 trading days, marking the longest streak since 2011. Following similar streaks, stocks were higher three months later, 88% of the time, and six months later, 81% of the time. “A warning? Maybe, but maybe not.”

Graphic: Retrieved from Ryan Detrick of Carson Group.

If you enjoyed this week’s letter, comment below and share. Thanks and take care!

Categories
Commentary

Yield Hunger Sparks Concerns Of A Volmageddon Redux

Good Morning! I hope you are having a good week. I would be so honored if you could comment and/or share this post. Cheers!

As we step into Spring, we’re riding the wave of one of the strongest stock market rallies in over fifty years. It’s been a period of smooth sailing, with record highs beckoning transition from concern over potential downturns to the fear of being left out of further gains.

The BIS has commented on some of these trading behaviors, which can drive upward momentum and foster a sense of calm or low volatility. They point to the increased use of yield-enhancing structured products as a critical reason for reducing volatility. These products have stolen the show, boosting investor returns by selling options or betting against market fluctuations. In calm markets, those on the opposite side of these bets hedge in a way that reduces volatility: they buy when underlying asset prices dip and sell when they rise. As the supply of options increases, the liquidity injected to hedge stifles movement, resulting in a stubbornly low Cboe Volatility Index or VIX.

The BIS example illustrates a product that sells call options against an index position to lower the cost basis by collecting premiums. The counterparty buys call options and hedges by selling the same index. If the call options lose value or the market declines, the counterparty buys back the index they sold initially. This strategy is constructive and potentially bullish, especially in a rising market, as one could infer counterparties may postpone rebalancing to optimize profits (i.e., swiftly cut losses and allow profits to accumulate).

Graphic: Retrieved from Bank for International Settlements.

However, these trading behaviors come with risks. 

While individual stocks may experience volatility, the indexes representing them move begrudgingly. Investors have concentrated on selling options or volatility (the all-encompassing term) on indexes to fund volatility in individual components, a strategy known as dispersion. Although typically stabilizing, experts caution that it can end dramatically. One can look at the destructive selling in China as a cautionary example.

Kai Volatility’s Cem Karsan compares the trade to two sumo wrestlers or colossal plates on the Earth’s core exerting immense pressure against each other. While the trade may appear balanced and continue far longer, the accumulated pressures pose significant risks. Major crashes (up or down) happen when entities are compelled to trade volatility and options. Often, the trigger is the inability to cover the margin and meet regulatory requirements, causing a cascading effect (e.g., GameStop and 2020 crash).

The current scenario mirrors the conditions before Volmageddon, where short-volatility tactics failed. 

With implied correlations low, a market shock could see investors exiting their positions abruptly, amplifying volatility. Karsan notes a precursor to such a crash is a weakening supply of margin puts, particularly the highly convex and far out-of-the-money ones. These options play a significant role during stressful market periods, acting as indicators and drivers of impending crashes. The focus is on convexity (i.e., the rate of change of delta for changes in the underlying asset’s price or the nonlinear relationship between the option’s price and the underlying asset) rather than whether there are good odds the underlying asset will trade down to the options in question.

“Implied vol is about liquidity. It isn’t about fear or greed,” writes Capital Flows Research. “Implied vol is about liquidity on specific parts of the distribution of returns on an asset. Remember, even the outright price of an asset is pricing a distribution of outcomes, not a single destination. Options make this even more explicit by having various strikes and expirations with differing premiums and discounts.”

History shows a minor catalyst can lead to a dramatic unwind. Take what happened with S&P 500 options a day before XIV crash day.

“Going into the close the last hour, we saw nickel, ten, and five-cent options trade up to about $0.50 and $0.70,” Karsan elaborates. “They really started to pop in the last hour.”

“And then, the next day, we opened up and they were worth $10.00. You often don’t see them go from a nickel to $0.50. If you do, don’t sell them. Buy them, which is the next trade.”

Graphic: Retrieved from Bloomberg.

Similar to downward crashes, there are occasional but now more common upward crashes. 

Recent market movements, particularly the surge in stocks such as Nvidia, Super Micro Computer, and MicroStrategy, echo the frenzy seen with high-flying stocks like GameStop in 2021. This caused losses for some liquidity providers and funds that mistakenly equated the price or level of volatility with value, selling it at a discount to where it would eventually trade.

Graphic: Retrieved from Bloomberg via Simplify Asset Management’s Michael Green.

“I remember several traders I knew trying to short-vol on GME when it was at 300 because it was ‘cheap’ due to its level,” Capital Flows Research adds. “They were blown out of those positions.”

Graphic: Retrieved from Bloomberg via Capital Flows Research.

So, we have played along, nodding to George Soros’s famous statement: “When I see a bubble forming, I rush in to buy, adding fuel to the fire. That is not irrational.”

To explain, we go deeper into something known as implied volatility skew.

Skew refers to the difference in implied volatility across different strike options on the same underlying asset. Typically, options with farther away strike prices (out-of-the-money puts) have higher implied volatility than options with higher strike prices (at-the-money calls).

Implied volatility skew, as shown below, is often nonsymmetrical due to higher demand for downside protection.

When volatility skews become steeper, the disparity in implied volatility between various strike prices widens. For instance, the implied volatility of out-of-the-money (OTM) puts, which offer protection against market downturns, rises compared to at-the-money (ATM) puts and upside protection (calls). This steepening volatility skew indicates heightened apprehension among investors regarding potentially large downward market movements. Similarly, when the implied volatility of upside protection (calls) surpasses that of downside protection (puts), it signals growing concern (i.e., FOMO) about potential upward market movements. A steepening call volatility skew results from distant call options pricing higher implied volatility than usual due to investor demand/fear.

Graphic: Retrieved from Exotic Options and Hybrids: A Guide to Structuring, Pricing and Trading.

As savvy traders, we can construct creative structures and sell options against the closer ones we own to lower our costs on bullish trades. We detailed such bullish trades in our last two commentaries titled “BOXXing For Beginners” and “Foreshocks.” The outcomes for one of Physik Invest’s accounts are detailed below.

Graphic: Retrieved from TD Ameritrade’s thinkorswim platform.

Regrettably, enthusiasm is waning. Using Nvidia as an illustration, the stock surged 2.6% on Friday but plummeted 8% on the same day. The call skew was elevated over the weekend before leveling off earlier this week, which poses difficulties for traders betting on further upward movement.

Graphic: Retrieved from SpotGamma.

We discussed how such a flattening could foreshadow waning risk appetite and potentially herald market softness. SpotGamma indicates that call skews are flattening across the board, as illustrated in the chart below.

The red bars on the left represent approximately 90th percentile skews during a significant stock rally. However, a week later, on the right side, the skew rankings decline. “This appears like the uniformly bullish action in top tech stocks is breaking apart,” SpotGamma explains. This “is a reduction in bullish exuberance.”

Graphic: Retrieved from SpotGamma.

This activity will not likely disrupt the broader market; markets will stay intact as traders double down, selling shorter-dated volatility and buying farther-dated ones. We observe this using SpotGamma’s Fixed Strike Matrix below. In a simplistic sense, red indicates selling, while green suggests buying.

“By default, cells are color-coded red-to-green based on the Implied Volatility Z-Score,” SpotGamma explains. “If the cell is red, Implied Volatility is lower than the average implied volatility over the past two months. If the cell is green, Implied Volatility is higher than the implied volatility over the past two months.”

Graphic: Retrieved from SpotGamma on Monday, March 11, 2024.

The recent compression in short-term volatility aids stabilization, leading to restrained ranges in the indexes relative to components. Among these components, which drove the S&P 500 upwards, some big ones face downward pressure, partly due to the expiration of previously demanded/bought call options. This expiration prompts those initially selling these (e.g., call) options to re-hedge by selling the corresponding stocks.

Graphic: Retrieved from Damped Spring Advisors.

As the indexes remain fixed, the only resolution is a decline in correlation. As larger stocks decline, smaller constituents rise, contributing to the strength observed in the S&P 500 Equal Weight Index.

Graphic: Retrieved from Macro Ops.

Breadth can be evaluated naively by comparing the S&P 500 stocks trading above their 50-day moving average and examining the proportion of index constituents achieving new highs and lows. We see improvement, per the below.

Graphic: Retrieved from Physik Invest via TradingView. Breadth black. Correlation purple.

Based on the above explanation and graphics, after the triple witching expiration of futures, stock, and index options, traders may rebalance their portfolios and sell some of the remaining volatility they’ve bid. 

As explained earlier, this will further compress volatility, reducing the potential downside and providing critical support for stocks. Considering it’s an election year and policymakers prioritize growth over instability, Karsan suggests the market may remain stable with these forces above offering an added boost. Therefore, focus on creatively structuring longer-dated call structures and financing them with other trades to amplify return potential.

If the market consolidates without breaking, we may have the groundwork for a much bigger FOMO-driven call-buying rally culminating in a blow-off. Karsan adds that the signs of this “more combustible situation” would appear when “volatility remains persistent during a rally.” To assess combustibility, observe the options market. 

We remember that calls trade at lower implied volatility than puts, particularly from all the supply. As the market moves higher, it transitions to lower implied volatility, reflected in broad measures like the VIX. If the VIX measures remain steady or higher, “that indicates that fixed-strike volatility is increasing, and if this persists, … it can unsettle volatility and create a situation where dealers themselves … begin to reduce their volatility exposure, leading to a more combustible scenario.”

To elaborate on the reducing exposure note in the previous paragraph, if there is greater demand for calls, counterparties will take on more exposure and hedge through purchases of the underlying asset. The support dealers provide will diminish once this exposure expires. If the assumption is that equity markets are currently expensive, then after another rally, there may be more room for a decline, all else being equal (a simplified perspective), thus increasing risk and combustibility.

Graphic: Outdated. Retrieved from Nomura. To help explain.

This week, we discussed a lot of information. Some of it may need to be explained better. Therefore, we look forward to your feedback. Separately, I wish my friend Giovanni Berardi congratulations on starting his newsletter. I worked with Berardi, giving him input on some of his positioning-related research. He shares his insights here. Please consider supporting him with a subscription. Cheers, Giovanni!

Categories
Commentary

Foreshocks

Good Morning! I hope you are having a good start to the week. I would be so honored if you could comment and/or share this post. Cheers!

There is lots of buzz around bubbles and euphoria.

Since late 2022, the Nasdaq 100 has increased by ~75%, and the S&P 500 has increased by ~50%. However, there were some bumps along the way. In mid-to-late 2023, people got worried about the economy, which boosted interest rates. But in November 2023, investors discovered the government would issue less debt, decreasing interest rates. This was good news because future profits are more valuable now when interest rates drop (i.e., lower discount rates elevate the present value of future cash flows), so stocks tend to rise.

The general idea is that stocks will likely keep rising because of the promise of AI and expected profits growing faster than stock prices. Also, people think this will happen as the economy grows and inflation decreases. But it’s not just those factors. How people invest right now is also a big reason why stocks may increase.

Much Further To Run?

The primary catalyst lies in the imbalance of investor positioning stemming from the aftermath of ZIRP (Zero Interest Rate Policy), Fallacy Alarm elaborates. The conclusion of ZIRP reintroduced fixed-income securities as viable investments, prompting investors to boost their fixed-income allocations significantly in recent times.

Further asset rotation could manifest through a stagnant or declining stock market coupled with rising yields or through a robust stock market alongside stagnant or falling yields.

Accordingly, investors are now pursuing stocks at seemingly elevated valuations.

Graphic: Retrieved from Bank of America via Bloomberg.

Fallacy Alarm adds color, making an interesting point on elevated valuations.

Bubbles (the hot topic) are not solely about prices; the collective portfolio allocation characterizes them. We dive further, finding there is room to expand. Per Bloomberg’s John Authers, the market is not as absurd, with the Magnificent Seven aligning more closely with the broader market than before.

Graphic: Retrieved from Ray Dalio.

Additionally, Authers says that the S&P 500 remains relatively inexpensive, with room to go based on global liquidity, subdued margin debt levels, and not overly elevated single-stock call option volumes.

Graphic: Retrieved from Ray Dalio.

“The S&P 500 looks extended in absolute terms when measured by US domestic liquidity flows, but it looks far more comfortably placed when Global Liquidity is the benchmark,” CrossBorder Capital’s Mike Howell states. “US equities have got much further to run if we can reassure ourselves that Wall Street has become the ‘World market’ for stocks. Indeed, this might be plausible given the dominance of US firms in tech and AI applications?”

Graphic: Retrieved from CrossBorder Capital via Bloomberg.

Embedded Risks To Rally

Some others are more cautious regarding the options volumes.

Nomura’s Charlie McElligott suggests the fear of a “crash up” causes a steeper call skew (i.e., the asymmetry in implied volatility levels across different strike prices). We see this with the positive relationship between spot prices and implied volatility. Additionally, volatility selling and structured product issuance may present risky dislocations.

Graphic: Retrieved from SpotGamma.

Some experts, like QVR Advisors, agree, note that selling volatility doesn’t offer the same returns with less risk as it used to. Instead, it’s now seen as taking on more risk for lower returns.

Graphic: Retrieved from QVR Advisors.

Options Volatility And Pricing

SpotGamma acknowledges these trends and dislocations can persist for some time.

So, what do we do about that?

In last week’s detailed “BOXXing For Beginners” letter, we discussed getting selective and trading soaring stocks using creative options structures. Remaining faithful to our approach, we traded Super Micro Computer Inc (NASDAQ: SMCI) throughout the past week, utilizing a steep call skew to play upside potential at lower costs.

The outcomes for one of our accounts are detailed below.

Most positions were opened with modest credits and gradually closed with larger ones following news of its upcoming inclusion in the S&P 500. A significant portion of the profits were captured when the value of the 8 MAR 24 series reached its peak on Monday morning. During such moments, especially when nearing expiry, it’s crucial to pay attention to the market, closely monitoring the responsiveness of the spreads to underlying price action. When this responsiveness slipped in the morning, we closed all the positions, timing the peak on the structures at ~$5.00.

Graphic: Retrieved from TD Ameritrade’s thinkorswim platform.

Managing ‘Greeks’ Versus ‘PnL’

When it is that late, as it was in the above trade, you are more focused on managing the PnL (i.e., profit and loss) and not Greek risk (i.e., the set of risk measures used to assess the sensitivity of option prices to changes in various factors, such as underlying asset price or delta, time decay or theta, volatility or vega, and interest rates or rho).

Accordingly, despite SMCI moving higher, the same spreads traded at a ~90% discount per late-Monday pricing. On Tuesday, that discount lessened to ~60%. Regardless, the right decision was to roll into similar, albeit wider, structures in anticipation of that same index effect that drove shares of Tesla Inc (NASDAQ: TSLA) higher in 2020 with its inclusion in the S&P 500.

Graphic: Retrieved from Physik Invest.

When trading these high-flying stocks, the level of risk often hinges on your exposure to vega. This risk can be mitigated by widening the gap between the closer long (+1) and farther away short (-2) options strikes. 

Here’s the rationale.

As the underlying asset moves along its skew curve, the impact of volatility on delta shifts, driven by increased implied volatility from options demand. Events, such as the market decline in 2020 and the meme stock frenzy in 2021, have illustrated how the implied volatility of out-of-the-money options can spike significantly more than the underlying asset’s movement.

Option exposures can exacerbate volatile situations through covering and hedging activities—a squeeze can occur caused by substantial movements and dramatic increases in options prices.

As mentioned last week, a straightforward method to assess the safety of such trades is by examining the pricing of fully in-the-money spreads. If these spreads trade at large credits to close, they are worth considering. Conversely, if the spreads require a debit to close, it’s advisable to steer clear. For those focused on the Greeks, aim for flat or positive exposure to vega.

Conclusions

In any case, the moral is as follows: many seem to be turning optimistic and raising their expectations while some pockets of irrationality, albeit not extreme, are popping up.

Sure, stocks may be cheap and not in a bubble to some, with added support coming from investors (re)positioning, earnings growth, and falling inflation, but there are slight shifts that may draw concern.

Such slight shifts can include the flattening of call skew, foreshadowing a waning appetite for risk, and potentially heralding market softness. Additionally, SpotGamma’s Brent Kochuba has shared data that points to lower correlations aligning with interim stock market highs, presenting more cause for caution.

While the allure of record highs may be enticing, we look to lock in some inflation protection as shared last week, participate in the upside creatively, be that in metals or high-flying stocks, and hedge using similarly creative structures on the downside, albeit much wider and with protection (e.g., Long Put Butterfly), and favorable Greeks (-delta, +gamma, +vega). There are many more details to add, but we will finish here to publish the newsletter as soon as possible. Cheers!

Graphic: Retrieved from DATATREK via Barchart. The current market conditions, again, don’t indicate a bubble.
Categories
Commentary

Reversion To The Meme

Good Morning! I hope you had a great weekend and enjoy today’s letter. I would be so honored if you could comment and/or share this post. Cheers!

After a period of taking the stairs up, markets took the elevator down last week. Through Tuesday, the S&P 500 fell over 2.5% on a Consumer Price Index (CPI) print, which signaled higher-than-expected inflation. Internally, the selling was heavy.

Graphic: Retrieved from TradingView. Market Internals as taught by Shadowtrader’s Peter Reznicek.

Additionally, options were repriced in a big way.

Graphic: Retrieved from Bloomberg via Options Insight.

Let’s digress. 

Recall that options implied volatility is a measure of the market’s expectation of the future volatility of an underlying asset, as reflected by the supply and demand of options themselves. Higher implied volatility indicates more significant expected price fluctuations.

Options implied volatility skew refers to the unevenness in implied volatility levels across different strike prices. Steep, smile-looking, or v-shaped volatility skew reflects a scenario where increased market volatility disproportionately impacts farther away strike options due to (expected) losses from more frequent delta rebalancing in a moving market. Options traders assign higher implied volatility to those farther away strike options to compensate for increased risk/cost, often enabling savvy traders to exploit these variations to reduce their hedging costs.

Moreover, before last week’s drop, the S&P 500’s implied volatility skew was subdued, as indicated by the grey-shaded area below. Tuesday’s decline coincided with increased options trading activity and demand, leading to a notable upward shift in skew. Distant S&P 500 put options experienced significant increases in implied volatility (see the below grey line moving away from the shaded area).

Graphic: Retrieved from SpotGamma. Volatility skew for S&P 500 options expiring March 15, 2024.

Though skew remains elevated, broader implied volatility measures, such as the Cboe Volatility Index or VIX, declined as rapidly as markets rallied in the days following Tuesday’s downturn.

What’s happening?

Despite further negative economic indicators, such as hot producer prices or weaker retail sales and manufacturing output, markets surged strongly, closing the week almost unchanged. Beyond significant investor inflows into stocks, totaling approximately $16 billion on Wednesday, according to Bank of America Corporation, analysis of S&P options positioning revealed mechanical demand for the S&P 500, as highlighted by SqueezeMetrics. Higher implied volatility strengthened an automatic buying mechanism, supporting markets.

Graphic: Retrieved from SqueezeMetrics. Dealer S&P 500 Vanna Exposure or VEX.

This phenomenon is partially attributed to the significant options selling discussed in our recent newsletters, acknowledging the warnings issued by Cem Karsan of Kai Volatility and Kris Sidial of The Ambrus Group. Essentially, there’s been a rush among options sellers to enter into sizable positions, exemplified by the substantial options selling activity observed last week. UBS Group highlighted the persistence of this concerning toxic flow, noting aggressive trader actions, such as the sale of “70K of Thursday expiry 4120 puts at 0.05 on Wednesday.”

Graphic: Retrieved from Goldman Sachs Group Inc.

The estimated risk profile of this position is provided below (please allow for a margin of error of a day or two due to expiry). Essentially, it’s unfavorable, with the option seller at risk of losing much money if the market drops or implied volatility increases. Please be aware that we’re assessing this position independently, without knowledge of the option seller’s overall portfolio, including potential risk offsets from other positions they may hold.

Graphic: Retrieved from TD Ameritrade’s thinkorswim platform using the Analyze function.

Customers favoring such positive delta “short skew” positions prompt dealers on the other side to assume a negative delta (i.e., make money if the market is lower or implied volatility is higher) “long skew” or “long options” position, which they may manage through the sale of put options or the purchase of call options, underlying stock shares, or futures for hedging purposes. For a deeper understanding of these mechanisms, refer to SqueezeMetrics’ paper, “The Implied Order Book.”

Graphic: Retrieved from SqueezeMetrics.

This all happened during a seasonally weak period. We’ll go past the positioning side of things in a moment, so bear with me, but you can see the drop-off in options deltas following mid-February below.

Graphic: Retrieved from ConvexValue.

In essence, despite the anticipated reduction in options-based support, which Cem Karsan describes as a “window of non-strength” or a scenario conducive to increased volatility, the market’s reaction to Tuesday’s drop stemmed volatility. Observing these dynamics in real-time, here’s how we responded.

Graphic: Retrieved from Goldman Sachs Group Inc.

We had proactively positioned ourselves for a potentially weaker February, capitalizing on overlooked hedge opportunities outlined in recent newsletters—specifically, put spreads like butterflies. Others did similar, with Nomura Americas Cross-Asset Macro Strategist Charlie McElligott noting increased buying of put butterfly spreads in recent weeks (please see our late January and early February letters).

Depending on their setup (including the distance between strikes, the distance from the spot price, and the expiration timeframe), these spreads were positioned to profit from market declines. When the drop occurred, the unbalanced, very far out-of-the-money structures were priced to be closed at a small debit loss when the skew elevated substantially. Utilizing real-time analysis, we concluded it was opportune to increase our exposure to these far out-of-the-money units, capitalizing on the surge in implied volatility while cashing in on the closer spreads priced for a credit profit.

Graphic: Retrieved from Goldman Sachs Group Inc.

As markets recovered, we closed the recently initiated riskier spreads, freeing up buying power for opportunities elsewhere, such as in NVIDIA Corporation (NASDAQ: NVDA) and Super Micro Computer Inc (NASDAQ: SMCI), where a significant volatility skew, driven by heightened call options trading, enabled us to generate credit from short-dated spread trades.

By Friday’s end, we achieved one of our most successful weeks of the year, boosting our confidence and reinforcing our patience with underperforming trades, like the put butterfly hedges. PAY-tience!

Graphic: Retrieved from TD Ameritrade’s thinkorswim platform.

What motivated our actions? Let’s elaborate.

Tactically, we favor owning options to express our opinions efficiently selling options further out to reduce costs. Occasionally, we will utilize a ratio, such as selling two options for every one purchased. For those less experienced, simplicity often proves effective. Consider straightforward approaches like purchasing a wide put vertical, entailing buying a put, and selling a put at some greater distance. Depending on your position, the returns may come in at multiples of each unit of risk undertaken.

Furthermore, the speculative trading and crowded positions in equities (as previously discussed in this and prior newsletters), along with the persistent volatility skew (as indicated by the yellow line compared to the grey line below), imply that hedging strategies (such as owning longer-dated calls and selling stock/futures as a combination, or using put option spread strategies to hedge shares) may continue to be appealing.

Graphic: Retrieved from SpotGamma. Volatility skew for S&P 500 options expiring March 15, 2024.

In terms of what to hedge, as highlighted by Fallacy Alarm, mid-February traditionally signals local market peaks due to significant cash injections followed by selling pressure to cover tax obligations. Additionally, a dilemma presents itself: should the focus be on combating inflation or stimulating growth? Presently, the data would dissuade anticipated rate cuts, though such actions might be contemplated if the Personal Consumption Expenditure, a key metric, points to lower price increases, particularly in services. Current interest rate projections suggest a bimodal scenario with a low probability of sudden rate declines.

Graphic: Retrieved from Bloomberg.

As further context, John Authers of Bloomberg says there remains a risk of overheating or a scenario where the economy remains robust, eventually forcing the Federal Reserve (Fed) to tighten policies until it precipitates a recession. This is in disagreement with TS Lombard. They question whether the Fed’s current stance is overly restrictive, while Bob Elliott of Unlimited Funds suggests that rates may decrease in response to slowing growth. Eventually, the persistent inflation stemming from structural factors could prompt subsequent rate hikes driven by increased funding needs.

Graphic: Retrieved from Sven Henrich.

Traders must remain vigilant, adopting strategic approaches to hedge exuberance and so-called windows of non-strength. Should there be “a stronger catalyst than a telegraphed CPI print,” says Kris Sidial, then “both tails and skew are likely to perform well,” with any rally, given the short-volatility, likely to unsettle positioning, leading dealers to boost momentum and whipsaw. In other words, much lower or higher markets, coupled with more demand for puts or calls respectively, means dealers take on more short volatility risk, which they adjust for by repricing options higher and hedging with underlying asset sales (in the case of puts) or purchases (in the case of calls).

Graphic: Retrieved from Bank of America Corporation.

In conclusion, we remain mindful that it’s an election year, which could lead to heightened monetary and fiscal support in response to any weaknesses. While we maintain a positive outlook over the long term, we’re less optimistic in the short term.

This week, our attention is directed toward protecting our cash by rolling our remaining S&P 500 box spreads (acting as synthetic T-bills without impacting our buying power). We aim to secure these interest rates, keep a close watch on high-performing assets like silver, and replenish our long put skew (i.e., purchasing put spreads) in equities to hedge against potential vulnerabilities ahead. Following earnings announcements, we may resume engagement with companies such as Nvidia.

Graphic: Example of trade structuring. Retrieved from Physik Invest. This does not accurately represent this newsletter writer’s position. However, it is close. Note that one may own stock on top of this and view positions in aggregate.

If you’re wondering what’s up with the newsletter formatting over the past weeks, we are trying stuff. Let us know what you like and don’t like. Cheers, and have a good week! And, finally, if you can, share!

The cover photo was retrieved from a RidgeHaven Capital post on Seeking Alpha.