Categories
Commentary

Market Commentary For The Week Ahead: ‘The Flow Won’

Key Takeaways:

What Happened: Amid a volatile, news-heavy week, after a slew of earnings reports by heavily weighted index constituents, and an FOMC meeting that made no change to existing monetary policy, financial markets experienced a rapid de-risking, similar to what transpired prior to the sell-off in February 2020.

What Does It Mean: After extending the S&P 500’s rally, as well as establishing acceptance near the $3,850.00 price extension, an upside target, and excess (i.e., a proper end to price discovery), participants auctioned back into range, repairing poor structures left in the wake of initiative buying.

The action found acceptance below the $3,824.00 – $3,763.75 balance-area, invalidating the prior week’s break-out to new highs.

Since then, market participants were witness to violent two-sided trade, a result of the market transitioning into a short-gamma environment (Graphic 1).

In such case dealers hedge derivatives exposure by buying into strength and selling into weakness. This, will exacerbate volatility.

Graphic 1: SpotGamma data suggests S&P 500 has entered short-gamma environment

In a conversation for a Benzinga article to be released this coming week, I spoke with Kris Sidial, co-chief investment officer at The Ambrus Group, a volatility arbitrage fund, regarding GameStop Corporation (NYSE: GME) share price volatility, market microstructure, and regulation.

According to Sidial, the dynamics that transpired in GameStop can be traced back to factors like Federal Reserve stabilization efforts, and low rates, which incentivize risk taking (see Graphic 2).

“The growth of structured products, passive investing, the regulatory standpoint that’s been implemented with Dodd-Frank and dealers needing to hedge off their risk more frequently, than not,” are all part of a regime change that’s affected the stability of markets, Sidial notes. 

“These dislocations happen quite frequently in small windows, and it offers the potential for large outlier events,” like the equity bust and boom during 2020. “Strength and fragility are two completely different components. The market could be strong, but fragile.”

The aforementioned regime change is one in which dealer exposure to direction and volatility promotes crash up and down dynamics. Last February, the market was heavily one-sided with participants, like target date funds (e.g., mutual funds), selling far out-of-the-money puts on the S&P 500 for passive yield, and investors buying-to-open put options in an increasing amount for downside exposure, thus exacerbating volatility. 

Graphic 2: Newfound Research unpacks market drivers, implications of liquidity.
Graphic 3: SqueezeMetrics highlights implications of volatility, direction, and moneyness.

Last week, per Graphic 4, the SPDR S&P 500 ETF Trust, the largest ETF that tracks the S&P 500, saw a rise in purchases of downside protection with time, which will likely lead to an increase in implied volatility and sensitivity of options to changes in underlying price.

These risks will be hedged off by dealers selling into weakness (see Graphic 3), thereby exacerbating downside volatility.

Graphic 4: Physik Invest maps out the purchase of call and put options in the SPDR S&P 500 ETF Trust, for the week ending January 30, 2021.

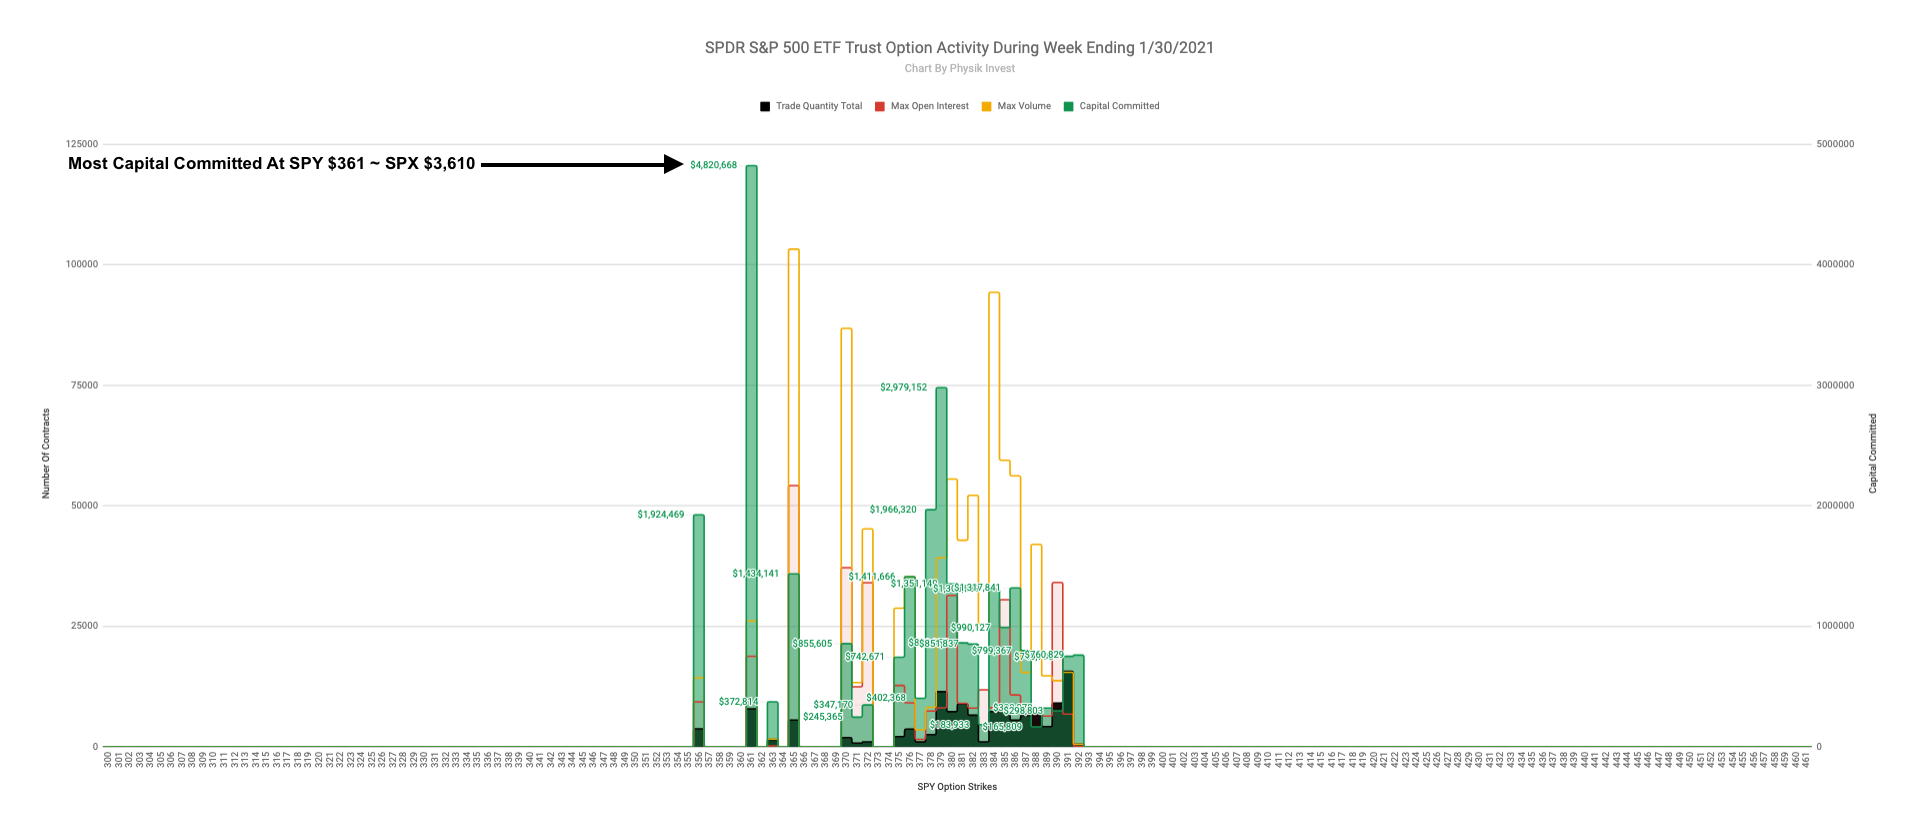
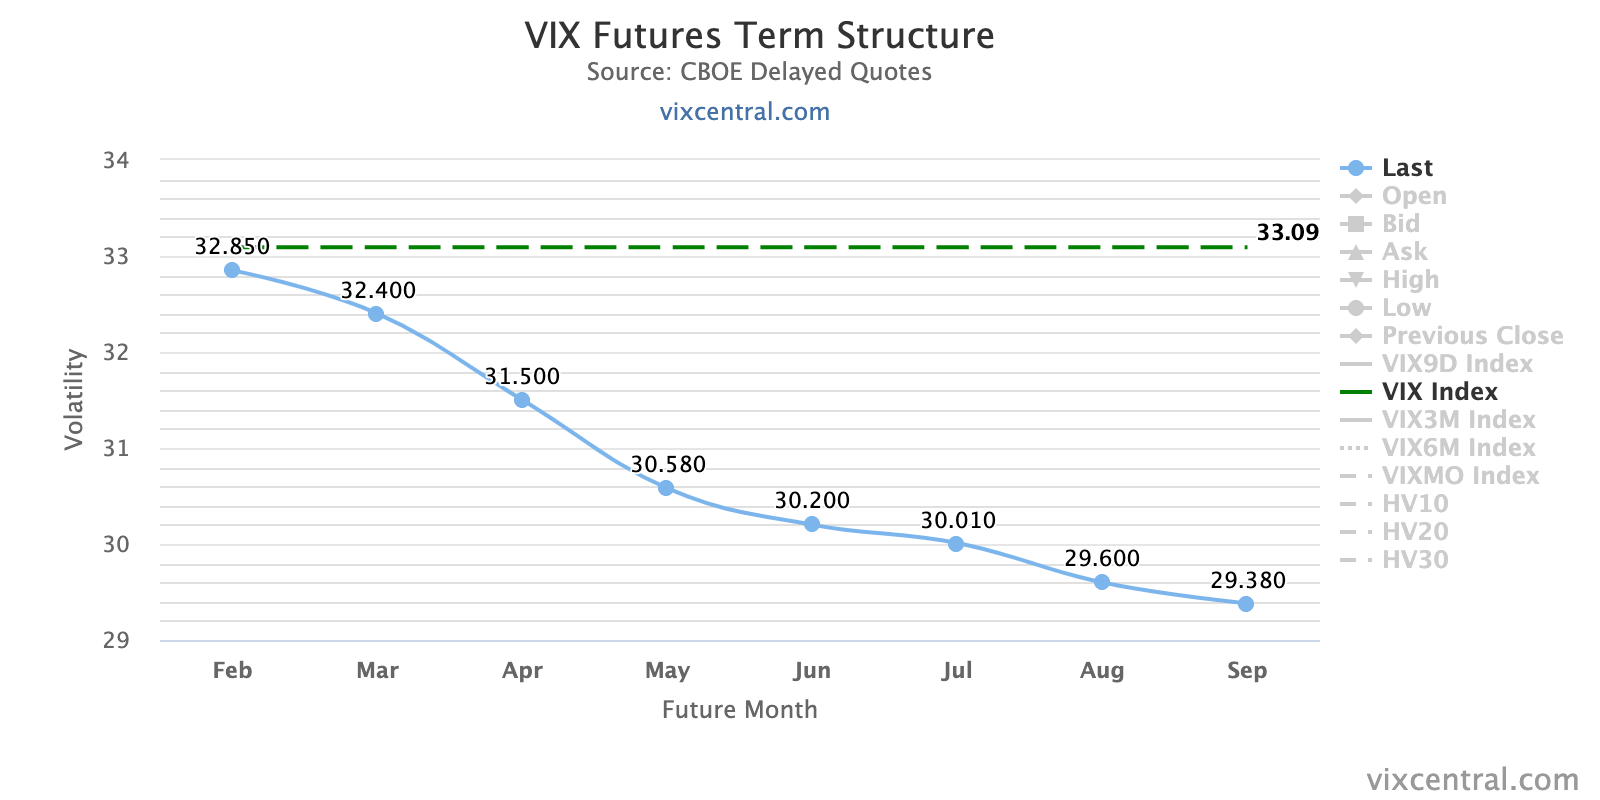
The activity was most concentrated in put options with a strike price of $361, corresponding with $3,610 in the cash-settled S&P 500 Index (INDEX: SPX). This, alongside the market’s entry into short gamma, and an inversion of the VIX futures term structure (see Graphic 5), in which longer-dated VIX expiries are less expensive, is a warning of elevated near-term risks for equity market stability.

Graphic 5: VIX Futures Term Structure per vixcentral.com.

What’s more? Aside from breaking technical trend (Graphic 6) is DIX, a proxy for buying derived from short sales (i.e., liquidity provision on the market making side) declining, and the presence of divergent speculative flows and delta (e.g., non-committed buying as measured by volume delta).

Graphic 6: Cash-settled S&P 500 Index experiences technical breakdown.
Graphic 7: DIX by SqueezeMetrics suggests large divergence between price and buying on January 27.
Graphic 8: Divergent Delta in the SPDR S&P 500 ETF (NYSE: SPY), the largest ETF that tracks the S&P 500.

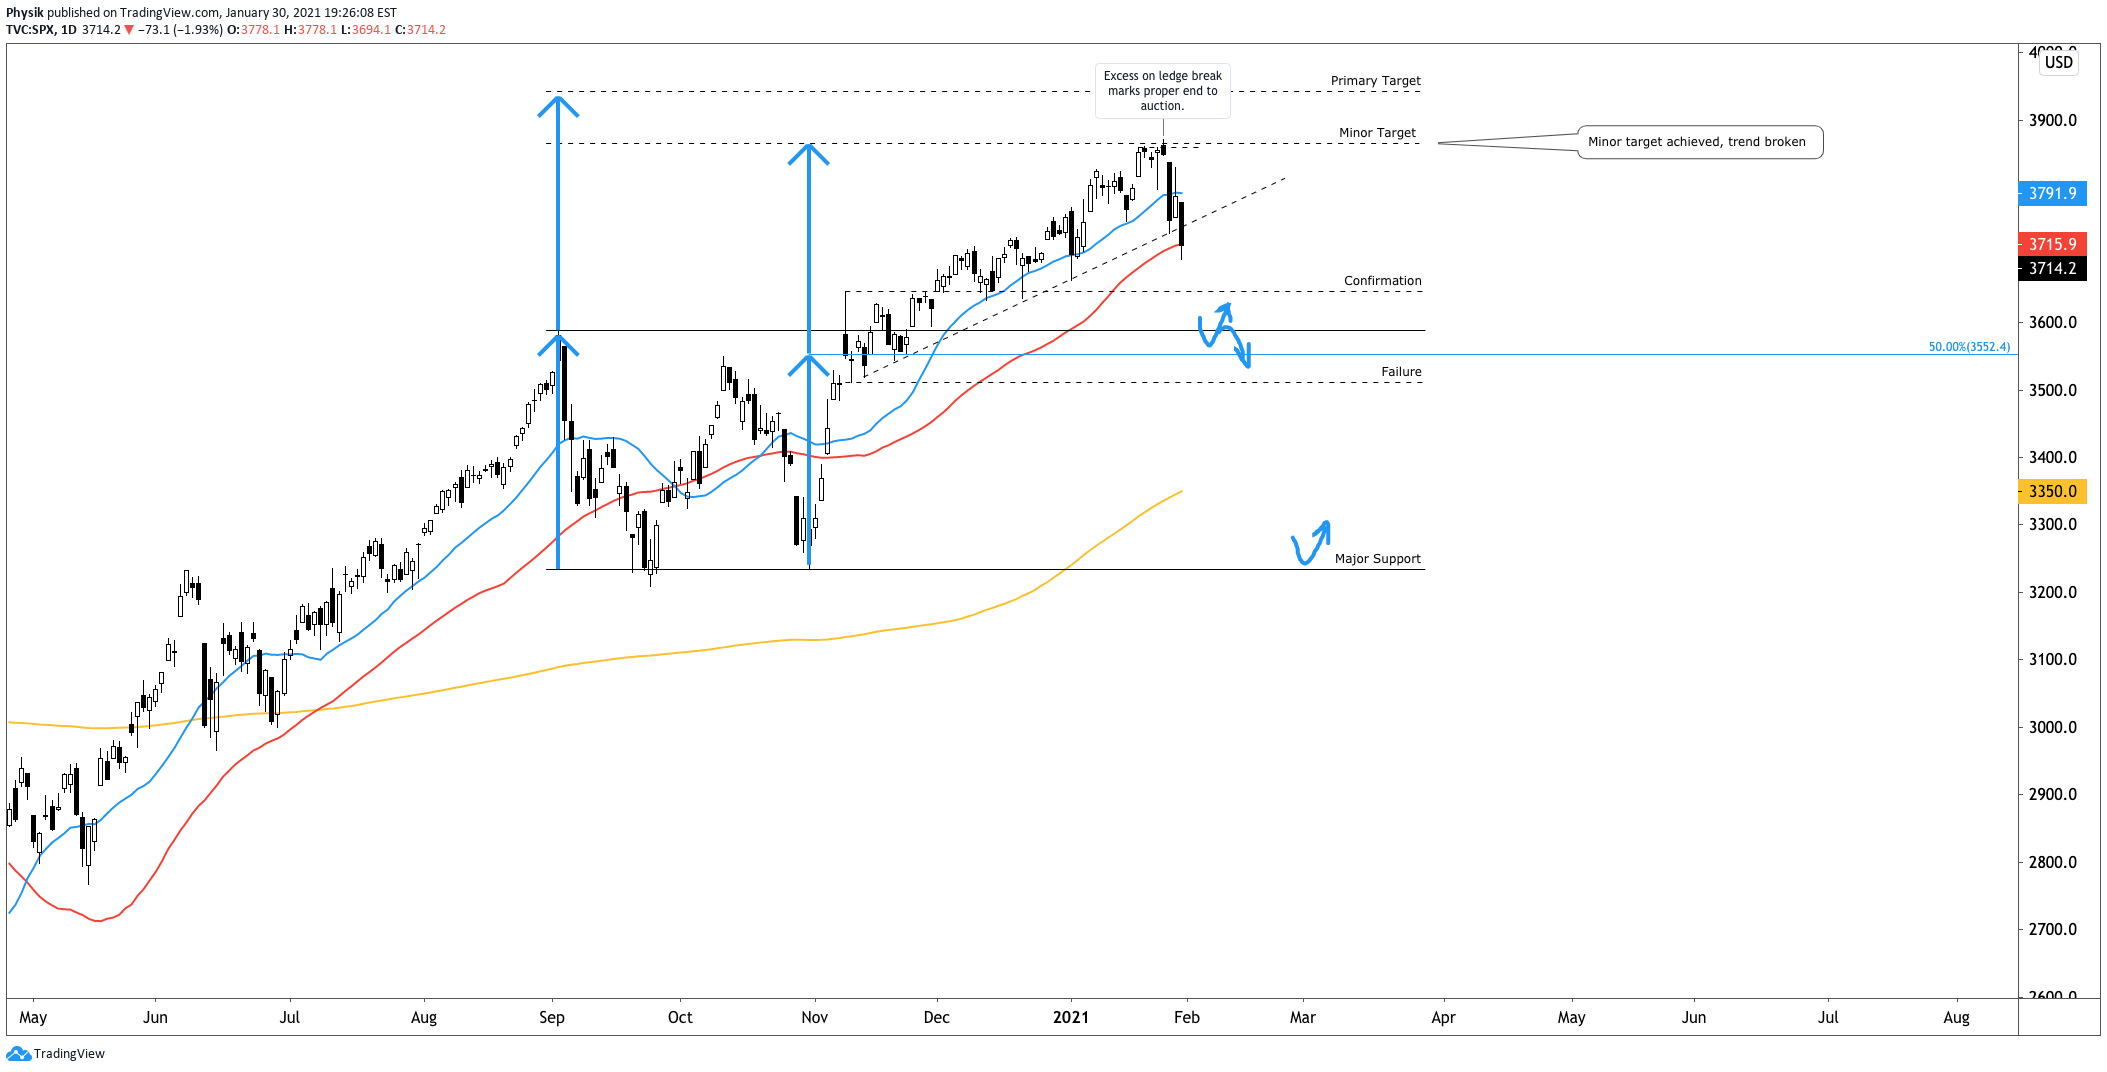
What To Expect: In light of the technical breakdown U.S. stock indexes are best positioned for downside discovery.

As a result, participants ought to zoom out, and look for valuable areas to transact.

Graphic 9: 4-hour profile chart of the Micro E-mini S&P 500 Futures.

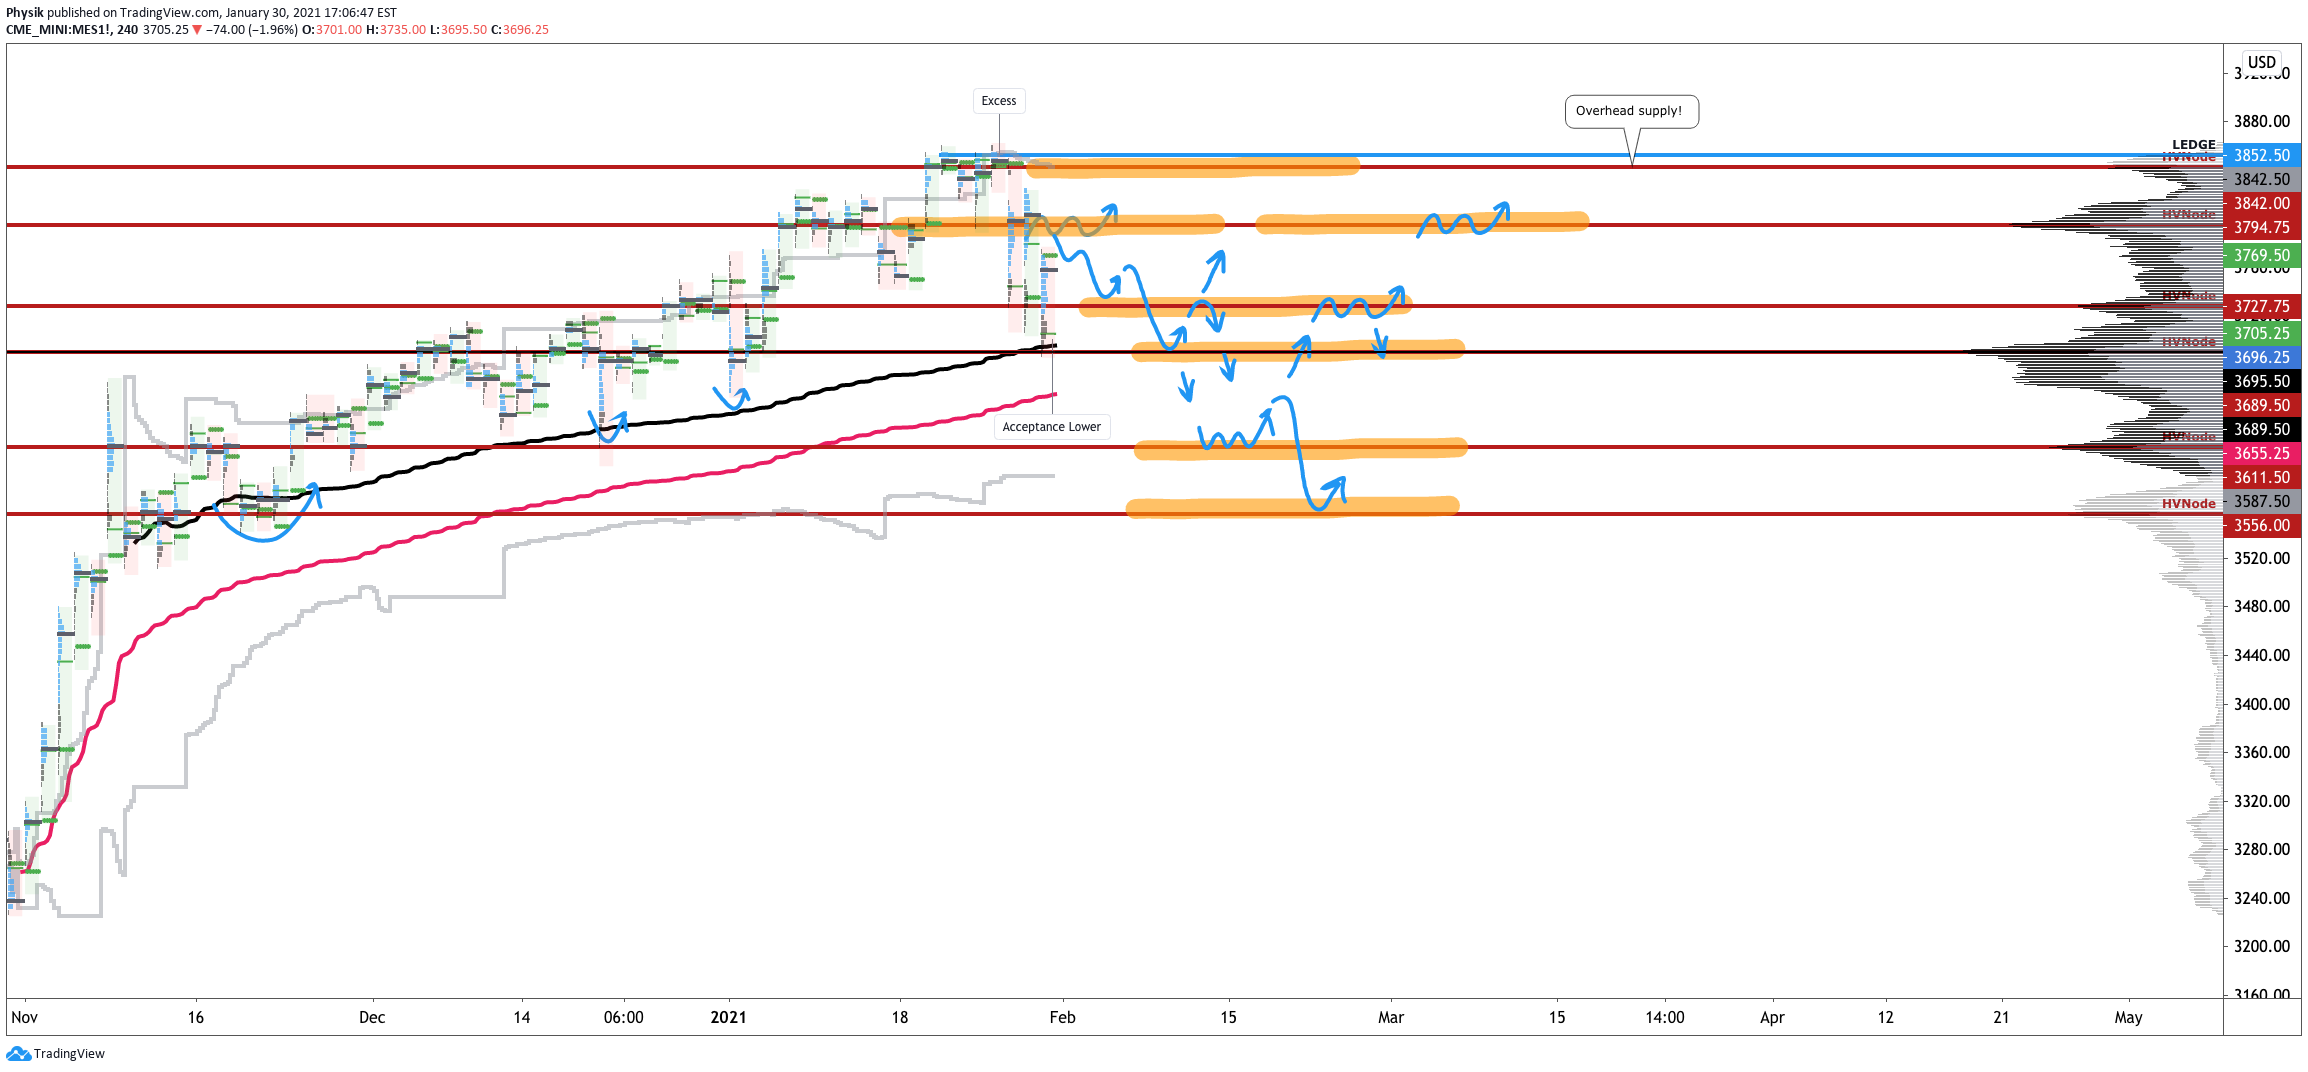
In Graphic 9, the highlighted zones denote high-volume areas (HVNodes), which can be thought of as building blocks.

A structurally sound market will build on past areas of high-volume. Should the market trend for long periods of time, it will lack sound structure (identified as a low-volume area which denotes directional conviction and ought to offer support on any test). 

If participants were to auction and find acceptance into areas of prior low-volume, as they have in the week prior, then future discovery ought to be volatile and quick as participants look to areas of value for favorable entry or exit.

Additionally, it’s important to remember what the market’s long-term trajectory is: up.

Late last year, JPMorgan Chase & Co. (NYSE: JPM) strategist Marko Kolanovic suggested equities would rally short-term with the S&P 500 auctioning as high as $4,000 on the basis of low rates, improved fundamentals, buybacks, as well as systematic and hedge fund strategies. Since then, Kolanovic has downgraded growth and suggested the limited potential for further upside despite odds of a sustained economic recovery.

Note, Kolanovic has not called for an implosion in equity markets. Instead, the market is due for some downside discovery given a moderation in the recovery.

Given the above dynamics, the following frameworks apply for next week’s trade.

In the best case, the S&P 500 takes back Friday’s liquidation and auctions above the $3,727.75 HVNode. Expectations thereafter include continued balance.

In the worst case, any break that finds increased involvement (i.e., supportive flows and delta) below the $3,689.50 HVNode, would favor continuation as low as the $3,611.50 and $3,556.00 HVNodes. Note that the second to last HVNode corresponds with the $361 SPY put concentration, which may serve as a near-term target, or bottom, for this sell-off, given last week’s activity at that strike.

Graphic 10: Profile overlays on a 15-minute candlestick chart of the Micro E-mini S&P 500 Futures.

Conclusions: Participants ought to look for favorable areas to transact, such as those highlighted areas in the S&P 500, featured in Graphic 9.

Big picture, the sell-off ought to be bought, just not yet. Per Graphic 11, euphoria is still too high.

Graphic 11: Bank of America Corporation (NYSE: BAC) sentiment indicators.

Levels Of Interest: $3,727.75, $3,689.50, $3,611.50 and $3,556.00 HVNodes.

Cover photo by Pixabay from Pexels.

Categories
Commentary

Market Commentary For 1/29/2021

Notice: To view this week’s big picture outlook, click here.

What Happened: After a slew of the earnings reports by heavily weighted index constituents, U.S. index futures further accepted lower prices.

What Does It Mean: Earlier in the week, the S&P 500 failed to drum up initiative buying after an upside break of the $3,852.50 ledge. Participants sold the break, introducing excess (which forms after an auction has traveled too far in a particular direction and portends sustained reversal) and acceptance below the $3,824.00 – $3,763.75 balance-area. This invalidated last week’s break-out to new highs.

Since then, market participants were witness to violent two-sided trade, a result of the market moving into a short-gamma environment (graphic 1); in such cases dealers hedge their derivatives exposure by buying into strength and selling into weakness. This, alongside the presence of short-term traders in U.S. equities (as evidenced by selling that transpired at yesterday’s high, since institutions tend not to transact at exact technical levels) will exacerbate volatility.

Graphic 1: SpotGamma data suggests S&P 500 has entered short-gamma environment

Adding, it’s important to bring back yesterday’s graphics that showed a proxy for buying derived from short sales (i.e., liquidity provision on the market making side) decline and a substantial change in tone in terms of speculative derivatives activity.

Since posting graphics 2 and 3, the bearish thesis is still intact. This is due to the divergent speculative flows and delta (e.g., presence of non-committed buying or selling as measured by volume delta) during Thursday’s session, as can be viewed in Graphic 4. This information means that the short-covering rally that lasted much of yesterday’s regular trade was not supported; increased capital was not committed into yesterday’s highs.

Graphic 2: Speculative derivatives activity for January 27, 2021
Graphic 3: DIX by Squeeze Metrics suggests large divergence between price and buying
Graphic 4: Divergent Delta in the SPDR S&P 500 ETF (NYSE: SPY), the largest ETF that tracks the S&P 500

What To Expect: Friday’s regular session (9:30 AM – 4:00 PM ET) will likely open inside of prior-balance and -range, suggesting limited directional opportunity.

Given today’s month-end derivatives expiry and yesterday’s acceptance inside of the $3,824.00 – $3,763.75 balance-area, the odds of substantial downside during Friday’s session is low. Instead, participants should position themselves for two-sided, responsive trade.

Still, because the market initiated out of balance, lower, responsive sellers have been emboldened. As a result, participants ought to respond to probes into value. Therefore, as long as the S&P 500 remains below the $3,794.75 high-volume node (HVNode), an area that offers favorable entry and exit, the bearish narrative remains intact.

The go/no-go for upside is the $3,823.75 regular-trade high. The go/no-go for downside is $3,721.00 overnight low. Anything in-between portends responsive, non-directional trade.

Above $3,823.75 puts in play the $3,842.00 HVNode. Below $3,721.00 , participants ought will look to respond to the $3,611.50 and $3,556.00 HVNodes, in the worst case.

Graphic 5: 4-hour profile chart of the Micro E-mini S&P 500 Futures

Levels Of Interest: $3,823.75 regular-trade high, $3,721.00 overnight low.

Categories
Commentary

Market Commentary For 1/28/2021

Notice: To view this week’s big picture outlook, click here.

What Happened: Alongside the earnings of heavily weighted index constituents and news the Fed would maintain monetary stimulus amid a slowing recovery, U.S. index futures sold heavy Wednesday, and found acceptance at lower prices during the overnight session.

What Does It Mean: During Wednesday’s regular trade in the S&P 500, market participants were unable to maintain higher prices.

This came as the market failed to drum up initiative buying after an upside break of the $3,852.50 ledge, in addition to profile structures denoting the presence of excess (which forms after an auction has traveled too far in a particular direction and portends sustained reversal). Both of the prior occurrences provided increased confidence among responsive sellers.

Additionally, participants saw a proxy for buying derived from short sales (i.e., liquidity provision on the market making side) decline and a substantial change in tone in terms of speculative derivatives activity.

Graphic 1: Speculative derivatives activity for January 27, 2021
Graphic 2: DIX by Squeeze Metrics suggests large divergence between price and buying

What To Expect: Thursday’s regular session (9:30 AM – 4:00 PM ET) will likely open inside of prior-balance and -range, suggesting limited directional opportunity.

Further, yesterday’s move through the $3,824.00 – $3,763.75 balance-area was the most negative outcome and portends further downside discovery.

Graphic 3: 15-minute chart of the Micro E-mini S&P 500 Futures show near-term damage to bullish thesis

Given that increased capital was not committed into yesterday’s lows, evidenced by a divergent delta (i.e., the difference between buying and selling pressure), participants can expect a near-term low, per graphic 4.

Graphic 4: Divergent delta in the SPDR S&P 500 ETF Trust (NYSE: SPY), the largest ETF that tracks the S&P 500

That said, because the market initiated out of balance, lower, responsive sellers have been emboldened. As a result, participants ought to respond to probes into value. Therefore, as long as the S&P 500 remains below the $3,794.75 high-volume node (HVNode), an area that offers favorable entry and exit, the bearish narrative remains intact.

The go/no-go for upside is the $3,806.50 regular-trade high. The go/no-go for downside is $3,703.25 overnight low. Anything in-between portends responsive, non-directional trade.

Above $3,806.50 puts in play the $3,842.00 HVNode. Below $3,703.25, participants ought to look to the $3,611.50 and $3,556.00 HVNodes.

Graphic 5: 4-hour profile chart of the Micro E-mini S&P 500 Futures

Levels Of Interest: $3,806.50 regular-trade high, $3,703.25 overnight low.

Categories
Commentary

‘To Infinity And Beyond’: Market Commentary For The Week Ahead

Key Takeaways:

What Happened: During last week’s trade, U.S. index futures auctioned to new all-time highs, before moving back into balance.

What Does It Mean: After participants established an all-time rally high during Wednesday’s overnight session, the S&P 500 liquidated in regular trading, down to the micro-composite high-volume node near $3,667.75, a price level where participants spent a large amount of time in the past. The session ended in prior balance and range with poor profile structure denoting the presence of directional conviction.

For the remainder of the week, participants accepted lower prices until Friday’s session established minimal excess lows, broke into prior poor structure, and ended the technical downtrend. 

Given the mechanical trade (i.e., minimal excess at Friday’s lows) and poor structure (e.g., low-volume areas), it’s very likely that the selling range extension was the result of weak-handed, short-term momentum buyers liquidating positions in panic.

Pictured: Profile overlays on a 65-minute candlestick chart of the Micro E-mini S&P 500 Futures

What To Expect: Friday’s session found responsive buyers surface at a key technical level (i.e., the high-volume node near $3,630.00 and 20-day simple moving average). The fact that there was a response at a technical reference confirms that participation in the market is overwhelmingly short-term; in other words, institutions (e.g, funds) tend not to transact at exact technical levels. 

Given that the higher-time frame breakout remains intact, participants will come into Monday’s session knowing the following:

  1. Both sentiment and positioning are historically stretched while the market has entered a short-gamma environment; in such cases, dealers hedge their derivatives exposure by buying into strength and selling into weakness. This, alongside the presence of short-term traders in U.S. equities, will exacerbate volatility in the coming week.
  2. Looking to 2021, the decline in realized correlation due to factor and sector rotation, as well as the return of systematic option selling strategies should push the long-gamma narrative in which volatility is suppressed and the market pins or slowly rises in a range-bound fashion.
  3. JPMorgan Chase & Co. (NYSE: JPM) strategist Marko Kolanovic suggests equities will rally short-term with the S&P 500 auctioning as high as $4,000 on the basis of low rates, improved fundamentals, buybacks, as well as systematic and hedge fund strategies.
  4. Despite high CAPE ratios, stock-market valuations aren’t that absurd.
  5. Prior trade points to the non-presence of committed selling; after Friday’s session saw a failure to range extend and establish excess, the technical down-trend was broken.

Therefore, the following frameworks for next week’s trade apply.

In the best case, buyers surface at the $3,654.75 low-volume node and extend range up to the high-volume node at $3,667.75. High-volume areas denote value and should slow prices allowing participants enough time to enter and exit trades. An initiative drive through this area would portend a test of the $3,690.75 high-volume node, and then the prior all-time rally high.

In the worst case, if the S&P 500 auctions below $3,630.00, participants would look to repair the poor structure just shy of $3,625.00. Finding acceptance (i.e., spending more than one half-hour of regular trade) below Friday’s range would be the most negative outcome.

Conclusion: Though sentiment and positioning imply limited potential for further upside, the S&P 500’s higher-time frame breakout remains intact.

Pictured: Retest of the upside breakpoint on a daily candlestick chart of the cash S&P 500 Index

Levels Of Interest: $3,720.00 extension, $3,715.00 all-time rally high, the micro-composite HVNode at $3,690.75, $3,667.75, and $3,630.00, as well as the $3,654.75 LVNode and poor structure near $3,625.00.

Bonus: Here is a look at some of the opportunities unfolding.

Spotify Technology SA (NYSE: SPOT) – Acceptance after higher-time frame balance-breakout. Potential remains for a push to the balance-area projection.

Apple Inc (NASDAQ: AAPL) – Acceptance after higher-time frame balance-breakout. Potential scenarios include (1) continued rotation, (2) upside continuation, or (3) failed breakout and a return to balance.

Advanced Micro Devices Inc (NASDAQ: AMD) – Acceptance after higher-time frame balance-breakout. Potential for upside continuation or failed breakout and return to balance.

Shopify Inc (NYSE: SHOP) – Balance just shy of channel boundary. Potential for upside breakout and continuation.

Chipotle Mexican Grill Inc (NYSE: CMG) – Just shy of balance-area high. Potential for upside breakout and continuation.

Tesla Inc (NASDAQ: TSLA) – Rejected prior week’s balance-area. Likelihood of continuation up to S&P 500 index inclusion intact on surging call volumes, dealer accumulation. $700 strike is the high-OI strike of interest.

Zoom Video Communications Inc (NASDAQ: ZM) – Just shy of long-term trend, anchored VWAP. Potential for responsive buying.

Summit Materials Inc (NYSE: SUM) – Failed breakout, but speculative call volumes surfaced on the return into balance. Potential exists for another attempt higher.

Nasdaq-100 (INDEXNASDAQ: NDX) – Retest of balance-area high. Higher time-frame breakout remains intact.

Cover photo by SpaceX from Pexels.